Article

Characteristics of Energy Dissipation in T-Shaped Fractured Rocks under Different Loading Rates

1
Institute of Geotechnical Engineering, School of Civil Engineering and Architecture, Xi’an University of Technology, Xi’an 710048, China
2
Department of Mining Engineering, Shanxi Institute of Energy, Jinzhong 030600, China
3
Shaanxi Yisanyi Coalfield Geology Co., Ltd., Xi’an 715400, China
*
Author to whom correspondence should be addressed.
Sustainability 2023, 15(18), 13695; https://doi.org/10.3390/su151813695
Submission received: 8 July 2023 / Revised: 22 August 2023 / Accepted: 25 August 2023 / Published: 13 September 2023

Abstract

:
T-shaped fractured rocks in the engineering rock mass with different inclination angles, quantities, and cross patterns will cause slope landslides, cavern collapse, roof fall, and other disasters under the action of external forces. Deformation evolution of the T-shaped fractured rock is also significant for monitoring the stability of rock engineering structures. In this paper, the compression test of T-shaped fracture specimens was carried out under different loading rates. By modulating both the fracture inclination angle and the loading rate, the attributes pertaining to energy dissipation in the T-shaped fractured specimen were scrupulously scrutinized and subsequently expounded upon. The difference in the energy characteristics between fractured rock and intact rock was investigated to understand the deformation evolution of T-shaped fractured rock samples. The results show that when the fracture angle is 45° and 90°, the elastic strain energy and dissipated energy decrease as the secondary fracture angle increases. At the peak point, as the secondary fracture angle increases from 0°, the total absorbed energy, elastic strain energy, and dissipated energy of the T-shaped fractured rock increase, the ratio Ue/U of elastic strain energy to total energy increases, and the ratio Ud/U of dissipated energy to total energy decreases. The increase in loading rate leads to an increase in Ue/U and a decrease in Ud/U at the peak point of the T-shaped fractured rock specimen. The increase in loading rate leads to an increase in the total absorbed energy and elastic energy at the peak point of the T-shaped fractured rock, while the dissipated energy decreases. Investigative endeavors into the mechanics and energetic attributes of T-shaped fractured rocks bestow pragmatic and directive significance upon the safety assessment and stability prognostication of sundry geological undertakings.

1. Introduction

With the growth of the international economy, a fresh trajectory has emerged in the infrastructural development of nations. Deep-seated rock engineering endeavors, encompassing foundational excavations, hydraulic passageways, and nuclear waste management undertakings, have gained increasing significance. These rock mass projects are subject to extremely complex load conditions that involve not only the influence of static loads but also dynamic loads like explosions, earthquakes, and vibrations [1,2,3]. Compared to static loads, rock masses under dynamic loads undergo cumulative damage and fatigue degradation, leading to significant changes in their mechanical and energy evolution characteristics [4,5,6,7]. Understanding the mechanical characteristics and energy evolution of rock masses under cyclic loading is crucial for the rational design, safety, and stability of engineering projects [8]. Therefore, by conducting experimental research on the dynamic mechanics and energy characteristics of rocks under cyclic loading, we can further comprehend the rock failure mechanism and establish a foundation for scientific and reasonable design.
T-shaped fractures are fractures that exhibit a “T”-shaped cross-section, forming within materials such as rock or concrete. They hold paramount significance and latent hazards in rock engineering. These fractures possess the potential to influence land stability and ecosystems, giving rise to issues like rock collapses and fractures in concrete structures. Furthermore, they can lead to subterranean space leakage [9]. However, our exploration into the formation mechanisms of T-shaped fractures and the energy attributes during crack propagation remains insufficient. Therefore, investigating the energy dissipation characteristics of T-shaped fractures in rock has the potential to elevate the safety and reliability of rock engineering.
Some notable study results are found concerning the dynamic mechanical properties and energy characteristics of rock masses under cyclic loading [10,11]. Zhou et al. [12] utilized a material-based dynamic constitutive model to analyze and compare the stress–strain curve, strength, elastic modulus, damage, and other aspects, supporting the effectiveness of the proposed model. In a separate study, a damping ratio evolution model based on the principles of energy conservation was established to examine the energy and damping evolution laws of rocks under graded cyclic loading [13]. Similarly, the findings from Deng [14] showed that the elastic modulus, Poisson’s ratio, and irreversible strain of coal rock exhibited a three-stage trend of change. The impact of stress amplitudes on the dynamic mechanical behavior of artificial jointed rock specimens was verified [15]. The evolution characteristics of residual axial strain and damage under cyclic loading conditions were determined by the stress ratio, specifically the dynamic peak strength versus static triaxial compressive strength. The difference in the response of KIC to cyclic loading and static loading was observed, due to the formation of fractures under static or dynamic loading conditions [16]. A test method and a numerical method were conducted to comparatively study the evolution of fracture development status and specimen mechanical properties [17]. The elastic modulus of most specimens decreased with the number of cycles, and the fracture propagation rate increased with the increase in the number of cycles.
Several pieces of findings suggested the dynamic properties of rock are related to the energy. The unit volume energy and elastic energy increased linearly with the number of cycles, while dissipative energy increased nonlinearly [18]. Xiao et al. [19] observed that with the increase in the number of cycles, the unloading strength and Young’s modulus first increased and then decreased, leading to a gradually decreasing trend in the fracture damage stress, and peak unloading stress [20]. The stress amplitude was the key factor affecting the cyclic response of rocks. More local fractures could be observed in the process of granite specimen failure under cyclic loading [21]. The dynamic energy absorbed by the rocks was associated with frequency and amplitude [22]. The evolution process of elastic strain energy and dissipative energy is confirmed to establish a strength failure criterion [23,24]. Peckley et al. [25] found that the longer the loading time, the greater the accumulated residual strain, and suggested that this dependence on loading time is an inherent material characteristic that is independent of loading amplitude and water content. However, cyclic loading tests lasting over 300 to 9000 s (much longer than the period of earthquakes) could lead to an overestimation of residual strain in soft rock. Finally, Guo et al. [26] studied the mechanical and energy evolution characteristics of rocks under cyclic loading and unloading in single-axis tests. Their results indicated that the accumulated hysteresis energy increases exponentially with cycle duration, while the elastic modulus increases overall in a logarithmic form.
In summary, research on the energy evolution characteristics of fractured rock masses is relatively limited. There is little research on determining characteristic strength from the perspective of energy dissipation for T-shaped fractured rocks. Strength indicators are important in the progressive failure process of rocks, which are affected by factors such as mineral composition, loading conditions, and structural geology [27,28]. Currently, the main methods for determining rock characteristic strength are the fracture volume strain method, acoustic emission method, and moving point regression method, with existing limitations of experimental operations [29].
This paper studies the mechanical and energy characteristics of the T-shaped fractured rock mass under a cyclic loading condition. The compression test of T-shaped fracture specimens was carried out under different loading rates. The characteristics of energy dissipation of T-shaped fracture specimens are analyzed by changing the fracture inclination angle and loading rate. It is helpful to reveal the failure mechanism of fractured rock mass and lay a foundation for rock engineering construction and design.

2. Methods

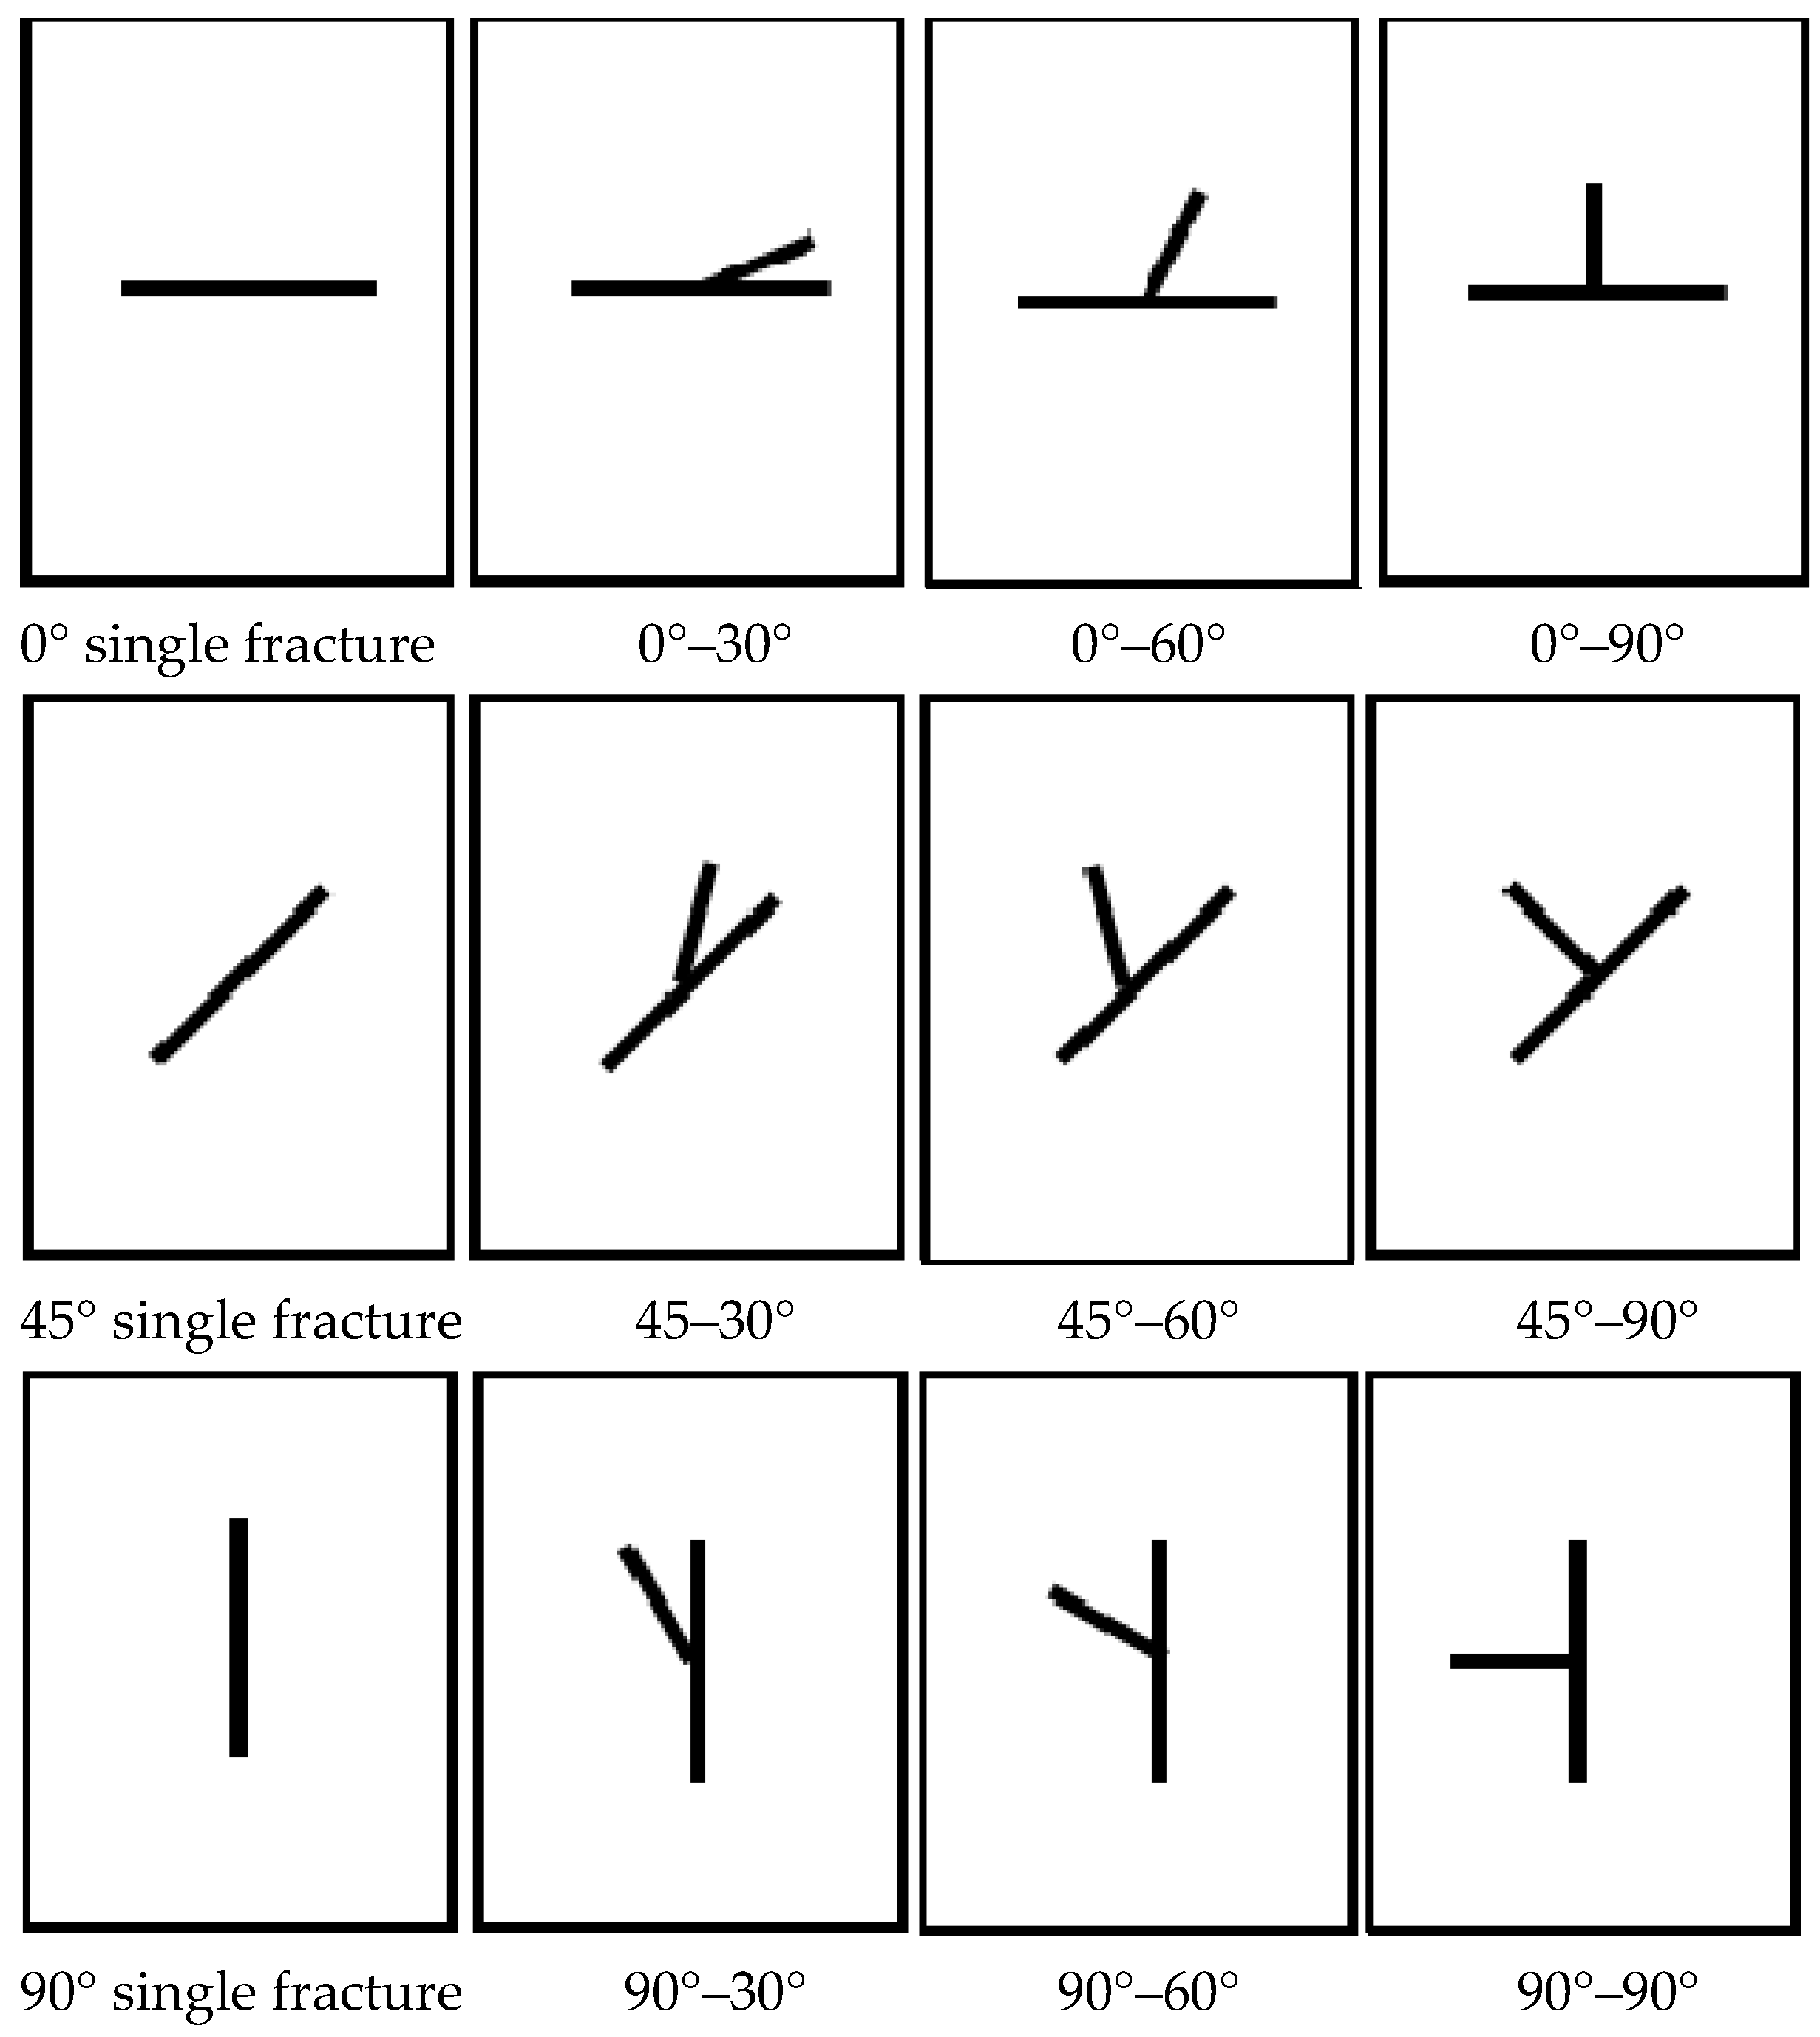
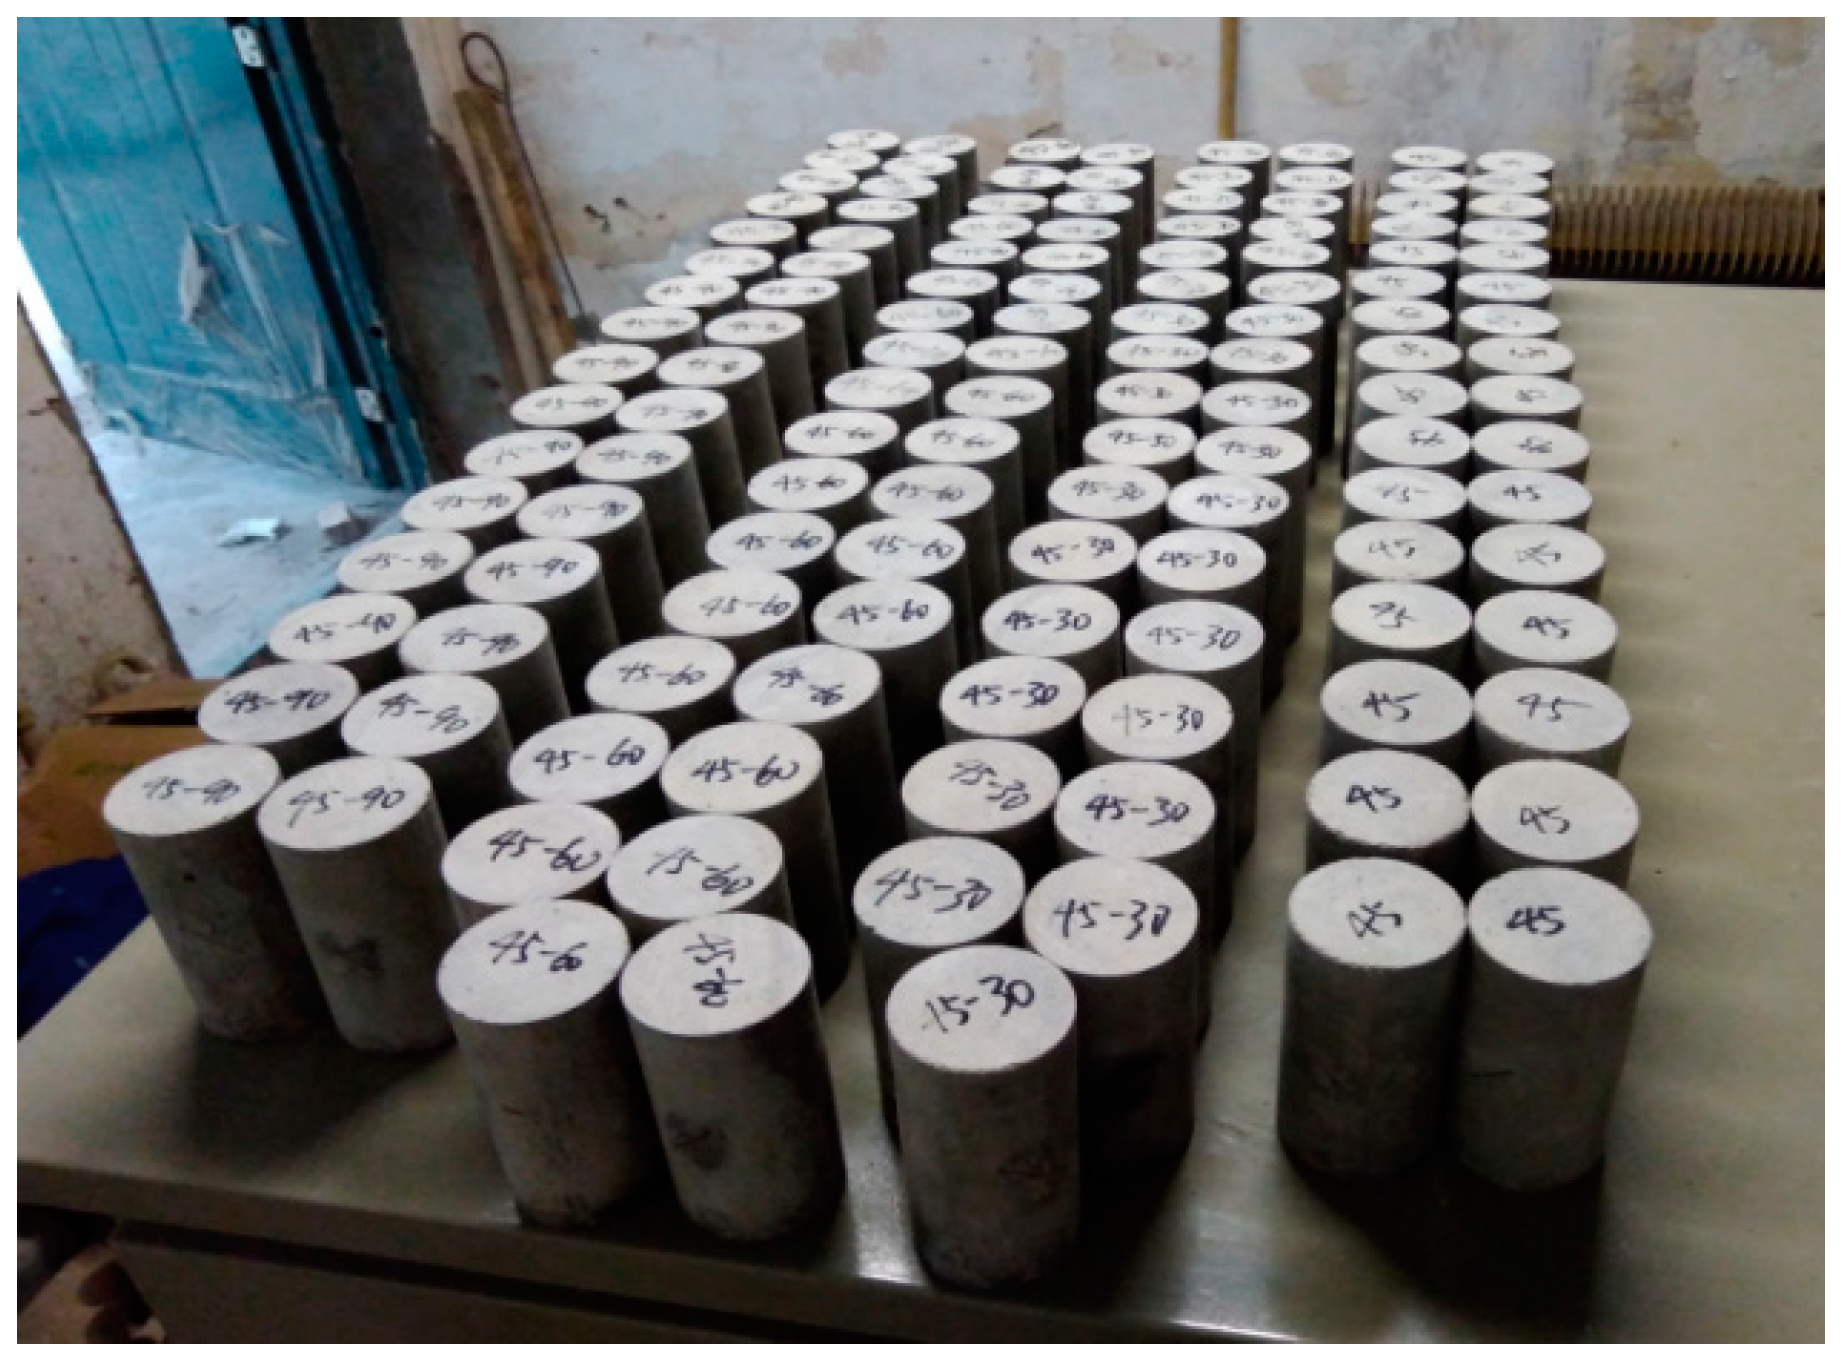
2.1. Sample Preparation

The rock materials in this test are composed of water, cement, and sand, respectively. The water used is distilled water produced in the laboratory, and the sand is the river sand of the Chan River in Xi’an City, Shaanxi Province. Because the natural river sand has complex components and more impurities and contains mud, salt, and corrosive ions, this will affect rock-like materials. The mechanical and physical properties have a great influence, so the river sand is washed many times before use to eliminate mud, salt, and corrosive ions, and it can be officially used after drying and screening. The cement is ordinary Portland cement with a strength grade of 42.5. After multiple tests, it was found that when the mix ratio is cement:sand:water = 1:2:0.45, the mechanical and physical properties of similar materials and simulated rock fine sandstone are the most similar.
The experimental pouring mold utilized in this study is an organic glass mold that measures 50 mm in diameter, 100 mm in height, and 3 mm in wall thickness. The mold comprises a base, side walls, two sets of rings, and two pairs of nuts. The side walls of the glass mold possess reserved fractures and perforations for the insertion of copper sheets during pouring. Following initial solidification, the copper sheets are removed to create prefabricated fractures. The fractures are classified into two types: single fractures (main fractures) and double fractures. The double fractures observed in this study are mainly cross-shaped fractures, consisting of a main fracture and a secondary fracture. The thickness of the fracture is 0.3 mm, with the main fracture measuring 20 mm in length and the secondary fracture measuring 10 mm in length. The inclination angle of the main fracture, which is either 0°, 45°, or 90°, is the angle between the main fracture and the horizontal plane. The angle between the secondary fracture and the main fracture is the secondary fracture angle, which is either 0°, 30°, 60°, or 90°. In this study, we also consider a special single fracture where the secondary fracture coincides with the main fracture. The specific distribution of the fractures for T-shaped fractured rocks (TSF) is presented in Figure 1.
The sample preparation process involves several steps. Firstly, the mold model is determined, and oil is applied to the inner wall and bottom of the mold, avoiding the anti-adhesion. Next, a predetermined amount of cement and sand is added to the mixer (the water–cement–sand ratio is 1:2:6), followed by the addition of water while stirring for three to five minutes. The mixture is then poured into the mold after 2 min of mixing. The mold, along with the rock-like material, is placed on a vibrating table and vibrated until there are no air bubbles in the side walls and top of the sample. A copper plate soaked in oil is inserted into the reserved slot along the mold, and after 2 h, the copper plate is removed, and the sample is left in a standard testing environment for 1 day. The mold is then removed, and the specimen is placed in a standard curing box for 14 days of curing. After the curing time is over, the specimen is removed, and the requirements suggested by the ISRM are strictly followed. The ends of the specimen are ground using a double-sided grinding machine to ensure that the deviation of the two ends is less than 0.05 mm. Additionally, the diameter error in the height direction of the rock-like sample is less than 0.3 mm, and the angle between the end face of the specimen and the axis is less than 0.25°.
Finally, the appearance of the samples is visually inspected, and tools such as vernier calipers and electronic scales are used to eliminate samples with significant deviations in diameter, height, and weight, as well as any significant appearance defects, to prevent any interference with the test results due to sample defects. The final qualified sample is depicted in Figure 2; we used a total of 131 samples in this experiment.

2.2. Experimental Instrumentation

The experiments were primarily conducted using the Multifunctional Material Testing Machine located at the Rock and Soil Mechanics Institute of Xi’an University of Technology. The Multifunctional Material Testing Machine’s testing system primarily comprises four components: the loading system, measuring system, power system, and control system. The machine can exert a maximum axial force of 1500 kN, confining pressure of 80 MPa, frequency of 10 Hz, and shear force of 100 kN. The testing specimen sizes can be ϕ 50 mm × 100 mm, 100 mm × 200 mm, ϕ 100 mm × 100 mm × 200 mm, and 150 mm × 150 mm × 150 mm. It can conduct uniaxial compression tests under complex stress conditions, conventional triaxial tests (σ2 = σ3), shear tests, fatigue tests, and rheological tests, making it an ideal instrument for studying the mechanical properties of rocks.

2.3. Experimental Plan

The main objective of this study is to investigate the mechanical and energetic properties of T-shaped fractures subjected to static and dynamic loading at different loading rates and their influence on the failure mode. The focus is to study the variation of the dip angle of the main fracture and the angle of the secondary fracture. The experiment considered inclination angles of 0° and 45° for the primary fracture and angles of 0°, 30°, 60°, and 90° for the secondary fracture. Two types of tests were conducted, namely uniaxial compression tests and uniaxial stepwise loading and unloading compression tests. To obtain a more comprehensive understanding of the deformation process of the specimens, displacement control was employed throughout the experiments. The specific experimental scheme is shown in Table 1.

3. Energy Evolution Characteristic Calculation Method

From an energy perspective, the material’s deformation behavior manifests externally as the conversion of its internal energy. Whether it is the elastic-plastic deformation or the deformation behavior of fractures, both processes entail energy exchange with the external environment: conserving energy input from the surroundings and subsequently releasing energy in various forms, thereby upholding the principle of overall energy conservation. Consequently, it can be affirmed that material deformation is prompted by the dissipation and release of energy. Energy dissipation is a unidirectional and irreversible process, constituting the fundamental cause for the degradation of mechanical characteristics due to the micro-damage within the specimen. This reflects the extent of deterioration in its macroscopic strength. The release of energy is bidirectionally reversible under certain conditions. Assuming that the deformation and failure process of rocks under loading is a process without heat loss, the total energy can be calculated based on the first law of thermodynamics as follows:
U = U e + U d
where U is the total energy, with units of kJ/m3; Ue is the elastic strain energy, with units of kJ/m3; and Ud is the dissipated energy, with units of kJ/m3.
In the process of rock deformation, elastic strain energy is typically stored as elastic strain, while dissipated energy contributes to plastic deformation and the propagation of fractures within the specimen. Figure 3 depicts the relationship between elastic and dissipated energy in rocks subject to uniaxial compression conditions. The blue region represents the elastic strain energy at the peak point. The portion sandwiched between the blue portion and the stress–strain curve is the dissipated energy. Under triaxial stress conditions, each type of energy can be calculated as follows:
U = 0 ε 1 σ 1 d ε 1 + 0 ε 2 σ 2 d ε 2 + 0 ε 3 σ 3 d ε 3
The elastic energy is calculated as
U e = 1 2 σ 1 ε e 1 + 1 2 σ 2 ε e 2 + 1 2 σ 3 ε e 3
The dissipated energy is the difference between total energy and elastic energy:
U d = U U e
The elastic strain is calculated as
ε i e = σ i μ i σ j + σ k / E i
where σ1, σ2, σ2—the three principal stresses, in MPa. ε1, ε2, ε3—the corresponding strains produced under the action of the three principal stresses, in %. ε1e, ε2e, ε3e—the corresponding elastic strains produced under the action of the three principal stresses, in %. When only the axial force acts, that is σ2 = σ3 = 0, from (2) to (5), the following can be obtained:
U = 0 ε 1 σ 1 d ε 1
U e = σ 1 2 2 E
where σ1 and ε1 represent axial stress and strain, respectively. Equations (4), (6) and (7) can be utilized to compute the distribution of the different energies associated with the rock deformation and failure process. The deformation and failure process of the cruciform notch specimen involves a multifaceted energy conversion process. To analyze the evolution of energy during this process, the energy dissipation coefficient is introduced λ. This coefficient is defined as the ratio of dissipated energy to elastic energy at any given time during the deformation process of the cruciform notch specimen:
λ = U d U e

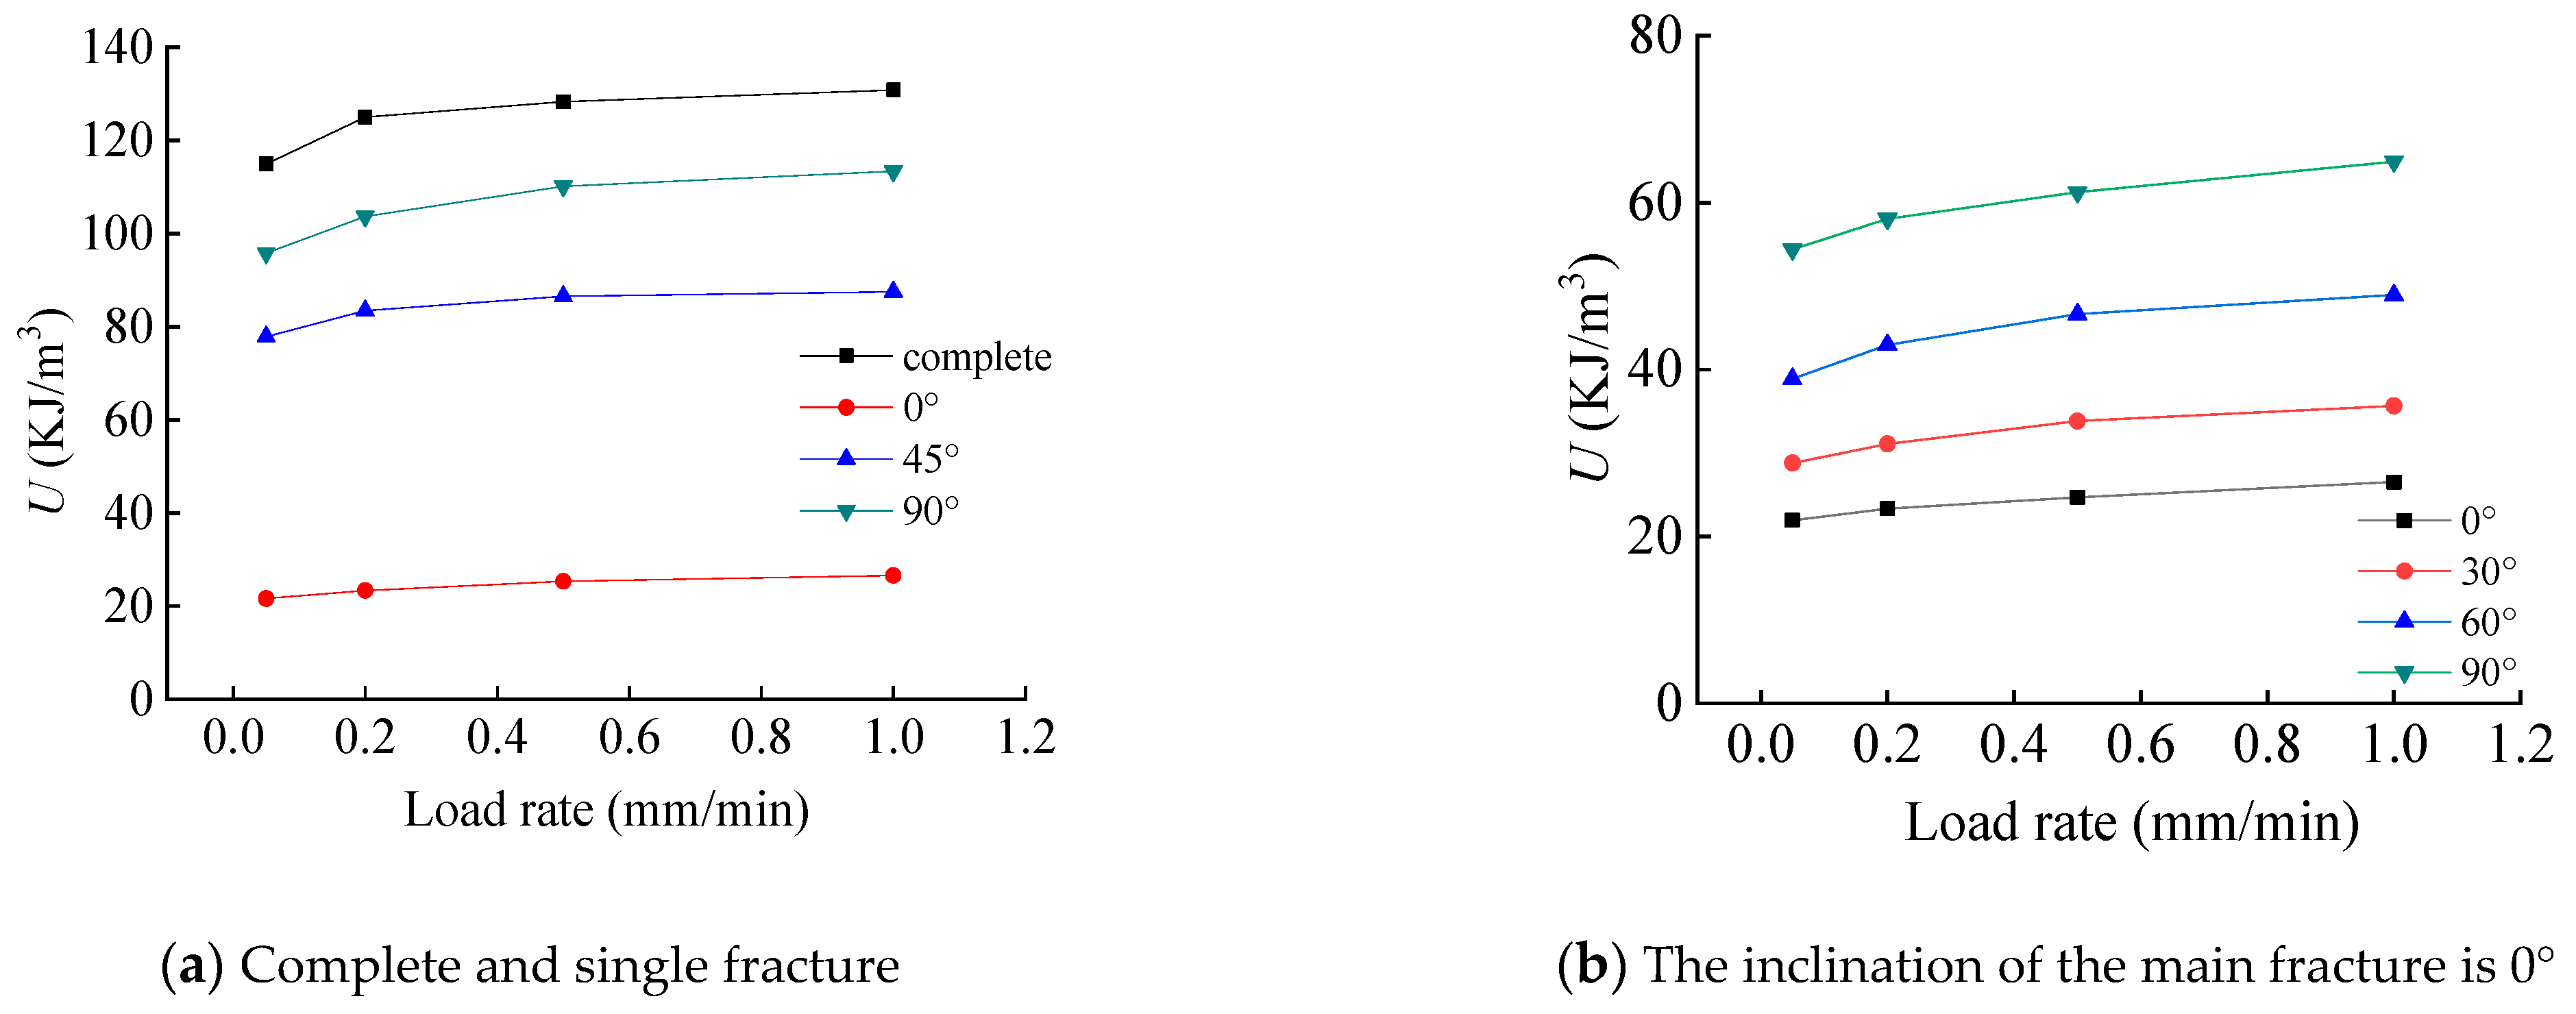
4. Analysis of Energy Evolution Characteristics at Peak Points

4.1. Analysis of Energy Characteristics of Cruciform Fracture Specimens

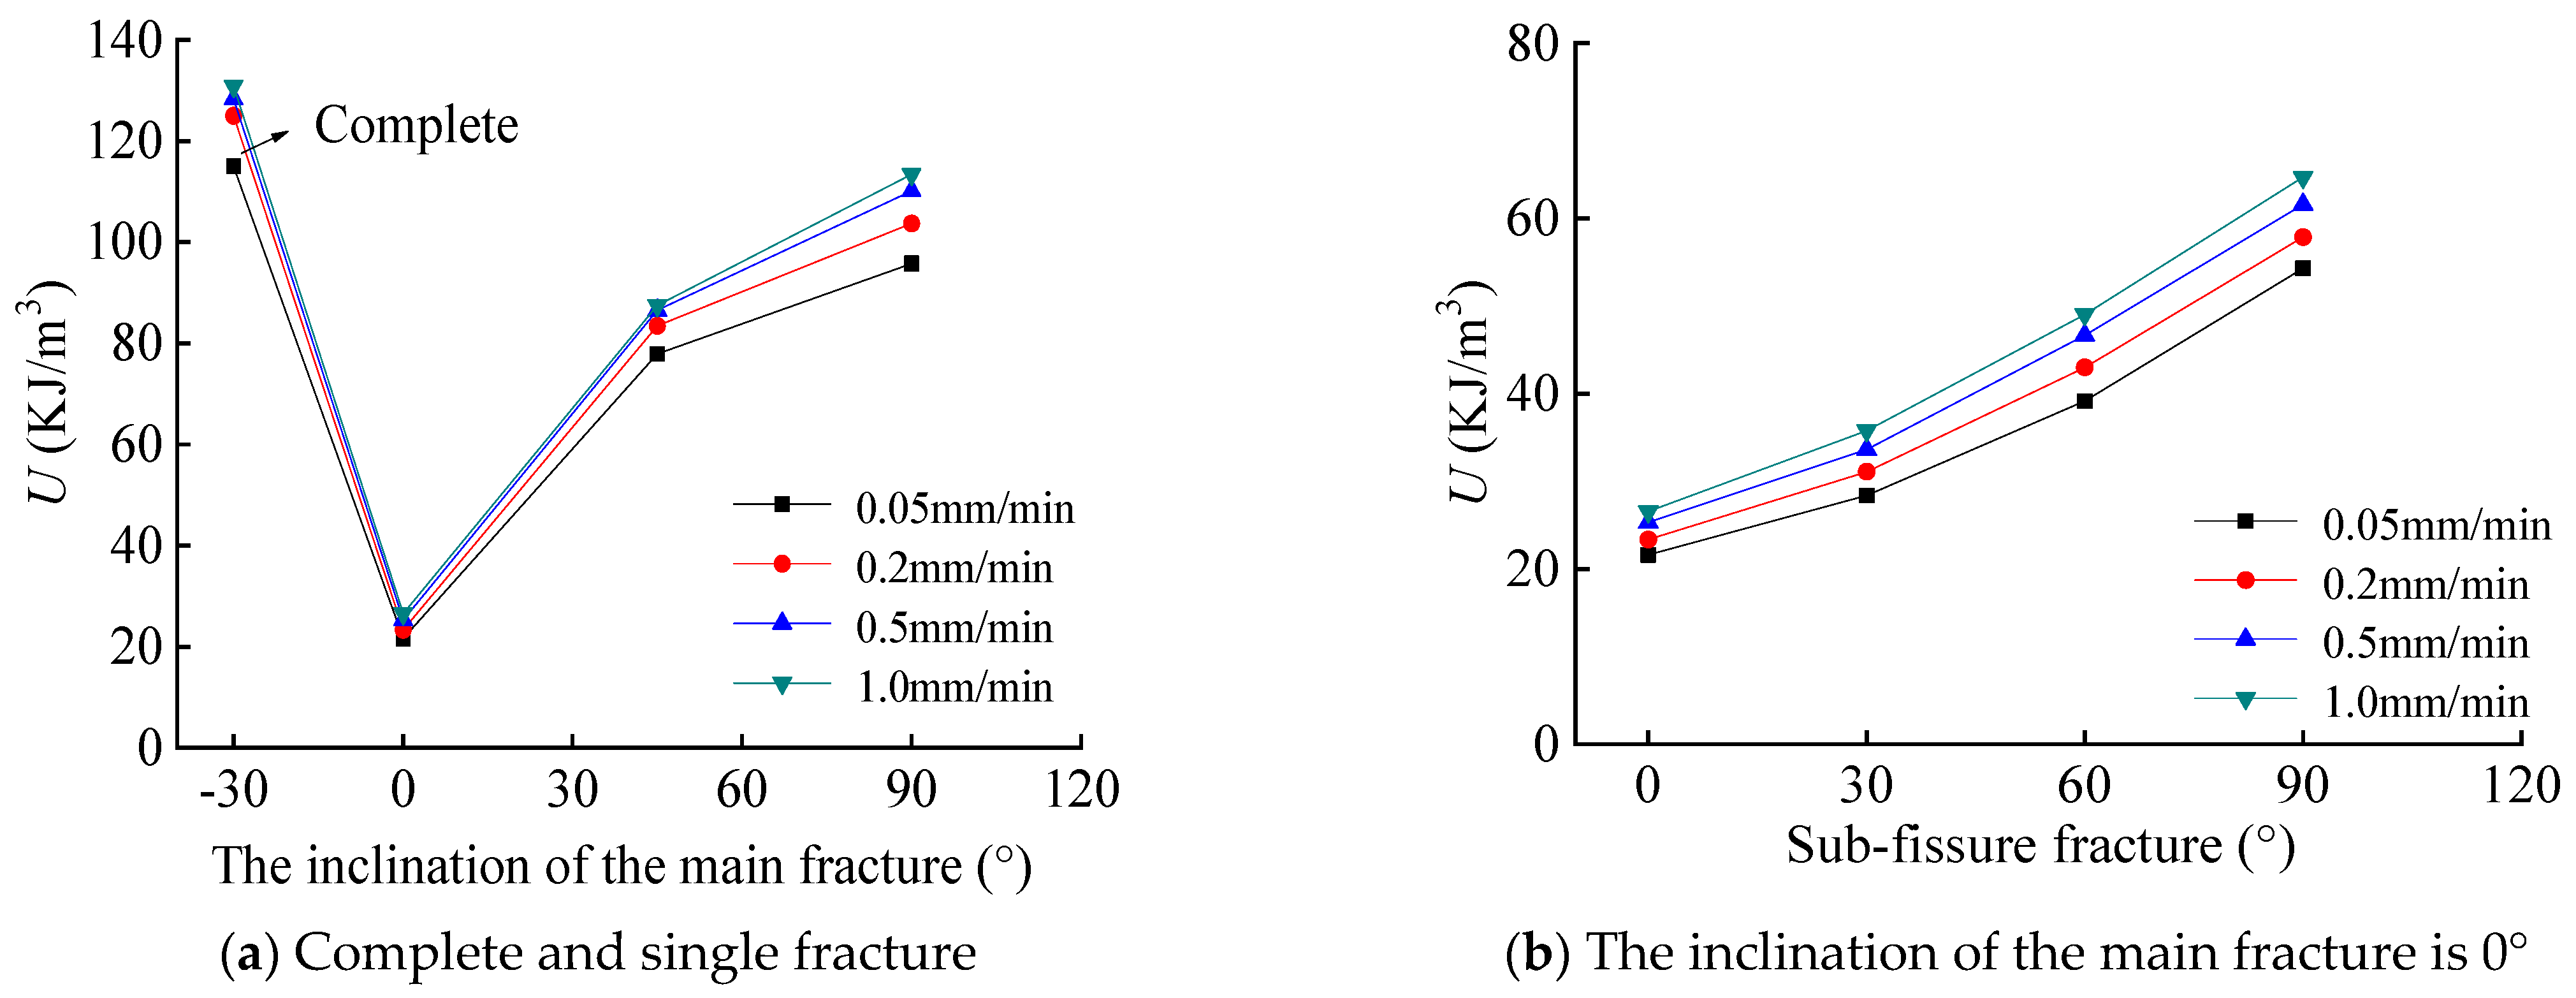
4.1.1. Influence of Fracture Dip Angle

As illustrated in Figure 4a, at a constant loading rate, the total energy of single-fracture rock specimens is lower than that of intact specimens, with a greater reduction observed for fractures with lower dip angles. For instance, at a loading rate of 0.5 mm/min, the total energy at the peak point of the intact specimen is 121.34 kJ/m3, while that of the sample with a fracture dip angle of 0° is 25.32 kJ/m3, representing a reduction of 79.1%. The total energy at the peak point of the sample with a fracture dip angle of 45° is 86.55 kJ/m3, a reduction of 28.7%. Similarly, for the sample with a fracture dip angle of 90°, the total energy at the peak point is 110.17 kJ/m3, reduced by 9.2%. The presence of fractures creates small-scale structural planes, leading to local stress concentration and failure when the strength of the sample is not yet at the peak strength of intact rock. In contrast, intact specimens undergo overall yielding and failure under loading, thereby absorbing more total energy at the peak point than fractured specimens. Figure 4b shows that when the fracture dip angle is 0°, the total energy absorbed at the peak point of the cruciform fracture rock specimen increases with an increasing sub-fracture angle. At a loading rate of 0.2 mm/min, the total energy increases by 33.1%, 84.1%, and 147.7% when the sub-fracture angle increases from 0° to 30°, 60°, and 90°, respectively. In contrast, Figure 4c,d reveal that when the fracture dip angle is 45°and 90°, the total energy absorbed at the peak point of the cruciform fracture rock specimen decreases with an increasing sub-fracture angle. At a loading rate of 0.05 mm/min, for the main fracture with a dip angle of 45°, the total energy decreases by 25.7%, 41.3%, and 52.0% when the sub-fracture angle increases from 0° to 30°, 60°, and 90°, respectively.

4.1.2. Impact of Loading Rate

In Figure 5, the curves of the total energy at the peak point of the intact and cruciform notch specimens are plotted against the loading rate. It is evident that as the loading rate increases, the total energy at the peak point of both specimens also increases. The growth rate is highest between 0.05 mm/min and 0.2 mm/min and slows down to a stable rate between 0.5 mm/min and 1.0 mm/min. For the intact specimen, at a loading rate of 0.05 mm/min, the total energy at the peak point is 106.95 kJ/m3, and at 0.2 mm/min, it increases by 11% to 118.67 kJ/m3. Further increasing the loading rate to 0.5 mm/min results in a 13.4% increase in the total energy to 121.34 kJ/m3, and at 1.0 mm/min, the total energy reaches 123.84 kJ/m3, an increase of 15.8%. When the main fracture angle is 45° and the sub-fracture angle is 30°, the total energy at the peak point of the specimen increases by 8.5%, 11.3%, and 13.3%, respectively, when the loading rate is increased from 0.05 mm/min to 0.2 mm/min, 0.5 mm/min, and 1.0 mm/min. This can be attributed to the increase in the specimen’s bearing capacity as the loading rate increases, requiring more energy to be absorbed from the external environment when the specimen is destroyed.

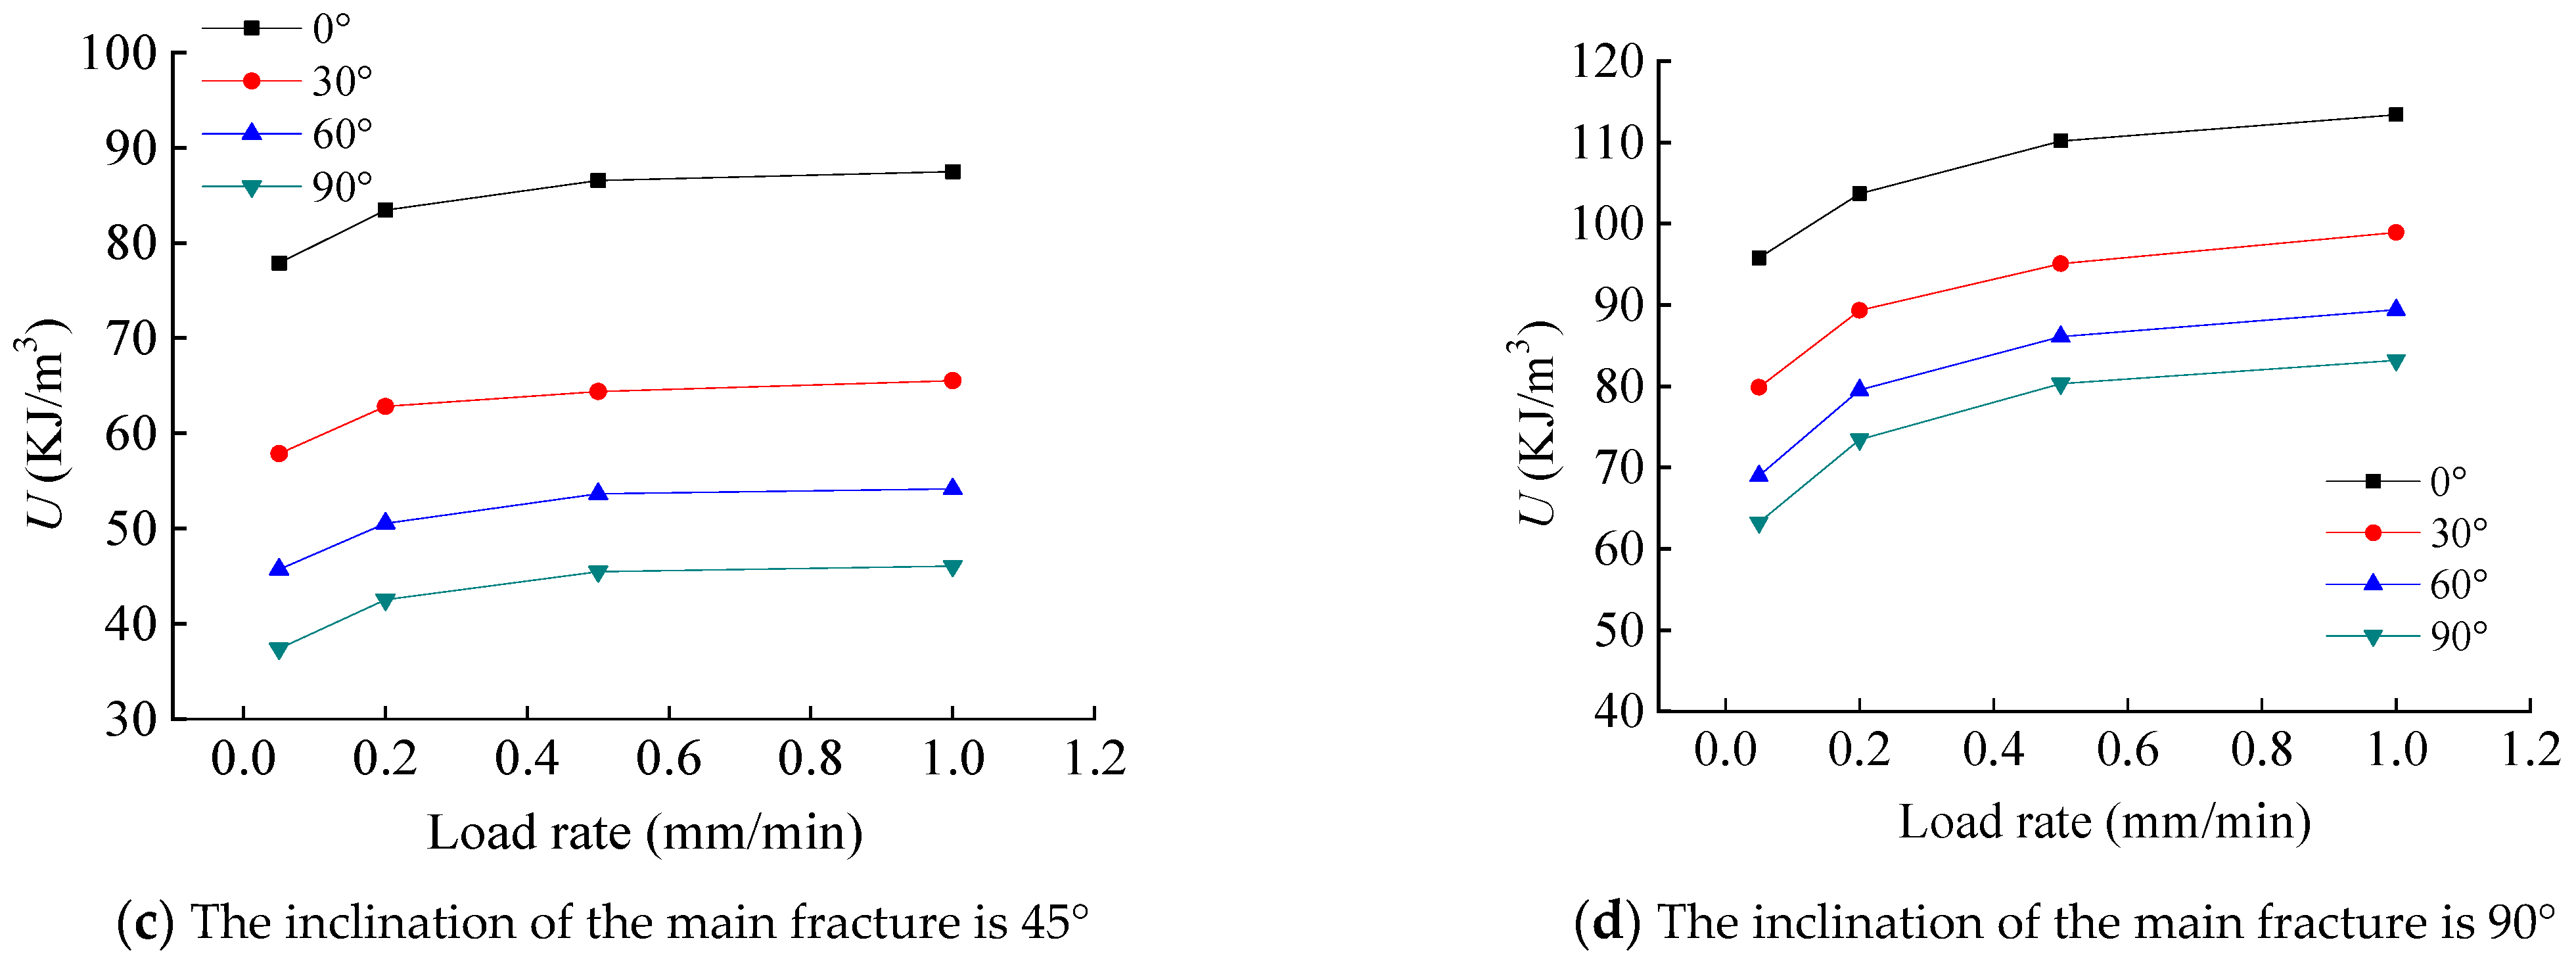
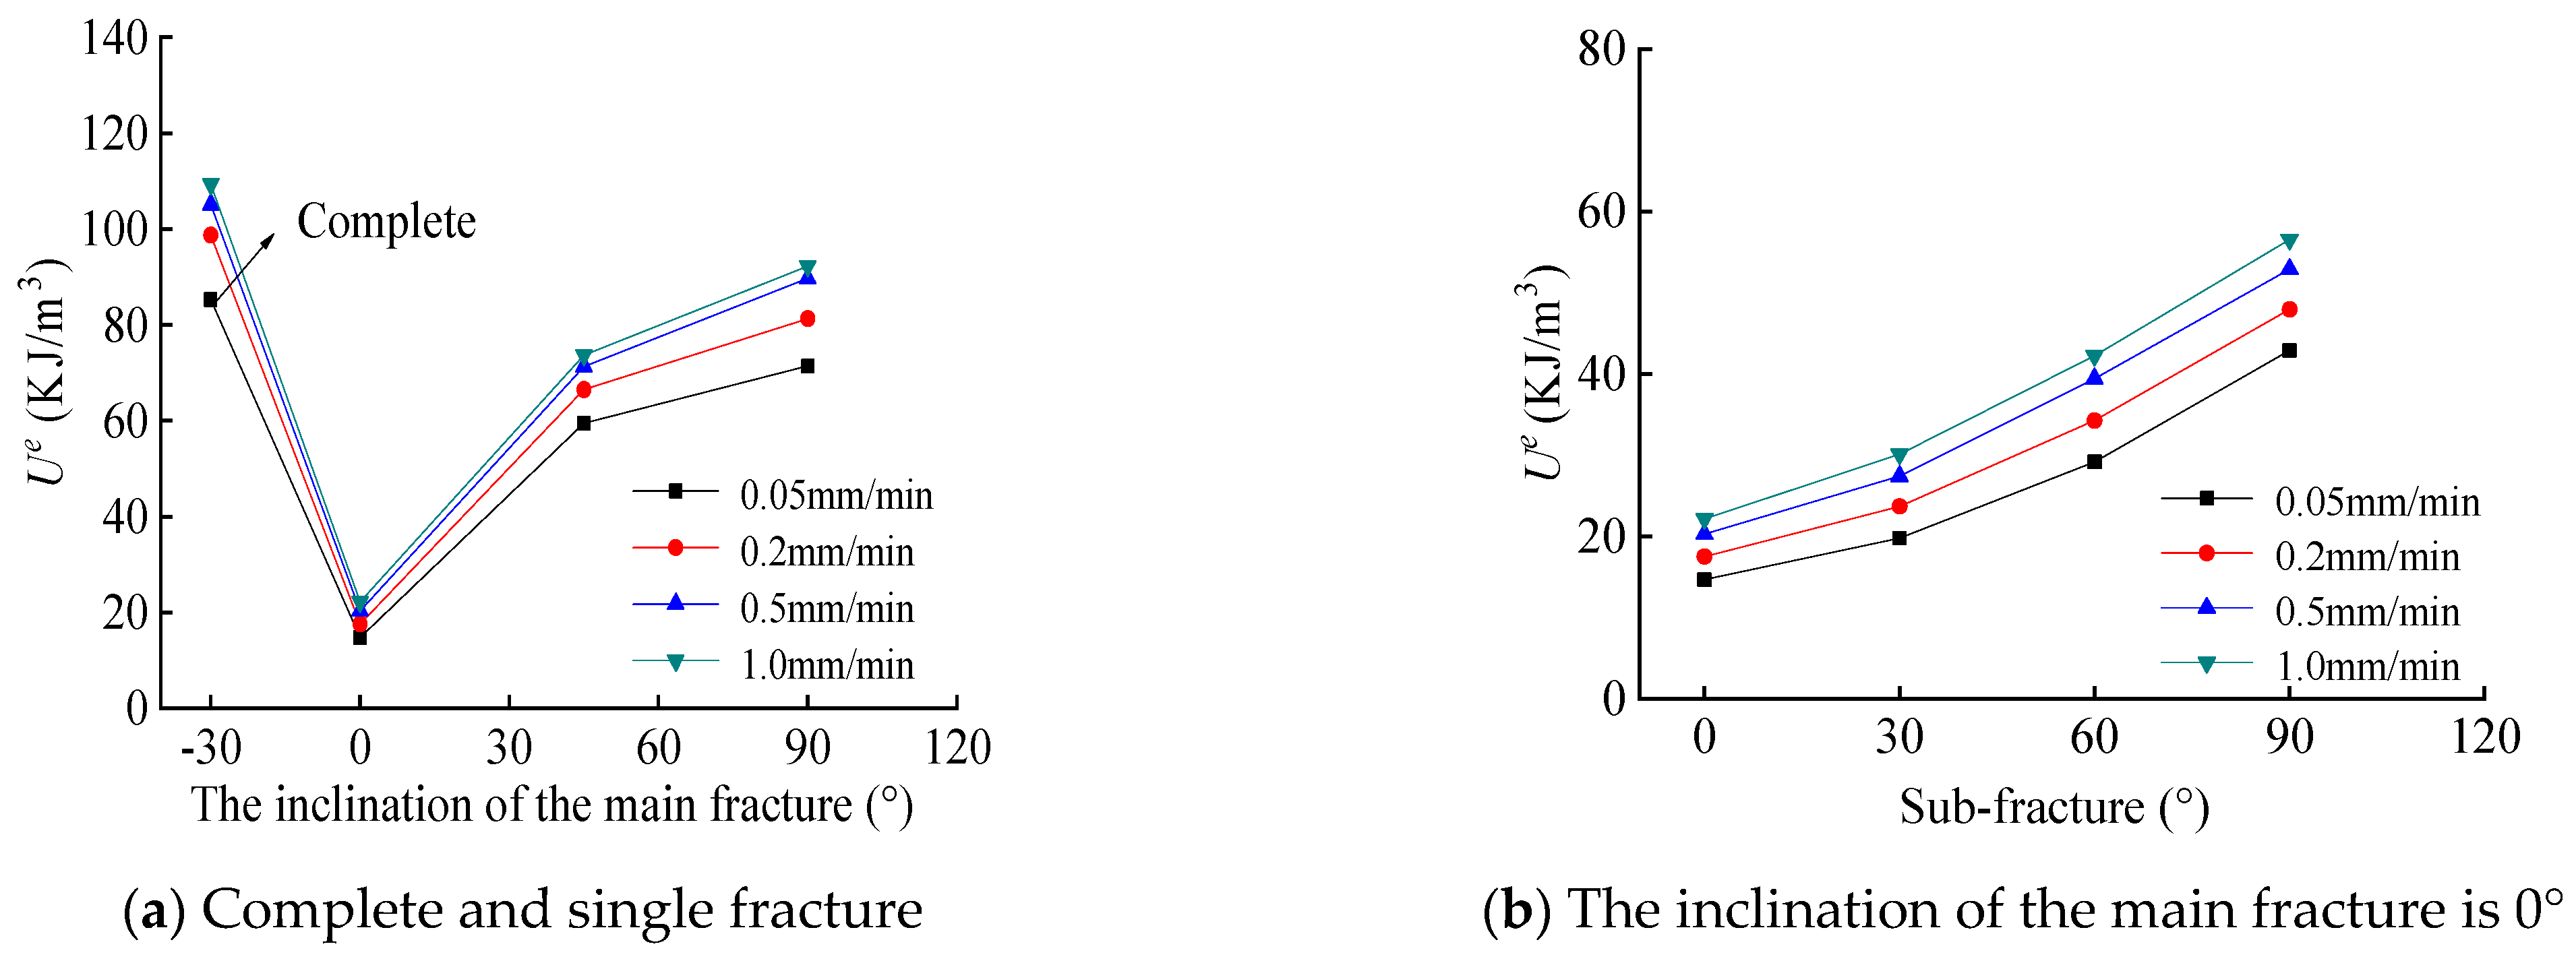
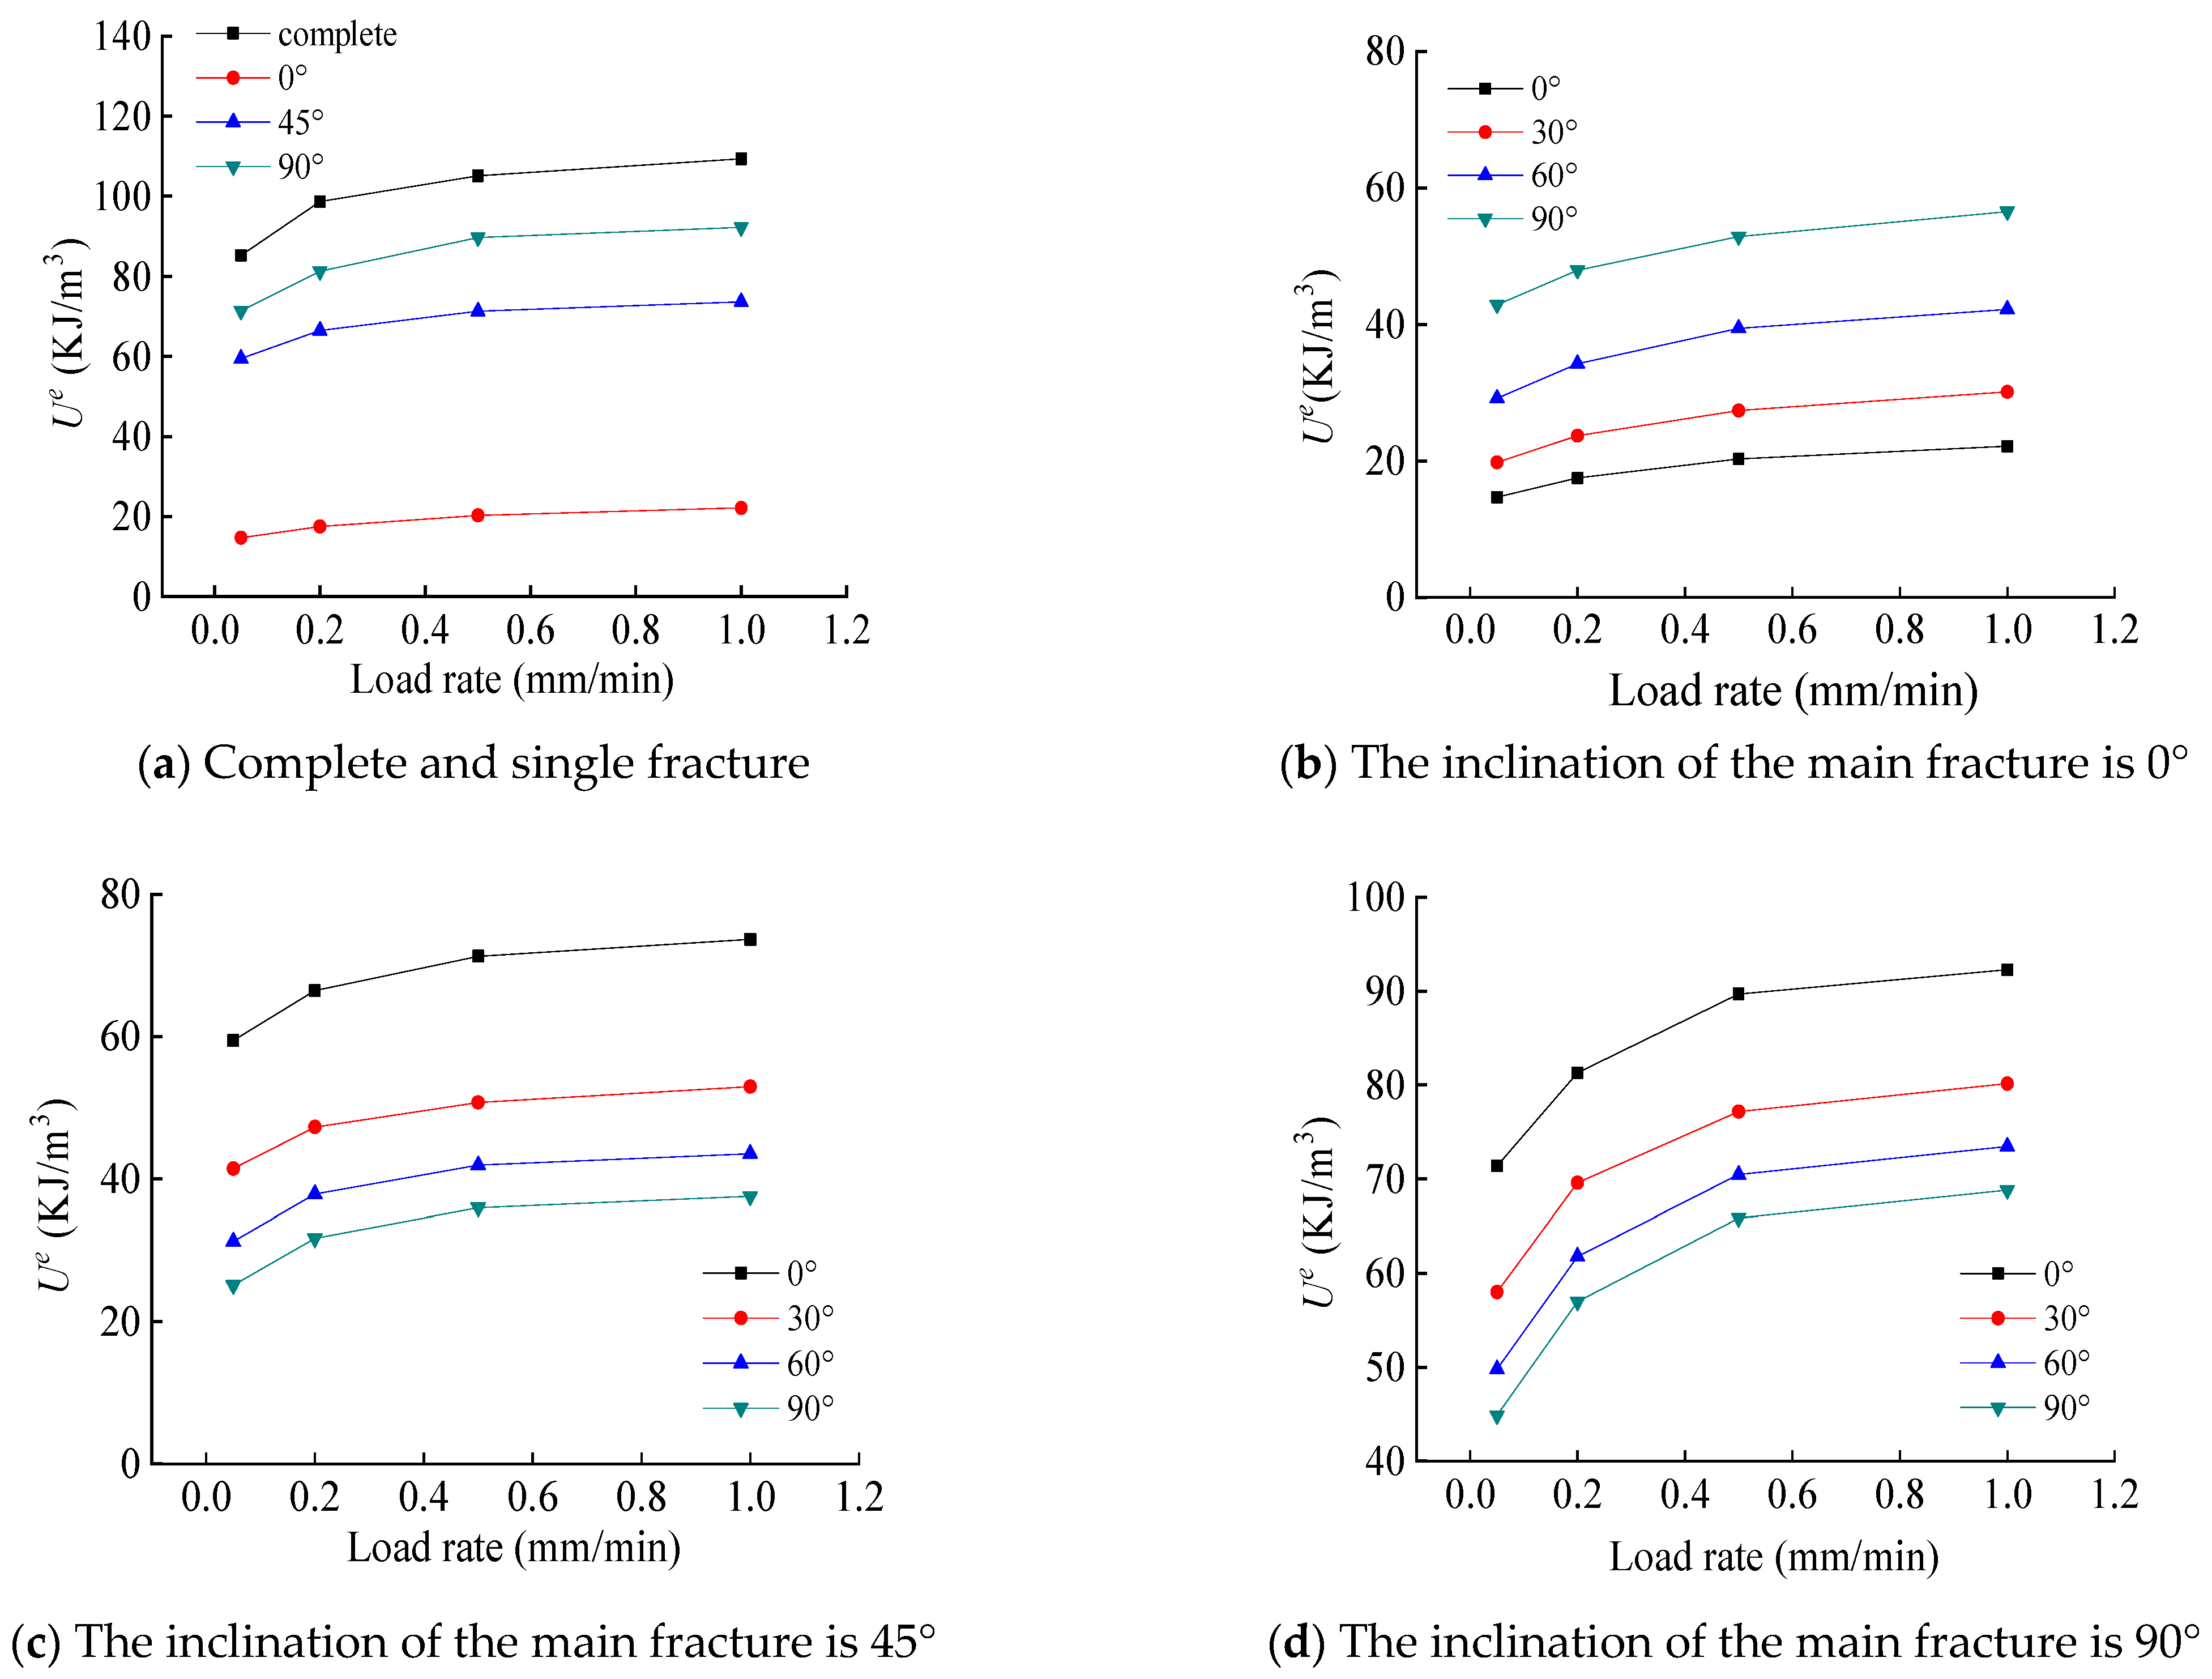
4.2. Analysis of Elastic Property Characteristics of the T-Shaped Fracture Specimen

4.2.1. Effect of Fracture

Figure 6 depicts the elastic energy curves at the peak point of the T-shaped fracture specimen for various fracture angles. As shown in Figure 6a, the elastic energy at the peak point of the T-shaped fracture specimen is lower than that of the intact specimen to varying degrees, indicating that the existence of fractures weakens the energy storage characteristics of the specimen. Specifically, when the loading rate is 0.2 mm/min, the elastic energy at the peak point of the fracture specimens with the main fracture angles of 0°, 45°, and 90° decreased by 82.2%, 76.0%, and 65.3%, respectively. Moreover, it was found that as the main fracture angle increases, the elastic energy at the peak point also increases, which is consistent with the changes in mechanical properties. In Figure 6b, when the loading rate is constant, the elastic energy at the peak point of the T-shaped fracture specimen increases as the angle between the secondary fractures and the main fracture increases when the main fracture angle is 0°. For instance, when the loading rate is 0.05 mm/min, the elastic energy at the peak point increases from 14.69 kJ/m3 to 42.89 kJ/m3 as the fracture angle increases from 0° to 90°, indicating that the presence of secondary fractures enhances the elastic energy storage characteristics of the T-shaped fracture specimen with a main fracture angle of 0°.
However, when the main fracture angle is 45° and 90°, the elastic energy at the peak point of the T-shaped fracture specimen decreases as the angle between the secondary fractures and the main fracture increases, as shown in Figure 6c,d. Specifically, when the loading rate is 0.2 mm/min and the main fracture angle is 45°, the elastic energy at the peak point decreases from 66.48 kJ/m3 to 29.89 kJ/m3 as the fracture angle increases from 0° to 90°; when the main fracture angle is 90°, the elastic energy at the peak point decreases from 84.32 kJ/m3 to 56.69 kJ/m3 as the fracture angle increases from 0° to 90°. This suggests that the presence of secondary fractures in the T-shaped fracture specimen with main fracture angles of 45° and 90° weakens the elastic energy storage characteristics of the specimen.

4.2.2. Effect of Loading Rate

Figure 7 depicts the relationship between the loading rate and elastic energy at the peak point of the notch specimen. The graph reveals that as the loading rate increases, so does the elastic energy at the peak point of both the intact and notched specimens. Specifically, for the intact specimen, the elastic energy at the peak point is 85.28 kJ/m3 at a loading rate of 0.05 mm/min and increases to 98.7 kJ/m3 at 0.2 mm/min, a 15.7% increase. At 0.5 mm/min, the elastic energy reaches 105.13 kJ/m3, a 23.3% increase, and at 1.0 mm/min, it further increases to 109.36 kJ/m3, a 28.2% increase. Furthermore, when the inclination angle of the main fracture is 45° and the included angle of the secondary fracture is 60°, the elastic energy at the peak point of the specimen increases by 19.8%, 32.5%, and 37.2% as the loading rate is increased from 0.05 mm/min to 0.2 mm/min, 0.5 mm/min, and 1.0 mm/min, respectively. When the inclination angle of the main fracture is 90° and the included angle of the secondary fracture is 30°, the elastic energy at the peak point of the specimen increases from 59.51 kJ/m3 to 82.86 kJ/m3 as the loading rate is increased from 0.05 mm/min to 1.0 mm/min. The increase in elastic energy can be explained by the fact that the fractures inside the specimen are not fully extended at higher loading rates, and therefore, the damage inside the specimen is reduced, and the rock stiffness is increased. This eventually leads to an increase in the elastic energy at the peak.

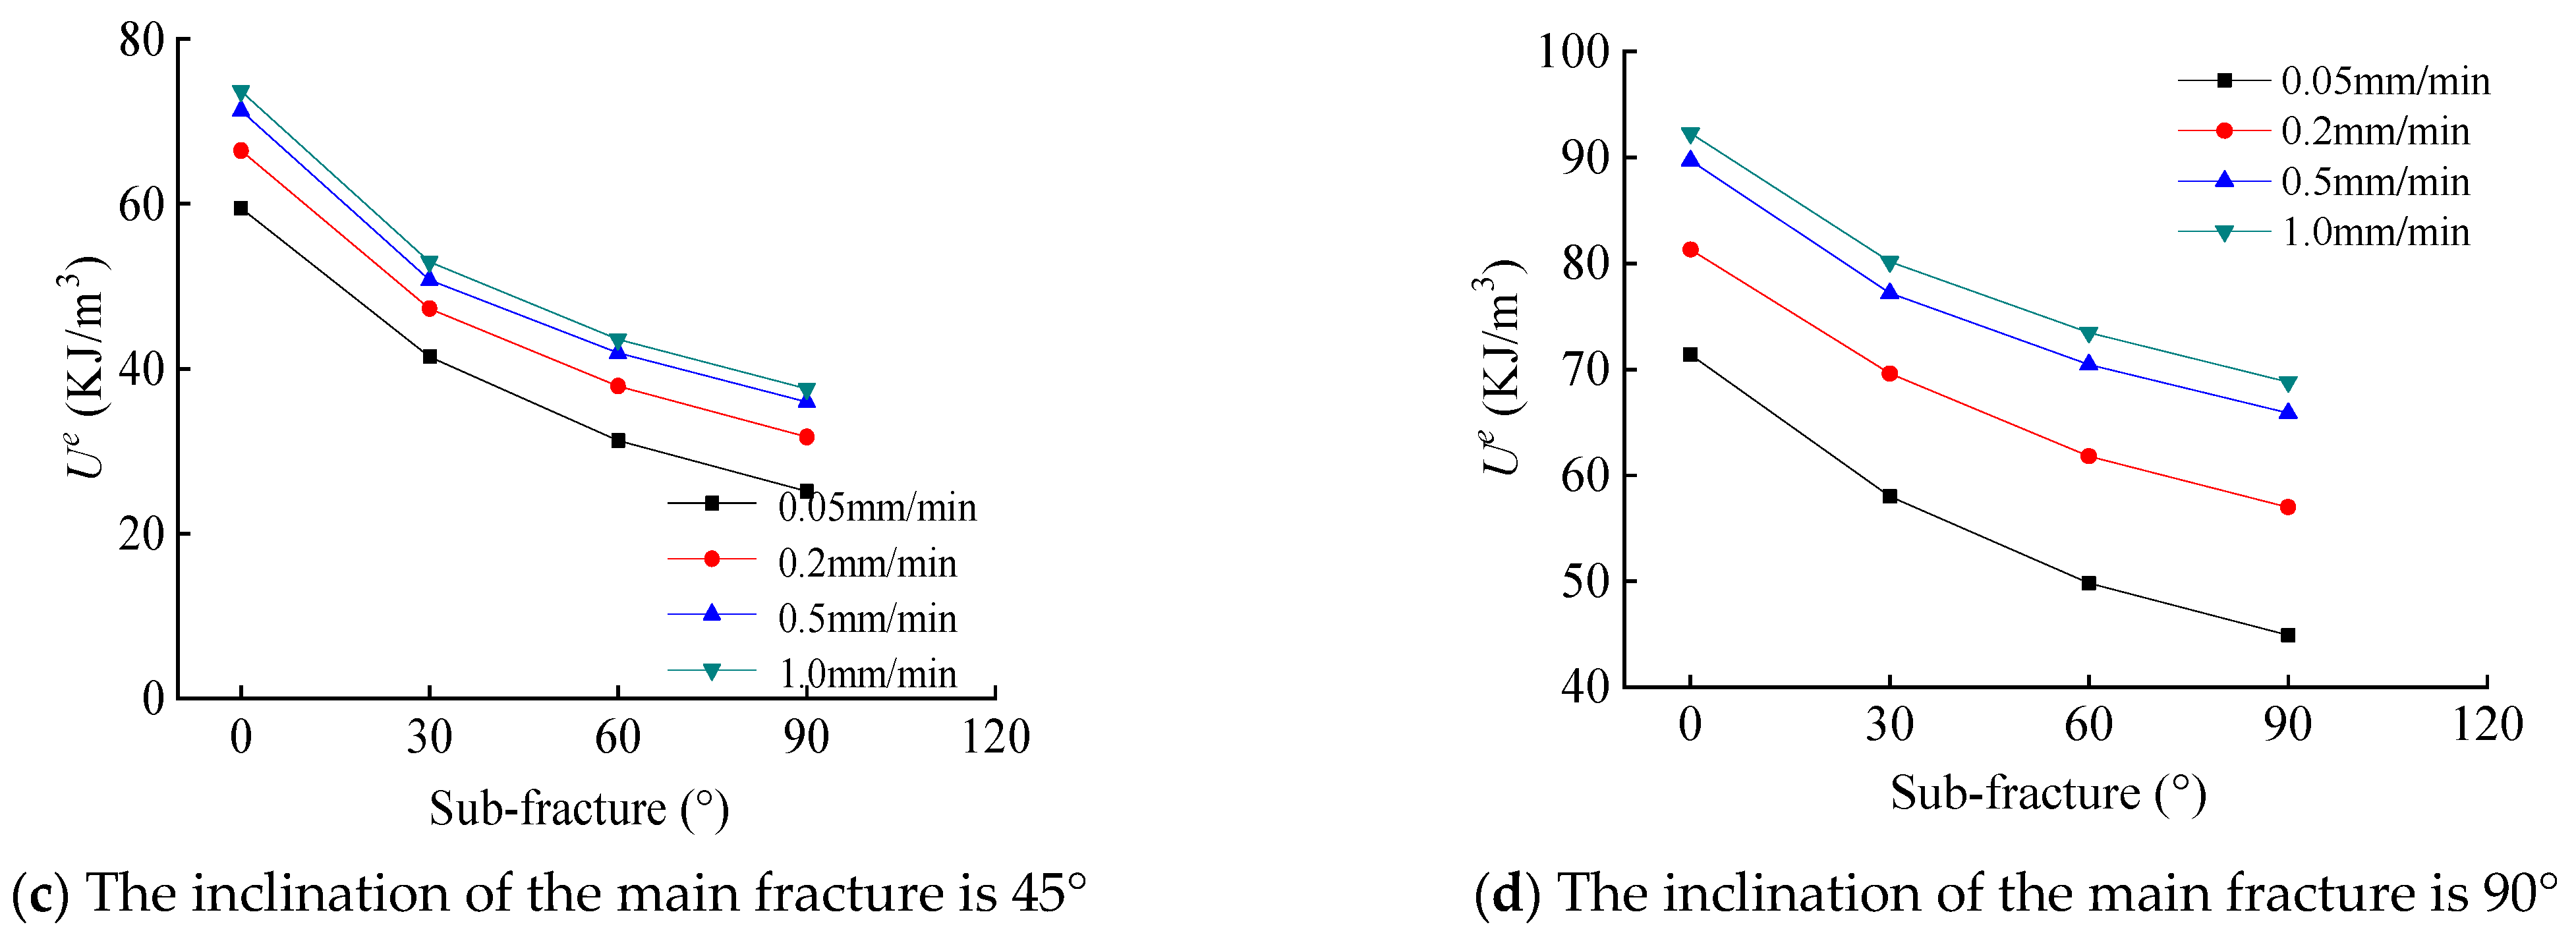
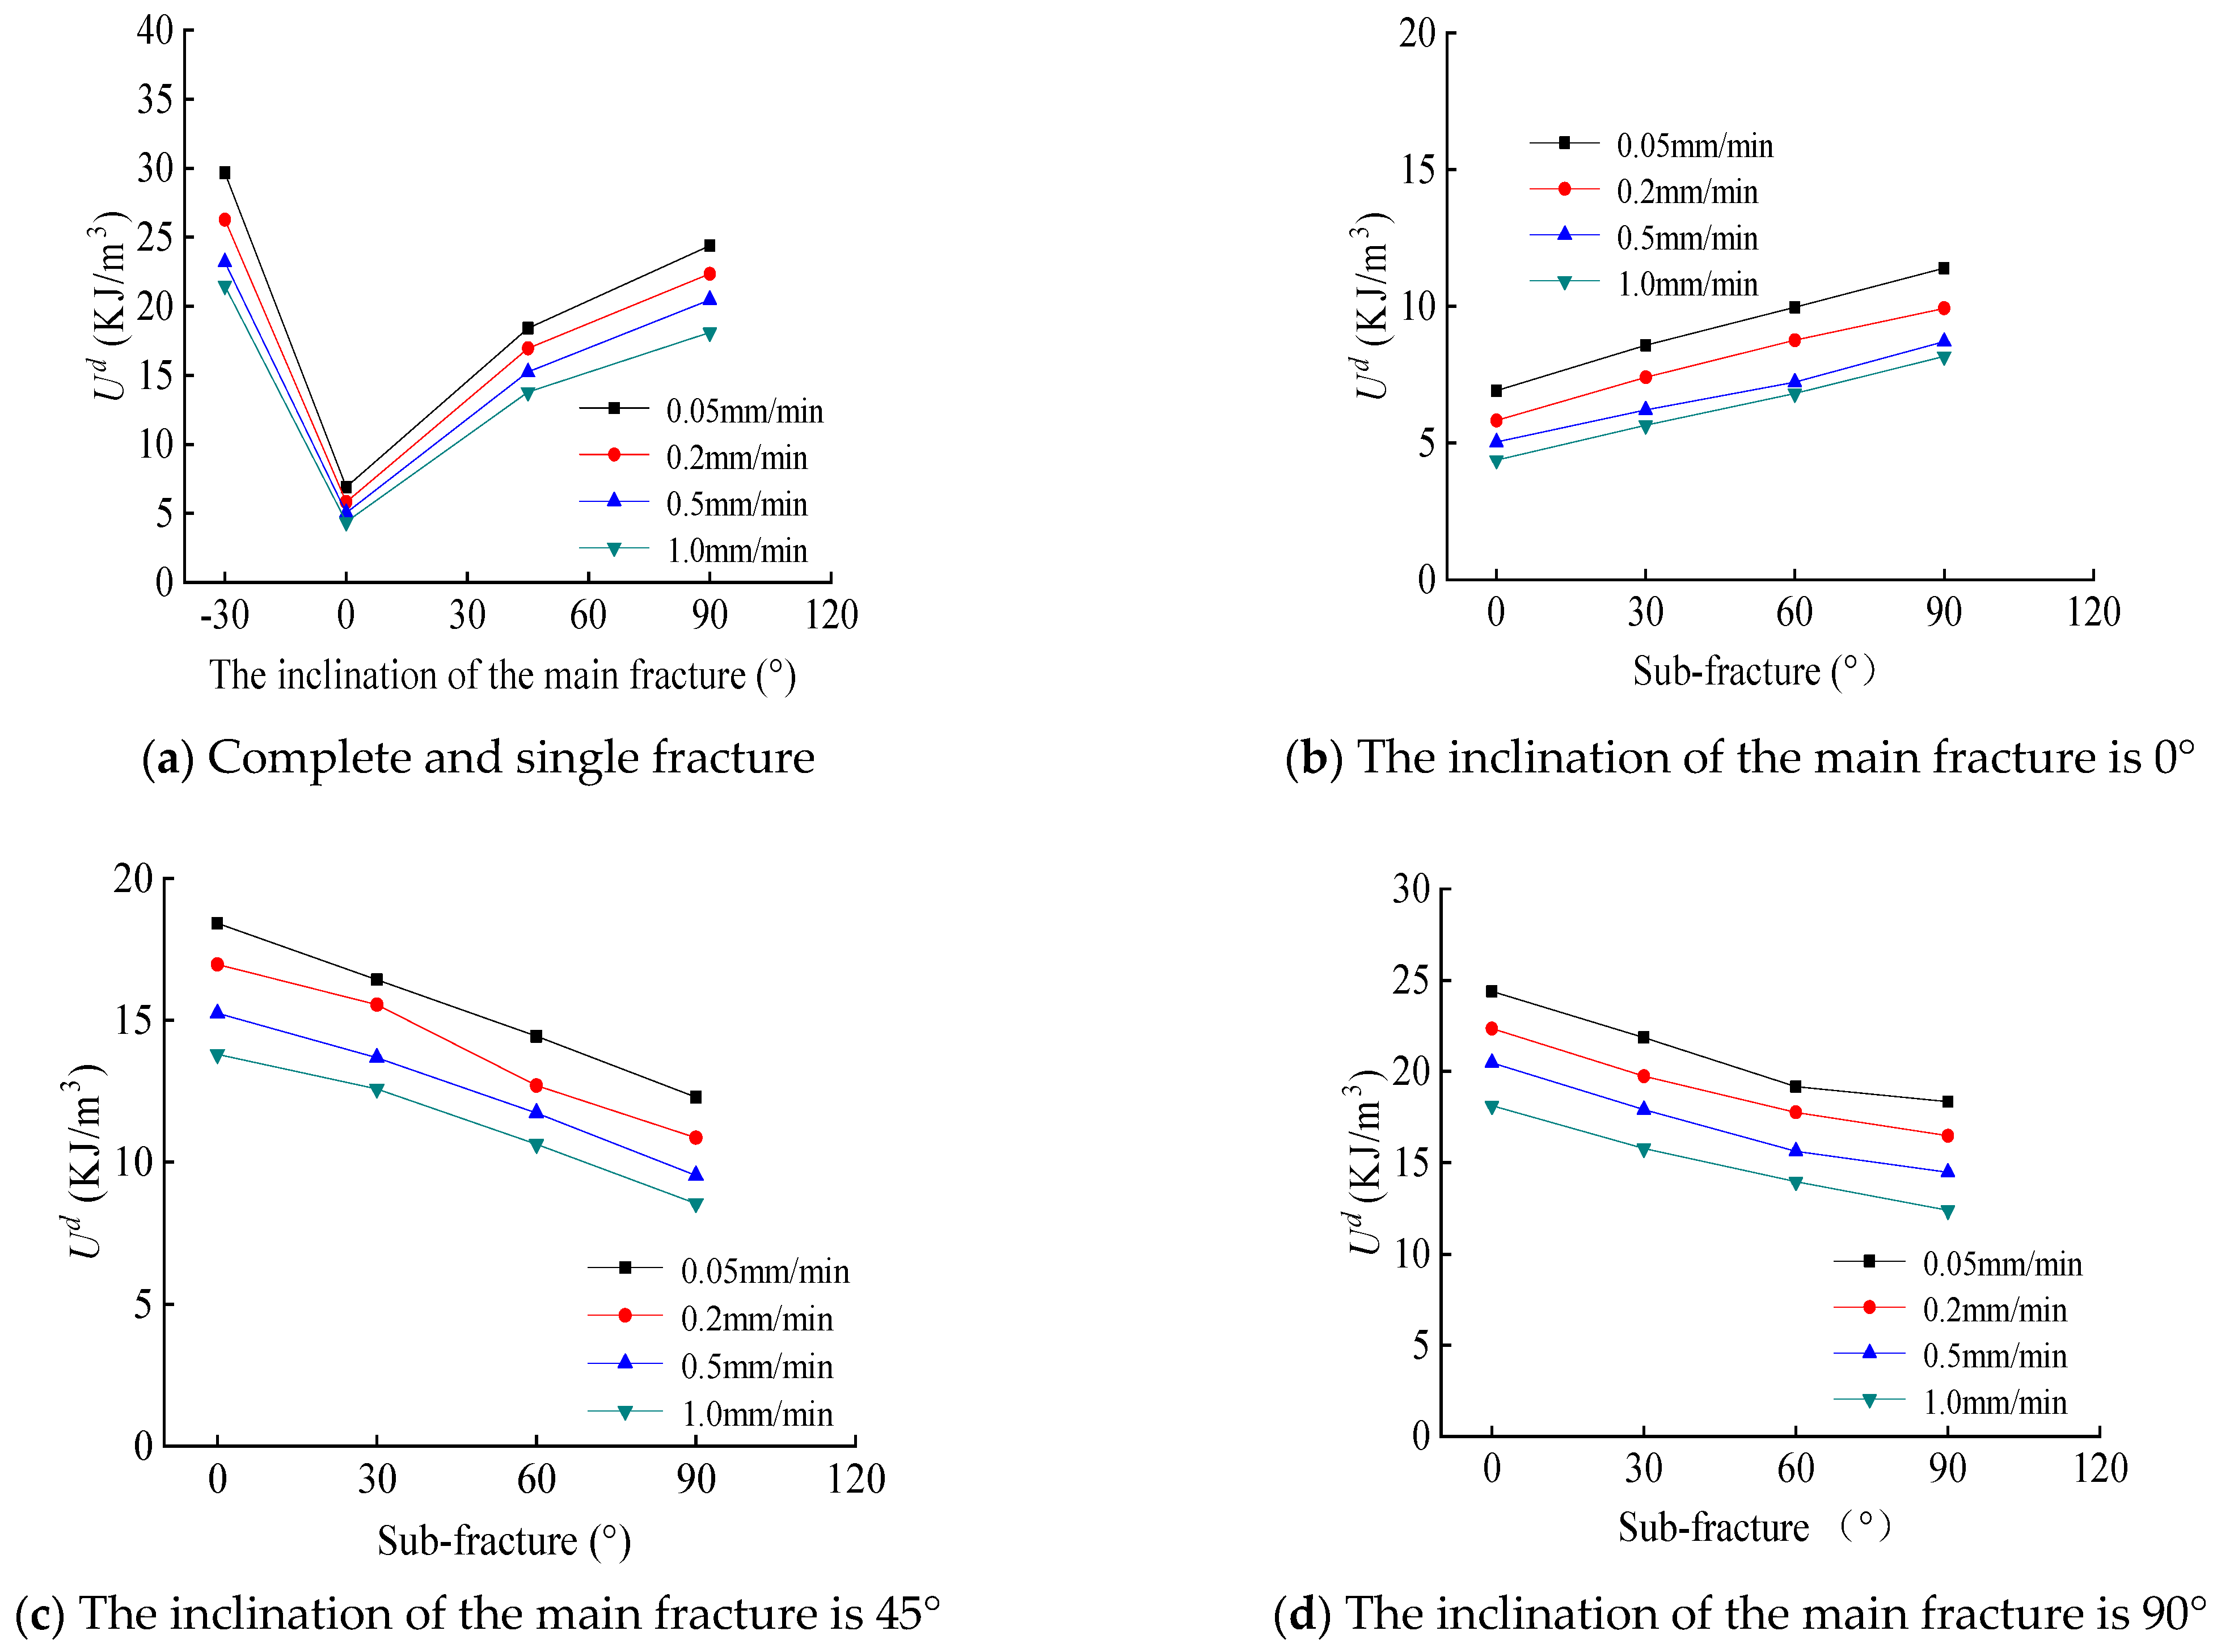
4.3. Analysis of Dissipated Energy Characteristics of T-Shaped Fracture Specimens

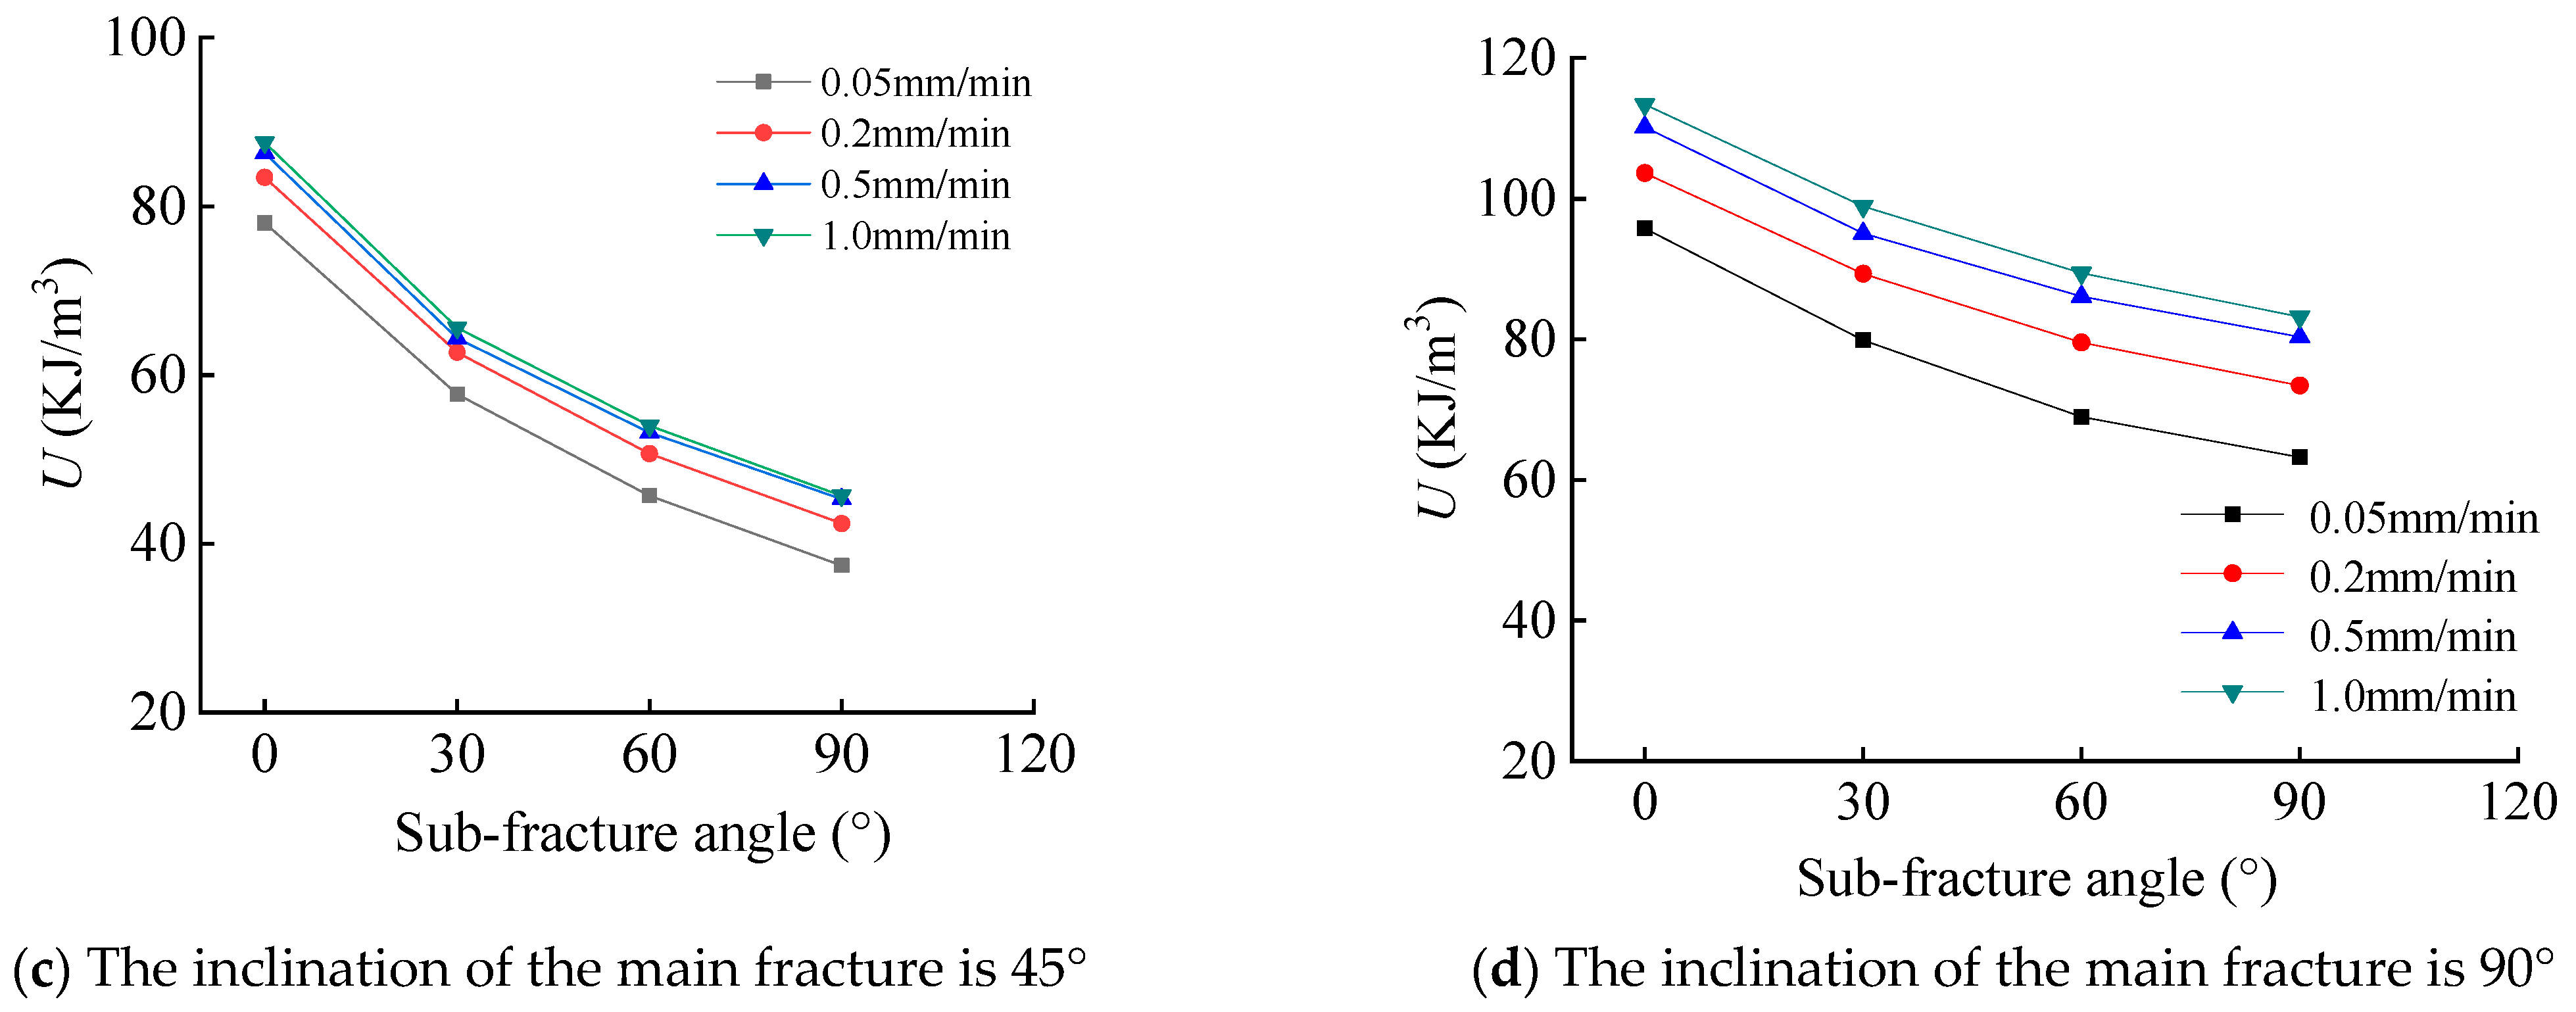
4.3.1. Effect of Fracture Inclination Angle

Figure 8 presents the dissipated energy at the peak point of different specimens under various loading conditions. In Figure 8a, it is observed that the intact specimen has the highest dissipated energy at the peak point, which is 21.67 kJ/m3 at a loading rate of 0.05 mm/min. On the other hand, the single-fracture specimens with inclination angles of 0°, 45°, and 90° have lower dissipated energy values at the peak point, which are 6.92 kJ/m3, 18.41 kJ/m3, and 21.39 kJ/m3, respectively. The dissipated energy at the peak point of the single-fracture specimens is reduced by 68.1%, 15.1%, and 1.3%, respectively, compared to that of the intact specimen. In Figure 8b, the T-shaped fracture specimen’s dissipated energy at the peak point is shown, and it is observed that the dissipated energy increases linearly as the angle between the secondary fractures increases when the inclination angle of the main fracture is 0°. At a loading rate of 0.2 mm/min, the dissipated energy increases by 27.1%, 50.2%, and 70.3% as the angle between the secondary fractures increases from 0° to 30°, 60°, and 90°, respectively. Figure 8c,d show that the inclination angles of the main fracture are 45° and 90°, respectively. The dissipated energy at the peak point linearly decreases as the angle between the secondary fractures increases. For instance, when the loading rate was 0.05 mm/min, and the inclination angle of the main fracture was 45°, the dissipated energy at the peak of the specimen decreased by 6.1%, 16.2%, and 25.7%, respectively, as the angle between the secondary fractures increased from 0° to 30°, 60°, and 90°. Similarly, when the loading rate was 0.5 mm/min and the inclination angle of the main fracture was 90°, the dissipated energy at the peak of the specimen decreased from 17.97 kJ/m3 to 15.56 kJ/m3 as the angle between the secondary fractures increased from 0° to 90°.

4.3.2. The Influence of Loading Rate

Figure 9 illustrates the correlation between loading rate and peak dissipated energy for both intact and notched specimens featuring a T-shaped notch. The graph shows that the peak dissipated energy of both types of specimens decreases as the loading rate increases. Furthermore, the rate of decrease gradually slows down as the loading rate increases, eventually stabilizing at a steady state. In the case of intact specimens, the peak dissipated energy decreased by 7.8%, 25.2%, and 33.2% as the loading rate increased from 0.05 mm/min to 0.2 mm/min, 0.5 mm/min, and 1.0 mm/min, respectively. For notched specimens with a main notch angle of 0° and a secondary notch angle of 30°, the peak dissipated energy decreased from 8.58 kJ/m3 to 5.65 kJ/m3 as the loading rate increased from 0.05 mm/min to 1.0 mm/min. This can be attributed to the quick adjustment of the internal particle structure of the specimen as the loading rate increases, leading to the closure of internal fractures and a decrease in friction, transfer, and relative displacement between particles, ultimately resulting in a lower dissipated energy. When the main notch angle is 45° and the secondary notch angle is 60°, the rate of decrease in peak dissipated energy is 8.53 (kJ/m3)/(mm/min), 3.57 (kJ/m3)/(mm/min), and 2.2 (kJ/m3)/(mm/min) as the loading rate increases from 0.05 mm/min to 0.2 mm/min, 0.2 mm/min to 0.5 mm/min, and 0.5 mm/min to 1.0 mm/min, respectively.

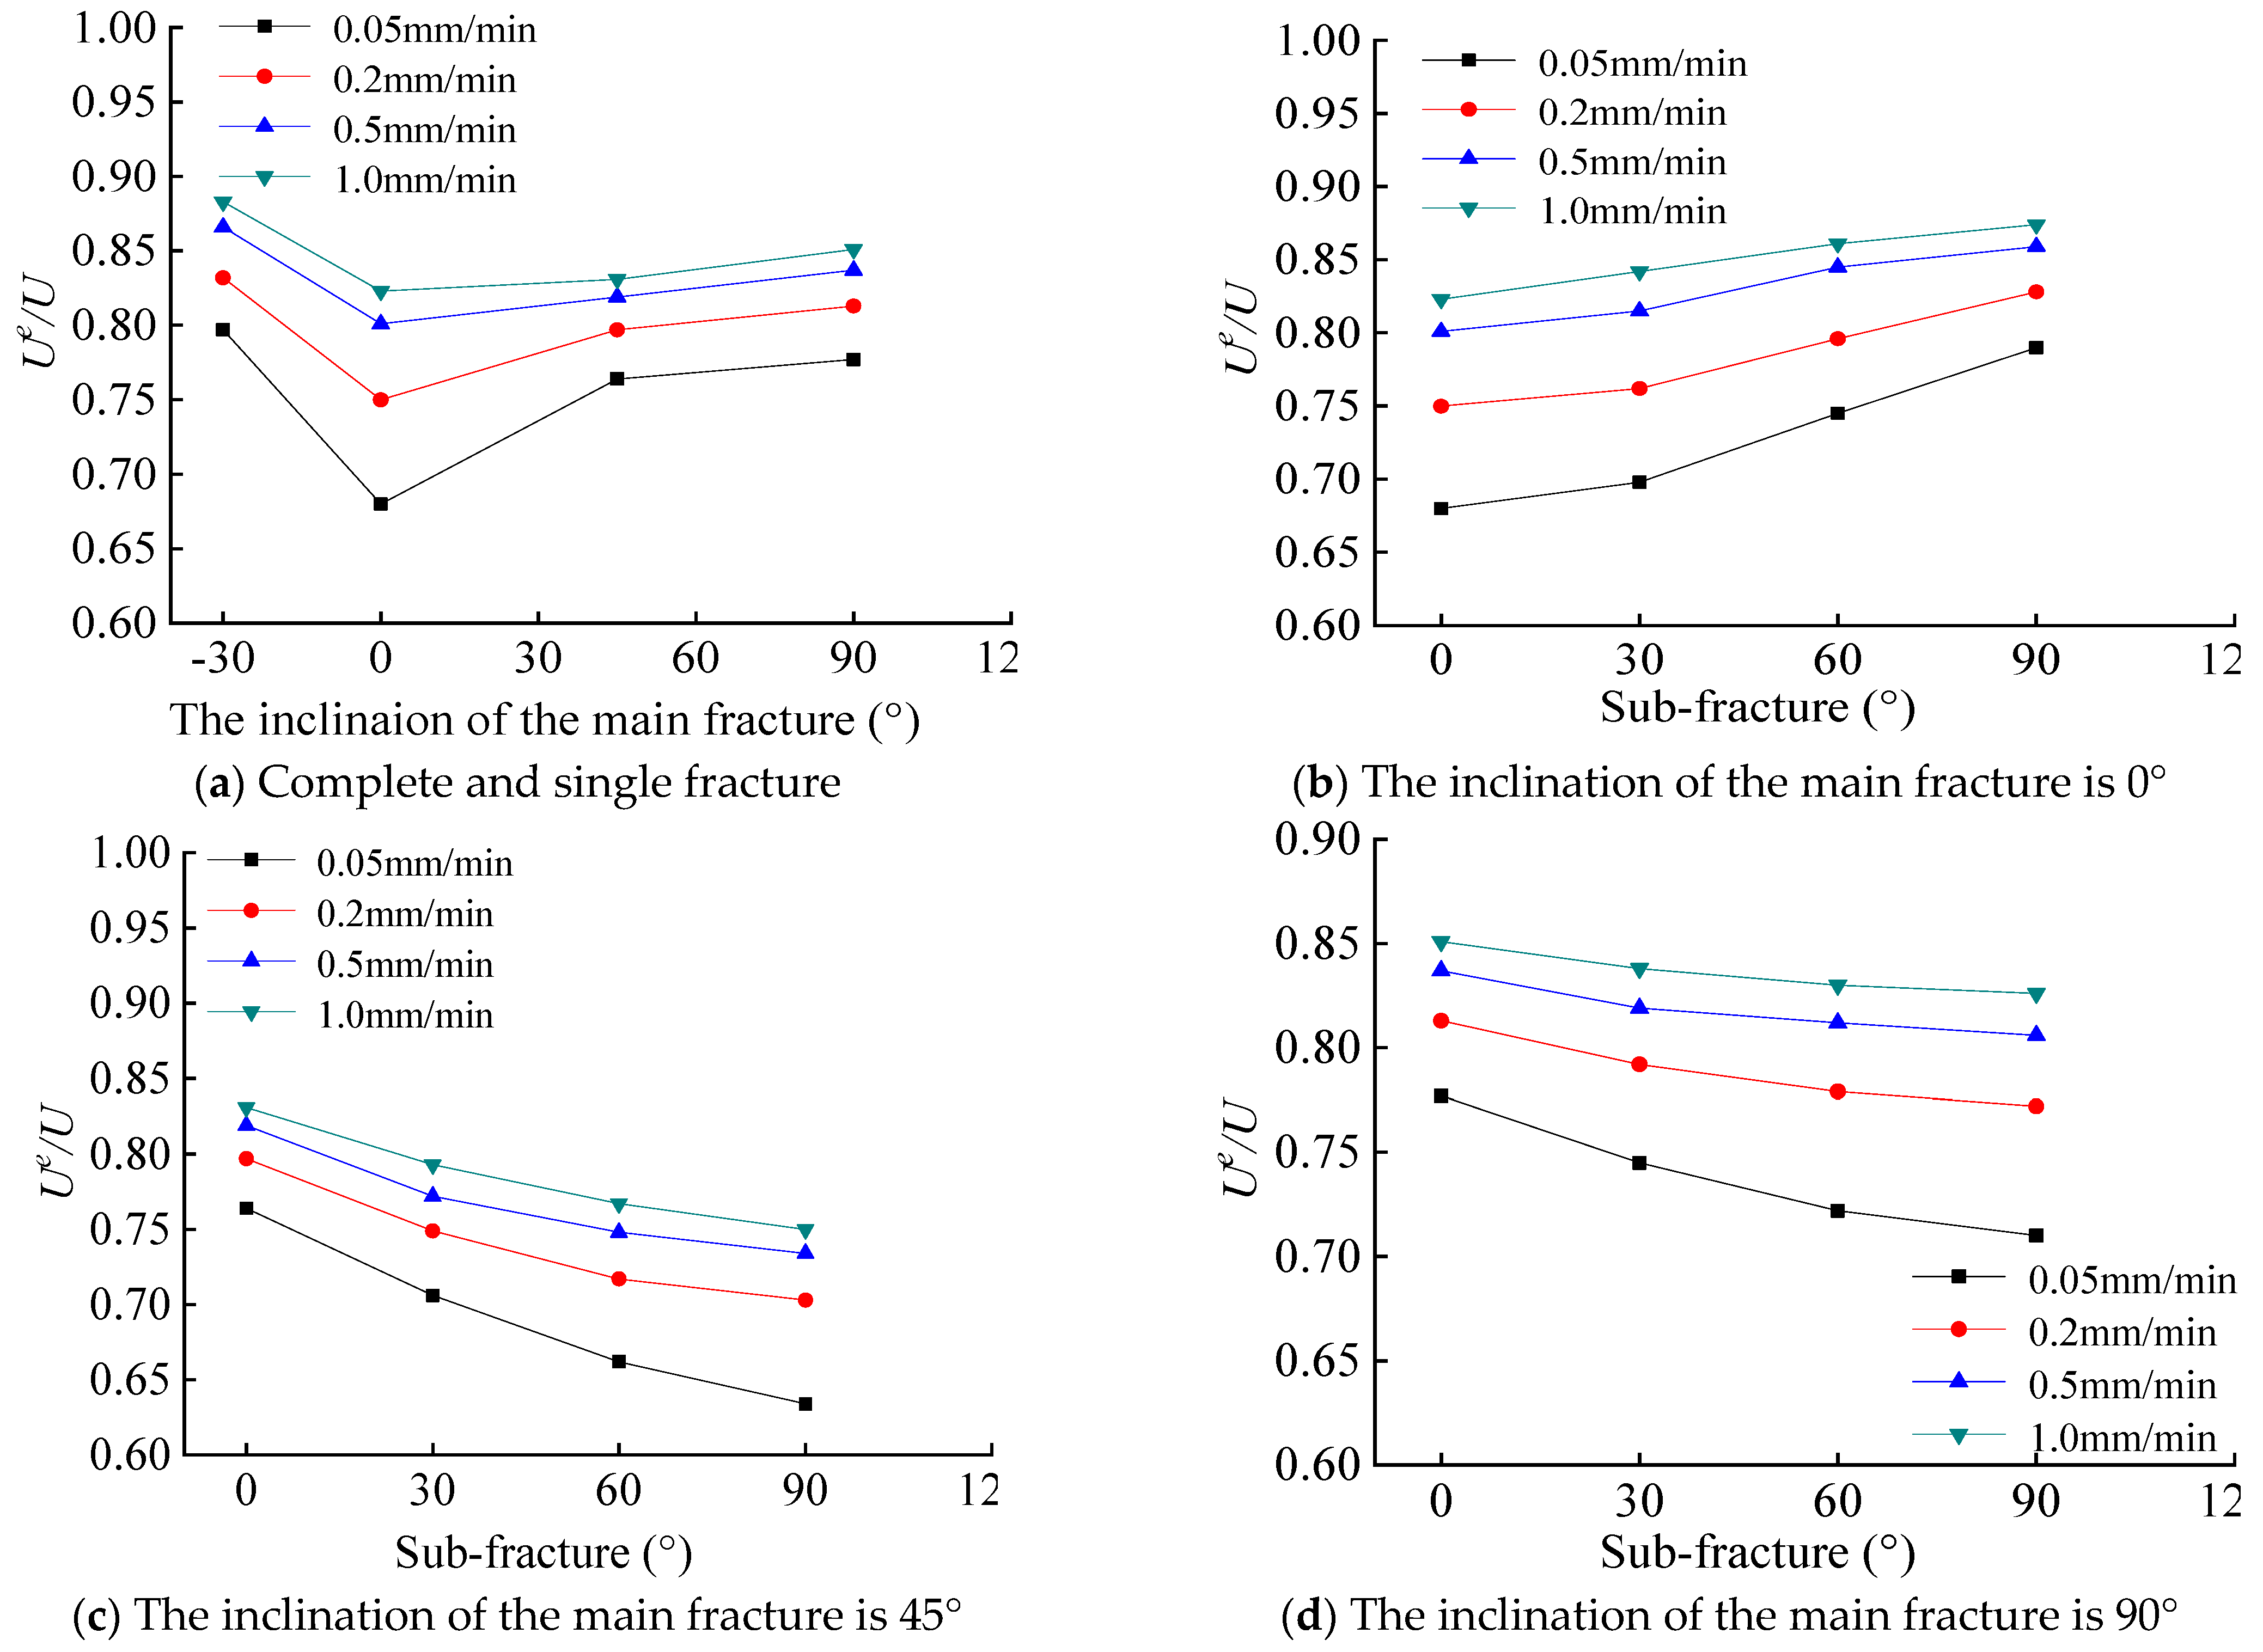
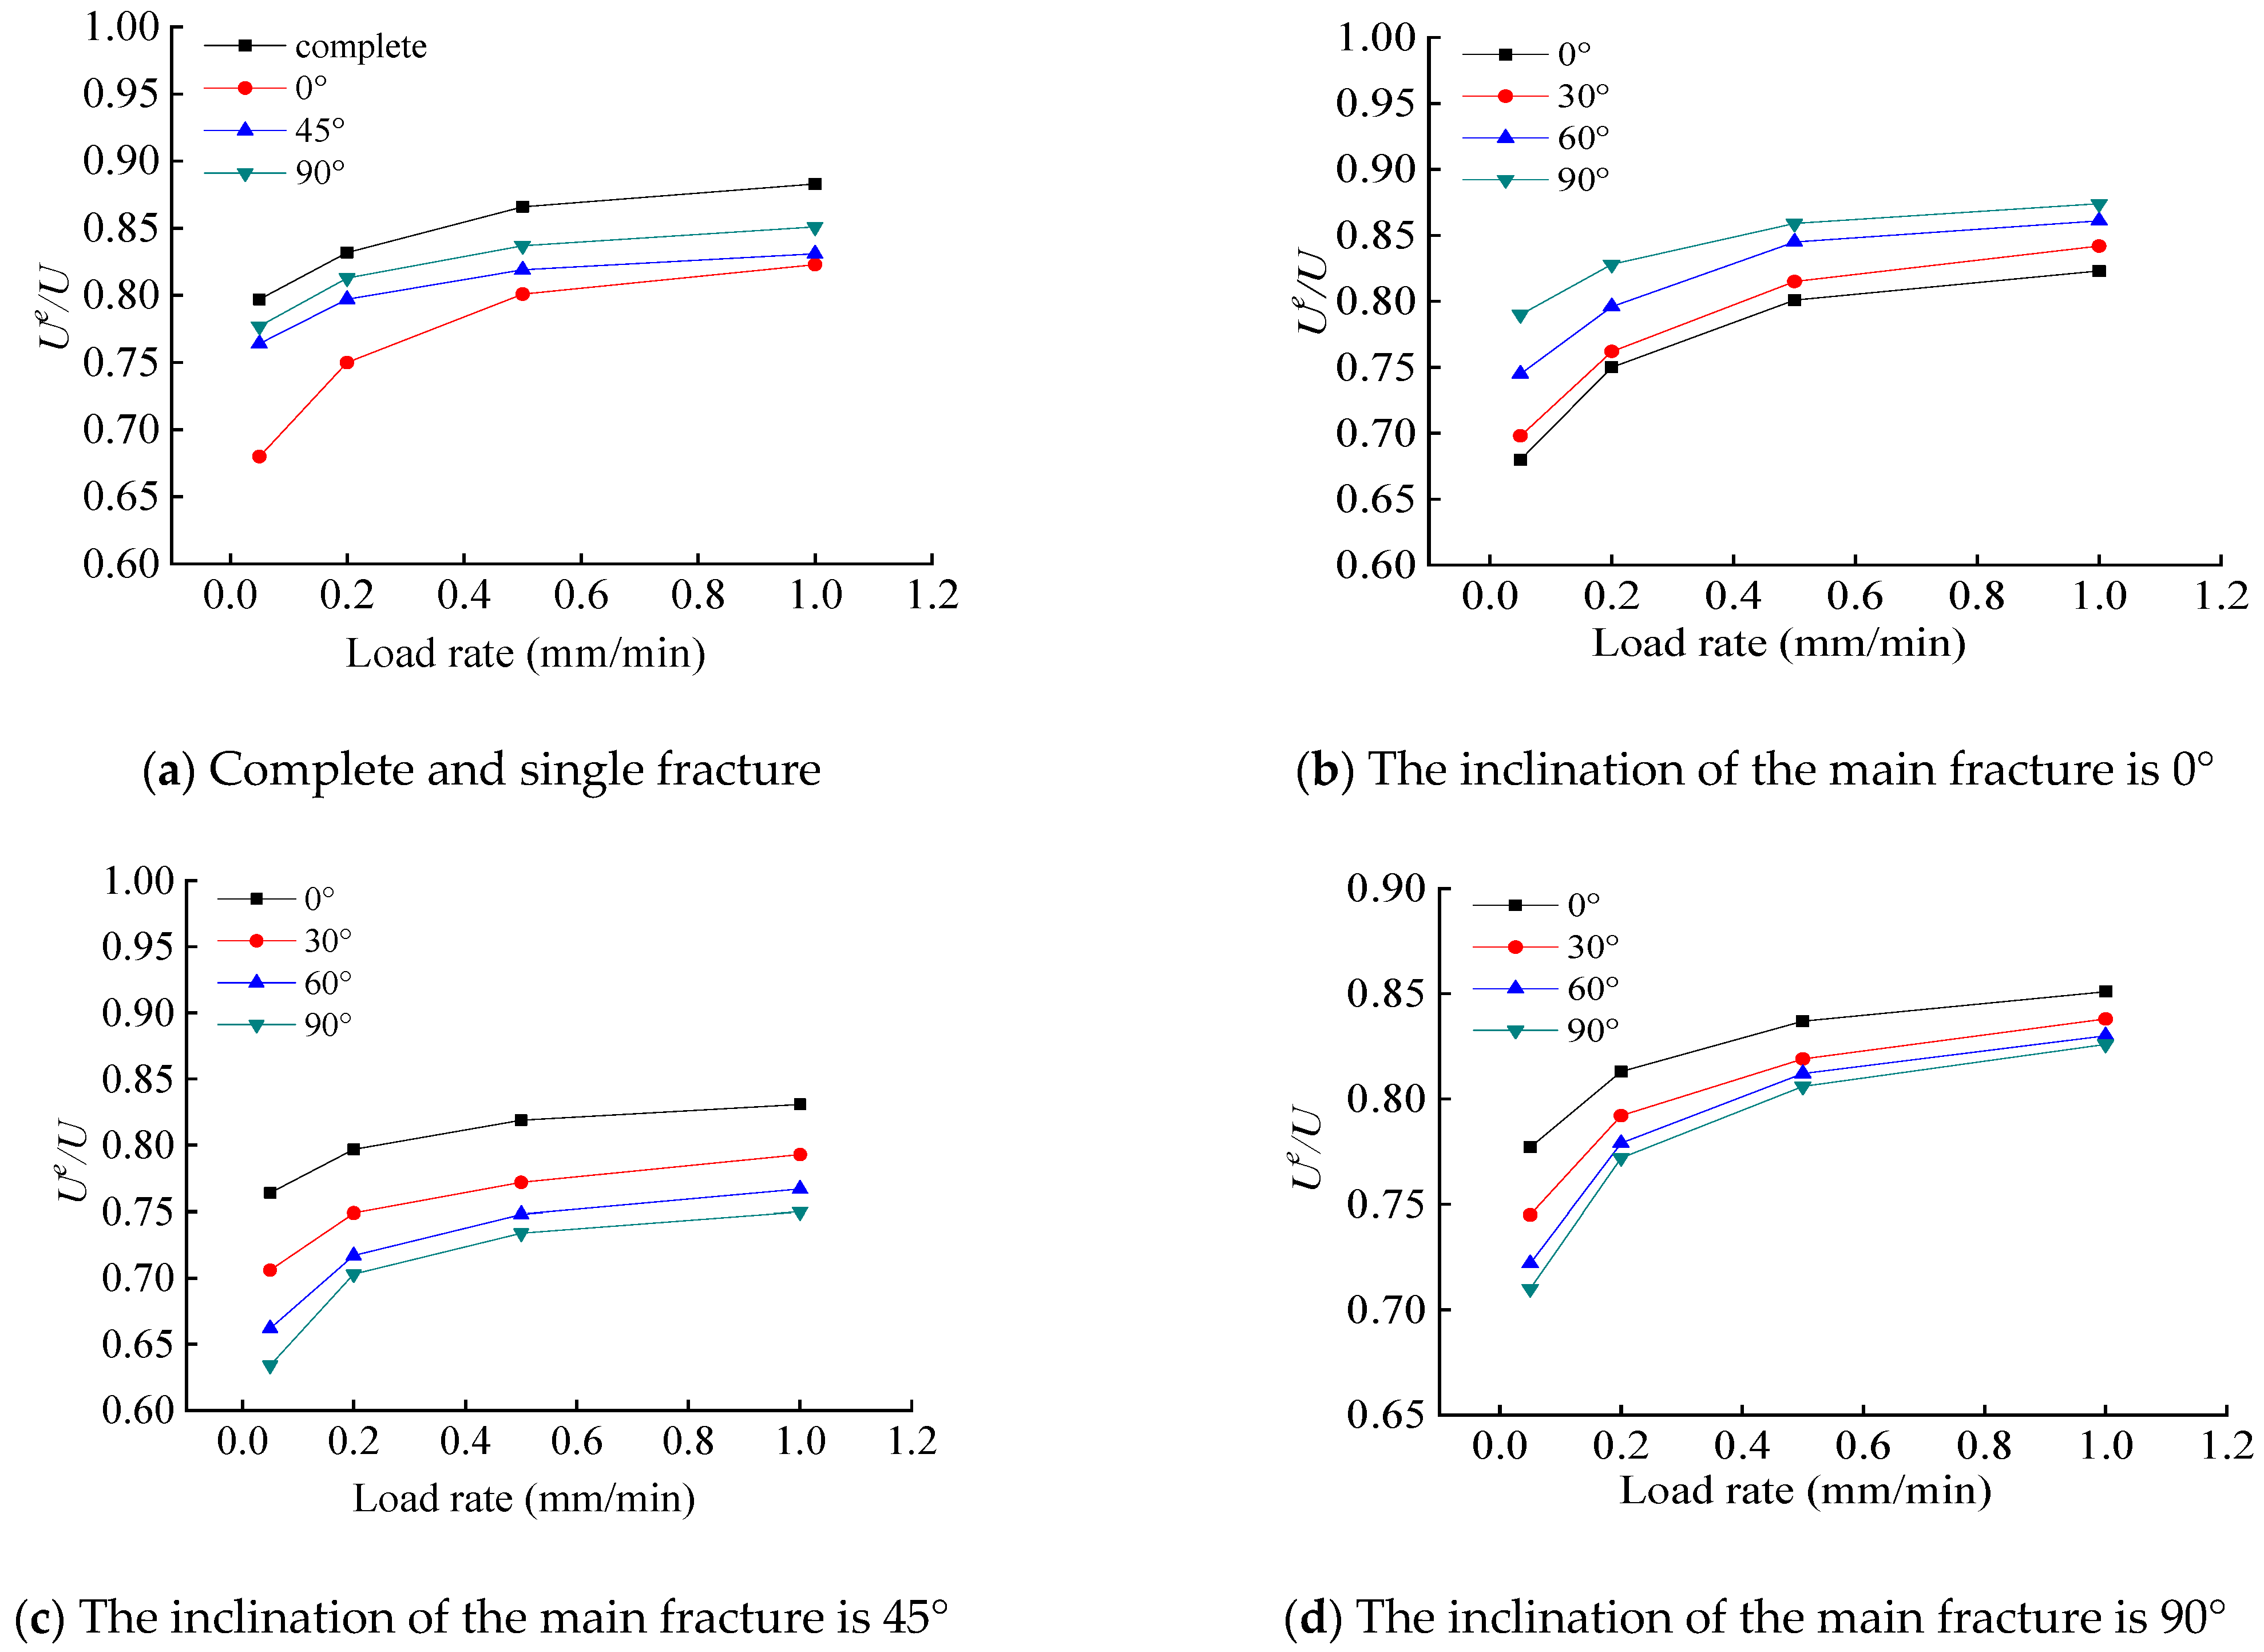
4.4. Energy Dissipation Ratio at Peak Point of T-Shaped Fracture Specimen

In order to investigate the energy dissipation ratio of T-shaped fracture specimens with different fracture angles, uniaxial compression tests were carried out at different loading rates. Based on Equations (2), (3) and (7), the values of energy dissipation ratio were calculated. By analyzing the results under different loading rates and fracture angles, the relationship between the fracture angle (loading rate) was obtained. The specific content is investigated in the sections below.

4.4.1. Elastic Energy to Total Energy Ratio

Effect of Fracture Inclination Angle

In Figure 10, the relationship between the elastic energy to total energy ratio at the peak point of the T-shaped fracture specimen and the fracture inclination angle at various loading rates is presented. As shown in Figure 10a, the elastic energy to total energy ratio at the peak point of the fracture specimen is lower than that of the intact specimen at the same loading rate. When the loading rate is 0.2 mm/min, the AB value of the peak point of the complete specimen is 0.832. When the fracture angle is 0°, the AB value of the peak point of the specimen is 0.750, which is reduced by 9.8% compared with the intact sample. For the fracture specimen with a fracture angle of 45°, the value of elastic energy to total energy ratio at the peak point is 0.797, a 4.2% reduction from the intact specimen, while for the fracture specimen with a fracture angle of 90°, the value elastic energy to total energy ratio of at the peak point is 0.813, a 2.3% reduction from the intact specimen. These findings suggest that the energy absorbed by the specimen prior to the peak point is primarily stored as elastic strain energy. When the stress exceeds the specimen’s bearing capacity, the stored elastic energy is rapidly released, resulting in specimen failure. Figure 10b shows that, when the loading rate remains constant, the elastic energy to total energy ratio at the peak point of the fracture specimen increases with an increase in the secondary fracture angle, given that the primary fracture angle is 0°. For instance, at a loading rate of 0.05 mm/min and primary fracture angle of 0°, it increases by 2.6%, 9.6%, and 16.2% as the secondary fracture angle increases from 0° to 30°, 60°, and 90°, respectively. This can be attributed to the increase in peak strength and the total energy absorbed per unit volume at specimen failure with an increase in the secondary fracture angle, leading to an increase in the stored elastic energy. However, when the loading rate is constant and the primary fracture angle is 45° or 90°, the elastic energy to total energy ratio at the peak point of the fracture specimen decreases with an increase in the secondary fracture angle, as depicted in Figure 10c,d. For example, at a loading rate of 1.0 mm/min and primary fracture angle of 45°, it decreases by 4.6%, 7.7%, and 9.7% as the secondary fracture angle increases from 0° to 30°, 60°, and 90°, respectively.

Impact of Loading Rate

The relationship between the parameter at the peak of the cruciform specimen and the loading rate is illustrated in Figure 11. As the loading rate increases, the peak of the cruciform specimen also increases, with the highest growth rate observed in the range of 0.05 mm/min to 0.2 mm/min and the lowest in the range of 0.5 mm/min to 1.0 mm/min. For the cruciform specimen with the main fracture angle of 0° and the secondary fracture angle of 60°, when the loading rate is 0.05 mm/min, the peak point is 0.745. When the loading rate is increased to 0.2 mm/min, the peak point rises to 0.796, which is 6.8% higher than that at 0.05 mm/min. When the loading rate is further increased to 0.5 mm/min, the peak point is 0.845, representing a 13.4% increase from 0.05 mm/min. When the loading rate is increased to 1.0 mm/min, the peak point is 0.861, which is 16.0% higher than that at 0.05 mm/min. When the inclination angle of the main crack is 45° and the included angle of the secondary crack is 90°, the loading rate is 0.05 mm/min, and the elastic energy ratio at the peak of the sample increases from 0.634 when the loading rate increases by 0.2 mm/min, 0.5 mm/min, and 1.0 mm/min to 0.703, 0.734, and 0.750. The parameter at the peak point reflects the ultimate energy storage capacity of the specimen and its resistance to failure. These findings suggest that the loading rate has an energy-strengthening effect on the cruciform specimen. This can be explained by that when the loading rate is large, the fracture propagation speed is not proportional to the loading rate when the rock is destroyed, and the fracture cannot fully expand. Ultimately, the fracture size is smaller when the rock fails, so the failure load is larger, and the measured strength is higher. Therefore, Ue/U increases with an increasing loading rate.

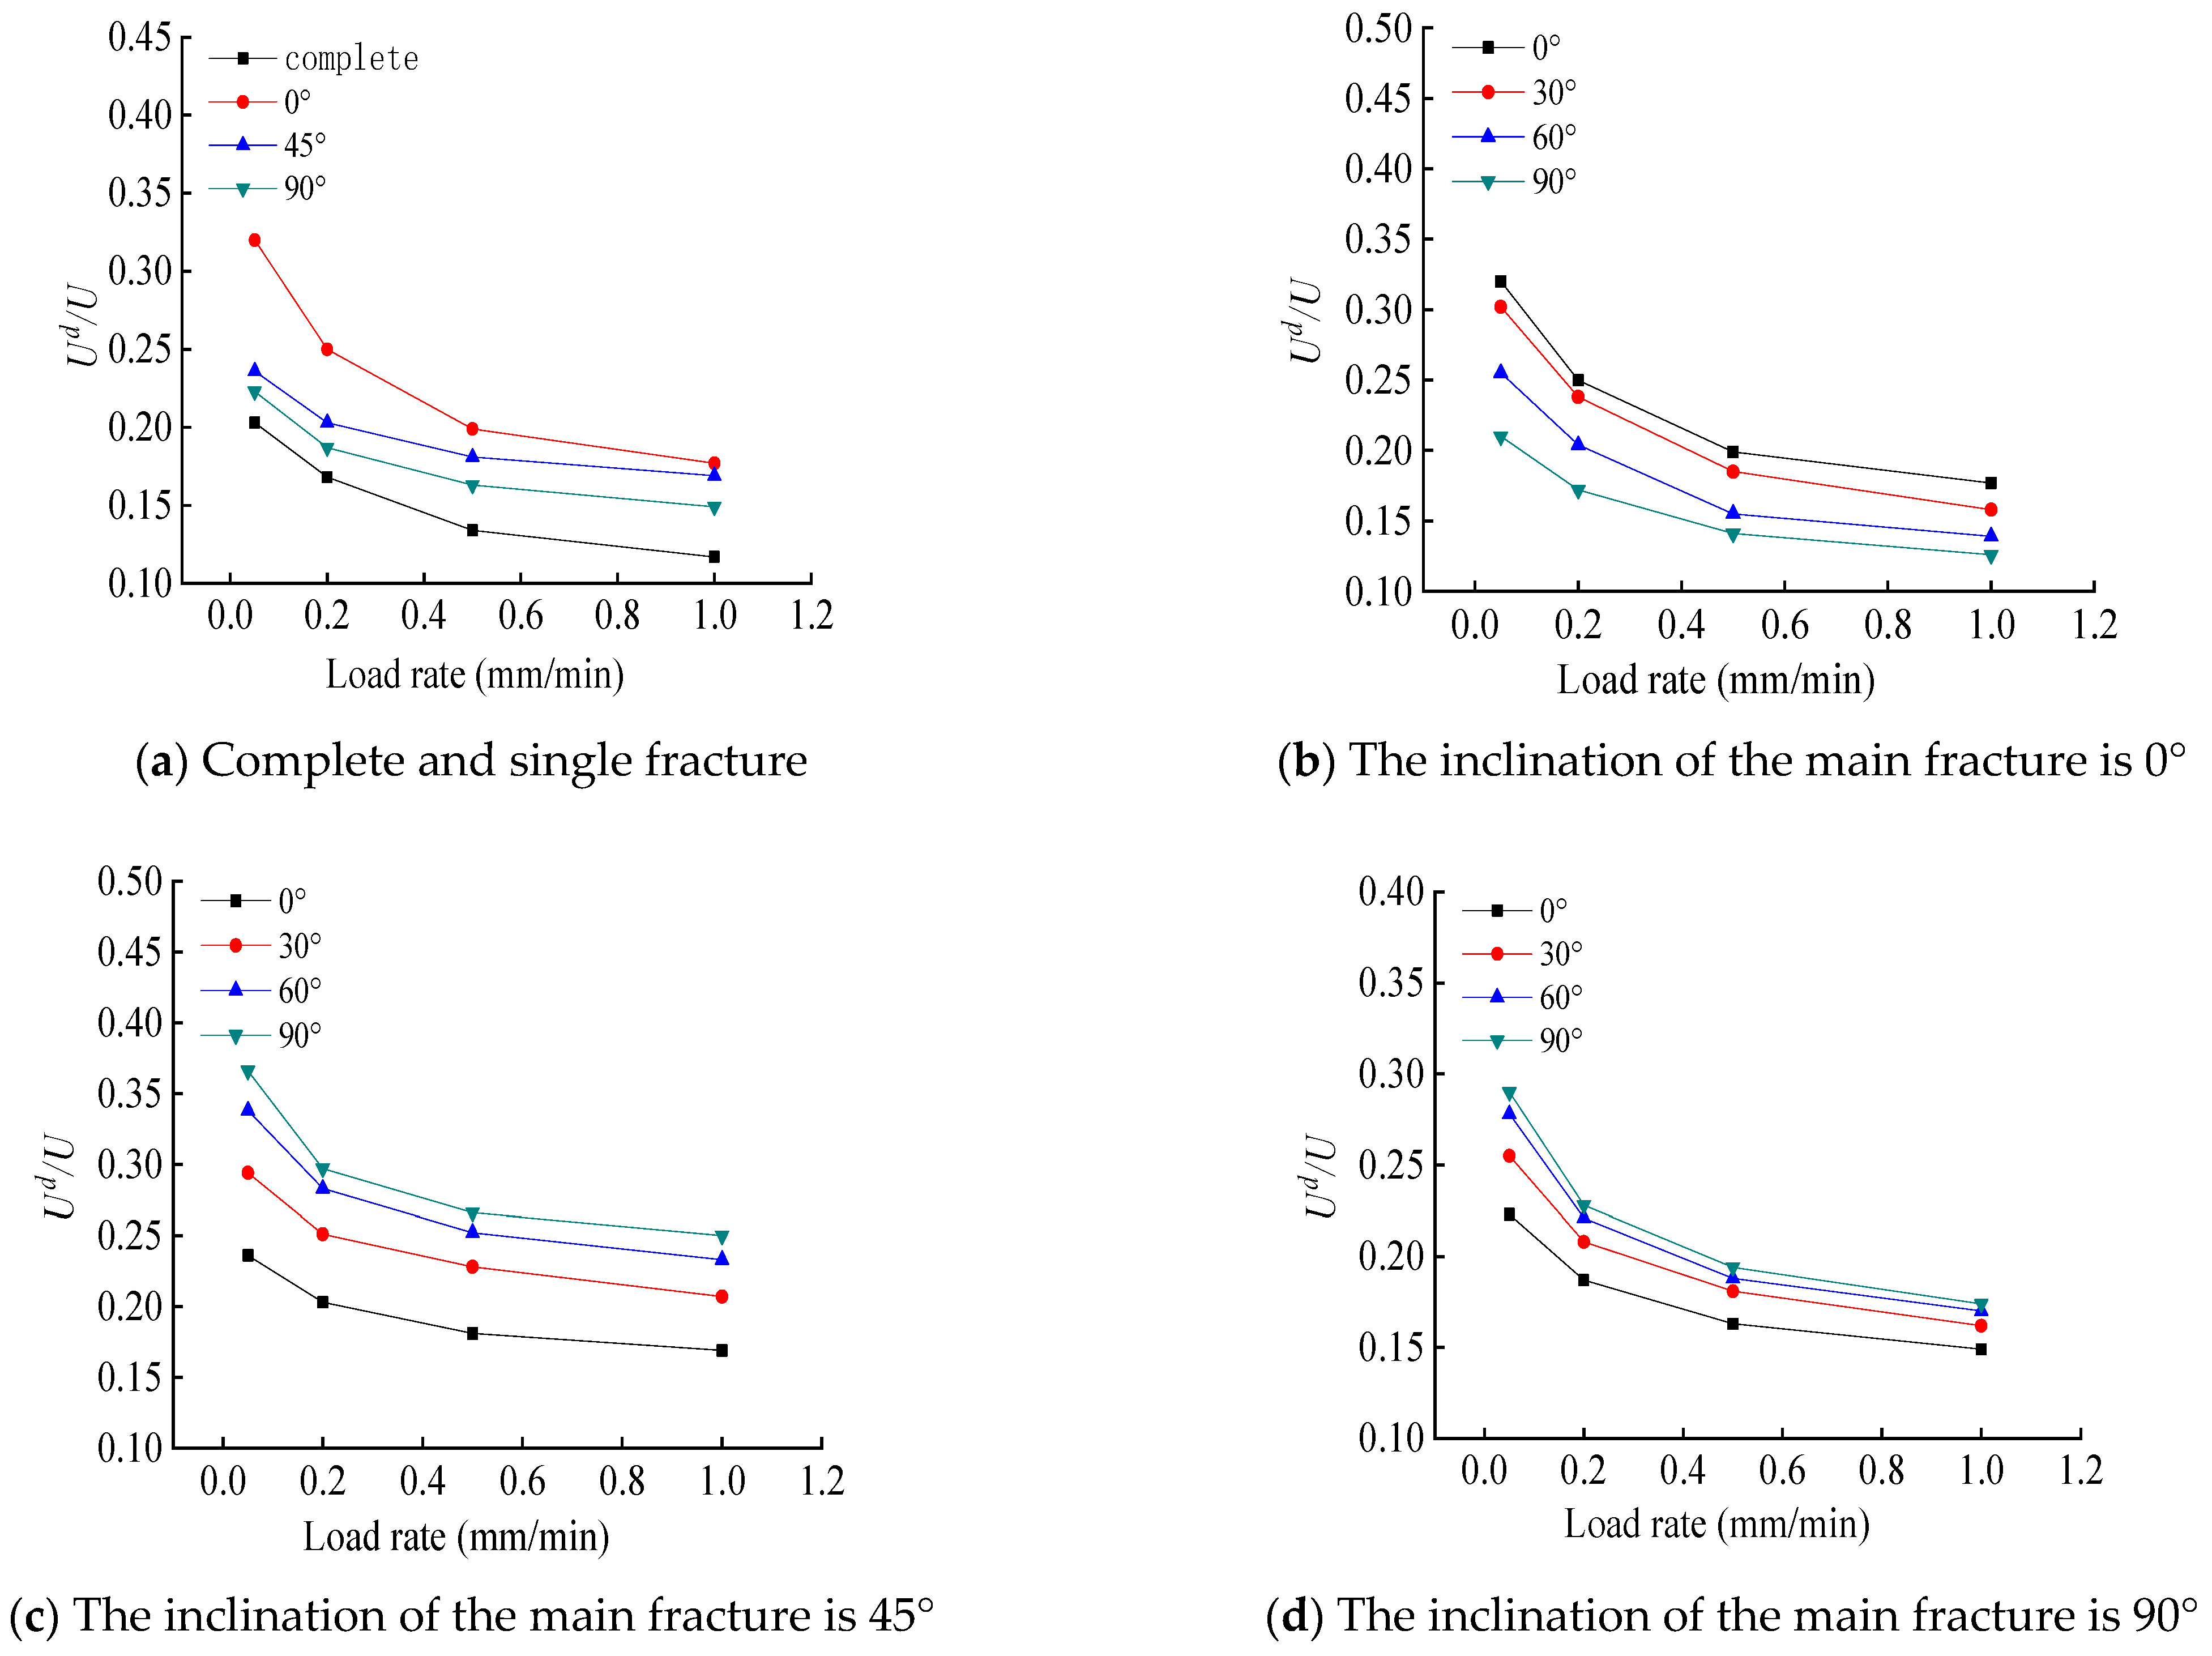
4.4.2. Ratio of Dissipated Energy to Total Energy

Impact of Fracture Angle

In Figure 12, the relationship between the fracture angle and the ratio of dissipated energy to total energy (Ud/U) at the peak point of the cruciform specimen is presented. As observed in Figure 12a, the single-fracture specimens with the main fracture angles of 0°, 45°, and 90° have an increased Ud/U at the peak point in comparison to the intact specimen. At the loading rate of 0.5 mm/min, Ud/U at the peak point of the intact specimen is 0.134, whereas for the single-fracture specimens with the main fracture angles of 0°, 45°, and 90°, it is 0.199, 0.181, and 0.163, respectively, indicating an increase of 48.5%, 35.1%, and 21.6%, respectively. This is because the fracture intensifies the initial damage of the specimen, weakens its elastic energy storage characteristic, and enhances the dissipated energy characteristic. As depicted in Figure 12b, when the inclination angle of the main fracture is 0°, the ratio of the dissipated energy at the peak point of the specimen to the total energy (Ud/U) decreases as the angle between the secondary fractures increases. At a loading rate of 0.2 mm/min, when the inclination angle of the main fracture is 0°, and the angle between the secondary fractures increases from 0° to 30°, 60°, and 90°, Ud/U decreases by 4.8%, 18.4%, and 31.2%, respectively. Figure 12c,d demonstrate that when the inclination angles of the main fracture are 45° and 90°, respectively, Ud/U increases as the angle between the secondary fractures increases. At a loading rate of 0.5 mm/min, when the inclination angle of the main fracture is 45° and the angle between the secondary fractures increases from 0° to 30°, 60°, and 90°, Ud/U increases by 26.0%, 39.2%, and 47.0%, respectively.

Effect of Loading Rate

The relationship between the peak Ud/U value of the cruciform fracture specimen and the loading rate is demonstrated in Figure 13, revealing that as the loading rate increases, the Ud/U value at the peak point of the specimen decreases. Specifically, for the intact specimen, the Ud/U value at the peak point is 0.203 at a loading rate of 0.05 mm/min. When the loading rate is increased to 0.2 mm/min, the Ud/U value at the peak point decreases by 17.2% to 0.168. Moreover, at loading rates of 0.5 mm/min and 1.0 mm/min, the Ud/U value at the peak point of the specimen decreases by 34.0% and 42.4%, respectively, compared to the intact specimen. When the inclination angle of the main fracture is 90° and the angle between the secondary fracture is 30°, the elastic energy at the peak point of the specimen decreases by 18.4%, 29.0%, and 36.5%, respectively, as the loading rate increases from 0.05 mm/min to 0.2 mm/min, 0.5 mm/min, and 1.0 mm/min. The reason for this phenomenon is that at low loading rates, the particles inside the specimen have sufficient time to move and adjust, causing intense friction between particles and resulting in a large Ud/U value. However, as the loading rate increases, the friction between particles decreases, causing a decrease in Ud/U.

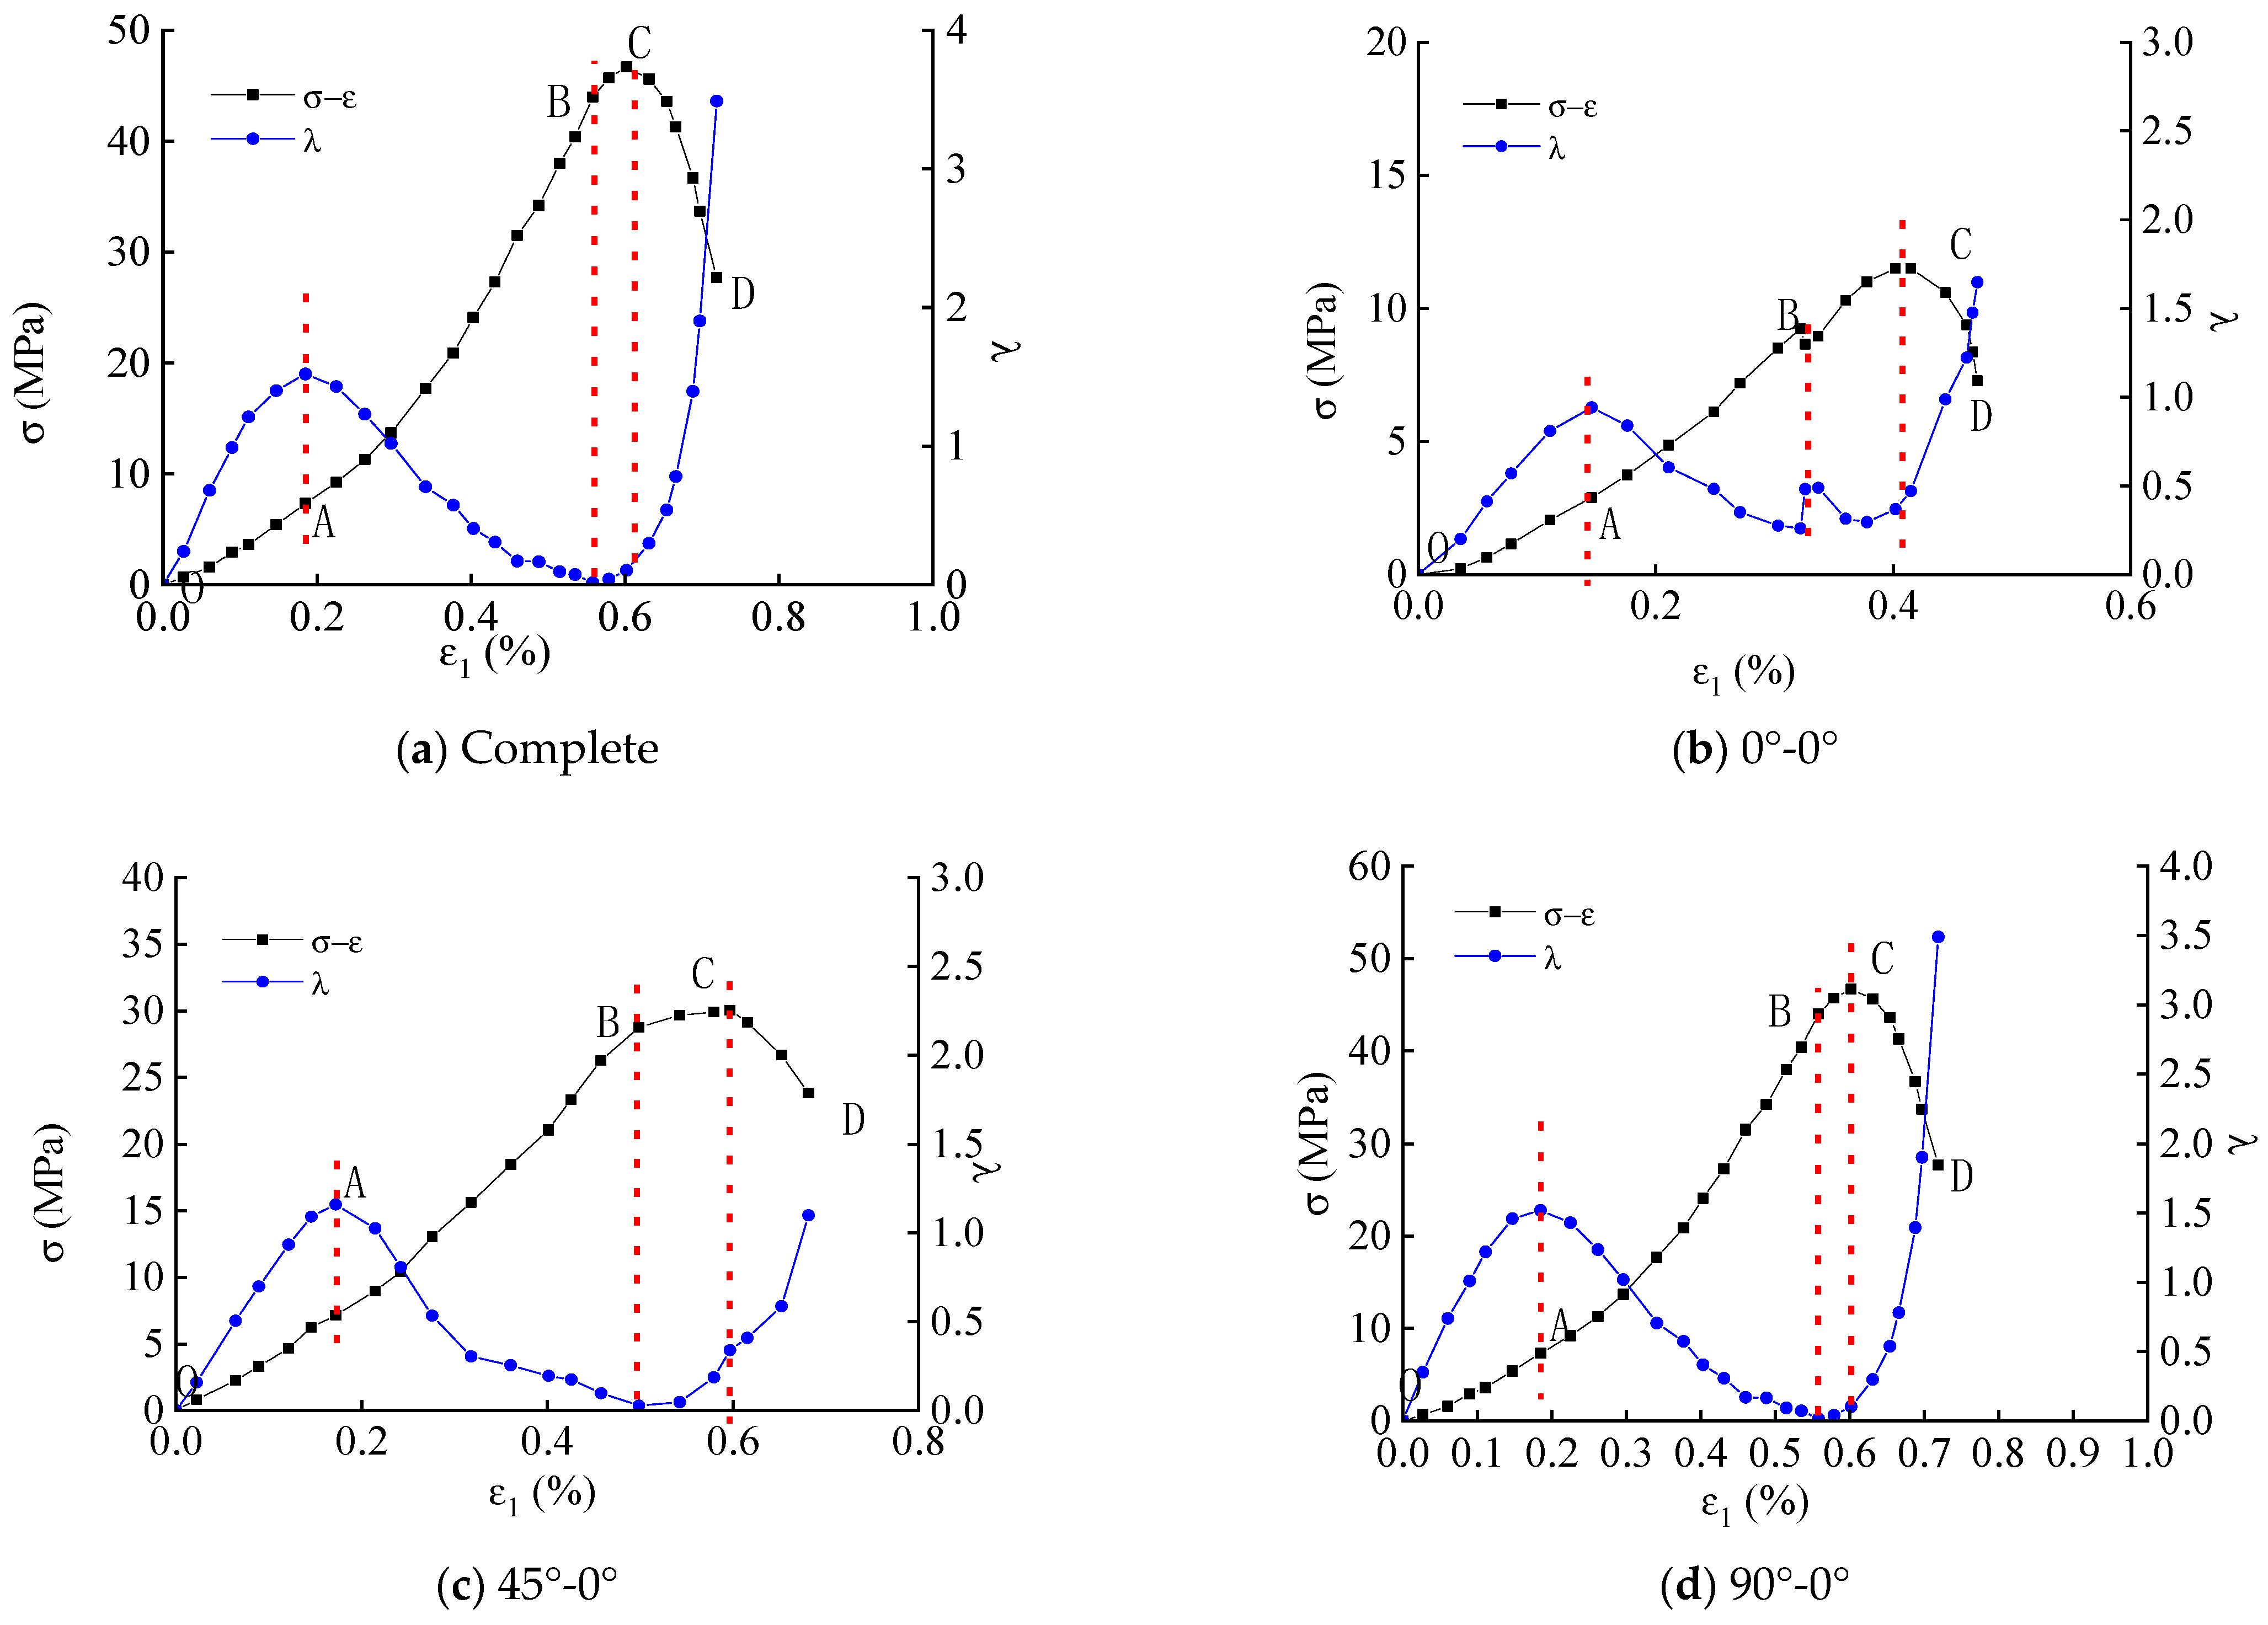
4.4.3. The Dissipated Energy Coefficient Evolution Curve

Figure 14 illustrates the evolution of the dissipated energy coefficient with strain for different H-shaped fracture specimens. The curve can be divided into four stages and has three characteristic points.
The compaction stage (OA) is characterized by point A, which is the first characteristic point of the curve and represents the compaction point. At point A, the dissipated energy coefficient increases rapidly with increasing strain, as most of the energy is consumed by the closure and friction of rock microfractures. Thus, only a small amount of energy is converted into elastic energy, resulting in a rapid increase in the dissipated energy coefficient.
The elastic deformation stage (AB) is characterized by point B, the second characteristic point of the curve, also known as the yield point. In this stage, the dissipated energy coefficient decreases with increasing strain and reaches a minimum value at point B. The microfractures in the rock are completely closed, and the total energy is mostly converted into elastic energy. Additionally, there is almost no new fracture generation and propagation in this stage, resulting in a relatively low dissipated energy coefficient.
The yielding stage (BC) is characterized by point C, the third characteristic point of the curve, also known as the peak point. In this stage, the dissipated energy coefficient slowly increases with increasing strain due to the gradual generation of new microfractures inside the rock. Furthermore, the number of microfractures increases with the increase in stress, leading to the rapid growth of dissipated energy and slow growth of elastic energy. Thus, the dissipated energy coefficient slowly increases with increasing stress.
The failure stage (CD) is characterized by a sharp increase in the dissipated energy coefficient. There are two reasons for this. Firstly, the generation of macroscopic fractures releases elastic energy continuously. Secondly, fracture propagation accelerates, and the relative slip between particles increases, resulting in a rapid increase in dissipated energy.
It is evident that the primary and secondary states of elastic energy and dissipated energy vary across the four loading stages. During the initial loading stage, both the elastic energy and dissipated energy exhibit slow increments, but the dissipated energy increases more rapidly than the elastic energy, indicating that elastic energy dominates at this stage. In the elastic deformation stage, both the elastic energy and dissipated energy show significant increases, but the increment of elastic energy is larger than that of dissipated energy, suggesting that elastic energy is the dominant form of energy conversion. As the loading progresses into the plastic deformation stage, the increment of dissipated energy accelerates, while the increment of elastic energy slows down, indicating that dissipated energy dominates. Finally, in the failure stage, the elastic energy stored in the rock is almost entirely converted into dissipated energy, which plays a critical role in causing macroscopic damage and loss of strength in the specimen. Therefore, dissipated energy is the dominant form of energy conversion at this stage.
In future research, we will address the validation of model calculations to fully demonstrate the utility and accuracy of the model. In addition, we will also introduce the application of deep learning methods in civil engineering [28].

5. Conclusions

The deformation and failure process of the T-shaped fractured rock specimen is characterized by complex energy evolution. Initially, most of the energy is dissipated by microfracture closure with only a small portion converted to elastic energy. During the elastic stage, elastic energy dominates the energy conversion process. In the yield stage, the specimen undergoes plastic deformation to intensify damage, indicating an enhancement of energy dissipation. During the failure stage, the fractures in the specimen transition from microscopic to macroscopic, and the elastic energy stored within the specimen is released quickly.
At the peak point, as the secondary fracture angle increases from 0°, the total absorbed energy, elastic strain energy, and dissipated energy of the T-shaped fractured rocks also increase. When the fracture angle is 45° and 90°, the total absorbed energy, elastic strain energy, and dissipated energy decrease as the secondary fracture angle increases (the variation below 45.7%).
With the increase in loading rate, the total absorbed energy and elastic energy at the peak point of the T-fractured rock specimen increase, but the dissipated energy decreases. The increase in loading rate leads to an increase in the elastic energy and a decrease the dissipated energy at the peak point of the T-shaped fractured rock specimen at a maximum value of 90%.

Author Contributions

Y.Z. contributed to the conception and design of the study. L.Z. organized the database. P.L. performed the statistical analysis. F.L. and F.P. wrote the first draft of the manuscript. All authors contributed to the manuscript revision and read and approved the submitted version. All authors have read and agreed to the published version of the manuscript.

Funding

The research was supported by the Natural Science Research General Program (No. 202103021224334) of the Shanxi Science and Technology Department.

Institutional Review Board Statement

Not applicable.

Informed Consent Statement

Not applicable.

Data Availability Statement

The raw data supporting the conclusions of this article will be made available by the authors, without undue reservation.

Conflicts of Interest

Author Fan Pang is employed by Shaanxi Yisanyi Coalfield Geology Co., Ltd., Weinan, China. The remaining authors declare that the research was conducted in the absence of any commercial or financial relationships that could be construed as a potential conflict of interest.

References

  1. Wang, J.; He, M.M.; Yuan, Z.Y.; Luo, B.; Ma, Y.D. Ductile-brittle failure transition of rocks in process of drilling with high confining pressure: Model and experiment. J. Pet. Sci. Eng. 2023, 223, 211505. [Google Scholar] [CrossRef]
  2. Wang, H.T.; He, M.M. Determining Method of Tensile Strength of Rock Based on Friction Characteristics in the Drilling Process. Rock Mech. Rock Eng. 2023, 56, 4211–4227. [Google Scholar] [CrossRef]
  3. He, M.M.; Wang, J.; Yuan, Z.Y.; Wang, H.T.; Ma, X.D.; Luo, B. Anisotropy on the ductile-to-brittle transition for rock in process of drilling. Acta Geophys. 2023, 71, 2107–2124. [Google Scholar] [CrossRef]
  4. Wang, H.T.; He, M.M.; Pang, F.; Chen, Y.S.; Zhang, Z.Q. Energy dissipation-based method for brittleness evolution and yield strength determination of rock. J. Pet. Sci. Eng. 2021, 200, 108376. [Google Scholar] [CrossRef]
  5. Wang, H.T.; He, M.M.; Zhang, Z.Q.; Zhu, J.W. Determination of the constant mi in the Hoek-Brown criterion of rock based on drilling parameters. Int. J. Min. Sci. Technol. 2022, 32, 747–759. [Google Scholar] [CrossRef]
  6. Liu, Y.; Wang, E.; Jiang, C.; Zhang, D.; Li, M.; Yu, B.; Zhao, D. True Triaxial Experimental Study of Anisotropic Mechanical Behavior and Permeability Evolution of Initially Fractured Coal. Nat. Resour. Res. 2023, 32, 567–585. [Google Scholar] [CrossRef]
  7. Liu, Y.; Wang, E.; Li, M.; Song, Z.; Zhang, L.; Zhao, D. Mechanical response and gas flow characteristics of pre-drilled coal subjected to true triaxial stresses. Gas Sci. Eng. 2023, 111, 204927. [Google Scholar] [CrossRef]
  8. Liu, Y.; Lebedev, M.; Zhang, Y.; Wang, E.; Liu, W.; Liang, L.; Feng, R.; Ma, R. Micro-Cleat and Permeability Evolution of Anisotropic Coal During Directional CO2 Flooding: An In Situ Micro-CT Study. Nat. Resour. Res. 2022, 31, 2805–2818. [Google Scholar] [CrossRef]
  9. Wu, M.M.; Wang, J.F. A DEM investigation on crushing of sand particles containing intrinsic flaws. Soils Found. 2020, 60, 562–572. [Google Scholar] [CrossRef]
  10. Li, Y.; Chen, J.Q.; Elsworth, D.; Pan, Z.J.; Ma, X.T. Nanoscale mechanical property variations concerning mineral composition and contact of marine shale. Geosci. Front. 2022, 13, 101405. [Google Scholar] [CrossRef]
  11. Li, Y.; Chen, J.Q.; Yang, J.H.; Liu, J.S.; Tong, W.S. Determination of shale macroscale modulus based on microscale measurement: A case study concerning multiscale mechanical characteristics. Pet. Sci. 2022, 19, 1262–1275. [Google Scholar] [CrossRef]
  12. Zhou, Y.Q.; Sheng, Q.; Li, N.N.; Fu, X.D. Numerical analysis of the mechanical properties of rock materials under tiered and multi-level cyclic load regimes. Soil Dyn. Earthq. Eng. 2020, 135, 106186. [Google Scholar] [CrossRef]
  13. Zhou, C. Study on Damping Characteristics of Sandstone and Granite under Triaxial Cyclic Loading; Xi’an University of Technology: Xi’an, China, 2019. [Google Scholar]
  14. Deng, C. Study on mechanical properties and acoustic emission characteristics of coal and rock under cyclic loading. Coal Mine Saf. 2020, 51, 63–69. [Google Scholar]
  15. Liu, M.X.; Liu, E.L. Dynamic mechanical properties of artificial jointed rock samples subjected to cyclic triaxial loading. Int. J. Rock Mech. Min. Sci. 2017, 98, 54–66. [Google Scholar] [CrossRef]
  16. Erarslan, N. Microstructural investigation of subcritical crack propagation and Fracture Process Zone (FPZ) by the reduction of rock fracture toughness under cyclic loading. Eng. Geol. 2016, 208, 181–190. [Google Scholar] [CrossRef]
  17. Wang, S.H.; Wang, Z.H.; Wang, K.Y.; Zhuang, X.P. Evolution of elastic modulus of sandstone containing double cracks under cyclic loading. J. Northeast. Univ. (Nat. Sci. Ed.) 2020, 41, 282–286. [Google Scholar]
  18. Du, R.F.; Pei, X.J.; Zhang, X.C.; Jia, J.; Chen, J.Y. Experimental study on energy response characteristics of silty sandstone under cyclic loading. J. Eng. Geol. 2019, 27, 505–515. [Google Scholar]
  19. Xiao, F.; Jiang, D.Y.; Wu, F.; Zou, Q.L.; Chen, J.; Chen, B.; Sun, Z.G. Effects of prior cyclic loading damage on failure characteristics of sandstone under true-triaxial unloading conditions. Int. J. Rock Mech. Min. Sci. 2020, 132, 104379. [Google Scholar] [CrossRef]
  20. Zhang, Y.; Miao, S.J.; Guo, Q.F.; Wang, P.T. Microscopic energy evolution and rockburst tendency of stress threshold value of granite under cyclic loading. J. Eng. Sci. 2019, 41, 864–873. [Google Scholar]
  21. Vaneghi, R.G.; Ferdosi, B.; Okoth, A.D.; Kuek, B. Strength degradation of sandstone and granodiorite under uniaxial cyclic loading. J. Rock Mech. Geotech. Eng. 2017, 10, 117–126. [Google Scholar] [CrossRef]
  22. Bagde, M.N.; Petroš, V. Fatigue and dynamic energy behaviour of rock subjected to cyclical loading. Int. J. Rock Mech. Min. Sci. 2009, 46, 200–209. [Google Scholar] [CrossRef]
  23. Li, Z.Y.; Wu, G.; Huang, T.Z.; Liu, Y. Study on energy evolution law and strength failure criterion of shale under triaxial cyclic loading. Chin. J. Rock Mech. Eng. 2018, 37, 662–670. [Google Scholar]
  24. He, M.M.; Li, N.; Chen, Y.S.; Zhu, C.H. Study on damping ratio and damping coefficient of rocks under different cyclic loading conditions. Rock Soil Mech. 2017, 38, 2531–2538. [Google Scholar]
  25. Peckley, D.C.; Uchimura, T. Strength and Deformation of Soft Rocks Under Cyclic Loading Considering Loading Period Effects. Soils Found. 2009, 49, 51–62. [Google Scholar] [CrossRef]
  26. Guo, H.J.; Ji, M.; Zhang, Y.D.; Zhang, M. Study of Mechanical Property of Rock under Uniaxial Cyclic Loading and Unloading. Adv. Civ. Eng. 2018, 2018, 1670180. [Google Scholar] [CrossRef]
  27. He, M.M.; Zhang, Z.Q.; Zhu, J.W.; Li, N.; Li, G.F.; Chen, Y.S. Correction between the rockburst proneness and friction characteristics of rock materials and a new method for rockburst proneness prediction: Field demonstration. J. Pet. Sci. Eng. 2021, 205, 108997. [Google Scholar] [CrossRef]
  28. Wu, M.M.; Xia, Z.Q.; Wang, J.F. Constitutive modelling of idealised granular materials using machine learning method. J. Rock Mech. Geotech. Eng. 2023, 15, 1038–1051. [Google Scholar] [CrossRef]
  29. Zhao, J.S.; Jiang, Q.; Lu, J.F.; Chen, B.R.; Pei, S.; Wang, Z. Rock fracturing observation based on microseismic monitoring and borehole imaging: In situ investigation in a large underground cavern under high geostress. Tunn. Undergr. Space Technol. 2022, 126, 104549. [Google Scholar] [CrossRef]
Figure 1. Schematic illustration of fracture distribution.
Sustainability 15 13695 g001
Figure 2. Final qualified test sample.
Sustainability 15 13695 g002
Figure 3. Relationship between elastic strain energy and dissipated energy of rock under uniaxial compression.
Sustainability 15 13695 g003
Figure 4. The relationship between total energy and fracture angle of T-fracture specimen.
Sustainability 15 13695 g004aSustainability 15 13695 g004b
Figure 5. The relationship between the total energy absorbed by the T-fracture specimen and the loading rate.
Sustainability 15 13695 g005aSustainability 15 13695 g005b
Figure 6. The relationship curve between the elastic energy of the T-shaped fracture specimen and the fracture angle.
Sustainability 15 13695 g006aSustainability 15 13695 g006b
Figure 7. Curve of the relationship between elastic energy and loading rate of a T-fracture specimen.
Sustainability 15 13695 g007
Figure 8. Relationship curve between the dissipative energy of the T-shaped fracture specimen and the fracture angle.
Sustainability 15 13695 g008
Figure 9. Curve of the relationship between dissipative energy at peak value and loading rate of T-fractured specimen.
Sustainability 15 13695 g009
Figure 10. The relationship curve between the peak of the T-fracture specimen U e / U and the angle between the fractures.
Sustainability 15 13695 g010
Figure 11. The relationship curve between the peak of the T-fracture specimen U e / U and the load rate.
Sustainability 15 13695 g011
Figure 12. The relationship curve between the peak of the T-fracture specimen Ud/U and the angle between the fracture.
Sustainability 15 13695 g012
Figure 13. The relationship curve between the peak of the T-fracture specimen Ud/U and the load rate.
Sustainability 15 13695 g013
Figure 14. The variation curve of dissipated energy coefficient with strain of samples with different T-shape fractures.
Sustainability 15 13695 g014
Table 1. Experimental program.
Specimen TypeLoading Scheme
Loading MethodsLoading Rate (mm/min)
Complete specimenUniaxial compression test
Uniaxial step loading and unloading experiment
0.05
0.2
0.5
1
Fracture specimenUniaxial compression test
Uniaxial step loading and unloading experiment
0.05
0.2
0.5
1
Disclaimer/Publisher’s Note: The statements, opinions and data contained in all publications are solely those of the individual author(s) and contributor(s) and not of MDPI and/or the editor(s). MDPI and/or the editor(s) disclaim responsibility for any injury to people or property resulting from any ideas, methods, instructions or products referred to in the content.

