Abstract
Ecological corridors are effective strategies to address the environmental consequences of forest fragmentation by connecting fragmented areas through various techniques. This study aims to propose the implementation of an ecological corridor in the Itapemirim River basin in Espírito Santo, Brazil. The specific objectives of this study are as follows: delimiting the Permanent Preservation Areas (APPs) in the Itapemirim River watershed and comparing land use and land cover within these areas. The MapBiomas platform and Landsat 8 satellite images were utilized to map land use and land cover, while the criteria set by Law No. 12.651 were followed to define the APP boundaries. The calculation of the landscape ecology indices and the identification of the forest fragments with the highest potential for ecological corridor implementation were conducted using the Fuzzy logic. The QGIS 3.26 application, along with the LecoS 3.0.1 plugin and Fragstats 4.2, were employed to characterize and quantify landscape ecology indices. The costs assessment and determination of the optimal route for implementing the ecological corridor were performed, considering bothdistance and physical impediments. The least cost path algorithm was utilized, taking into account land use and land cover, APP, fragment potential, slope, and subnormal clusters. Evaluating land costs and expropriation expenses required to define the ecological corridor in the study area. The identified forest fragments for inclusion in the ecological corridor were the Caparaó National Park, the Serra das Torres State Natural Monument, and other selected fragments based on the application of Fuzzy logic to landscape ecology indices. The corridor route was determined using the least cost path algorithm, considering various factors. This study revealed that the predominant land use and land cover class in the area is pasture, and a significant portion (68.58%) of the designated Permanent Preservation Areas were in conflict with legal regulations. The bare land value per hectare for pasture was the second highest among the land use and land cover categories, accounting for 64.28% of the total. The priority area analysis indicated that 31.86% of the region had high or very high importance for forest restoration, while 42.97% had low or very low priority. The findings demonstrate that the least cost path algorithm, coupled with a multi-criteria decision-making approach using the Analytic Hierarchy Process (AHP), is a valuable tool for planning and implementing ecological networks. These methods effectively consider critical factors in decision-making processes related to the optimal location of the ecological corridor. In conclusion, this study provides insights into the implementation of an ecological corridor in the Itapemirim River basin, emphasizing the importance of considering multiple factors and utilizing appropriate methodologies for effective decision-making in ecological planning.
1. Introduction
The Itapemirim River basin (BHRI) is one of the primary basins in Espírito Santo, with an area of approximately 5946 km2 (594,599.095 ha). This watershed encompasses lands from the states of Minas Gerais (0.55% of its area) and Espírito Santo (99.45% of its area), and has various degrees of degradation due to territorial occupation marked mainly by livestock and coffee farming [1], as well as marble and granite mining industries [2,3].
The Itapemirim River basin (BHRI) is fully located in the Atlantic Forest, the basin is home to a large number of agricultural activities, mainly coffee farming and cattle raising, which have been responsible for deforestation, soil degradation, and water pollution. In addition, urbanization and industrialization have led to the growth of urban areas and the discharge of untreated sewage into the river, further aggravating water quality [4]. The combination of these factors has resulted in the degradation of natural resources and ecosystems, generating negative impacts on the health and livelihoods of the local population [4,5]. Therefore, it is essential to develop and implement sustainable environmental management practices in the BHRI to mitigate these problems and ensure the preservation of its natural resources [4,6]. The remaining forest fragments in this basin have now become fundamental for maintaining the biome. The loss of natural forests, combined with a more recent process of intensification of fragmentation, has resulted in landscapes with little diversity of natural habitats [7]. One of the consequences of forest fragmentation is the loss of genetic diversity, caused by the reduction in natural ecosystem areas [8,9]. In addition, it increases the risks of inbreeding and favors the establishment of invasive species. Fragmentation affects not only species but also the entire landscape structure, with implications for essential ecosystem services which maintain biodiversity and human populations, such as climate regulation, air quality, changes in the hydrological regime, watershed flooding and siltation, soil erosion, floods, and epidemics [10,11,12].
In this context, ecological corridors can generate improvements in environmental services and the quality of natural resources, since they can be formed by forest and agroforestry systems, with economic returns that will benefit both wildlife and local community residents [13].
Ecological corridors (ECs) function as a viable way to mitigate the environmental impact resulting from forest fragmentation, via the interconnectivity of forest fragments, through different forms [14,15]. Some authors and environmental protection organizations recognize the importance of adopting corridors for landscape connectivity, through the restoration of biodiversity, reducing the risks of species extinction and maintaining the resilience of ecosystems in various parts of the planet [16,17,18,19]. It is important to consider spatial factors in the implementation of ecological corridors in a hydrographic basin, including the distance between fragment edges, optimal paths for fauna translocation, distance to water bodies, availability of water in quality and quantity, and the presence of physical barriers such as roads and cities [20]. Some studies have shown that the paths chosen by animals between forest fragments take into account cost-benefit considerations, such as the presence of food, ground cover, and topographical obstacles [21].
One method to support the creation of ecological corridors across the landscape is the least-cost path analysis (LCP) algorithm, using Geographic Information Systems (GIS) [22]. Through LCP analysis, it is possible to determine the optimal flow route between two points within a priority matrix, which are assigned based on previously established criteria [19,23,24]. Among the main advantages, we can also highlight flexibility, which allows for its adaptation in different contexts and scales, according to the specific needs of each situation. However, there are also some associated disadvantages, such as limited consideration of local reality, where the method tends to only consider the technical and economic aspects of EC delimitation, without taking into account local particularities and the needs of the communities involved. It can also overlook important cultural and social aspects for the implementation and maintenance of the ecological corridor, such as the participation and involvement of local communities.
In addition to the LCP method, Fuzzy logic [25,26] corresponds to an extension of the Boolean logic, which allows for flexibility in models that involve uncertainties regarding acceptable or unacceptable limits, acceptable and not acceptable, it allows for intermediate values between true and false, being suitable for problems that do not have well-defined boundaries [27]. The fuzzy concept has been implemented in various fields of knowledge with convincing results, such as mapping flood susceptibility [18] and developing fire risk maps [28]. Therefore, this study aims to benefit the Itapemirim River hydrographic basin through the implementation of ecological corridors, as it can bring a better use directly to the biota, as there is greater efficiency in the environmental management of protected areas, as well as benefits to the soil and water resources in the surrounding areas.
2. Materials and Methods
2.1. Characterization of the Study Area
The Itapemirim River basin (BHRI) is one of the primary basins in Espírito Santo (ES), Brazil, between latitudes 20°9′36″ and 21°7′12″ South and longitudes 40°46′13.08″ and 41°52′19.92″ West, with an area of 6.181 km2 (Figure 1). This watershed encompasses lands from the states of Minas Gerais (0.55% of its area) and Espírito Santo (99.45% of its area), and has various degrees of degradation due to territorial occupation marked mainly by livestock and coffee farming [1], as well as marble and granite mining industries [2,3]. It covers the municipalities of Alegre, Atílio Vivácqua, Castelo, Conceição de Castelo, Cachoeiro de Itapemirim, Itapemirim, Iúna, Irupi, Ibatiba, Jerônimo Monteiro, Marataízes, Muqui, Muniz Freire, Presidente Kennedy, Vargem Alta, Venda Nova do Imigrante, and part of the municipality of Lajinha in the state of Minas Gerais [28].
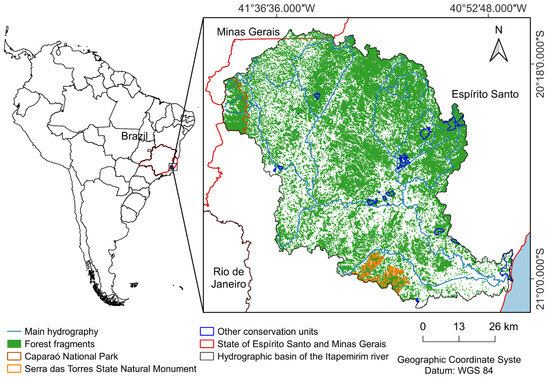
Figure 1.
Hydrographic basin of the Itapemirim River, with emphasis on forest remnants and protected areas.
Two main types of climate are identified in the BHRI, namely subtropical highland climate with dry winter and mild summer (Cwb), with average temperatures below 22 °C, subtropical with dry winter (with average temperatures below 18 °C) and hot summers (with temperatures above 22 °C) (Cwa), and tropical, with rainy season in the summer from November to April, and dry season in the winter from May to October (Aw) [29].
2.2. Database
Land Use land Cover (LULC)
The overall accuracy was obtained via MapBiomas (2020), which accounted for 90.99%, with a 2.33% of area disagreement and a 6.67% of allocation disagreement, a cross-tabulation of sample frequencies of the mapped classes was performed. A sample evaluation of pixels, composed of approximately 75,000 samples, was conducted, in which the number of samples is pre-established via statistical sampling techniques, using metrics that compare the mapped class with the class evaluated by technicians in the reference database.
For the analysis of land use and land cover changes (LULC), the LULC data from MapBiomas for the year 2021, collection 7.0, with a spatial resolution of 30 m and annual temporal resolution, were used. The images were exported from the Google Earth Engine cloud platform and processed using QGIS software version 3.26.
MapBiomas is a dataset that provides annual dynamics of land use and land cover (LULC) in Brazilian biomes, where annual maps are produced from pixel-by-pixel classification of Landsat satellite images. The processing is carried out using machine learning algorithms through the Google Earth Engine platform [30,31]. The choice of the year 2021 is based on the characteristics of the satellite type, as the most recent collection was released from this period. The use of MapBiomas product is driven by its availability, accessibility, and applicability with pre-classified data.
The class of paved/unpaved roads described in Table S1 was obtained by downloaaing it from the open-source OpenStreetMap application, which contains paved and unpaved roads at a global level. These roads are generated through civilian use of the application.
The first step was to define the projection of the roads for compatibility with the Land Use and Land Cover (LULC) data, as well as delineate the watershed and Conservation Units. Subsequently, the selection of roads within the watershed area was performed, and a buffer of 15 m on each side was created, totaling a width of 30 m for paved/unpaved roads. This value does not represent the reality, as paved roads typically have an average width of 10 m. However, a value of 30 m was adopted due to the working scale, where the other LULC classes were generated with 30-m pixels. The final step involved converting the vector data to raster, with cells of 30 m, and updating this class in the LULC data.
2.3. Delimitation of Permanent Preservation Areas (APPs)
The Brazilian Forest Code, also known as Law No. 12651, was enacted on 25 May 2012, replacing the previous code that was in place since 1965. The Forest Code establishes rules for the use and conservation of forest resources in Brazil, aiming to balance environmental protection with economic development. The new code introduces significant changes, such as the recognition of the importance of rural properties for biodiversity conservation the inclusion of measures to promote the recovery of degraded areas and the regularization of rural properties.
Therefore, for the delimitation of APP, four classes were considered (Table S2), according to Law No. 12651 of 25 May 2012, which establishes criteria, definitions, and limits of APPs [32]. All methodological steps for mapping the APPs were carried out in the QGIS software, version 3.26.
- Mapping of APPs for watercourses:
For watercourses, the “buffer” command was applied to delimit buffer zones of 30 m on each side, considering that during the rainy season, the width of each watercourse does not exceed 10 m. However, the BHRI has watercourses that exceed 10 m in width during the rainy season, and to map them, it was necessary to use land use and land cover data.
After obtaining the land use and land cover data for the BHRI, the water bodies were imported in polygonal format, and the water bodies class was edited to remove polygons of lakes, lagoons, and reservoirs, among others. This allowed for the selection of polygons that delimit watercourses, where for each segment with a width greater than 10 m the “buffer” command was re-applied. Subsequently, the “union” command was applied after using the “buffer” command of 30 m on the watercourses with different categories, generating the final watercourse APP results. For rivers with widths of 30, 40, and 50 m, a buffer zone width of 50 m will be adopted. For rivers with widths of 60, 80, 90, 100, and 190 m, a buffer zone width of 100 m will be adopted. Finally, for rivers with widths of 220, 240, and 500 m, the buffer zone width will be 200 m.
- Mapping of the APP for springs:
The springs were manually marked using the QGIS version 3.26 editor, based on the hydrography generated in the previous step. Each watercourse’s beginning was marked with a point, generating a point vector containing 576 springs. After this step, the “buffer” command available in QGIS version 3.26 was executed to delimit a 50-m preservation radius around each of the springs, resulting in the delineation of the APP of springs.
- Mapping of the APP of slope:
Using the SRTM (Shuttle Radar Topography Mission) elevation data, specifically SRTM V3 provided by NASA, the Digital Elevation Model (DEM) of the study area was reprojected and added to QGIS version 3.26, where slope values of the BHRI (Itapemirim River basin) were calculated. Subsequently, slope values were classified, assigning NoData to slopes less than 45 degrees and a value of 1 to slopes greater than this threshold. The resulting raster from this processing was converted to vector, generating the APP of slope.
- Mapping of the APP of top of hill:
According to Law No. 12651/2012 (Brazilian Forestry Code), “top of hills, hills, mountains and mountains, with a minimum height of 100 (one hundred) meters and an average slope greater than 25°, the areas delimited from the contour corresponding to 2/3 (two thirds) of the height minimum elevation always in relation to the base, which is defined by the horizontal plane determined by the plain or adjacent body of water or, in undulating reliefs, by the elevation of the saddle point closest to the elevation”. (Table S2).
The methodology of Silva et al. was used within the QGIS software version 3.26, and it involves several steps, from image acquisition to obtaining the APP zones, including the following:
- 1.
- Download of SRTM scenes for the study area;
- 2.
- Removal of elevation values ≥1800 m using the “Raster Calculator” tool;
- 3.
- Execution of the “r.fill.dir” algorithm to fill spurious depressions in the Digital Elevation Model (DEM) and obtain the Hydrologically Consistent Digital Elevation Model (HCDEM).
- 4.
- Inversion of the HCDEM using the following equation, executed via the “Raster Calculator”, and obtaining the raster “mdehc_inv”:
- hcdem_inv = (HCDEM − 10000) × (−1)
- 5.
- Execution of the “r.terraflow” algorithm on the “mdehc_inv” raster to obtain the limits of the peaks’ base, resulting in the output raster “limite_bases”;
- 6.
- Conversion of “limite_bases” to vector format, keeping the same name;
- 7.
- Execution of the “Zonal Statistics” tool, using the “limite_bases” vector on the “hcdem” raster. This tool calculates maximum, minimum, mean, range, and other values within the raster, considering the limits of the vector. Output: “zonal_statistics_hcdem”;
- 8.
- Calculation of the slope, in degrees, from the “hcdem” raster. Output raster: “slope”;
- 9.
- Execution of the “Zonal Statistics” tool, using the “limite_bases” vector on the “slope” raster. This aims to obtain the average slope for each area. Output: “zonal_statistics_slope”;
- 10.
- Selection and extraction of average slopes >= 25 degrees (from the “zonal_statistics_slope”);
- 11.
- Calculation of the range in the “zonal_statistics_hcdem” layer (adding the “amplitude” column):
- amplitude = altitude_max − altitude_min
- Note: after the execution of “Zonal Statistics”, the “range” column can be used as equivalent to amplitude, as it represents the difference between the maximum and minimum values.
- 12.
- Selection and extraction of features where the value of “amplitude” >= 100 m;
- 13.
- Identification of areas where slope >= 25 degrees and amplitude >= 100 m using the “extract by location” tool, predicate “equal”;
- 14.
- Calculating the minimum height for the upper third: adding a column “terco” to the previously extracted layer (item 13):
- terco = altura_maxima − (amplitude/3)
- 15.
- Rasterizing the resulting layer from the previous step, using the column “terco” as the output value (output raster: “min_alt_terco”). This procedure can be carried out using the “v.to.rast” algorithm;
- 16.
- Extracting from “hcdem” the pixels where the values are greater than or equal to “min_alt_terco”. Output: “app_topofhill”;
- 17.
- Vectorizing “app_topofhill”, exporting only the pixels with value = 1. Output: “app_topofhill_final”.
- Mapping of the total APP:
The map of the total APPs of BHRI was generated by grouping the data acquired individually from each of the four APP classes. The tabular cross-tabulation technique was used to quantify and determine the percentage of each land use and land cover class in the APP total, through map overlay.
2.4. Comparison of Land Use and Land Cover with Permanent Preservation Areas (APPs)
The comparison between the thematic maps of LULC and the APPs was carried out through the “clip” tool for the analysis of the APP total in QGIS version 3.26. The classes of forest, non-forest natural formation, rocky outcrop, and water bodies were considered as suitable land use and land cover (non-conflicting) because these are natural land use and land cover classes, while the other classes were considered to be in conflict with the forest code.
2.5. Selection of Forest Fragments Based on Landscape Ecology Metrics Indices
The characterization and evaluation of forest landscape ecology metrics were performed using the QGIS software version 3.26, Fragstats 4.2, and the LecoS plugin 3.0.1.
2.5.1. Landscape Ecology Metrics Indices
The polygons of forest fragments were selected from the land use and land cover map obtained from previous steps, resulting in a vector file of forest fragments. In order to compare conservation indices, the fragments were grouped based on their area, following the classification proposed by Santos et al., as very small (C1 < 10 ha), small (10 ≤ C2 < 50 ha), moderate (50 ≤ C3 < 100 ha), and large (C4 ≥ 100 ha). A buffer distance of 100 m was adopted for measuring central area metrics. The metrics used for quantifying landscape structure are described in Table S3.
2.5.2. Selection of Forest Fragments Using Fuzzy Logic
The fragments belonging to the “very high” class within the Fuzzy Gamma application. Were considered as having better preservation potential.
The database for the application of Fuzzy logic was created in the computation applications Microsoft Excell® and QGIS 3.26. It was generated from the previous methodological stage, using the metrics by fragments. The landscape metrics vectors area, border, shape and central area selected for characterization of the importance of the fragments were converted into a raster with a size of 30 m cell. For each raster image, a pertinence function was defined with a degree of certainty that varies between “0 and 1”, in which the forest fragment with the highest degree of conservation and, consequently, the greatest potential for the passage of the ecological corridor was indicated when the real value of the variable assumes “1” and fragments with zero potential to integrate the ecological corridor were indicated when the real value of the variable assumes “0”, according to [27].
The structuring to be carried out with the Fuzzy logic allows for a more realistic point of view when compared to other techniques due to its flexible description. There is less interference from the researcher, since the weight of each variable is not defined, but the maximum, average and minimum for the data to be accepted in the model are defined [33,34].
Metrics were selected by excluding the redundant metrics and selecting representative metrics from the groups specified in Table S3, with CA, TE, TCA, ED and MSI considered important for determining the degree of preservation of the fragments and, consequently, the relevance of adhesion of these fragments in the formation of EC.
For the CA, TE and TCA metrics, the increasing sigmoidal functions (Fuzzy Large) were adjusted for each fragment. This function makes it possible to represent the gradual variation around the matrix image, in which fragments that will come to be considered as priority where larger area values have a greater chance of assuming a value of 1. The value to be defined at the central point was the one that confers a degree of relevance of 0.5 with a propagation value of 5.
The Fuzzy Small function was applied to the ED and MSI metrics, since for these variables, smaller input values will produce outputs closer to 1. The value defined at the central point was the one that yielded a degree of membership of 0.5.
The Jenks optimization method, which has the spatial reclassification function, was applied to the matrix images of the metrics CA, TCA, TE, ED and MSI, generating the following classes of fragments: very high potential, high potential, moderate potential, low potential and very low potential.
After the previous steps (Fuzzy Small and Fuzzy Large), Fuzzy Gamma was applied to combine the variables (CA, TE, TCA, ED and MSI). The Fuzzy Gamma operator makes it possible to handle a set of variables that have diffuse values through an overlay technique, in which it allows to increase the effect of the Fuzzy sum and decrease the effect of the Fuzzy product to be combined [35].
As the objective of this stage is to select the fragments with the greatest potential for passing through the ecological corridor with values closer to 1, the value of the γ parameter used was 0.90.
The matrix resulting from the overlapping of variables was called the Landscape Ecology Index (LEI). Finally, the Jenks optimization method, which has the spatial reclassification function, was applied to the raster image resulting from the superimposition of variables (LEI), producing the following classes of fragments: very high potential, high potential, moderate potential, low potential and very low potential.
2.6. Delimitation of the Ecological Corridor (EC)
For the delimitation of the ecological corridor, we used the Brazilian resolution of National Council for the Environment, CONAMA n° 09/96, and, the width of the EC was established at 50%, this council, is a consultative and deliberative body created in 1981 with the purpose of advising the government in the formulation of public policies for the environment. CONAMA is composed of representatives from the government, civil society, and specialists in environmental areas, which establishes the criteria and guidelines for the preparation of environmental impact studies (EIRs) and environmental impact reports (EIR) for activities with significant environmental impact. This resolution is important because it aims to ensure the protection of the environment and public health through the analysis and evaluation of the environmental impacts of human activities and projects. Environmental impact studies are technical documents prepared by companies and specialized professionals that aim to evaluate the possible environmental impacts of a project or activity and propose mitigation and compensation measures to minimize these impacts. On the other hand, the EIR is an informative document that aims to present the results of the environmental impact studies and their conclusions to society in a clear and objective way. This resolution is extremely important because, by requiring the preparation of environmental impact studies and EIRs for activities with significant environmental impact, it contributes to the protection of the environment and guarantees sustainable development. Through the analysis and evaluation of the environmental impacts of projects and activities, it is possible to adopt mitigation and compensation measures that minimize these impacts and ensure the protection of the environment and public health.
The spatial basis used was derived from the previous steps: (a) boundary of the Itapemirim river basin, (b) land use and occupation, (c) Permanent Preservation Areas defined in accordance with the current Brazilian legislation, (d) index of landscape ecology, (e) Digital Elevation Model, (f) source polygon, Caparaó National Park, (g) destination polygon, Serra das Torres State Natural Monument.
The UCs, Caparaó National Park and Serra das Torres State Natural Monument, as a model area for the application of the methodology created because both selected units have significant importance for the conservation of the region’s biodiversity, containing several endemic and endangered species. Caparaó National Park is known for housing Pico da Bandeira, the third highest point in Brazil, as well as remnants of the Atlantic Forest and altitude fields. Serra das Torres State Natural Monument, on the other hand, is a conservation unit created with the objective of preserving a high-altitude Cerrado with rare and endangered species. These factors will allow for the evaluation of the effectiveness of ecological corridor proposals in the context of BHRI, contributing to conservation planning and management in the region.
Least cost path analysis, will consist of determining the path of least resistance between two points (origin and destination). The resistance of each cell is represented by weights, based on a factor, or combination of factors, that affect the passage through the area.
Priority matrix images were generated, which represent a factor or combination of factors, as in the case of landscape metrics, affecting movement across an area. Costs will be defined in a way such that it prevents or limits the possibility of the corridor passing through undesirable areas such as built-up areas and roads. For each class, the suitability cost was determined, on a scale of 1 to 100, with the highest costs attributed to those where corridors should not pass, according to the different forms of use, giving rise to the friction map. Based on the LULC map, the costs were defined for each class, as shown in Table S4. The Permanent Preservation Areas, springs, watercourses, slope and hill top, in addition to areas of Subnormal Clusters (SBCL) are urban areas with poor housing and infrastructure conditions, characterized by the presence of impoverished housing, irregular occupations, lack of basic sanitation, deficient public services, and environmental and social risks. These areas are also known as favelas, cortiços, irregular settlements. The lack of adequate housing policies and social exclusion in the context of urban occupation contributed to the formation of these areas, which are a common historical phenomenon in Brazilian cities. Most of the residents of these settlements are low-income families with no access to decent housing facilities and face various difficulties in accessing basic living conditions.
With the purpose of creating a cost surface to delineate the route of the ecological corridor, different cost values will be assigned to regions with Permanent Preservation Areas and areas those without them. Permanent Preservation Areas will be assigned a cost value of 1, while regions without Permanent Preservation Areas will be assigned a cost value of 100.
With the purpose of creating a cost surface to map the trajectory of the ecological corridor, a different cost value will be assigned to areas that have subnormal clusters compared to areas that do not. Locations with subnormal clusters will be assigned a cost value of 100, while locations without subnormal clusters will be assigned a cost value of 1.
The selected forest fragments, through the analysis of the landscape ecology indices, received varying cost values: very high potential received a cost of 1, since it generates a matrix image that allows the corridor to pass through such areas, very low potential received a cost of 20, which makes the passage of the corridor in this area less interesting than in areas containing fragments of very high potential, but no less interesting than areas of forestry.
In order to generate a cost surface to delineate the paths of the ecological corridor, specific cost values will be assigned to different types of areas. Areas without forest fragments will be assigned a cost of 30. Forest fragments with very low, low, medium, high, and very high potential will be assigned costs of 20, 10, 5, 2, and 1, respectively.
The slope map was obtained using a 30 m SRTM image, divided into three classes: low (slope < 20°); moderate (slope between 20 to 45°) and high (slope > 45°). As terrains with gentler slopes demand less energy expenditure by the fauna, these areas had a lower cost.
Based on the assigned weights, priority matrix images were generated for each parameter. For each raster image, its respective statistical weight was calculated using the Analytic Hierarchy Process—AHP [36] hierarchical method, as shown in Table 1.

Table 1.
Paired comparison matrix and the statistical weights obtained via the AHP method for the elaboration of the ecological corridor.
Using the matrix cost images of each parameter and their respective statistical weights, we obtained the total priority matrix image (Equation (1)).
- WC: total cost raster image (dimensionless);
- : statistical weight of land use and land cover cost raster image (dimensionless);
- : statistical weight of riparian forest protection cost raster image (dimensionless);
- : statistical weight of landscape ecology index cost raster image (dimensionless);
- : statistical weight of slope cost raster image (dimensionless);
- : statistical weight of subnormal agglomerate cost raster image (dimensionless);
- : land use and land cover cost raster image (dimensionless);
- : riparian forest protection cost raster image (dimensionless);
- : landscape ecology index cost raster image (dimensionless);
- : slope cost raster image (dimensionless); and,
- : subnormal agglomerate cost raster image (dimensionless).
2.7. Priority Areas for Forest Recovery
The EC design and priority areas for forest restoration are related because both aim to conserve biodiversity and promote connectivity between fragmented native vegetation areas.
The EC consists of a strip of vegetation that links fragmented natural areas, allowing for the movement of animals and the dispersal of seeds between them. This connectivity is essential for the survival of many species and for the maintenance of ecological processes.
In turn, priority areas for forest restoration are those with the greatest potential for the restoration of degraded ecosystems or the conservation of remaining natural areas. These areas may be located inside or outside EC, but their restoration contributes to the connectivity and resilience of these corridors.
Therefore, the EC design should take into account priority areas for forest restoration in order to promote connectivity and ecosystem restoration throughout its length. The restoration of these areas can also contribute toward increasing the diversity of habitats and species present in the EC, making it more resistant to disturbances and environmental changes.
To define the priority areas for recovery and conservation at the BHRI, pedology and lithology data provided by GEOBASES and the thematic map of biological importance from the Ministry of the Environment—MMA were used. They were converted to matrix format (raster), and their respective statistical weight was calculated using the Analytic Hierarchy Process—AHP [36]. Weights from 1 to 100 were assigned to the degree of relevance that the Information Plans (IPs) contained regarding the conservation of forest fragments and water resources within the hydrographic basin and the ecological corridor, where the lowest values were considered as areas with greater interest for preservation and the highest value, were the places with less interest for environmental conservation.
The slope map was created with the Slope tool, using the DEM of the Itapemirim river basin, where it was subsequently reclassified into their respective classes.
With the assigned weights, priority matrix images were generated for each Information Plan (IP). For each raster image, its respective statistical weight was calculated using the Analytic Hierarchy Process—AHP [36]. The AHP is a multicriteria decision method for judging the relative weights of the different factors in the model. Pairwise comparison matrices are constructed and preferences are summarized in terms of relative importance value [37] (Table 2).
Table 2.
Paired comparison matrix and the statistical weights obtained via the AHP method for the elaboration of priority areas for recovery and conservation.
With the priority matrix images of each parameter and their respective statistical weights, the total priority matrix image was obtained (Equation (2)).
- WT2: total cost raster image (dimensionless);: statistical weight of land use and cover cost raster image (dimensionless);
- : statistical weight of APP cost raster image (dimensionless);
- : statistical weight of pedology cost raster image (dimensionless);
- : statistical weight of lithology cost raster image (dimensionless);
- : statistical weight of slope cost raster image (dimensionless);
- : statistical weight of biological importance cost raster image (dimensionless);
- : land use and cover cost raster image (dimensionless);
- : APP cost raster image (dimensionless);
- : pedology cost raster image (dimensionless);
- : lithology cost raster image (dimensionless);
- : slope cost raster image (dimensionless);
- : biological importance cost raster image (dimensionless).
2.8. Confrontation of Land Use and Land Cover with Priority Areas for Recovery within the EC
The thematic maps of land use and land cover and priority areas were compared using tool cut to analyze the moderate, high and very high classes, in QGIS version 3.26, since these classes require greater planning and implementation of appropriate conservation measures than the low and very low priority classes.
2.8.1. Costs to Define the EC
The values of bare land (VBL) per hectare were based on data from the Federal Revenue for the year 2022. Five classes of land use were considered: mosaic of uses, pasture, planted forest, wildlife and flora preservation, and others, with values of 15,239.52, 12,911.90, 6400.88, 3840.54, and 8511.52, respectively.
3. Results
The mapping of land use and land cover in the Itapemirim River basin for the year 2021 is shown in Figure 2. The quantification in hectares and the percentages in relation to the study area are shown in Table 3.
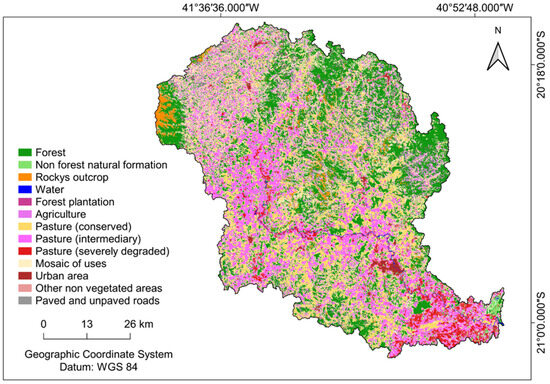
Figure 2.
Classes of use and land cover of the Itapemirim River basin for the year 2021.
Table 3.
Land use and land cover of the Itapemirim River basin for the year 2021.
3.1. Classification of Land Use and Land Cover (LULC)
The predominant use of the basin is forest, with 27.78% (168,601.94 ha) of the study area. The Forest class occupies 28.35% of the territory (168,601.93 hectares), formed mostly by hilltops, since they make it difficult to use agricultural machinery and implements, and Conservation Units.
3.2. Permanent Preservation Areas (APP)
The mapping of APPs in the Itapemirim River basin is shown in Figure 3, and the areas of different types of APPs and their respective percentages are shown in Table 4.
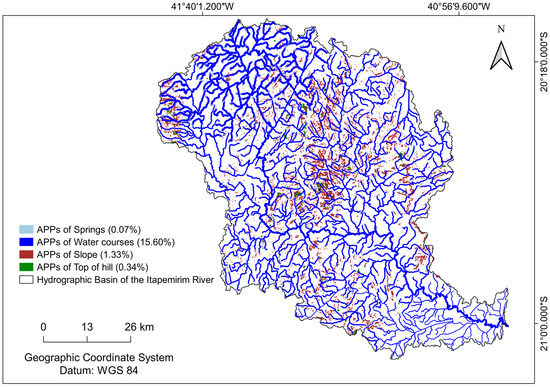
Figure 3.
Permanent Preservation Areas of the Itapemirim River basin, ES, Brazil.
Table 4.
Areas of different types of APP and their percentages in relation to the total APP areas for the basin.
The areas close to the springs are of great importance for the supply of water to the watercourses. This APP category is the one that occupies the least area within the BHRI, being associated with the number of mapped springs (576).
Watercourse APPs guarantee the stability of the banks, control soil erosion and water quality and, prevents the carry-over of sediments, nutrients and chemicals from the higher parts of the land. This width of this category of APP is associated with the width of the water course, since the BHRI has water courses with a width greater than 10 m. The APP area of watercourses were the ones that showed the greatest expression, constituting 89.88% of the APP area (92,772.71 hectares), equivalent to 15.6% of the basin’s territory.
The slope APPs were obtained from areas with a slope greater than 45°, which is equivalent to 1.332% of the basin area. Due to the topography of the basin, the hilltop APPs have the second lowest expression (2070.247 hectares), equivalent to 0.35% of the basin’s territory.
3.3. Confrontation of LULC with APP
The results of the confrontation obtained through the tabular crossing of the APP and LULC maps are shown in Figure 4 and Table 5.
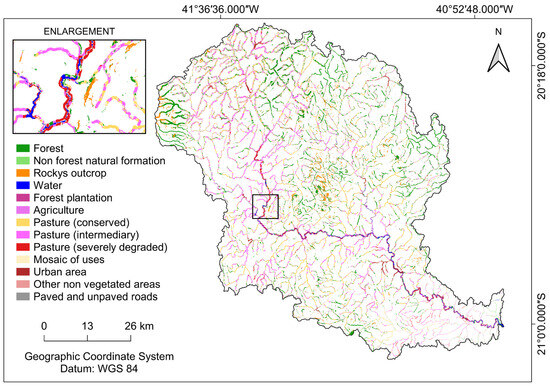
Figure 4.
Confrontation of LULC in relation to APP Total.
Table 5.
Confrontation of LULC in relation to total APP.
The total areas allocated for APP, according to the forest code, 68.95% (72,006.31 hectares) are in the conflicting use zone LULC, while the classes of forest, non-norest natural formation, rocky outcrops and water are in accordance with the conserved LULC.
A large part of the APP is degraded due to the negative impact of the mosaic classes of uses, agriculture and pasture (intermediate), since together they occupy 46.61% of the area designated for environmental protection.
The LULC in Permanent Preservation Areas demonstrates the low degree of preservation in which the BHRI finds itself. Due to the low percentage of Forest in the APP (24.04%), it cannot perform its primary roles, such as soil stability, hydrological control, soil erosion control, and the avoidance of the entrainment of sediments, nutrients and products chemicals.
3.4. Analysis of Landscape Ecology Indices and Selection of Potential Forest Fragments Using Fuzzy Logic
The distribution of forest fragments in the BHRI, by size class, can be seen in Figure 5 and Table 6. A total 2207 forest fragments were registered, with a total area of 168,601.936 ha, representing 28.35% of the BHRI area.
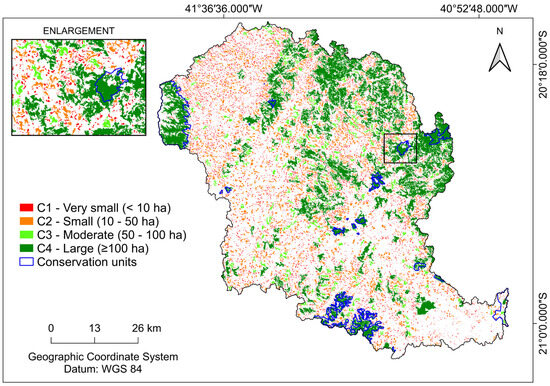
Figure 5.
Forest fragments by size class in the Itapemirim River basin.
Table 6.
Areas of different sizes of forest fragments and their percentages in relation to the sum of the area of fragment classes.
The amount of forest fragments present in the BHRI reveals the state of conservation a region, in which the importance of diagnoses and practices that promote the conservation of local flora species stands out.
The largest forest fragments of class C4 present in the BHRI are located in the Conservation Units (UCs), namely Caparaó National Park, White Eagle Private Natural Heritage Reserve and Serra das Torres State Natural Monument. This demonstrates the relevance of the Conservation Units in environmental preservation. It is also noted that the classes of forest fragments C1 and C2 are homogeneously distributed throughout BHRI; this is not the case with forest fragments of larger size, classes C3 and C4, since they form more isolated groupings and with greater distances between fragments of the same class. The BHRI landscape ecology indices by class size are presented in Table 7.
Table 7.
Landscape ecology indices calculated for the Itapemirim river basin area.
The edge metrics show the highest total edge value (TE) for the very small fragments class (10,787,900 m), which is associated with the highest value for the C1 class. Because it is an absolute measure of the total edge length, the study of size classes for this metric may not be relevant for edge density.
Edge density (ED) expresses the value of edge size (TE) in relation to the area occupied by each size class (CA). It is inversely proportional to the area occupied by the size class. Class C4, which has the largest fragment area (100,907.0 ha), has the second highest border density (61.53 m·ha−¹). However, classes C2 and C3 have the lowest edge densities, 31.24 and 11.96 m·ha−¹, respectively.
The mean fractal dimension (MPFD) is the most common shape metric, in which the values of variables are normally between 1 and 2, and the closer the value is to 1, the simpler the shape of the fragment. Therefore, the greater the fractal dimension and the greater the shape index, the more irregular the fragments. This fact corroborates the results obtained in this study, since fragments from class C4 have the highest value for the fractal dimension, MPFD (1.44) and the highest MSI (6.25), while fragments from class C1 have the lowest values of MSI (1.43), and class C2 fragments had lowest MPFD values (1.35). These reinforce that the fragments of class C4 are the ones with the most irregular shapes and those of classes C1 and C2 have more regular shapes. When analyzing the total central area (TCA) of each class, it was observed that class C4 had the highest value, with 73,942.94 ha and class C1 had the lowest TCA, with 4851.81 ha, highlighting a smaller edge effect of the larger fragments, even though they have a more complex shape.
The degree of isolation of the forest fragments, expressed by the average distance from the nearest neighbor (MNND), showed a direct correlation with the size of the fragment. Fragments of class C4 showed greater isolation (1785.95 m) than fragments of class C1 (215.55 m), which strengthens the importance of fragments of class C1, as elements of connection, which can function as ecological corridors and/or trampolines.
In the Fuzzy Large function for the variables CA, TCA and TE, the higher values express greater conservation, and consequently, greater potential for implementing the ecological corridor, they are, shown in Figure 6. The Fuzzy Small function allowed to represent the gradual variation around the matrix image, in which lower input values are more likely to assume a value of 1, as evidenced in the ED and MSI variables (Figure 7).
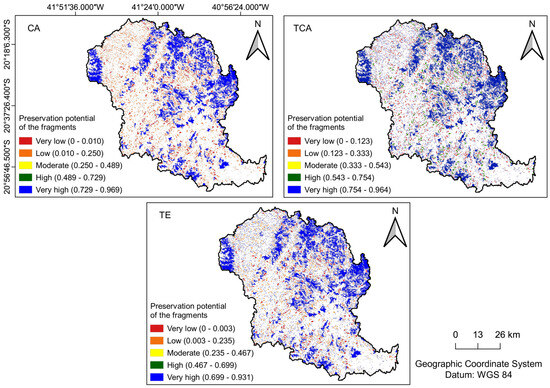
Figure 6.
Spatial discretization of the Fuzzy variables of CA, TCA and TE at BHRI.
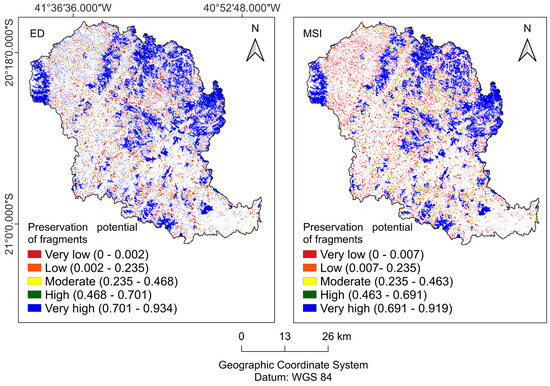
Figure 7.
Spatial discretization of the Fuzzy variables of ED and MSI in the BHRI.
The reclassified forest fragments generated from the matrix resulting from the overlapping of selected landscape ecology index (IEP) variables are shown in Figure 8.
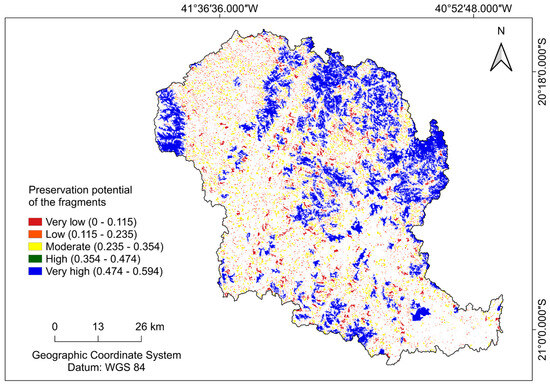
Figure 8.
Classification of potential forest fragments to constitute the ecological corridor at BHRI.
The fragments with the highest potential for ecological corridor implementation are present in the Conservation Units (UCs) (Figure 8), including Caparaó National Park, Alto da Serra Private Natural Heritage Reserve, Forest of Flowers State Park, Forno Grande State Park, Águia Branca Private Natural Heritage Reserve, Fazenda Boa Esperança Private Natural Heritage Reserve, Pacotuba National Forest, and Serra das Torres State Natural Monument.
The majority of the fragments belonging to BHRI were categorized as having low potential for ecological corridor implementation, totaling 18,162 (75.92%) forest fragments.
3.5. Ecological Corridor (EC)
The proposal for implementing the corridor to connect the forest fragments of BHRI is presented in Figure 9.
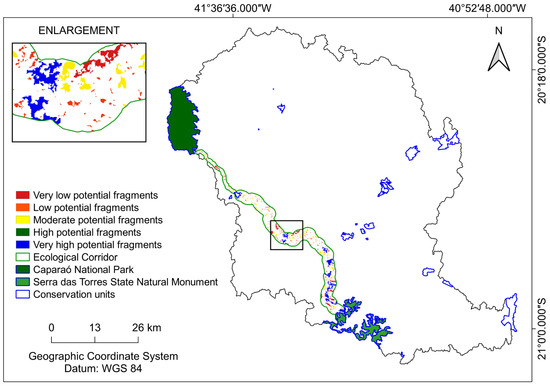
Figure 9.
Proposed ecological corridor between Caparaó National Park and Serra das Torres State Natural Monument.
The least-cost path methodology, considering the raster images of LULC, slope, APP, SBCL, and LEI (Fuzzy Gamma), projected the path with the lowest resistance cost along the surface. Two ecological corridors were generated, one between Caparaó National Park and Cachoeira da Fumaça State Park, with a length of 21.27 km and a width of 1064 m, and a second corridor between Cachoeira da Fumaça State Park and Serra das Torres State Natural Monument, spanning 65.96 km in length and 3298 m in width.
The mapping of LULC in the EC of BHRI is presented in Figure 10. The quantification in hectares and the percentages relative to the total area of the EC are presented in Table 8.
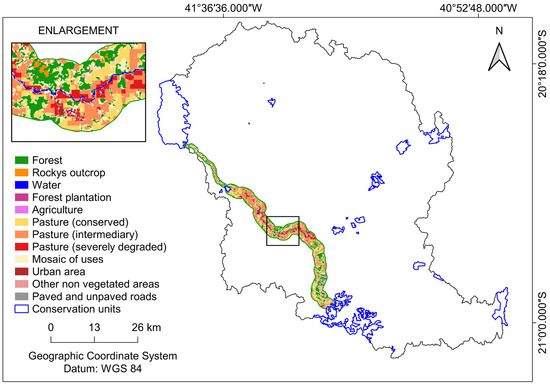
Figure 10.
LULC in the proposed CE between Caparaó National Park and Serra das Torres State Natural Monument.
Table 8.
LULC in the proposed ecological corridor in the Itapemirim river basin.
The predominant LULC within the ecological corridor is the intermediate pasture class, representing 29.23% of the area (4284.43 ha). The Forest class includes 661 forest fragments within the ecological corridor, but it represents only 22.41% (3284.19 ha) of the CE area. Over 70% of the territory designated for the ecological corridor is composed of LULC that is in conflict with the Forest Code, while just over 25% of the same territory is composed of LULC which is—not in conflict with the Forest Code.
3.6. Analysis of Priority Areas for Forest Recovery
The mapping of priority areas for forest restoration in BHRI is presented in Figure 11. The quantification in hectares and the percentages relative to the study areas are presented in Table 9.
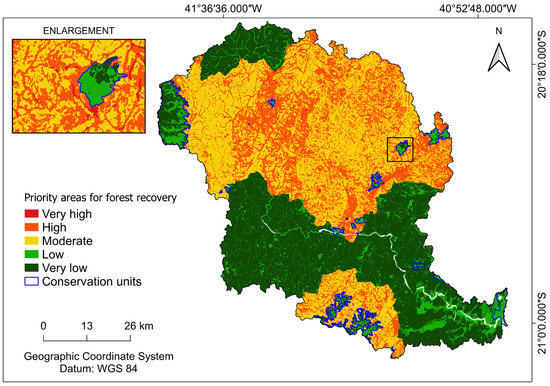
Figure 11.
Priority areas for forest restoration in BHRI.
Table 9.
Priority areas for forest recovery at BHRI.
The criterion that received the highest weight from the application of the AHP method to define the priority areas for forest restoration in BHRI was the Permanent Preservation Areas (APPs).
Slope was the fourth factor with the highest weight. Areas with steeper slopes result in increased water velocity and transport capacity, leading to higher susceptibility to erosion in BHRI. When combined with soil type, this vulnerability can be further exacerbated, as soil physical and chemical characteristics also influence erosion.
It is noticeable that a large portion of the areas designated as Conservation Units (UC) remain at Low and Very Low priority levels for restoration and conservation, as they are designated for the preservation of natural ecosystems, preservation of biota, and private areas with predominantly native vegetation cover.
The priority areas map indicated that 57.03% of the area was classified as Very High or High importance, and Moderate priority for forest restoration, while 42.97% (252,932.5 hectares) were considered as Low and Very Low priority for forest restoration.
3.7. Confrontation of LULC with Priority Areas for Recovery within the EC
The results of the tabular cross-matching of the APP and LULC maps are presented in Table 10.
Table 10.
Comparison of LULC with priority areas for restoration within the EC.
The predominant LULC in relation to the priority areas for restoration within the ecological corridor is the forest class, followed by preserved pasture and intermediate Pasture, comprising 1235.75 ha, 1175.10 ha, and 1082.26 ha, respectively. Non-conflicting classes cover 1260.40 ha, while conflicting classes encompass 3729.74 ha.
Calculation of the Value of Bare Land (VBL) for Delimitation of the EC
Based on Section 2.8.1, which contains the areas in hectares of land use and land cover (LULC) in relation to the priority areas for restoration within the proposed ecological corridor, and using the VBL values from Table 9, the total VBL was calculated for the delimitation of the proposed ecological corridor, as shown in Table 11.
Table 11.
Bare land value per priority areas for restoration in relation to LULC classes.
The LULC with the highest total VBL is pasture (conserved), followed by pasture (intermediary) and mosaic of uses, where the sum of individual VBL among the classes of Moderate, High, and Very high corresponds to 15,172,747.87 reais, 13,974,071.63 reais, and 13,728,003.44 reais, respectively.
The total VBL per hectare of non-conflicting LULC classes in relation to the priority area for restoration considered “High” presents the highest VBL (3,868,057.47 reais), due to its larger extent (1007.17 ha), as per Table 11 and the second highest total bare land value per hectare among conflicting LULC classes (21,977,965.57 reais), which reflects in the total VBL for the “High” priority class (25,846,023.04 reais).
The total VBL per hectare of non-conflicting LULC classes in relation to the priority area for restoration considered “Moderate” presents the lowest value of VBL (256,943.65 reais), due to its smaller extent (66.90 ha) as per Table 11, however, it has the highest total VBL per hectare among conflicting LULC classes (25,568,388.49 reais), making it the second highest total VBL (25,825,332.14 reais).
The total sum of VBL for the priority areas for restoration in the “Moderate”, “High”, and “Very High” classes corresponds to 52,727,575.02 reais.
4. Discussion
The Atlantic Forest is one of the most threatened regions in the world in terms of biodiversity. For several decades, it has faced conservation challenges due to degradation and deforestation, which have greatly reduced its original forest cover. Only 12.4% of its area remains as mature and well-preserved forests [35]. Although the Atlantic Forest is in a critical situation, the BHRI shows a forest coverage of 27.4%, which demonstrates a relatively higher level of conservation for the fragments that make up this area. Given the circumstances, it is essential to take urgent measures to monitor and restore the forest, as well as strengthen the legislation that protects it. [38].
The study area showed a significant abundance of fragments with less than 10 hectares, and the sum of their areas was the second smallest among all analyzed size classes. According to [39], the presence of forest species in isolated fragments can result in a reduction in diversity due to edge effects, which are influenced by fragment size and habitat loss. Consequently, tropical landscapes are becoming a heterogeneous mosaic, and the presence of small forest fragments can lead to the simplification of animal communities and partial isolation of wildlife [40].
Forests provide a diverse array of habitats and resources that support numerous species. Trees serve as sources of food, shelter, and breeding grounds for a wide range of animals, including birds, primates, felines, and insects [41,42]. The dense vegetation cover also plays a crucial role in maintaining soil moisture, retaining rainfall, and regulating local temperatures. This creates microclimates that are ideal for various plant and animal species [41,43].
The spatial distribution of forest fragments in BHRI aligns with the findings of a previous study, where the largest number of fragments were found in the smallest forest class [44]; showed that the largest number of fragments (NPs) belong to the class of fragments with sizes smaller than 10 hectares. The moderate-sized fragments (C3) have the lowest values of CA and NP, indicating a smaller area of contact with the surrounding matrix (Table 7). The region surrounding the study area is immersed in a landscape dominated by different pasture classes, which enhances the edge effect. According to a previous study [24], the composition of the surrounding matrix should be considered when prioritizing measures to increase the area for fragments smaller than 10 hectares, such as reforestation or isolation of the area.
The high number of C1 class fragments represents a threat to biodiversity conservation and the maintenance of ecosystem processes and services due to the effects of fragmentation. This is a result of the increase in forest edge and the decrease in habitat heterogeneity, which leads to the loss of the central area of these remnants [39,45,46,47]. Due to habitat fragmentation, populations of animals with lower mobility, such as arboreal primates, are most affected, as they depend on tree cover to move [48,49]. As a result, tropical landscapes are becoming a heterogeneous mosaic, and small forest fragments contribute to the simplification of animal communities and partial isolation of wildlife [40]. However, smaller fragments play important roles in the landscape [50], as they can serve as ecological links and stepping stones between large areas, as well as refuges for species [51]
The low predisposition of forest fragments in BHRI was mainly influenced by the metrics CA, TE, and TCA, as they are correlated with landscape ecology analysis. Therefore, it is possible to deduce that the Fuzzy concept can be applied in selecting potential forest fragments for the implementation of ecological corridors [44].
The scenario found in the proposed EC was dominated by the intermediate pasture class, which does not differ much from the historical process that occurred in different regions of the Atlantic Forest, that suffered from poor management of LULC and increased forest fragmentation [52], making it necessary to adopt land use management measures that facilitate the functioning of the corridor.
Maintaining and restoring corridors are strategies that enhance the survival capabilities of fauna within small patches of tropical landscapes that have already been impacted by deforestation, such as the Atlantic Forest scenario [53]. Consequently, a new conservation model is required for this basin, focusing on regional-level planning, environmental protection, and restoration efforts [54].
The results presented for land use and land cover in APPs show that the majority of conflicts were due to improper land use, indicating non-compliance with the current environmental legislation (the Forest Code). These results are supported by other studies that analyze conflict zones in APPs in the same region [55]. The Forest Code, Brazilian environmental legislation, obligates the landowners to maintain a proportion of forest on their properties, often requiring the restoration of degraded habitats. An additional option for the recovery of degraded pastures is the planting of agroforestry systems (AFSs), which combine native species with exotic or fruit species, in compliance with the law [32,56]. The restoration of APPs should be carried out through the natural regeneration of native species or the planting of native species, which can be interspersed with exotic species [32]. In addition, other preventive measures should be implemented, such as more effective monitoring by environmental agencies and public management policies focused on the recovery and preservation of these areas, especially APPs.
In this study, the LCP modeling approach was employed to propose corridors by considering various factors such as land use and land cover classes, slope, APP, landscape ecology index, and subnormal clusters. This methodology is valuable for researchers, land managers, and landowners as it allows for the prioritization of variables that are more critical for corridor establishment.
However, one limitation of this approach is that it assumes that animals possess complete knowledge of the landscape and move with specific intentions. In reality, animals may have their own preferred habitat areas and select travel routes based on other preferences, this, can restrict the effectiveness of the approach in some cases. It is important to consider that animals may have specific habitat requirements and behavioral patterns that might not align perfectly with the modeled corridors. Therefore, while LCP modeling provides valuable insights, it should be complemented with field observations and additional data on animal behavior and preferences to ensure the optimal design and functionality of ecological corridors.
Research on ecological corridors involving remote sensing and least-cost path analysis presents some limitations. Regarding remote sensing, one of the main limitations is the difficulty in distinguishing specific plant species, which can affect the accuracy in delimiting ecological corridors [56]. In addition, the spatial resolution of the data may be insufficient for identifying degraded areas or small forest fragments, which hinders decision-making for implementing restoration actions [57,58].
Regarding least-cost path analysis, an important limitation is the dependence on accurate information about the ecology of species and their movement needs, which can lead to inaccurate results if this information is inadequate or insufficient [59]. Furthermore, the method does not take into account social, economic, and political factors that may influence the feasibility and effectiveness of implementing ecological corridors in certain areas [59,60]. To strengthen and improve future research on ecological corridors involving remote sensing and least-cost path analysis, it is necessary to develop new technologies that allow for higher spatial resolution and the identification of specific species. Additionally, the integration of socioeconomic and political data can help to ensure the viability and sustainability of ecological corridors, taking into account the needs and interests of local communities [60]. Finally, it is important to conduct monitoring studies to assess the effectiveness of restoration actions and connectivity between forest fragments over time.
The value of land is directly related to the potential income it can generate [61], which explains the higher Value of Bare Land (VBL) observed for the mosaic class of land use. This class consists of temporary crops (such as soybeans, sugar cane, rice, and cotton) and perennial crops (coffee and citrus), both in terms of monetary productivity and agricultural production [61].
When analyzing the Value of Bare Land for priority areas for restoration in relation to the LULC classes (Table 11), it is noted that the highest investment would be within the priority areas for restoration class considered High (25,846,023.04 Brazilian reais), followed by the Moderate class (25,825,332.14 Brazilian reais). The creation of new Conservation Units in strategic areas within the study area can be effective in increasing landscape connectivity and permeability, favoring the movement of animals and consequently the conservation of biodiversity [62]. In addition, promoting ecological restoration actions in degraded areas can also contribute toward—improving landscape connectivity and the recovery of populations of species that depend on connectivity for their survival and reproduction, thereby reducing the investment for creating new ecological corridors.
To ensure the conservation of the Itapemirim River basin, it is crucial to adopt new concepts to construct ecological corridors that address political, social, and environmental aspects through regional-level planning. Additionally, the protection of landscapes connected to original or restored vegetation should be prioritized [54].
5. Conclusions
The analyzed landscape is this paper predominantly covered by forests, indicating high conservation of the Itapemirim River basin. However, it is important to highlight that the predominant land use and land cover class consists of Permanent Preservation Areas, while the proposed ecological corridor is mainly composed of pasture, which is in conflict with the current legislation. Therefore, it is essential to comply with environmental laws and promote biodiversity conservation in the region.
The detailed planning for ecological restoration in the Itapemirim River basin is necessary, given that the size of the forest fragments is mostly small. A promising alternative for selecting potential fragments to creatr ecological corridors would be the use of landscape ecology indices through Fuzzy logic association.
In addition, the use of the least-cost path algorithm, along with a multicriteria decision-making method (AHP), is an important tool for the planning and implementation of ecological corridors. This method allows for the evaluation and selection of the most suitable areas, considering factors such as cost and environmental impact.
Within the ecological corridor, it is observed that the land use and land cover class with the highest VBL is preserved pasture, followed by intermediate pasture and a mosaic of land uses. These classes have a high gross value of net benefits due to the potential for income generation.
The mapping of priority areas for forest restoration in the Itapemirim River basin, taking into account specialized numerical levels, optimizes the implementation of native forest cover restoration projects. This mapping shows a significant intersection with areas associated with APP, highlighting the need for restoration in these regions.
In summary, the proposed methodology for implementing ecological corridors and mapping priority areas for forest restoration can be applied to other basins, phytophysiognomies, and biomes. It is essential to adhere to environmental legislation, promote biodiversity conservation, and involve different stakeholders, such as landowners, environmental agencies, and local communities, to ensure the effectiveness and sustainability of these initiatives.
Supplementary Materials
The following supporting information can be downloaded at: https://www.mdpi.com/article/10.3390/su151813696/s1, Table S1: Description of land use and occupation classes in the study area. Table S2: Legislation adopted for the delimitation of the four APP classes. Table S3: Metrics used to quantify the landscape structure in the region of the study area. Table S4: Costs assigned to different land use and land cover classes for the BHRI and their justifications, to generate a cost surface for tracing the ecological corridor (CE) path. Table S5: Weights attributed to the different IPs for BHRI, to generate priority areas for forest recovery.
Author Contributions
Conceptualization, V.D.N.M., H.M.D., T.R.M., R.d.C.F.C. and A.R.d.S.; methodology, V.D.N.M., H.M.D., D.M.C.S., T.R.M. and A.R.d.S.; validation, V.D.N.M., H.M.D., D.M.C.S., T.R.M., R.d.C.F.C. and A.R.d.S.; formal analysis, H.M.D., A.R.d.S., D.M.C.S., T.R.M., R.d.C.F.C., E.C.d.S., C.P. and C.U.Z.; investigation, V.D.N.M. and, D.M.C.S. and A.R.d.S.; resources, V.D.N.M.; data curation, V.D.N.M., H.M.D., A.R.d.S., T.R.M., R.d.C.F.C., E.C.d.S., C.P. and C.U.Z.; writing—original draft preparation, H.M.D., A.R.d.S., T.R.M., R.d.C.F.C., E.C.d.S., C.P. and C.U.Z.; writing—review and editing, V.D.N.M. and R.d.C.F.C.; supervision, H.M.D. and A.R.d.S.; project administration, V.D.N.M., H.M.D. and A.R.d.S.; funding acquisition, V.D.N.M. and H.M.D. All authors have read and agreed to the published version of the manuscript.
Funding
This research received no external funding.
Institutional Review Board Statement
Not applicable.
Informed Consent Statement
Not applicable.
Data Availability Statement
No new data were created or analyzed in this study. Data sharing is not applicable to this article.
Acknowledgments
The authors thank the following bodies for making the database available for the development of the research: The Coordination for the Improvement of Higher Education Personnel (CAPES) code 001. Finally, the authors would like to thank the Graduate Program in Forest Sciences at the Federal University of Espírito Santo and the research group Geotechnology Applied to the Global Environment (GAGEN), registered with CNPq. H.M.D. thanks FAPES for researcher scholarship granted (BPC N°03/2023).
Conflicts of Interest
The authors declare no conflict of interest.
References
- Ferreira, P.A.; Boscolo, D.; Viana, B.F. What Do We Know about the Effects of Landscape Changes on Plant–pollinator Interaction Networks? Ecol. Indic. 2013, 31, 35–40. [Google Scholar] [CrossRef]
- Agência Estadual de Recursos Hídricos—AGERH Comitês de Bacias Hidrográficas. Available online: https://agerh.es.gov.br (accessed on 29 November 2021).
- Frechiani, J.M.; Marchioro, E. Transformação No Uso e Cobertura Da Terra Associado a Mineração No Distrito de Itaoca, Cachoeiro de Itapemirim (ES). Rev. Geogr. 2015, 5. [Google Scholar]
- Costa, M.d.P.; Nappo, M.E.; Caçador, F.R.D.; Barros, H.H.D. de Avaliação Do Processo de Reabilitação de Um Trecho de Floresta Ciliar Na Bacia Do Rio Itapemirim-ES. Rev. Árvore 2010, 34, 834–851. [Google Scholar] [CrossRef]
- Cristina, I.; De Gusmão, D.; Da, A.H.; Barreto, S.; Taygra, R.; Fernandes, V.; Silva, D.; Pereira, V.K.; Lima, D.E.; Os Impactos Ambientais Causados Pela Atividade. Mineradora. Available online: https://brasilescola.uol.com.br/geografia/os-problemas-gerados-pela-mineracao.htm (accessed on 15 December 2022).
- Gil, J.F.S.; Silva, M.R.d.; Simões, D. Restauração de Uma Mata Ciliar: Análise Da Produtividade Efetiva Das Operações Sob Condições de Incertezas. Sci. For. 2021, 49. [Google Scholar] [CrossRef]
- Fahrig, L. Effects of Habitat Fragmentation on Biodiversity. Annu. Rev. Ecol. Evol. Syst. 2003, 34, 487–515. [Google Scholar] [CrossRef]
- Dias, P.; Gomes, L.; Callegaro, R.; Carvalho, F.; Dias, H. Structural and environmental variability from the edge to the interior of an atlantic forest remnant in brazil. J. Trop. For. Sci. 2021, 33, 308–332. [Google Scholar] [CrossRef]
- Magnago, L.F.S.; Edwards, D.P.; Edwards, F.A.; Magrach, A.; Martins, S.V.; Laurance, W.F. Functional Attributes Change but Functional Richness Is Unchanged after Fragmentation of Brazilian Atlantic Forests. J. Ecol. 2014, 102, 475–485. [Google Scholar] [CrossRef]
- Guimarães, H.; Braga, R.; Mascarenhas, A.; Ramos, T.B. Indicators of Ecosystem Services in a Military Atlantic Forest Area, Pernambuco—Brazil. Ecol. Indic. 2017, 80, 247–257. [Google Scholar] [CrossRef]
- Taffarello, D.; Calijuri, M.d.C.; Viani, R.A.G.; Marengo, J.A.; Mendiondo, E.M. Hydrological Services in the Atlantic Forest, Brazil: An Ecosystem-Based Adaptation Using Ecohydrological Monitoring. Clim. Serv. 2017, 8, 1–16. [Google Scholar] [CrossRef]
- Tabarelli, M.; Aguiar, A.V.; Ribeiro, M.C.; Metzger, J.P.; Peres, C.A. Prospects for Biodiversity Conservation in the Atlantic Forest: Lessons from Aging Human-Modified Landscapes. Biol. Conserv. 2010, 143, 2328–2340. [Google Scholar] [CrossRef]
- Gross, M. Brazil’s Fragmented Forests. Curr. Biol. 2017, 27, R681–R684. [Google Scholar] [CrossRef][Green Version]
- Ferrari, J.L.; Silva, S.F.; Santos, A.R.; Garcia, R.F. Corredores Ecológicos Potenciais Na Sub-Bacia Hidrográfica Do Córrego Horizonte, Alegre-ES, Indicados Por Meio de SIG. Rev. Bras. Ciênc. Agrár. Braz. J. Agric. Sci. 2012, 7, 133–141. [Google Scholar] [CrossRef]
- Louzada Franciane, L.R.d.O.; Dos Santos, A.R.; da Silva, A.G.; de Oliveira, O.M.; de Oliveira, G.G.; Paulo, S.V.; Batista Esteves, P.J. Proposta de Corredores Ecológicos Para Interligação de Parques Estaduais Utilizando Geotecnologia, Espirito Santo (ES)-Brasil. Rev. Geogr. Venez. 2013, 53, 239–254. [Google Scholar]
- Dondina, O.; Kataoka, L.; Orioli, V.; Bani, L. How to Manage Hedgerows as Effective Ecological Corridors for Mammals: A Two-Species Approach. Agric. Ecosyst. Environ. 2016, 231, 283–290. [Google Scholar] [CrossRef]
- Hofman, M.P.G.; Hayward, M.W.; Kelly, M.J.; Balkenhol, N. Enhancing Conservation Network Design with Graph-Theory and a Measure of Protected Area Effectiveness: Refining Wildlife Corridors in Belize, Central America. Landsc. Urban Plan. 2018, 178, 51–59. [Google Scholar] [CrossRef]
- Hong, W.; Guo, R.; Su, M.; Tang, H.; Chen, L.; Hu, W. Sensitivity Evaluation and Land-Use Control of Urban Ecological Corridors: A Case Study of Shenzhen, China. Land Use Policy 2017, 62, 316–325. [Google Scholar] [CrossRef]
- Liang, J.; He, X.; Zeng, G.; Zhong, M.; Gao, X.; Li, X.; Li, X.; Wu, H.; Feng, C.; Xing, W.; et al. Integrating Priority Areas and Ecological Corridors into National Network for Conservation Planning in China. Sci. Total Environ. 2018, 626, 22–29. [Google Scholar] [CrossRef]
- Rocha, M.A.M. Manejo de Plantas Daninhas. In Café Conilon; INCAPER: Vitória, Brazil, 2007; pp. 391–404. [Google Scholar]
- Recio, M.R.; Seddon, P.J.; Moore, A.B. Niche and Movement Models Identify Corridors of Introduced Feral Cats Infringing Ecologically Sensitive Areas in New Zealand. Biol. Conserv. 2015, 192, 48–56. [Google Scholar] [CrossRef]
- Ribeiro, M.P.; de Mello, K.; Valente, R.A. How Can Forest Fragments Support Protected Areas Connectivity in an Urban Landscape in Brazil? Urban For. Urban Green. 2022, 74, 127683. [Google Scholar] [CrossRef]
- Peng, J.; Yang, Y.; Liu, Y.; Hu, Y.; Du, Y.; Meersmans, J.; Qiu, S. Linking Ecosystem Services and Circuit Theory to Identify Ecological Security Patterns. Sci. Total Environ. 2018, 644, 781–790. [Google Scholar] [CrossRef]
- Santos, J.S.; Leite, C.C.C.; Viana, J.C.C.; dos Santos, A.R.; Fernandes, M.M.; de Souza Abreu, V.; do Nascimento, T.P.; dos Santos, L.S.; de Moura Fernandes, M.R.; da Silva, G.F.; et al. Delimitation of Ecological Corridors in the Brazilian Atlantic Forest. Ecol. Indic. 2018, 88, 414–424. [Google Scholar] [CrossRef]
- Perkl, R.M. Geodesigning Landscape Linkages: Coupling GIS with Wildlife Corridor Design in Conservation Planning. Landsc. Urban Plan. 2016, 156, 44–58. [Google Scholar] [CrossRef]
- Strnad, D.; Kohek, Š.; Kolmanič, S. Fuzzy Modelling of Growth Potential in Forest Development Simulation. Ecol. Inform. 2018, 48, 80–88. [Google Scholar] [CrossRef]
- Teixeira, T.R.; Soares Ribeiro, C.A.A.; Rosa dos Santos, A.; Marcatti, G.E.; Lorenzon, A.S.; de Castro, N.L.M.; Domingues, G.F.; Leite, H.G.; da Costa de Menezes, S.J.M.; Santos Mota, P.H.; et al. Forest Biomass Power Plant Installation Scenarios. Biomass Bioenergy 2018, 108, 35–47. [Google Scholar] [CrossRef]
- Agência Estadual de Recursos Hídricos—AGERH. Manual Operativo Dos Planos de Recursos Hídricos Capixabas: Bacia Hidrográfica Do Rio Itapemirim: De Olho No Rio: Do Plano Ao MOP; Agência Estadual de Recursos Hídricos—AGERH: Vitória, Brazil, 2020. [Google Scholar]
- Senhorelo, A.P.; Sousa, E.F.d.; Santos, A.R.d.; Ferrari, J.L.; Peluzio, J.B.E.; Zanetti, S.S.; Carvalho, R.d.C.F.; Camargo Filho, C.B.; Souza, K.B.d.; Moreira, T.R.; et al. Application of the Vegetation Condition Index in the Diagnosis of Spatiotemporal Distribution of Agricultural Droughts: A Case Study Concerning the State of Espírito Santo, Southeastern Brazil. Diversity 2023, 15, 460. [Google Scholar] [CrossRef]
- Anderson, L.O.; Ribeiro Neto, G.; Cunha, A.P.; Fonseca, M.G.; Mendes de Moura, Y.; Dalagnol, R.; Wagner, F.H.; de Aragão, L.E.O.e.C. Vulnerability of Amazonian Forests to Repeated Droughts. Philos. Trans. R. Soc. B Biol. Sci. 2018, 373, 20170411. [Google Scholar] [CrossRef]
- MapBiomas MapBiomas Collection—Coleção 6. Available online: https://mapbiomas.org (accessed on 26 November 2021).
- BRASIL Novo Código Florestal Brasileiro, Lei No 12.651, de 25 de Maio de 2012. Available online: https://www.planalto.gov.br/ccivil_03/_ato2011-2014/2012/lei/l12651.htm (accessed on 29 September 2022).
- Jiang, H.; Eastman, J.R. Application of Fuzzy Measures in Multi-Criteria Evaluation in GIS. Int. J. Geogr. Inf. Sci. 2000, 14, 173–184. [Google Scholar] [CrossRef]
- Gerami Seresht, N.; Fayek, A.R. Computational Method for Fuzzy Arithmetic Operations on Triangular Fuzzy Numbers by Extension Principle. Int. J. Approx. Reason. 2019, 106, 172–193. [Google Scholar] [CrossRef]
- Varjabedian, R. Lei Da Mata AtlâNtica: Retrocesso Ambiental. Estud. Avançados 2010, 24, 147–160. [Google Scholar] [CrossRef]
- Saaty, T.L. A Scaling Method for Priorities in Hierarchical Structures. J. Math. Psychol. 1977, 15, 234–281. [Google Scholar] [CrossRef]
- Li, H.; Li, D.; Li, T.; Qiao, Q.; Yang, J.; Zhang, H. Application of Least-Cost Path Model to Identify a Giant Panda Dispersal Corridor Network after the Wenchuan Earthquake—Case Study of Wolong Nature Reserve in China. Ecol. Modell. 2010, 221, 944–952. [Google Scholar] [CrossRef]
- SOSMA. Fundação S.O.S Mata Atlântica Relatório Anual 2021; Fundação SOS Mata Atlântica: São Paulo, Brazil, 2021. [Google Scholar]
- Moraes, M.C.P.d.; Mello, K.d.; Toppa, R.H. Análise da paisagem de uma zona de amortecimento como subsídio para o planejamento e gestão de unidades de conservação. Rev. Árvore 2015, 39, 1–8. [Google Scholar] [CrossRef][Green Version]
- Ripperger, S.P.; Tschapka, M.; Kalko, E.K.V.; Rodríguez-Herrera, B.; Mayer, F. Resisting Habitat Fragmentation: High Genetic Connectivity among Populations of the Frugivorous Bat Carollia Castanea in an Agricultural Landscape. Agric. Ecosyst. Environ. 2014, 185, 9–15. [Google Scholar] [CrossRef]
- Goatley, C.H.R.; Bellwood, D.R. The Roles of Dimensionality, Canopies and Complexity in Ecosystem Monitoring. PLoS ONE 2011, 6, e27307. [Google Scholar] [CrossRef]
- Gómez-Creutzberg, C.; Lagisz, M.; Nakagawa, S.; Brockerhoff, E.G.; Tylianakis, J.M. Consistent Trade-offs in Ecosystem Services between Land Covers with Different Production Intensities. Biol. Rev. 2021, 96, 1989–2008. [Google Scholar] [CrossRef] [PubMed]
- Dale, A.G.; Frank, S.D. Urban Warming Trumps Natural Enemy Regulation of Herbivorous Pests. Ecol. Appl. 2014, 24, 1596–1607. [Google Scholar] [CrossRef]
- Moreira, T.R. Proposta de Implantação de Corredores Ecológicos Como Estratégia Para Mitigação de Impactos Ambientais Na Bacia Hidrográfica Do Rio Doce; Universidade Federal do Espírito Santo: Vitória, Brazil, 2019. [Google Scholar]
- Haddad, N.M.; Brudvig, L.A.; Clobert, J.; Davies, K.F.; Gonzalez, A.; Holt, R.D.; Lovejoy, T.E.; Sexton, J.O.; Austin, M.P.; Collins, C.D.; et al. Habitat Fragmentation and Its Lasting Impact on Earth’s Ecosystems. Sci. Adv. 2015, 1. [Google Scholar] [CrossRef]
- Pfeifer, M.; Lefebvre, V.; Peres, C.A.; Banks-Leite, C.; Wearn, O.R.; Marsh, C.J.; Butchart, S.H.M.; Arroyo-Rodríguez, V.; Barlow, J.; Cerezo, A.; et al. Creation of Forest Edges Has a Global Impact on Forest Vertebrates. Nature 2017, 551, 187–191. [Google Scholar] [CrossRef]
- Silva, V.L.; Mehltreter, K.; Schmitt, J.L. Ferns as Potential Ecological Indicators of Edge Effects in Two Types of Mexican Forests. Ecol. Indic. 2018, 93, 669–676. [Google Scholar] [CrossRef]
- Estrada, A.; Garber, P.A.; Rylands, A.B.; Roos, C.; Fernandez-Duque, E.; Di Fiore, A.; Nekaris, K.A.-I.; Nijman, V.; Heymann, E.W.; Lambert, J.E.; et al. Impending Extinction Crisis of the World’s Primates: Why Primates Matter. Sci. Adv. 2017, 3. [Google Scholar] [CrossRef]
- Moraes, A.M.; Ruiz-Miranda, C.R.; Galetti, P.M., Jr.; Niebuhr, B.B.; Alexandre, B.R.; Muylaert, R.L.; Grativol, A.D.; Ribeiro, J.W.; Ferreira, A.N.; Ribeiro, M.C. Landscape Resistance Influences Effective Dispersal of Endangered Golden Lion Tamarins within the Atlantic Forest. Biol. Conserv. 2018, 224, 178–187. [Google Scholar] [CrossRef]
- Fletcher, R.J.; Didham, R.K.; Banks-Leite, C.; Barlow, J.; Ewers, R.M.; Rosindell, J.; Holt, R.D.; Gonzalez, A.; Pardini, R.; Damschen, E.I.; et al. Is Habitat Fragmentation Good for Biodiversity? Biol. Conserv. 2018, 226, 9–15. [Google Scholar] [CrossRef]
- Pütz, S.; Groeneveld, J.; Alves, L.F.; Metzger, J.P.; Huth, A. Fragmentation Drives Tropical Forest Fragments to Early Successional States: A Modelling Study for Brazilian Atlantic Forests. Ecol. Modell. 2011, 222, 1986–1997. [Google Scholar] [CrossRef]
- Ribeiro, M.C.; Metzger, J.P.; Martensen, A.C.; Ponzoni, F.J.; Hirota, M.M. The Brazilian Atlantic Forest: How Much Is Left, and How Is the Remaining Forest Distributed? Implications for Conservation. Biol. Conserv. 2009, 142, 1141–1153. [Google Scholar] [CrossRef]
- Pardini, R.; Bueno, A.d.A.; Gardner, T.A.; Prado, P.I.; Metzger, J.P. Beyond the Fragmentation Threshold Hypothesis: Regime Shifts in Biodiversity Across Fragmented Landscapes. PLoS ONE 2010, 5, e13666. [Google Scholar] [CrossRef]
- da Silva, J.M.C.; Tabarelli, M. Tree Species Impoverishment and the Future Flora of the Atlantic Forest of Northeast Brazil. Nature 2000, 404, 72–74. [Google Scholar] [CrossRef] [PubMed]
- Ceauşu, S.; Graves, R.A.; Killion, A.K.; Svenning, J.; Carter, N.H. Governing Trade-offs in Ecosystem Services and Disservices to Achieve Human–wildlife Coexistence. Conserv. Biol. 2019, 33, 543–553. [Google Scholar] [CrossRef] [PubMed]
- Brasil Lei Federal N° 12.854, de 26 de Agosto de 2013; Brasil. Available online: https://legislacao.presidencia.gov.br/atos/?tipo=LEI&numero=12854&ano=2013&ato=c2fITWU50MVpWT06f (accessed on 29 September 2022).
- Montibeller, B.; Kmoch, A.; Virro, H.; Mander, Ü.; Uuemaa, E. Increasing Fragmentation of Forest Cover in Brazil’s Legal Amazon from 2001 to 2017. Sci. Rep. 2020, 10, 5803. [Google Scholar] [CrossRef]
- Rosa, I.M.D.; Gabriel, C.; Carreiras, J.M.B. Spatial and Temporal Dimensions of Landscape Fragmentation across the Brazilian Amazon. Reg. Environ. Chang. 2017, 17, 1687–1699. [Google Scholar] [CrossRef]
- Chetkiewicz, C.-L.B.; St. Clair, C.C.; Boyce, M.S. Corridors for Conservation: Integrating Pattern and Process. Annu. Rev. Ecol. Evol. Syst. 2006, 37, 317–342. [Google Scholar] [CrossRef]
- Tiang, D.C.F.; Morris, A.; Bell, M.; Gibbins, C.N.; Azhar, B.; Lechner, A.M. Ecological Connectivity in Fragmented Agricultural Landscapes and the Importance of Scattered Trees and Small Patches. Ecol. Process. 2021, 10, 20. [Google Scholar] [CrossRef]
- Marques, F.C.; Telles, T.S. Os Efeitos Espaciais São Fatores Determinantes Dos Preços Das Terras Agrícolas No Brasil. Rev. Econ. Sociol. Rural 2023, 61. [Google Scholar] [CrossRef]
- Pardini, R.; de Souza, S.M.; Braga-Neto, R.; Metzger, J.P. The Role of Forest Structure, Fragment Size and Corridors in Maintaining Small Mammal Abundance and Diversity in an Atlantic Forest Landscape. Biol. Conserv. 2005, 124, 253–266. [Google Scholar] [CrossRef]


Disclaimer/Publisher’s Note: The statements, opinions and data contained in all publications are solely those of the individual author(s) and contributor(s) and not of MDPI and/or the editor(s). MDPI and/or the editor(s) disclaim responsibility for any injury to people or property resulting from any ideas, methods, instructions or products referred to in the content. |
© 2023 by the authors. Licensee MDPI, Basel, Switzerland. This article is an open access article distributed under the terms and conditions of the Creative Commons Attribution (CC BY) license (https://creativecommons.org/licenses/by/4.0/).