Article

Design and Development of Optimal and Deep-Learning-Based Demand Response Technologies for Residential Hybrid Renewable Energy Management System

by
Murugaperumal Krishnamoorthy
1,*,
P. Ajay-D-Vimal Raj
2,
N. P. Subramaniam
2,
M. Sudhakaran
2 and
Arulselvi Ramasamy
3
1
Department of EEE, Vardhaman College of Engineering, Hyderabad 501218, India
2
Department of EEE, Puducherry Technological University, Puducherry 605014, India
3
Department of CSE, Vardhaman College of Engineering, Hyderabad 501218, India
*
Author to whom correspondence should be addressed.
Sustainability 2023, 15(18), 13773; https://doi.org/10.3390/su151813773
Submission received: 29 June 2023 / Revised: 9 August 2023 / Accepted: 17 August 2023 / Published: 15 September 2023
(This article belongs to the Section Energy Sustainability)

Abstract

:
The principal goal of this study is to conduct a techno-economic analysis of hybrid energy generation designs for residential-form houses in urban areas. Various possibilities for a form house electrification system are created and simulated in order to determine an optimum ideal configuration for meeting residential load demand with an increase in energy capacity and minimal investment. Using NREL’s HOMER optimization tool, a case-study-based virtual HRE model is developed. Pre-assessment data and relevant operation constraints are used to build the system’s objective functions. The instantaneous energy balance algorithm technique is used to solve the multi-objective function. The overall optimization procedure is sandwiched between two supporting advanced approaches, pre- and post-operations. The development of an optimal techno-economic hybrid energy generation system for the smooth fulfillment of urban load demand is aided by novel deep belief network (NDBN)-based pre-stage load demand predictions and an analysis of the necessary demand side management (DSM)practicing code for utility efficiency improvements in post-stage simulations.

1. Introduction

According to estimations from the International Energy Agency, new power generation in the world will reach 8500 GW by 2040. Renewable energy will account for roughly two-thirds of this capacity. Sustainable energy development scenarios in all countries, complementary energy production versus nuclear power generation, and carbon capture technology reductions are the reasons for this significant contribution of renewable energy [1]. At present, India ranks fifth in the world in terms of total installed renewable energy capacity. Out of 368.98 GW of total Indian energy installations, there is a total renewable contribution of 23.39%. In the last 5.5 years, solar-based energy contributions have increased from 2.6 GW to 34 GW, and annual wind-based power harvesting has also dramatically increased [2]. This background history makes it evident that the current Indian energy networks require changes, such as the incorporation of several renewable energy sources as distribution generators. This can be achieved through an energy mix of various conventional and renewable energy sources. The renewable consent uncertainty of RE resources leads to erroneous component selection and increased capital investment staking. Transmission losses, centralized control, and general power quality difficulties are all limitations of conventional grid electricity. When both types of energy generation are integrated, it is possible to create solutions to support the emerging development of this field [3,4]. This article discusses a hybrid renewable energy system that has high levels of technological and economic performance in support of long-term energy development. Key renewable energy generation challenges are addressed, including component selection (optimal sizing), economic measurable parameters (the capital investment, annual performance cost, and cash flow of projects), and environmental implications (GHG emissions and carbon credits).In the case of conventional energy generation, issues such as the availability of continuous power supply to loads, utility bill reduction, adopting the net meter principles of peak load management, and quality power to end users are validated by proposing an energy mix configuration. The main research strengths include the proposal of a hybrid energy system that fulfills the developed load requirement with optimal performance and economics. The specific objectives of this study are as follows:
To analyze the depth assessment of the proposed HRE system toward evaluations of its technical feasibility, economic viability, and environmental impacts during the considerations of various renewable sources’ availability at the project site.
To develop an accurate and reliable forecasting model for predicting energy demand patterns and consumption trends from historical datasets.
To determine the optimal sizing and configuration of the HRE system to ensure the predicted energy demands by minimizing investment costs and maximizing elements’ efficiency.
To develop the implementation procedures toward intelligent energy management strategies based on the outcome of demand-side management techniques such as load shifting and energy storage solutions.
To evaluate the environmental impacts of the implementation of the hybrid renewable energy system for the electrification purpose, which includes carbon emissions’ reduction potential and sustainability development.
The feasibility studies of the proposed hybrid energy system, as well as its techno-economic analysis, are discussed in the following sections of this article.

Recent Research Works: Hybrid Energy Generation

Gabbar H.A. et al. [5] developed a system feasibility report for a nuclear-power-plant-connected hybrid micro-energy system and discovered that the suggested HRE configuration generated about 20.5% extra electricity. This demonstrated that the system had difficulty with the oversizing of component selection during the simulation. Kong W et al. [6] addressed the key difficulties of grid-connected telecommunication base station limitations, such as frequent power outages and high maintenance costs. As a result, they recommended that a hybrid system incorporating a solar PV array makes effective energy contributions during grid peak-load-shifting periods for continuous power supply to the base station. Singh R et al. [7] investigated hybrid AC/DC power grid concerns such as switching transients, renewable resource uncertainty, and hybrid system control strategies for smooth operation. The proposed system was planned and implemented using DigSILENT power factor software tools, but the economic concerns were not explored. Zhao D. and colleagues [8] devised and built an intelligent energy management system for autonomous HRE systems. This concept was implemented using a multi-agent strategy. Every component of the system was managed by a specific agent database, which was linked to the main IEMS agent database to provide seamless energy-balanced processes between energy generation and consumption by loads. This research study addressed the way forward in terms of integrating more than two resource-based generations, though not in terms of the overall economic efficiency of the system. Sami B.S. et al. [9] addressed the preliminary functions of an AC/DC distribution system in terms of both technical and economic performance, while adding more than two renewable resources. The results of their investigation expressed the techno-economic performance of standalone renewable-based AC/DC distribution generation. However, the comprehensive observations concerning the partnership of RE, and conventional power plants were omitted here. Huang L. et al. [10] devised an efficient scheduling strategy for a hybrid renewable and conventional energy mix system. The dynamically optimized dispatch factors, which comprised energy efficiency and conversion for the next 24 h of scheduling, were used to build the optimal HRE performance scheduling.
Zhou. B et al. [11] used multi-objective generation to simulate an emergency power supply system for mobile vehicles with AC and DC loads. According to their findings, several RE resource-based generating mix schemes had higher effectiveness and superiority characteristics for this application. Another paper by the same author [12] described the construction of an optimization model for an autonomous rural area electrification system. However, the additional engagement of the traditional grid and the peak load control plant (fossil fuel genset) were not included in their modeling investigations. Suresh V et al. [13] investigated the various optimization tools for HRE simulations. Following critical assessments, several simulation tools were utilized to evaluate various measurement indicators and technologies. The HRE system’s resilience and the safety range of the power handling operation were attempted by Cuesta M A et al. [14]. The importance of the energy storage capacities in the HRE system’s resilience maintenance was precisely explained. Kosai S and colleagues [15,16] attempted to replicate a hybrid energy system using an alternate energy storage system, specifically a hybrid storage (pumped water and battery) system. Storage overall performance (SOP) and storage utilization factor (SUF) measures were used to describe the overall system results. Venkatesan K et al. [17], as well as other researchers in this field, attempted to [18,19,20] model the performance of hybrid renewable energy systems using an artificial intelligence technique and determined the optimal sizing of HRE components in grid-connected and off-grid modes. According to the state of the art in the load forecasting sector, data forecasts can be classified in two ways: one using a conventional time series statistical treatment model and the other using advanced data-driven methodologies [21,22,23,24,25,26,27,28,29,30,31,32,33]. Accurate load prediction is expected to significantly influence the selection of the components’ range in the HRE system. Additionally, this study aims to improve system energy production performance and enhance energy conservation. Previous research has certain limitations in this area, as summarized in Table 1. Therefore, the proposed case study seeks to address and fill some of the existing gaps in this field of research.
The novelty of the proposed methodology is a distinctive hybrid renewable electrification system tailored to urban residential loads, considering specific load requirements, local climate factors, and resource availability. The system is designed through an advanced energy balance algorithm-based optimization process. Through the implementation of a novel deep belief network, load forecasting can leverage the cutting-edge progress in deep learning approach. DSM’s successful execution of demand response programs and load shaping techniques ensures efficient peak load management. Section 2 of this study outlines the methods chosen to solve the field research problem. Section 3 discusses the fundamentals of hybrid energy harvesting modeling and approach processes. Section 4 presents the system under consideration for the real case study. Section 5 provides the associated results and discussions, as well as the subsequent scope of research and conclusions.

2. Methodology

This study’s major goal is to meet the developed load demand on a continuous basis, with the best possible performance and the least amount of project investment. Energy generation from renewable sources, such as solar panels, wind turbines, biomass, and micro-hydro, has generally led to the development of sustainable energy with large project investments. Due to the unpredictable nature of renewable resources, our system may be vulnerable to component oversizing difficulties. This impact range is very wide in single RE resource-based generation. Hybrid renewable energy system deployment, such as the integration of multiple RE generations, could help alleviate this problem. Even developed pairs should maintain energy balance with one another, despite the uncertainty of RE resources. The new methodology is designed based on these essential inputs to address the issues of HRE system design.
This article introduces a novel research methodology that comprehensively addresses the design of a renewable electrification system using advanced techniques. The initial step of this study involves a thorough understanding of load patterns, achieved through the implementation of efficient load prediction methods. The objective function for the chosen hybrid renewable energy system is formulated, considering both user requirements and design considerations. To determine the optimal solutions for this objective function, the hybrid optimization model is utilized in conjunction with the energy balance algorithm during simulation. The evaluation of the designed HRE system’s effectiveness can be conducted through a comparative analysis of energy contributions, considering scenarios both with and without the implementation of demand-side management concepts. Figure 1 shows a visual representation of the selection approach. Three key pre-assessments were identified: created load profile assessment, resource availability evaluation, and appropriate energy generation technology assessment, each with its own set of constraints. The HOMERsimulation tool is used to create the outcome based HRE system modeling for these assessments. The evaluation step of the HRE systems is initiated based on the simulation results. The investor decision-making process is then carried out using several measured parameters [20]. All of the winning HRE system configurations were evaluated in terms of technical performance, economic performance, and environmental performance. The effectiveness of system functions is determined under the technical performance category, via investment-related factors. The project cost is determined under the economic performance category, and project impact on environmental emissions is determined under the environmental performance category.

3. Hybrid Energy Harvesting Modeling with the Proposed Approach

Hybrid energy generation has a promising future in the energy sector, because of its outstanding technological and economic benefits over single-resource renewable or conventional energy generation. Three basic logical techniques are followed in this investigation. For future load prediction, novel deep belief network (NDBN) processes are used, and then a hybrid optimum model for electric renewable and conventional energy systems is developed for HRE system sizing and performance optimization. At the end of the study, the demand-side management effects on the proposed HRE system are examined to some extent.

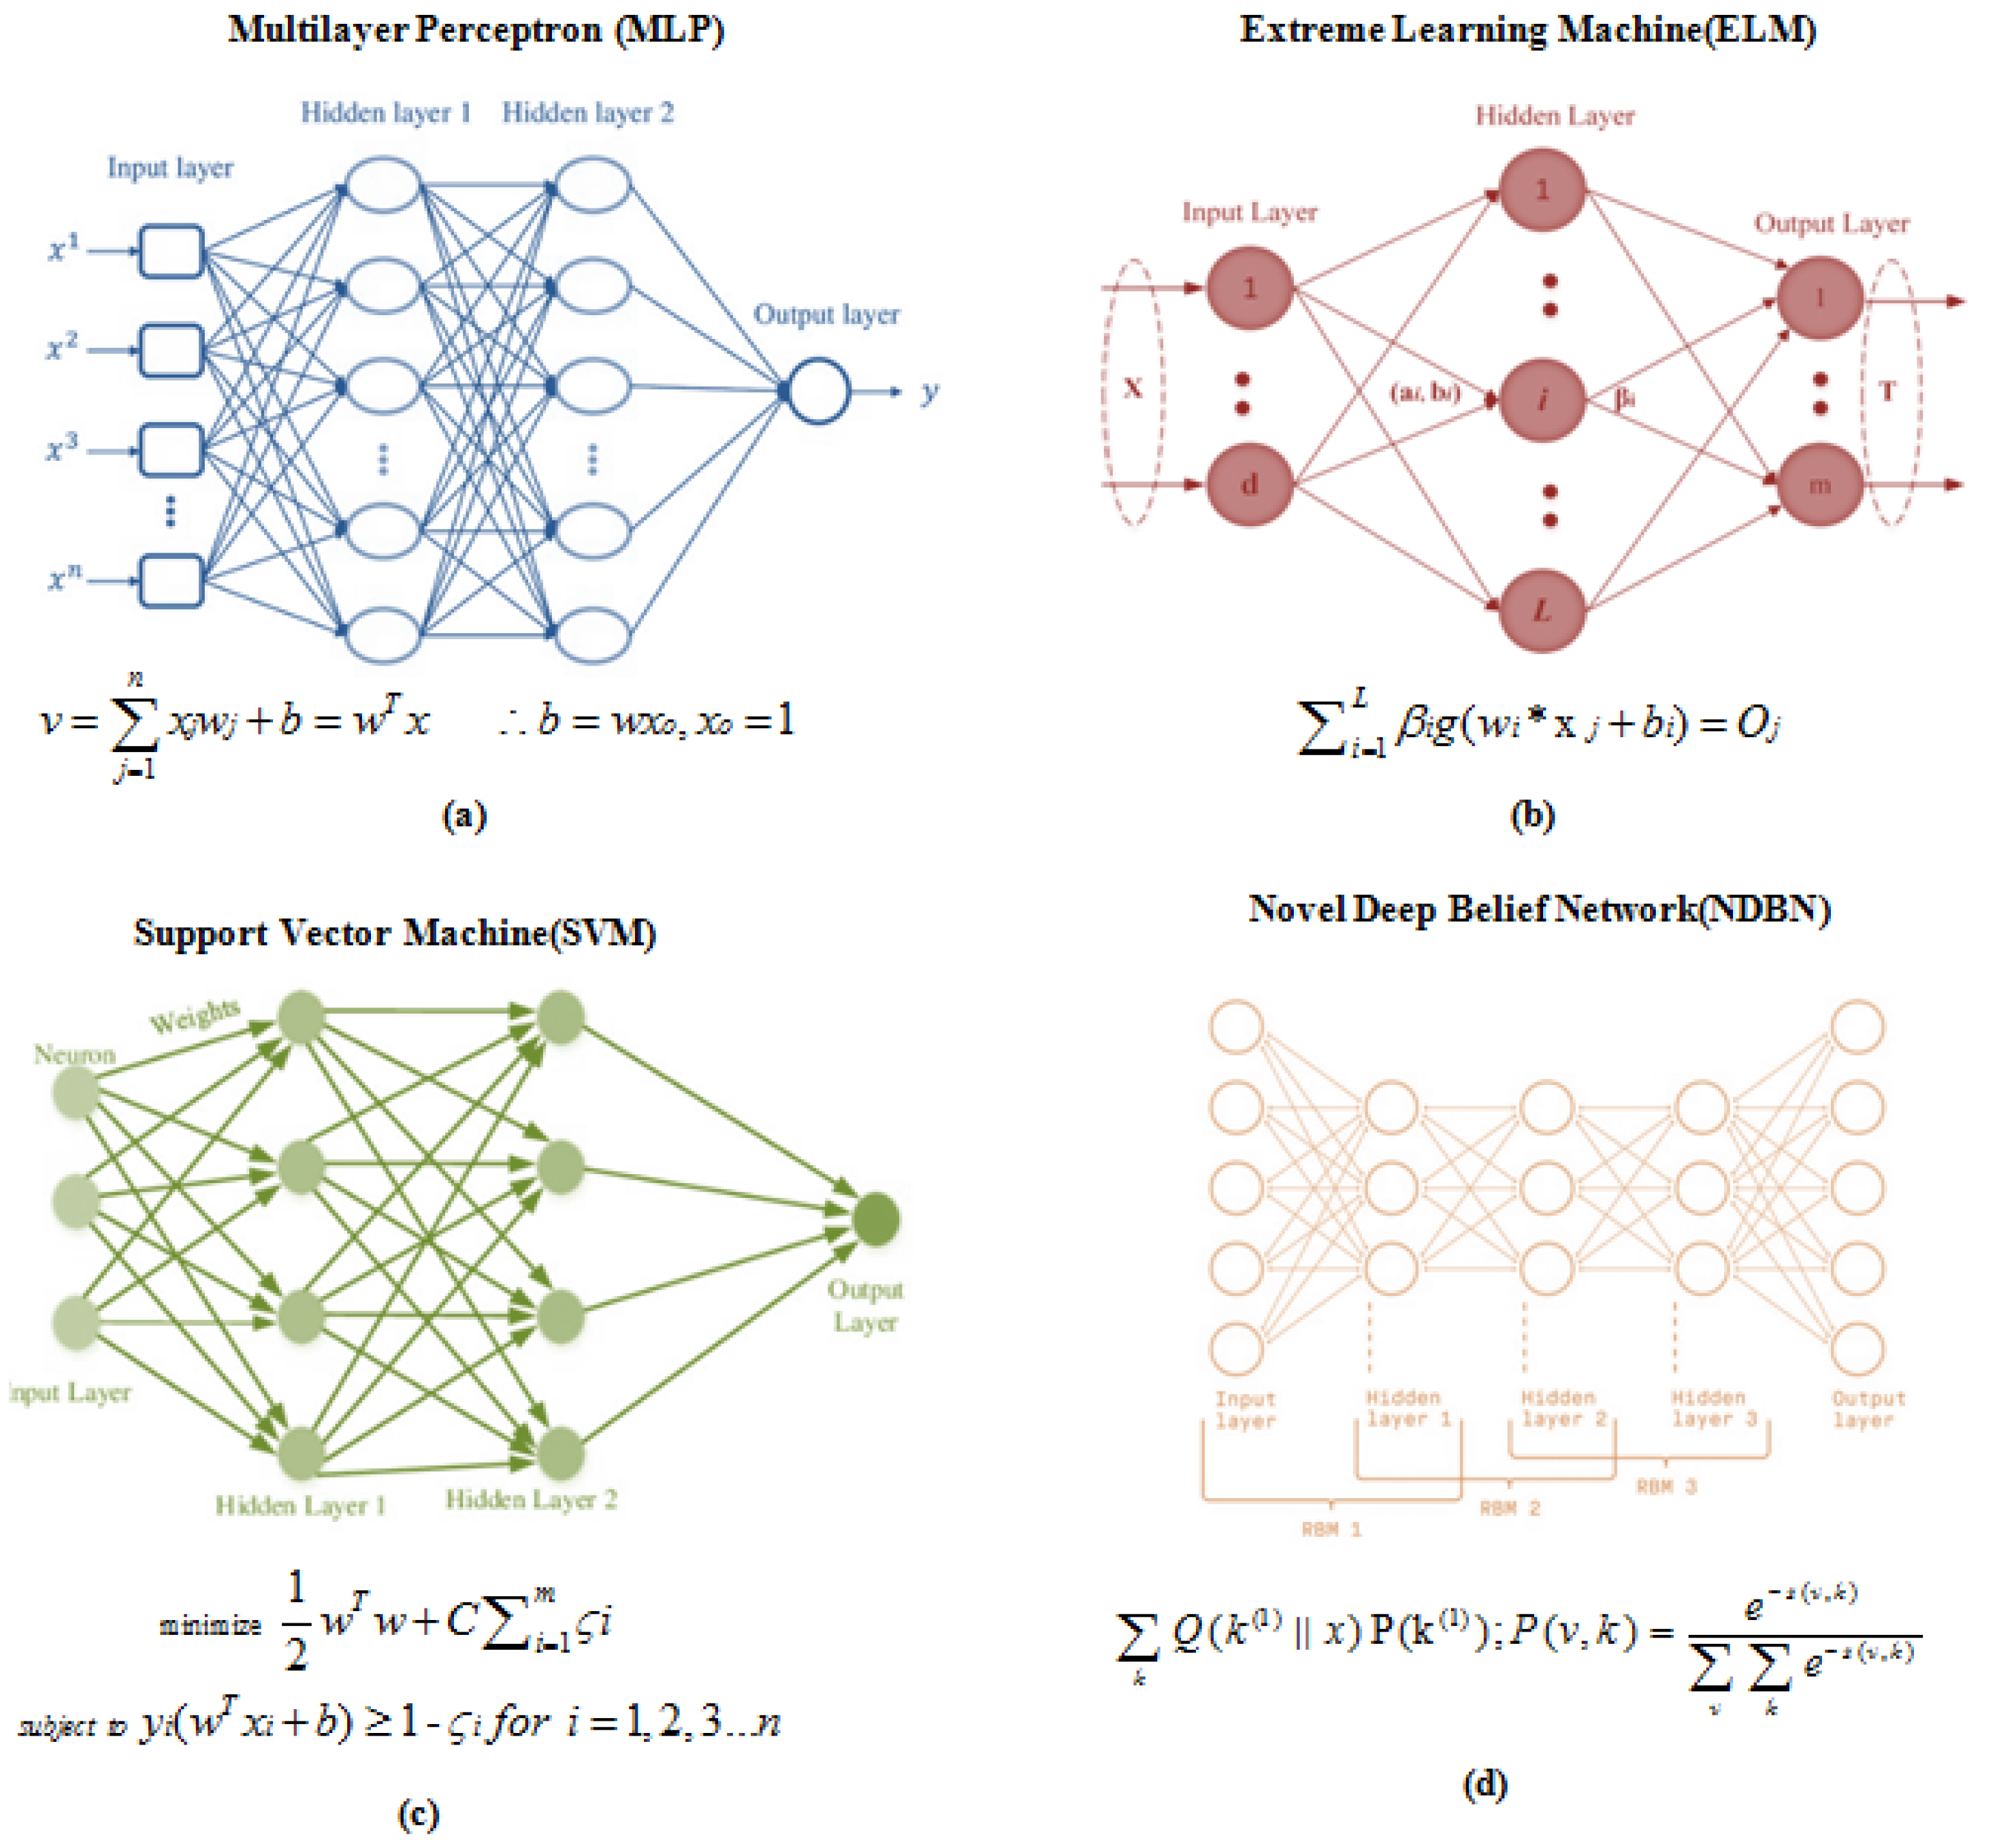
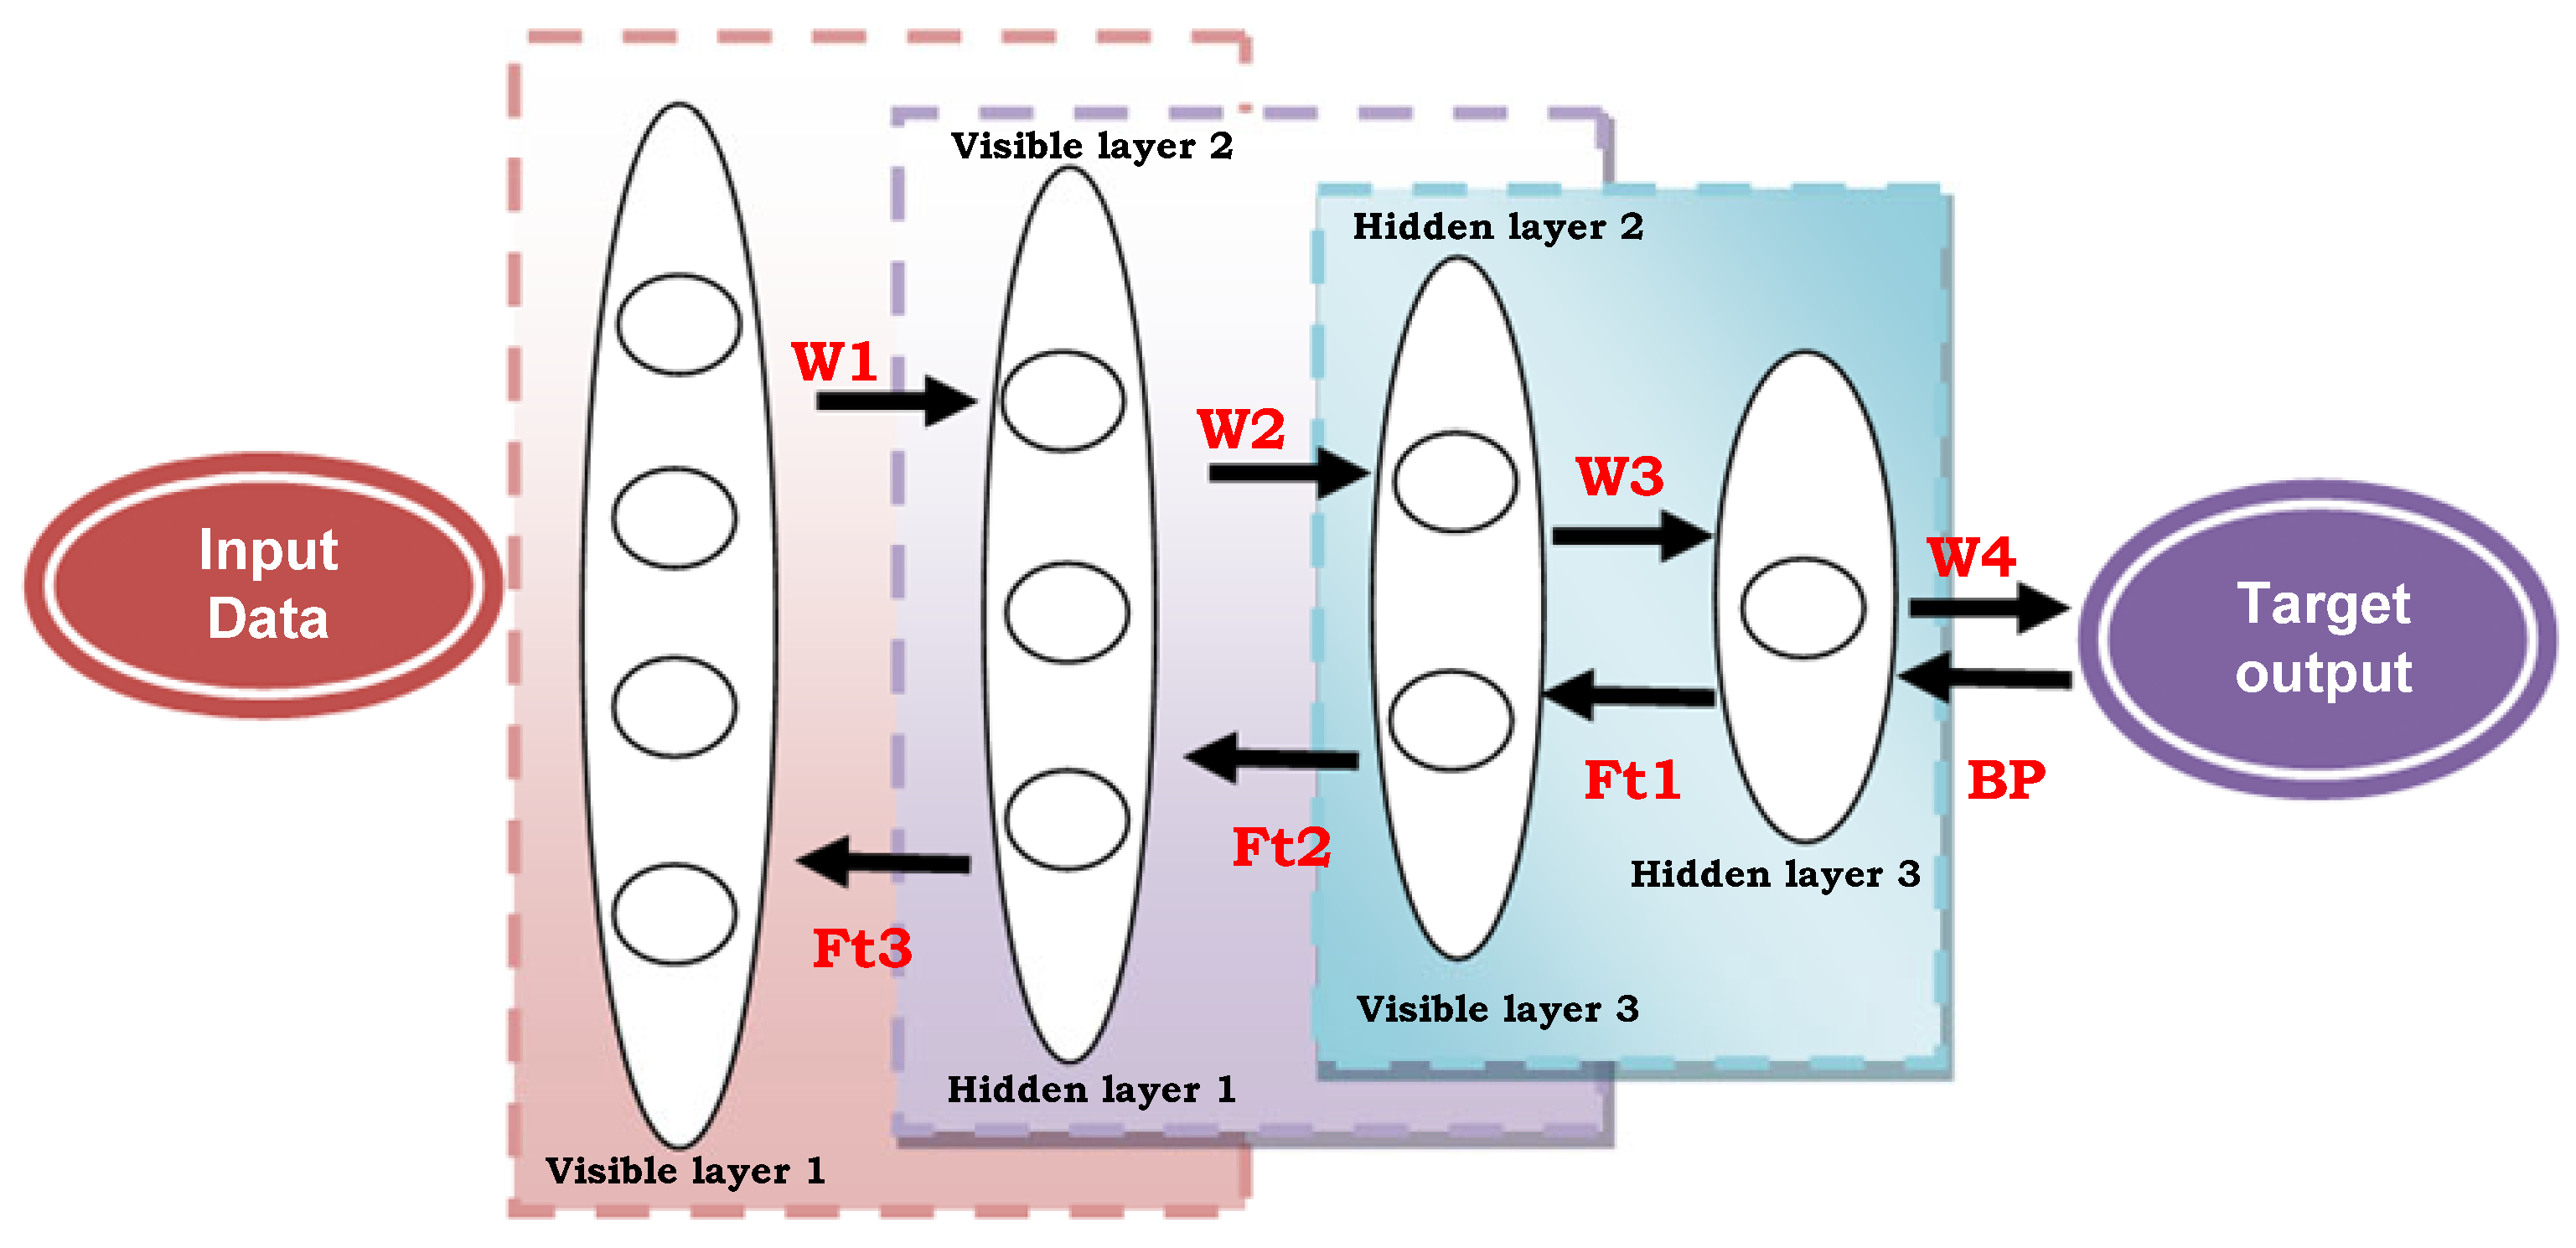
3.1. Novel Deep Belief Network (NDBN)

Future load demand is predicted using historical load data from the selected site location over the last year. In the dataset, a further load prediction is examined in terms of seasonal variation. Data deep learning strategies are used to estimate predictions for the next day and week. The support vector regression (SVR)machine technique, the extreme learning machine (ELM)method, and traditional neural networks are used as benchmarks, and a unique deep belief network strategy is proposed for improving predictive performance in this field of research (shown in Figure 2). The mean absolute percentage error (MAPE), the root-mean-square error (RESE), and the index agreements (AI) rate are three computational outcome indexes that are used to evaluate the prediction processes’ performance. The AI rate measures the proportion of data points where the predicted values closely match the actual values. It quantifies the level of agreement between the model’s predictions and the ground truth, giving an indication of how well the model’s forecasts align with the real-world data.
In general, traditional time series analysis has limitations such as a lower forecasting accuracy and ineffectiveness due to the non-linearity of prediction outcomes. Peak load consideration is also a major influencing factor in micro-grid design, and it is a problem that cannot be tackled using traditional data-driven modeling processes. As a result, the load prediction for micro-grid design and deployment is based on a new prediction method. A unique deep belief network is proposed in this study to overcome the other classical prediction flaws. Since there are fewer hidden neurons in the proposed NDBN, it avoids overfitting challenges and has a high level of prediction accuracy. The proposed deep learning framework for micro-grid design load prediction includes three key modeling blocks: (i) a layer-wise pre-predictive training model, (ii) a fine-tuning prediction model, and (iii) an optimistic structural model. The data pre-processing is conducted using standard normalized transformation ideas, and the prediction outputs are assessed using well-known indices such as MAPE, RMSE, and IA(illustrated in Table 2).

NDBN for Load Forecasting

A restricted Boltzmann machine (RBM) is stacked and trained in a deep, developed manner using the proposed method. The hierarchical representations among the visible and hidden layers are found in the absorbed distribution vector (x), hidden layer length (l), and weighting (w), and the prediction cumulative process is addressed in the following steps [25,26]. The detailed structure of NDBN is illustrated in Figure 3. here, Bp indicated back propagation and Ft- is corrections of weight age during training process.
A raw input (x) as visible layer is used as RBM’s first training layer.
v i s i b l e   l a y e r   i n p u t ,   x = k ( 0 )
The training process for the second layer considers the common solution produced from the first hidden layer (which is now the visible layer of the second level)
P   [ ( k ( 1 ) = 1 k ( 0 ) ]
Use the previous level’s visible layer’s parameters to train the second-layer RBM transformation.
In the objective process, repeat steps 1–3 until the desired number of fittest layers is fixed.
k Q ( k ( 1 ) x ) P ( k ( 1 ) )
The second-layer RBM training distribution is represented in the same way as the first RBM variables in this example. The quick learning algorithm is the novel deep belief network. It possesses the symmetrical bidirectional distributions of visible and hidden neurons. The probability distribution along the level’s layer set can be represented as
S ( v , k ) = i = 1 n v a i v i j = 1 n k b j k j i = 1 n v j = 1 n k k j w j , i v i
P ( v , k ) = e s ( v , k ) v k e s ( v , k )
The visible layer neurons are denoted by vi, the Boolean neurons on the hidden layers are denoted by ki, and the added layer weightage between the visible and hidden levels is denoted by wj,i. The bias vectors of the visible and hidden layers are ai and bi, respectively. The proposed prediction is superior to others due to the layer-by-layer pre-training model. The traditional neural network approach has flaws such as local optimal value falls rather than global ideal value falls. This problem can be solved by using a layer-by-layer pre-training technique. The objective attainment of a restricted Boltzmann machine (RBM) is achieved through the stochastic gradient descent pre-trained approach. It is expressed as follows:
L o ( a , b , w ) = log   P ( v , k )
Its gradients probability distribution is expressed as
log p ( v , k ) w j , i = v i k i p ( k v ) v i k i r e c o n
Equation (7) shows the differences between itineration’s conditional distribution and reconstructed distribution. The updated values of the further process can be expressed as
w i + 1 = w i + η v i k i p ( k v ) v i k i r e c o n
The supervised case of the back propagations (BP) algorithm can be used to fine-tune the system forecast. This method is used to reduce forecasting mistakes from the top to the bottom of the hierarchy. The optimistic structure parameters (such as w,a, and b) are employed to achieve a high level of prediction accuracy. Being optimistic, the major goal of this model is to pick the hidden neurons on the hidden layers. Use a random selection of 10% of the raw data and use it in the calculation of the minimal MAPE value. For the prediction procedure, the corresponding hidden layers’ neurons are detected. Equations (9)–(11) are used to generate the performance evaluation indexes.
M A P E = 1 N i = 1 N P j A j A j
R M S E = 1 N 2 j = 1 N P j A j
I n d e x   a g r e e m e n t   I A = 1 j = 1 N ( P j A j ) 2 j = 1 N ( A j P j ¯ ) + ( P j P j ¯ ) 2
Here, Pj, and Aj are the projected and actual demand values, respectively, whereas bar is the average prediction value for the samples. Where Pj is the predicted load demand at the jth time, Ajis the actual load demand at the jth time period, N is the total number of samples used in the prediction process, and I(i) is the prediction indication status.

3.2. Optimization Modeling for HRE System Design

The optimization analysis of the HRE system is identified using multi-objective cost-minimization and performance-maximization functions in this research. All of the objective functions are limited by their own set of operating constraints and user-acceptable constraints. This portion is used to simulate the various HRE components, which include the requirements for full objective functions and constraints. Figure 4 depicts the three phases of the optimization process in detail. The dynamicity of the day-to-day load variations is predicted by the previous modeling section.
The modeling equation of solar power can be expressed [18] as Equation (12):
P p v ( t ) = Y p v × D p v ( R t R t S T C ) [ 1 + p ( T c T c S T C ) ]
Here, the standard PV test condition capacity (Ypv in kW) is discussed. (TcTcSTC) is a temperature gradient on the selected location, and Dpv is a derating factor shown as a percentage. The solar radiation incident ratio is Rt/RtSTC. Equation (13) is used to express the wind power in terms of windswept area and hub height [19].
P w ( t ) = 0.5 η w η g ρ a C p A v r 3
The power coefficient of the turbine can be quantified as Cp, where the time instant wind power is PW(t) for turbine efficiency (ηw), generator efficiency (ηg), and (ρ) air density. The swept area (A) of the turbine and the wind velocity at hub height are both indicated as ‘v’. Equation (14) can be used to simulate the current level of battery energy capacity, as well as future battery energy storage.
P Btt ( t + 1 ) = P Btt ( t ) + Δ P ( t ) V DCBus η r t Δ t
where (ηrt) is the round-trip efficiency of the battery during charging and discharging, the VDCBus is the DC bus voltage, and ∆t is the process time step in an hour.
HRE’s total power generation can be expressed as
P total ( t ) = P V = 1 S n P PV ( t ) + w = 1 s m P w ( t ) + a d d e d   s o u r s e   c a p a c i t y
The entire number of solar panels, wind turbines, and other added power plants is represented by Sn, Sm, and So, respectively. The optimum design of an HRE system with a cost-minimization function of M i n   M t ( P PVD ( t ) ,   P PVA ( t ) ,   P W ( t ) ,   P Btt ( t ) ,   P bg ( t ) ) Min, takes into account system and user limitations [20].
M i n   M t (   P PVD ( t ) ,   P PVA ( t ) ,   P W ( t ) ,   P Btt ( t ) ,   P bg ( t ) ) = M i n   (   M PVD ( t ) ,   M PVA ( t ) ,   M W ( t ) ,   M Btt ( t ) ,   M bg ( t ) )
where the overall net present cost ( M npc ) of the system can be estimated using Equation (17) [18] in terms of all component costs, such as the solar pv cost with DC outcome MPVD(t), the inverter solar pv cost MPVA(t), the wind turbine cost Mw(t), and the battery bank cost MBtt(t).
M npc = M ann.Tot C R F ( i , R proj )
The cost recovery factor is included in the present value of the system, which is calculated from several types of costs such as capital, replacement, and operating and maintenance costs (CRF).
C R F ( i , n ) = i ( 1 + i ) n ( 1 + i ) n 1
where CRF (I,n) denotes the capital recovery factor, and I denotes the nominal interest rate for the Rth year of the project duration. Equation (19) represents the levelized cost of energy (COE).
C O E = M ann.Tot E py.AC + E py.Dc + E def + E gridsales
where the numerator part of the expressions indicates the total cost of the system, and the denominator part expresses the different forms of energy supplied by the system. The Mann,tot is the annual total cost in IND/yr, the EPy.AC is the AC primary load served in kWh/yr, the EPy.DC is the DC primary load served in kWh/yr, the Edef-DC is the DC primary load served in kWh/yr, and Egridsales is the total grid sales in kWh/yr. Equation (20) presents the mathematical model of the HRE system [20].
F ren = P ren + T ren P Tot + T Tot
where the renewable electrical and thermal production are expressed in kWh as Pren and Tren, respectively. PTot, and TTot in kWh are used to represent total electrical and thermal energy production.

Design Constraints

During the implementation of the HRE system, the relevant design constraints are taken into account, and Equations (21) and (22) are utilized to express the operational limitations. These design constraints play a crucial role in shaping the HRE system.
P PVD ( t ) ,   P PVA ( t ) ,   P W ( t ) ,   P Btt ( t ) ,   P bg ( t ) ( i R ) P d ( t )
  P PVD ( t ) ,   P PVA ( t ) ,   P W ( t ) ,   P Btt ( t ) ,   P bg ( t ) P damp P d ( t )
Equation (21) is expressing the basic constraints related to the summation of the energy generation toward the fulfillment of daily demand. Equation (22) expresses there liable constraints related to the excess energy generation and level of unmet load by the system. Where P d ( t ) is the total energy demand in the time instant (t), and l.e P d ( t ) = P dc ( t ) + P ac ( t )  PPVD and PPVA are the power generated from DC and AC solar panels, respectively. The wind power is measured in Pw, while the battery power is measured in PBtt. P damp represents the deferred load of the system, which can be fulfilled during the day without a fixed time frame. This type of load can be scheduled and interrupted based on user preferences, aiming to improve reliability. Equation (23) [18,19,20] is used to express the storage system constraints.
P Btt . m i n P Btt S O C P Btt . m a x 0 P Btt . c a p P Btt . m a x P Btt . Load max
The minimum and maximum battery power capacities are represented as PBtt min and PBtt max. The search space for HRE components is framed by Equation (24).
0 S o N bg , P max 0 S n N pv , P max 0 S m N w , P max 0 B n N btt , P max
where Npv and Pmax refer to the search space and maximum capacity of a solar photovoltaic panel, respectively, Nw and Pmax refer to the maximum capacity of a wind turbine. The number of battery banks and their capacity are related to Nbtt and Pmax [21,22,23,24].

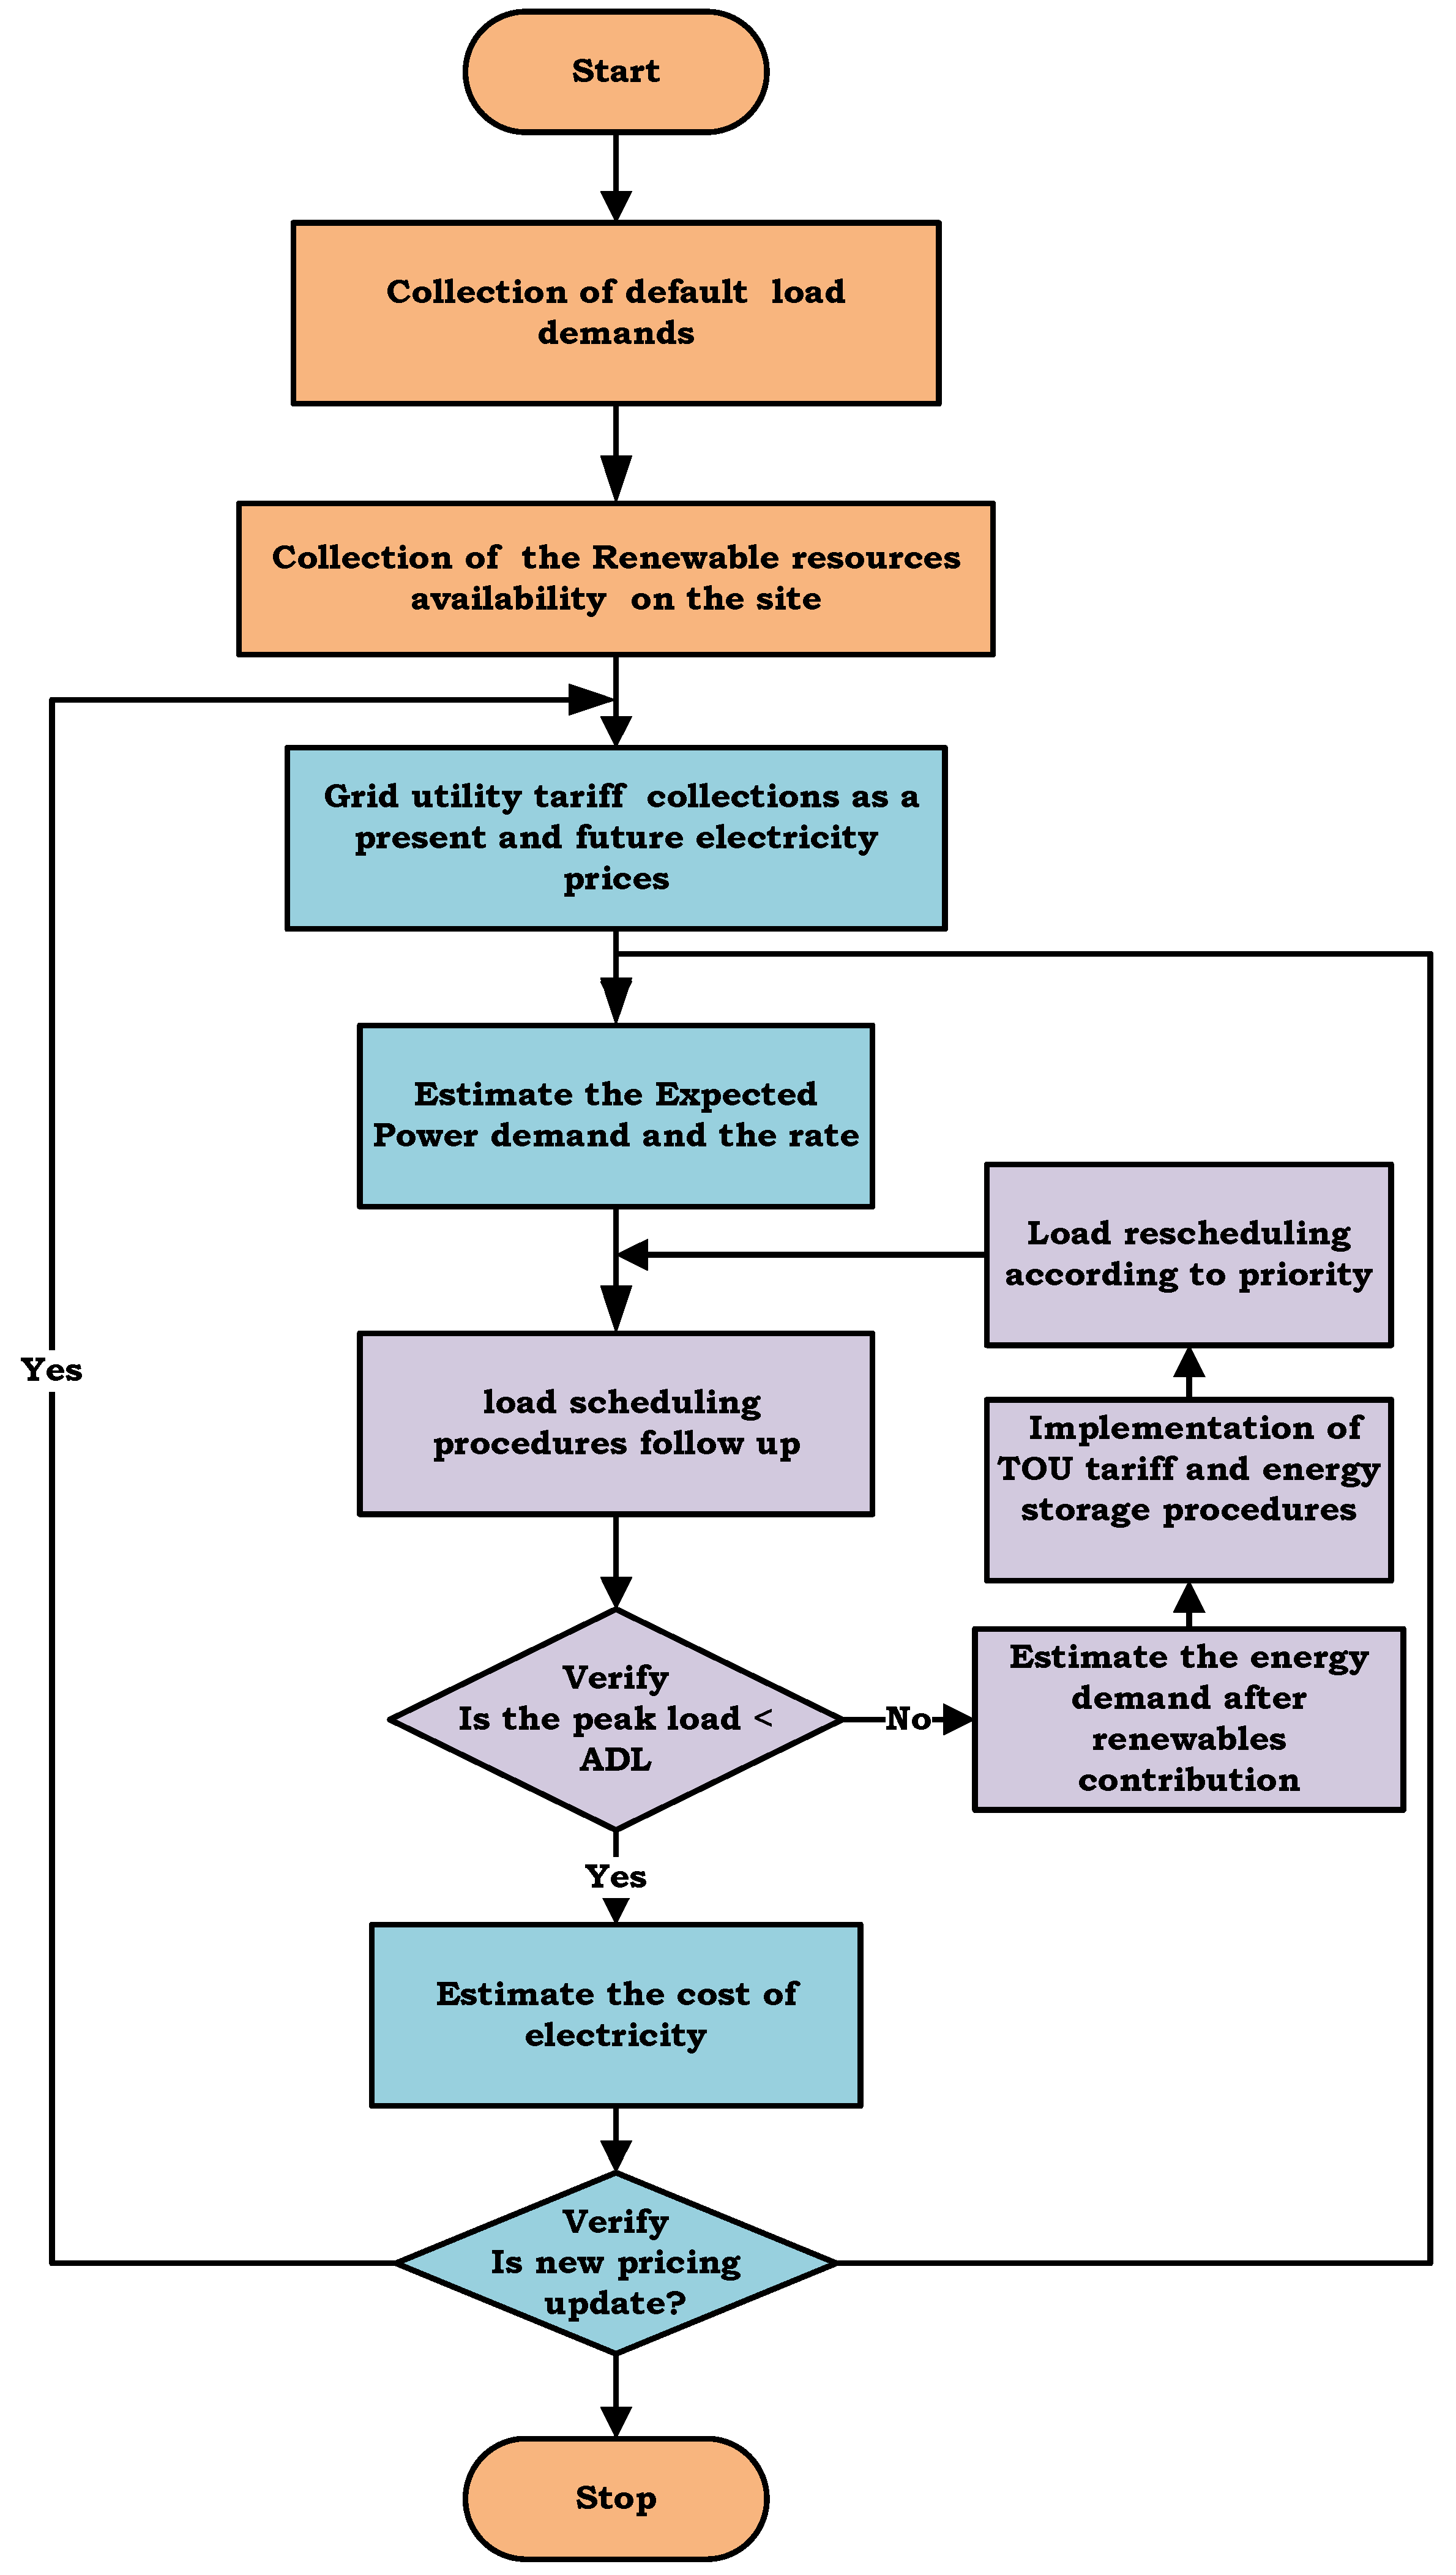
3.3. DSM Practicing Code for Energy Efficiency

Demand-side management strategies can help get the most out of energy. It is a series of measures that could be taken to improve energy efficiency and demand-driven energy output. This practice employs a variety of advanced techniques to reduce utility bill costs, including load scheduling, peak load reduction, chopping the peak and filling the valley of load profiles, time-of-use tariffs, integrating renewable resources, and replacing outdated load components with advanced energy-saving equipment.

Load Scheduling

The hopeful demand reduction is explored as a last element of this study by using leading DSM approaches such as combining renewable resources, load scheduling, and step-by-step TOU tariff adoption. The goal of load scheduling is to enhance the load factor by lowering peak demand. Suppose a house has three different types of load profiles, namely, the primary AC load, which is developed by household appliances, internal and external lights, refrigeration, wet grinders/mixers, washing machines, and dishwashers. The second load is the DC load, which is developed by electrical cars, electric fencing, and other DC-powered devices. Deferrable demand is the final load, which is related to a house’s irrigation system. Overall, house exhibits these distinct load profiles with varying average daily demands and peak power requirements for different appliances and systems. All load components are classified according to the operating covenant of consumers while on the route to scheduling loads based on their priority. It can be categorized into three types based on the functioning nature of the load components and consumer interest: divisible load, schedulable load, and interruptible load. Due to consumer demand, the divisible load is always given high attention (e.g., lights, fans, televisions, mixers, etc.). Owing to the least priority, schedulable loads can be shifted to other appropriate time periods (ideally low-load-stress periods). Dishwashers and washing machines fall into this category. Water heaters, water pump sets, and air conditioners are all turned off for a period of time in order to control the utility grid’s allotted demand level(ADL), and so-called loads are classified as interruptible loads [30]. This study’s second DSM technique is the implementation of a time-of-use tariff. This law aggressively encourages the economic relationship between energy demand and supply, with high utility tariffs during peak hours of energy demand and reduced tariffs during off-peak periods. It is illustrated through Figure 5. This tariff variance pushes energy users to adopt sustainable energy and improve their energy storage systems (shown in Figure 5). The main objective function of this DSM technique can be expressed as [30].
M i n (   h E G h C h   )
E G h = P h d i v i s i b l e + P h s c h e d u l a b l e + P h i n t e r r u p t a b l e + P h b t t .     P h R E s
where E G h is the term for utility grid energy during the interval ‘h; P h d i v i s i b l e , P h s c h e d u l a b l e , and P h i n t e r r u p t a b l e are the expected developed demands by the divisible, schedulable, and interruptible categories of loads during the step time interval ‘h’; and Pbtt and PRE are the expected battery and renewable power contributions during the interval ‘h’. C(h) is the unit electricity price throughout the interval ‘h’. The following constraints are used to find the solution to Equations (25) and (26). Any schedulable load should be transferred between the consumer’s pre-defined time spans ( T s i and D h i ), whereas interruptible loads should have adequate time to complete the allocated task ( T C i ).
i = h T O N i ( h ) = T c ( h ) ; O N i h = 0 t < T s i O N i h = 0 t > D h i
ONi(h)- is the ith interval of schedulable load activation. The total process hour is denoted by the letter ‘H’. Interruptible loads must function in a continuous or discrete manner until the computational intervals ( T s i and D h i ).
s l o t = 0 v 1 i = s l o t + 1 N O N i   T l = T l v = D h i   T s i     s l o t  
User power consumption must always be within ADL for every iteration interval of the day ADL, where N is the total number of calculation intervals, and Tl is the pre-emptive interval. (P(h)max) is the applicable penalty for grid energy usage that exceeds the ADL; it can be written as
P h d i v i s i b l e + P h s c h e d u l a b l e + P h i n t e r r u p t a b l e + P h b t t . P h R E s P ( h ) m a x
( 1 R h + 1 ) P h + 1 d i v i s i b l e + P h b t t . P h R E s   P ( h + 1 ) m a x
Rh+1 is a reservation factor for non-schedulable loads at intervals of ‘h’, with the battery SOC being taken into account: S O C m i n S O C ( h ) S O C max .

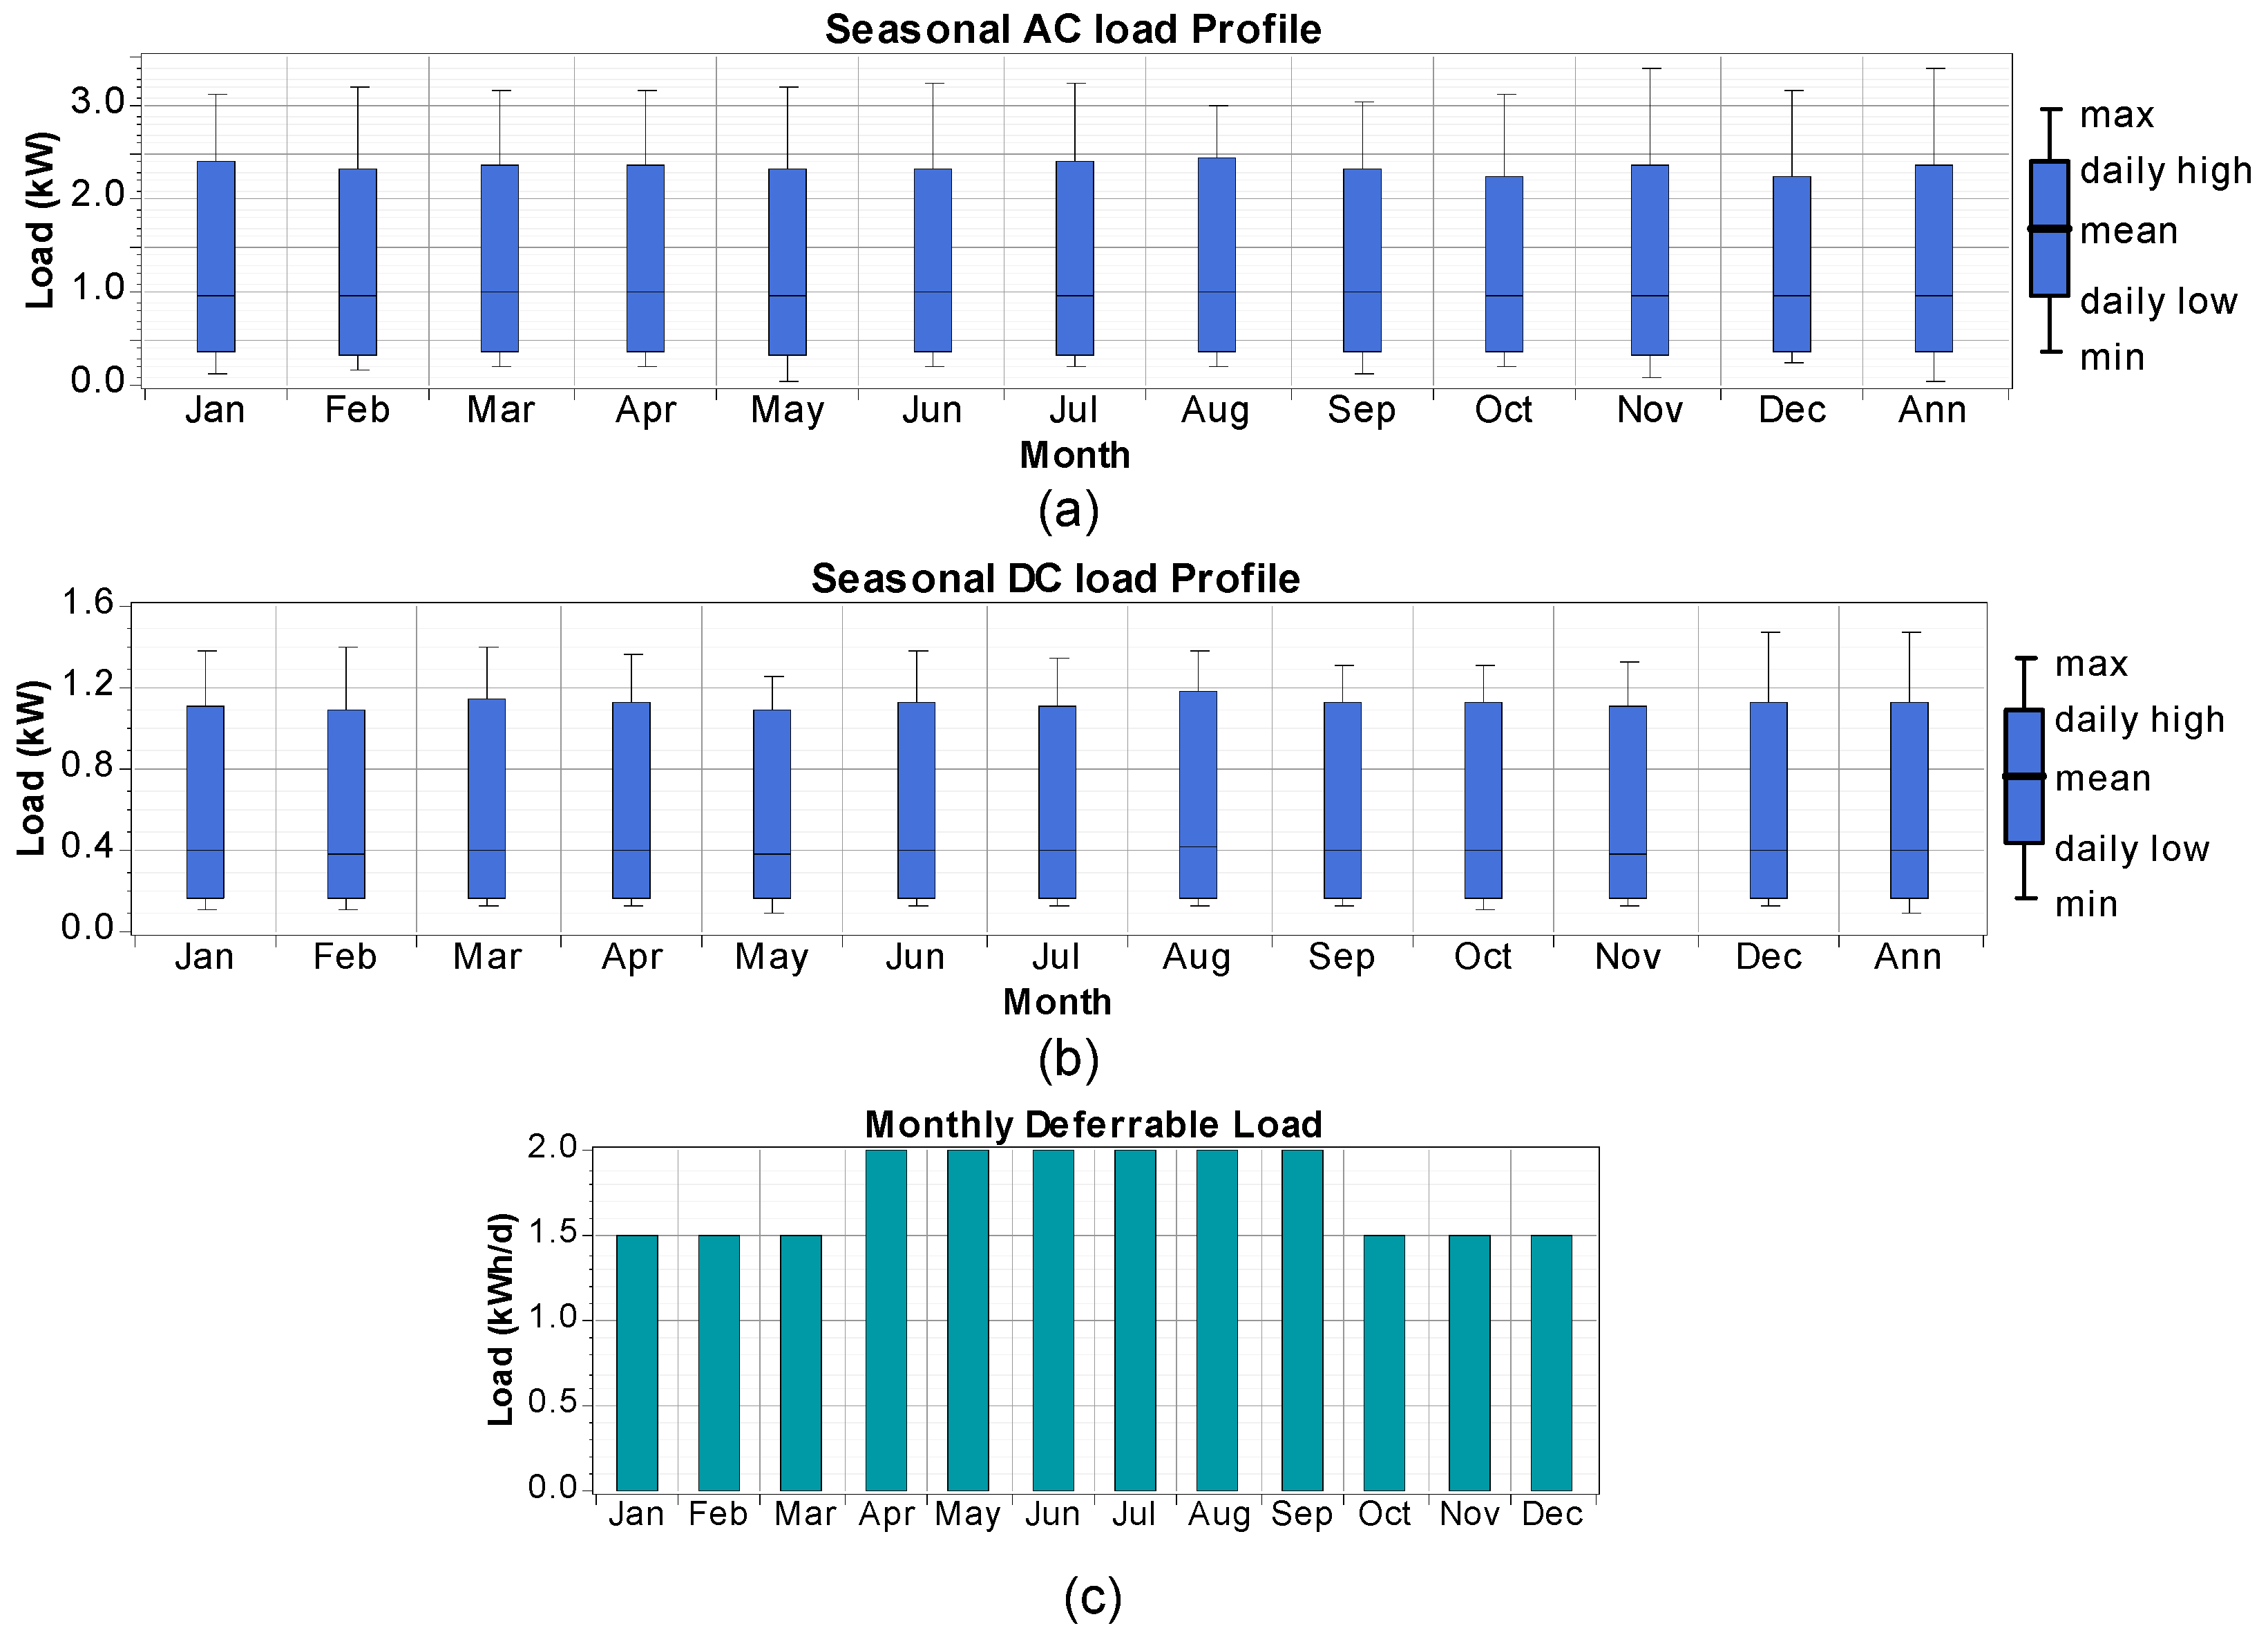
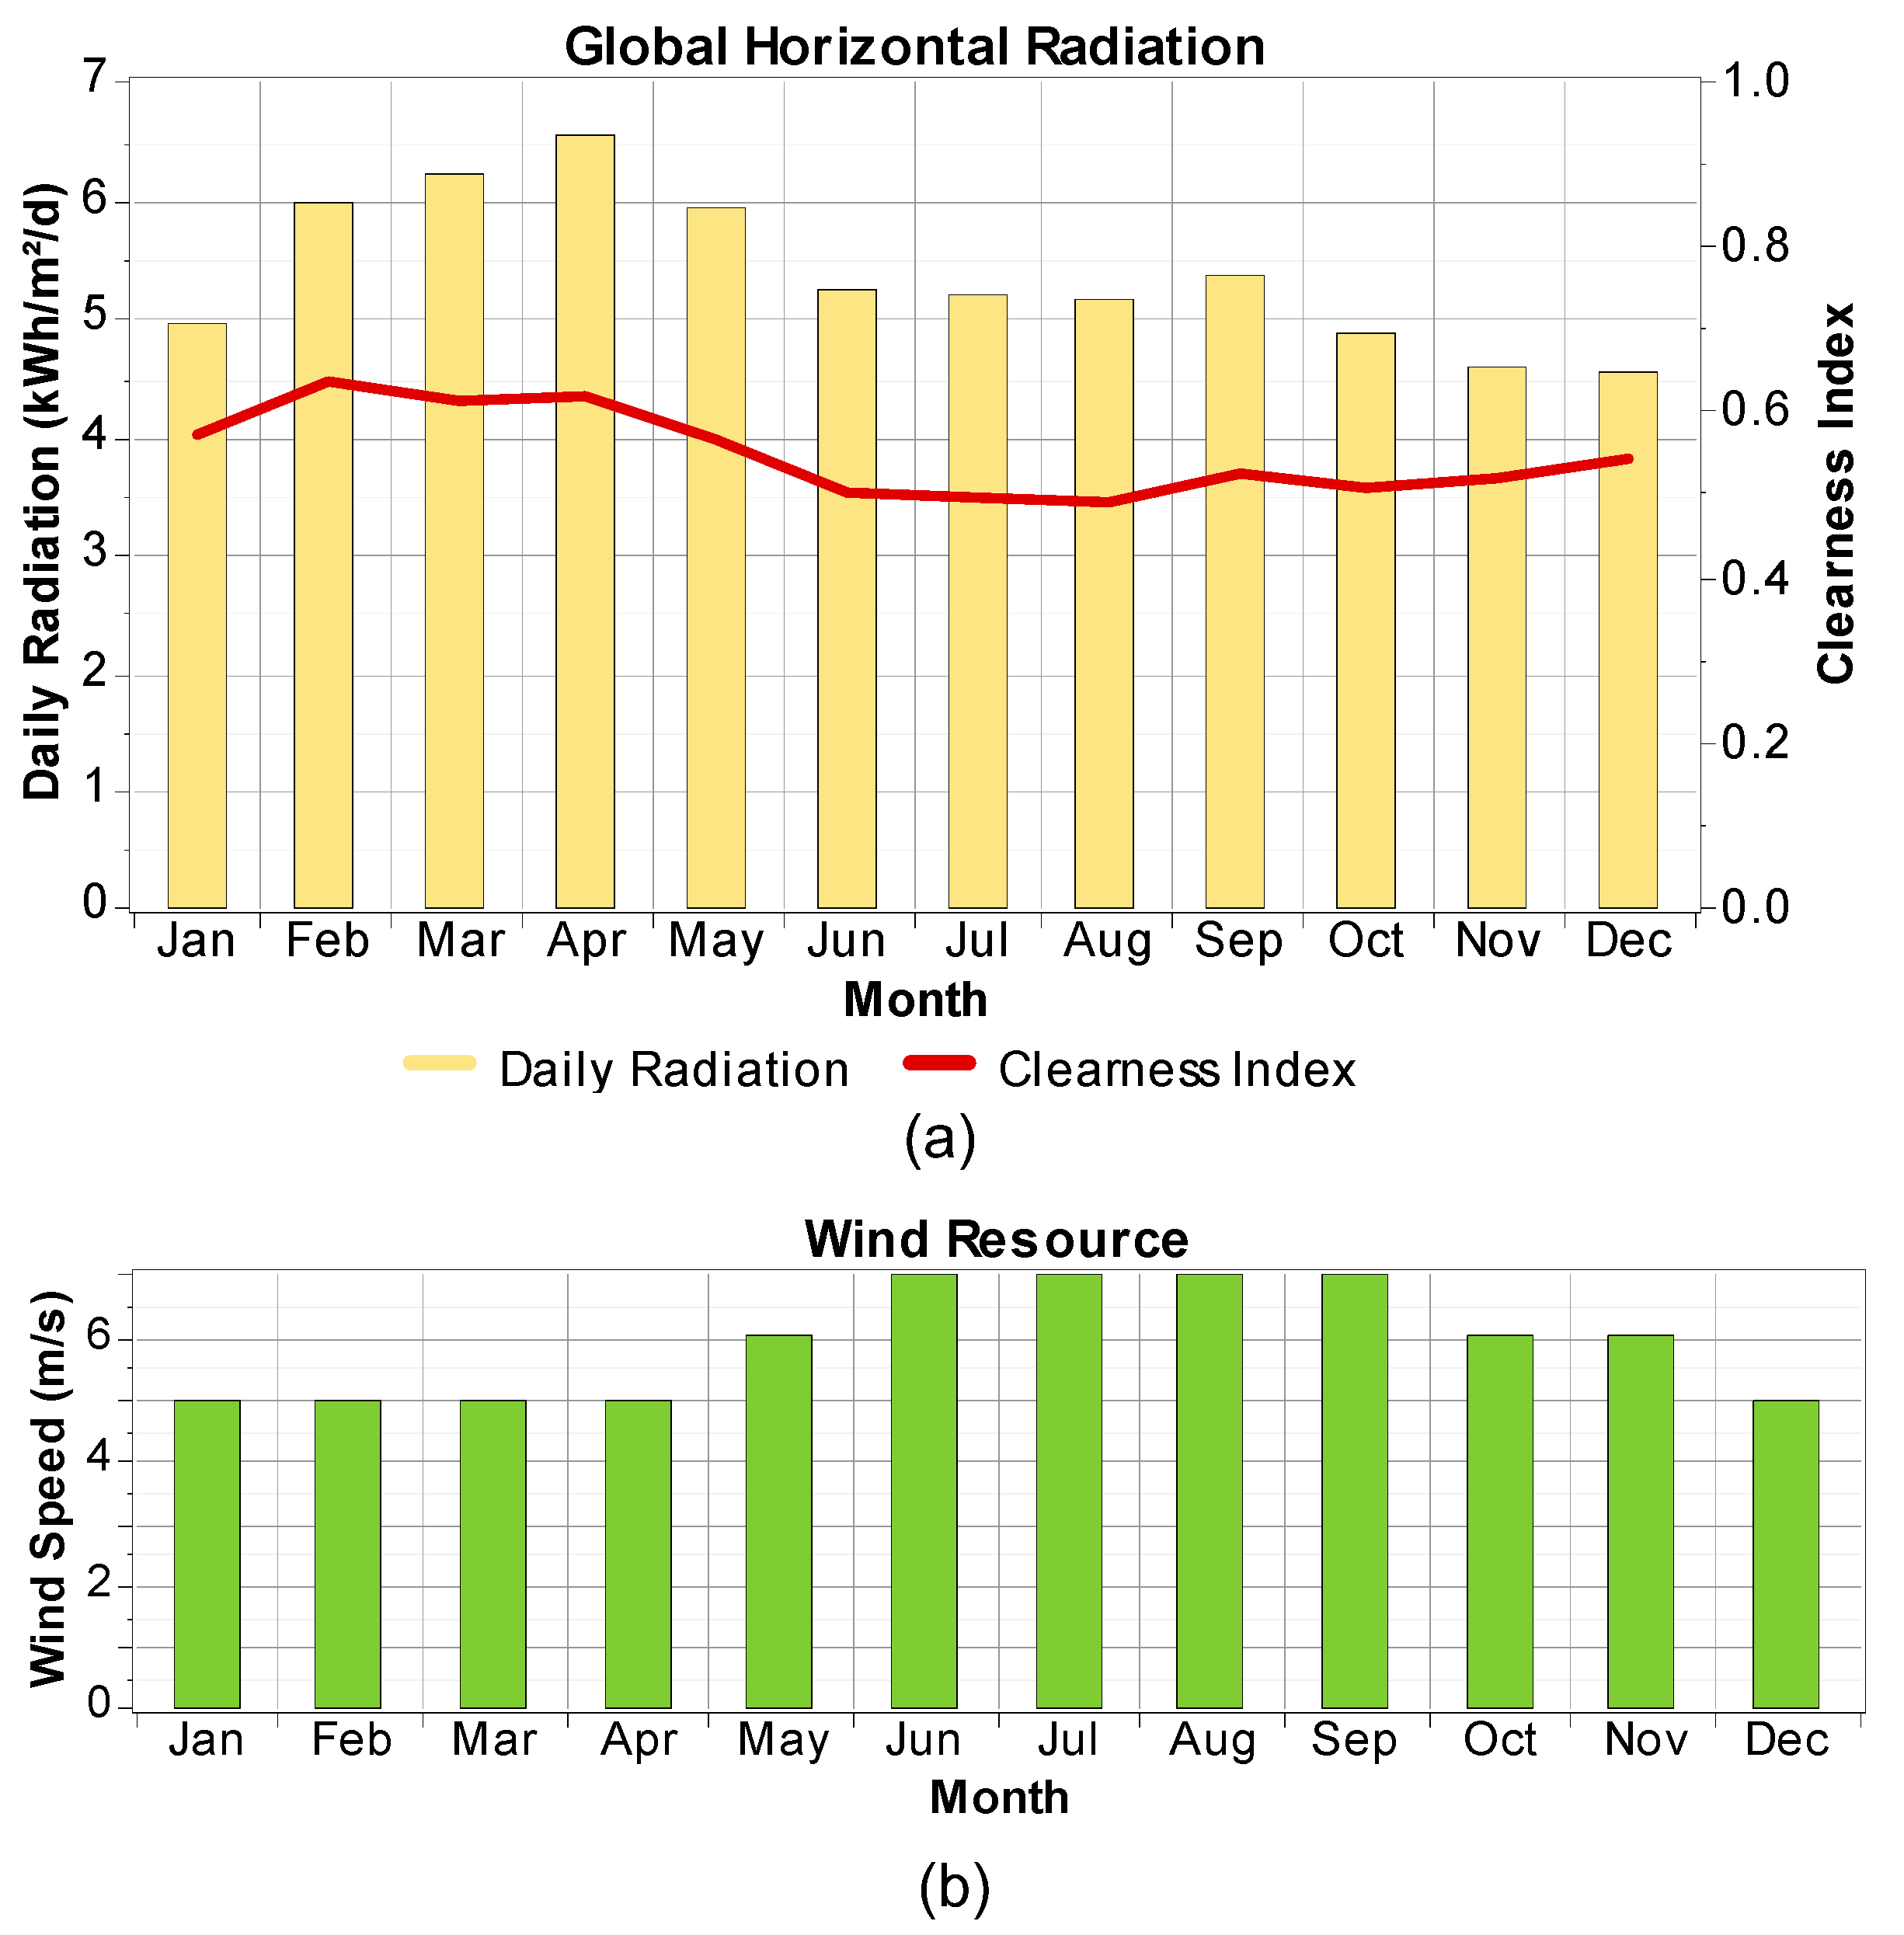
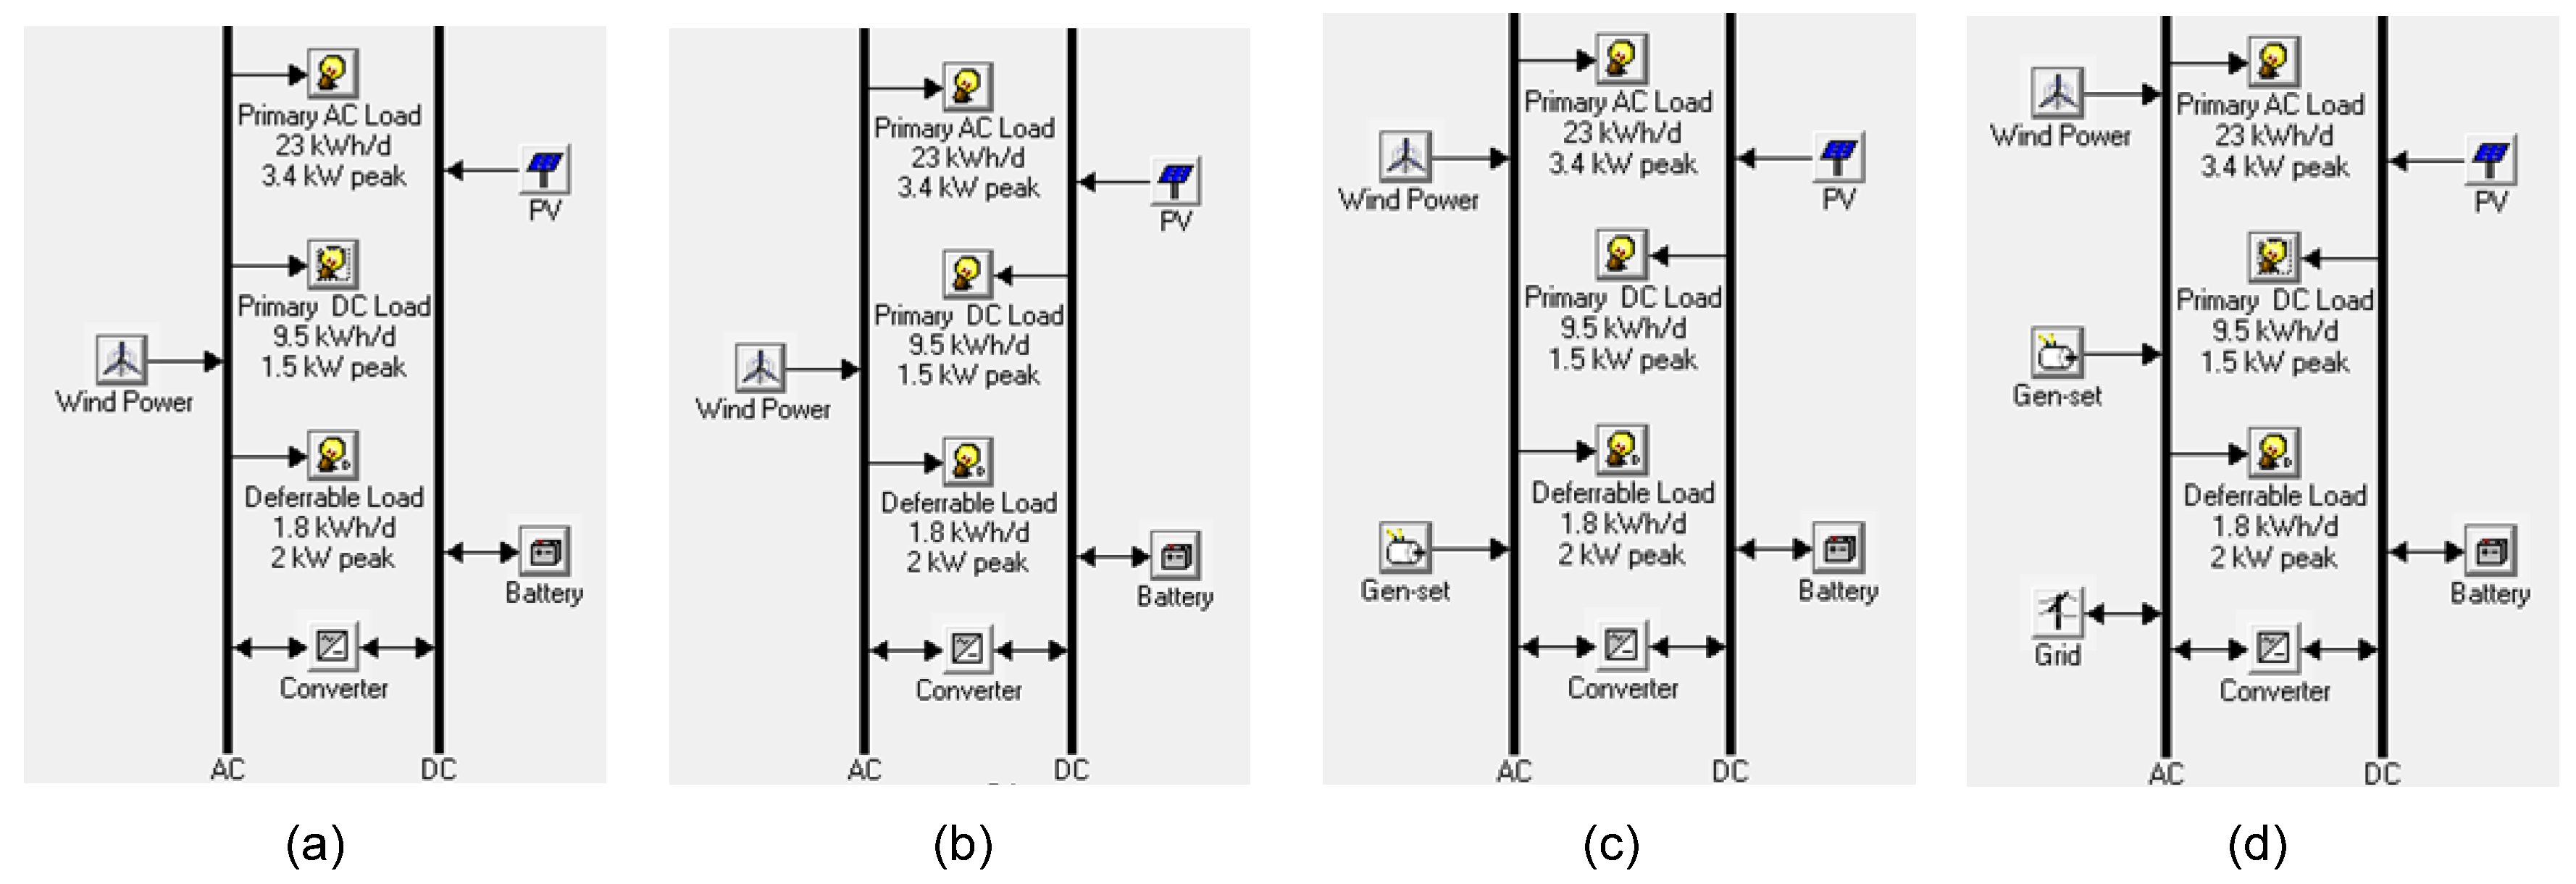
4. System under Consideration for Case Study

A case study was conducted in the southern part of the Asian continent, in the Puducherry-based urban region of India, to describe the further HRE design and development. The physical coordinates for this urban region are latitude 11.52 N and longitude 79.45 E. The selected metropolitan zones have a good solar annual average radiation of 5.38 kWh/m2/d and an annual average wind speed of 5.92 m/s. The goal of this case study is to recommend the ideal HRE setup for a residential type of form dwelling. Assuming that a house has three various types of load profiles, including a primary AC load generated by household appliances, internal external lights, refrigeration, wet grinders/mixers, washing machines, and dishwashers, among others. Its average daily demand is 23 kWh/d, with peak needs of 3.4 kW. Electrical car, electric fencing, and other DC loads generate around a 9.5 kWh/d DC load demand each day, with a high of 1.5 kW, and the form house irrigation system generates approximately 1.8 kWh/d, with a peak of 2 kW deferrable demand (Figure 6 and Figure 7). An optimal hybrid energy system is presented based on this site’s inputs, followed by a comparison analysis of all possible HRE setups. The following cases of analysis are used to fix the techno-economic performance feasibility report. The resource availability on the site has been illustrated in Figure 8
  • Case 1: Renewable-resources-based energy generation system without load classification
  • Case 2: Renewable-resources-based energy generation system with load classification
  • Case 3: Renewable- and fossil-fuel-based energy generation system with load classification
  • Case 4: Renewable, fossil fuel, and grid-connected system with load classification.
The four scenarios described above have a significant impact on the design of HRE systems. In the event where energy is generated by both AC and DC generators, but the load utility is only AC, the power flow begins with the AC and DC characteristics of generators, with all DC power wishing to be converted to AC for utility purposes. This energy utility cycle is mostly reliant on the capacity of batteries and inverters, as well as economic reasons. Due to the direct DC power utility possibilities, Case 2 has additional benefits, such as a lower DC to AC conversion loss. Due to uncompleted resources availability and uncertainties, both examples are constrained by generator oversizing. In Case3, the burdens of oversizing are shared by fossil-fuel-based energy sources. The addition of a genset addresses the peak load management of an excising HRE system. Moreover, there are concerns in this instance with surplus energy capacity. This could be avoided by implementing net metering and an excising system. The structures of all four examples are developed as shown in Figure 9.

5. Result and Discussion

A micro-grid based on hybrid energy sources has various research outcomes as solutions to the current scenario’s problems. Future load needs may have an impact on how well a micro-grid is implemented and how long it lasts. The selective innovative deep belief networks outperform the other well-known prediction technologies in terms of MAPE values. The HOMER-based simulation models also achieve a better optimum sizing design of the HRE system and its performance analysis. The energy efficiency of the proposed system, as well as its demand-based behaviors, is examined using the necessary DSM training codes.

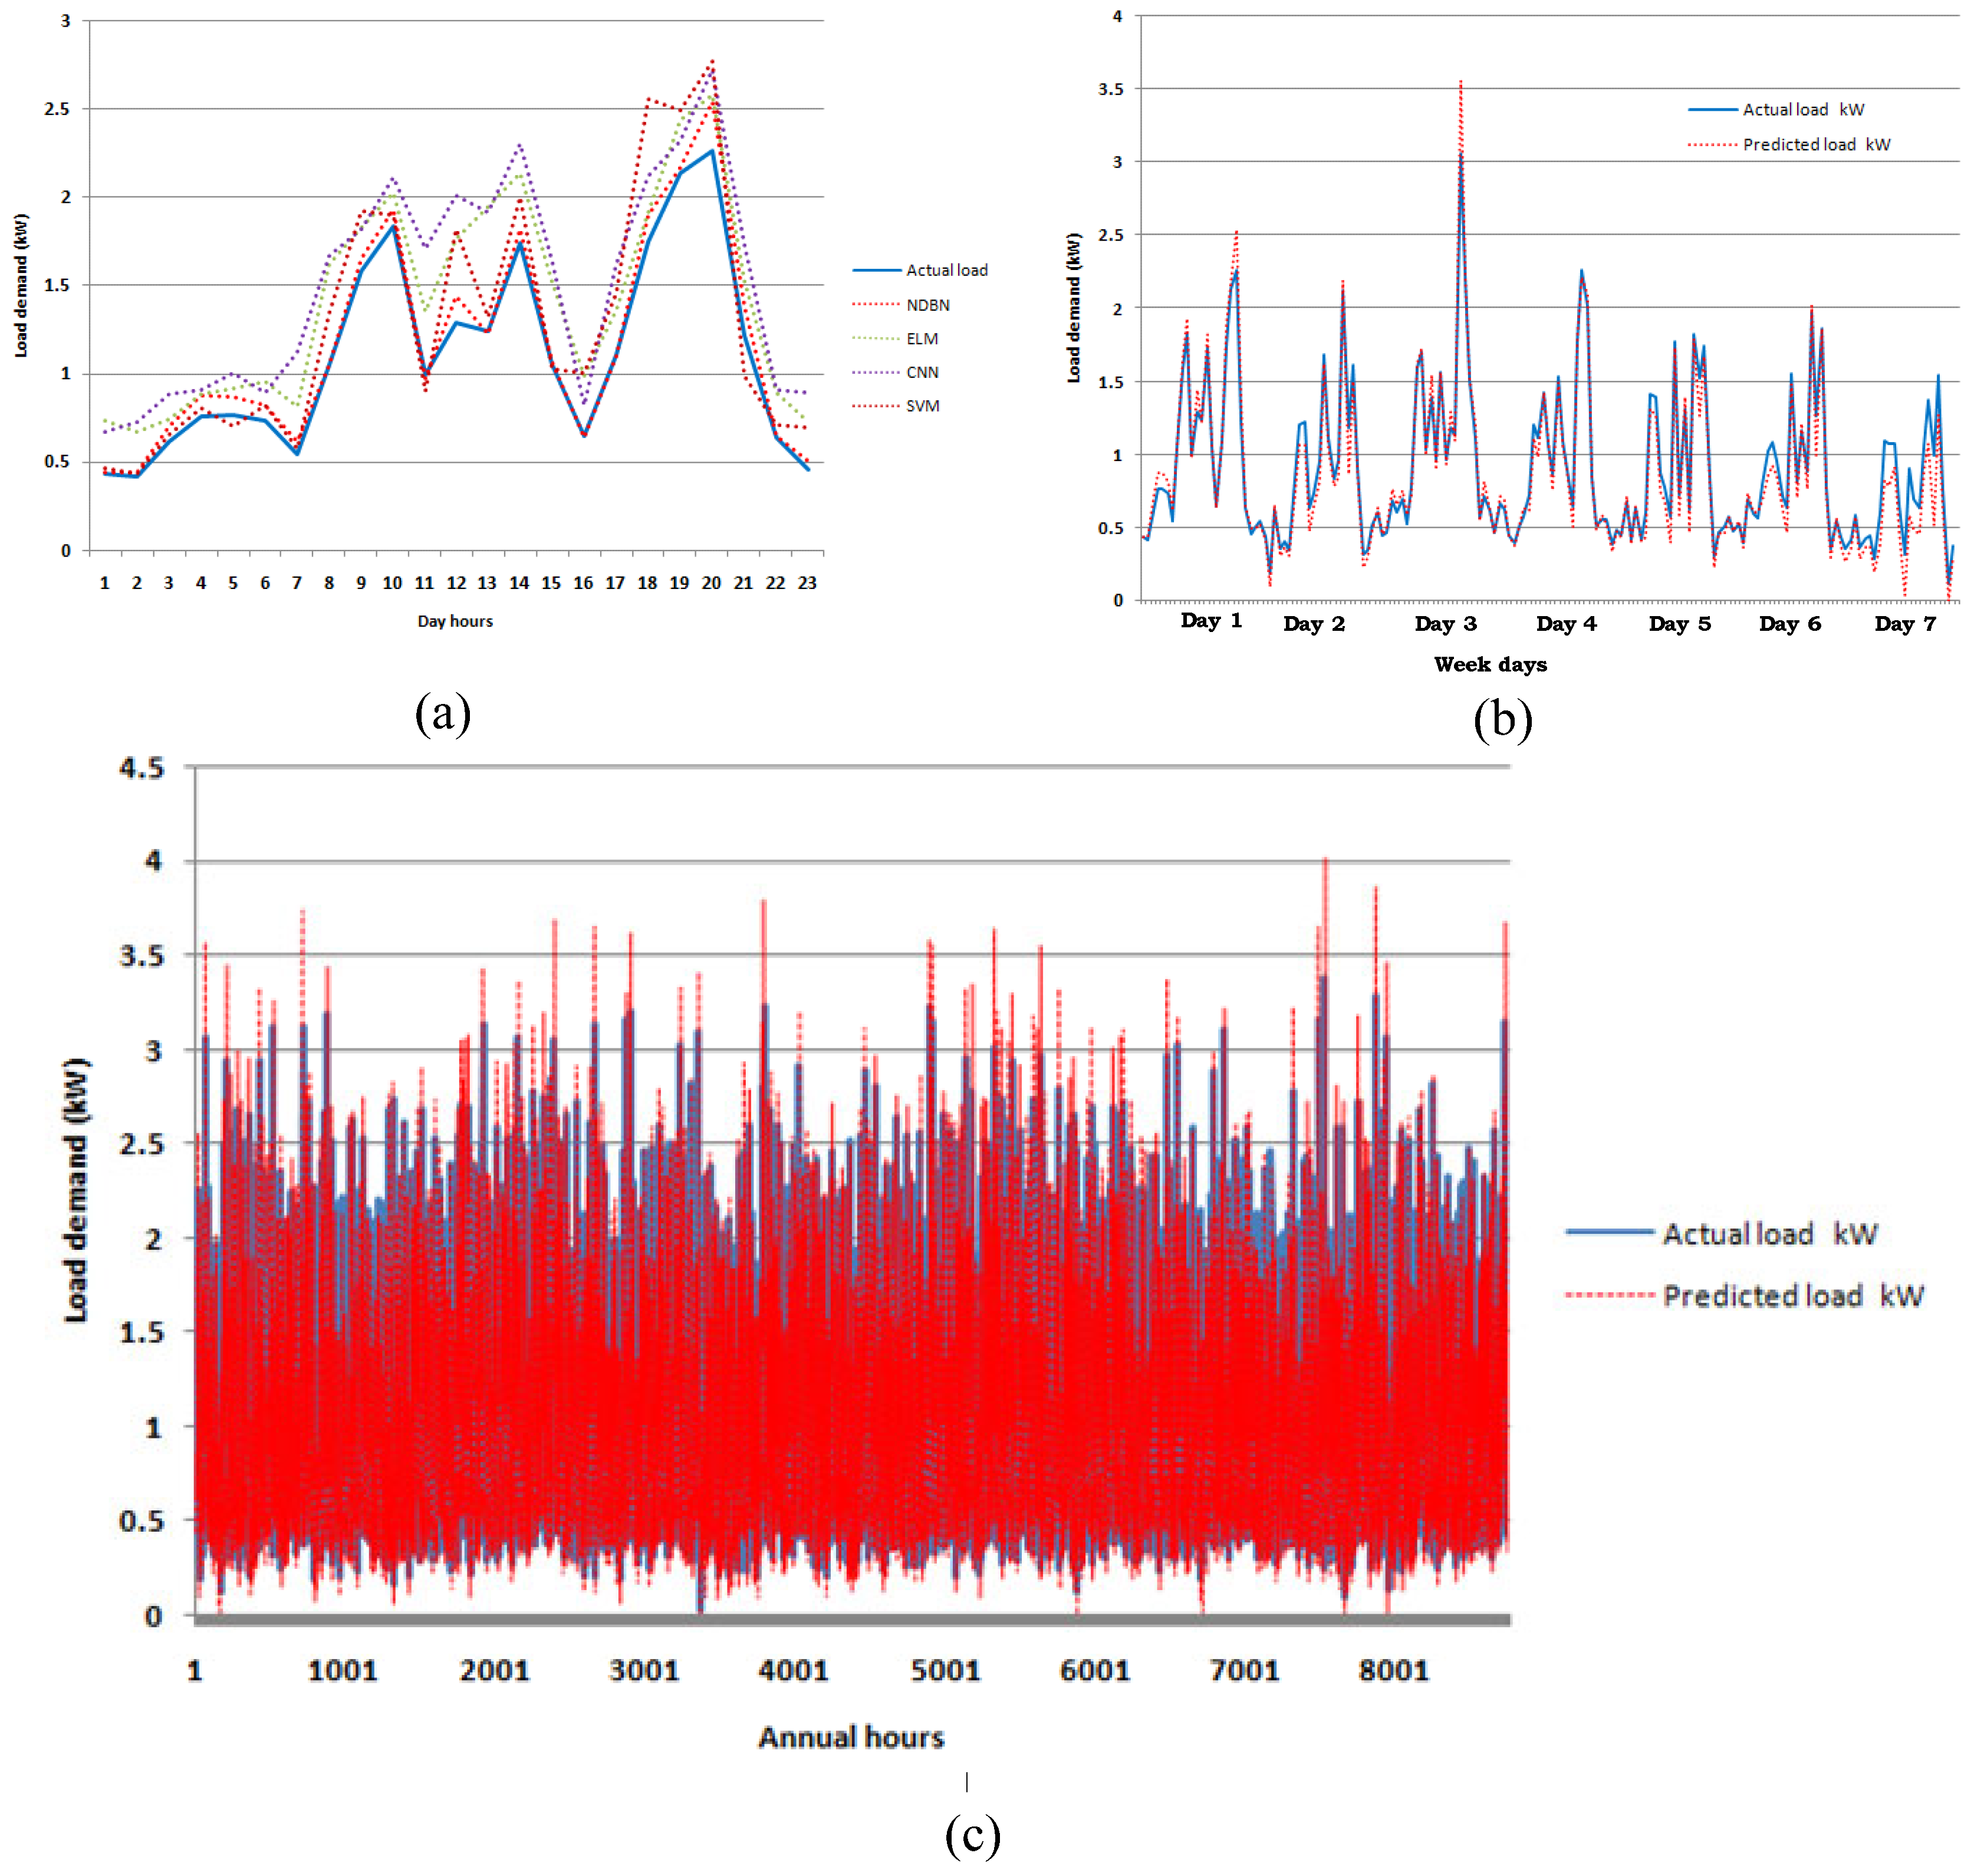
5.1. Load Prediction

The NDBN approach’s demonstrated layer-by-layer pre-training and level-by-level fine-tuning techniques express great forecasting accuracy with fast estimated MAPE values of 5.99% in the summer and 6.96% in the winter. Figure 10 depicts the load demand forecast based on historical data as a day-ahead analysis and a week-ahead prediction (from Figure 9a,b). Figure 9c depicts the annual load prediction of the NDB network.
Table 3 chiefly compares the prediction indexes of the chosen deep belief network methodology to well-known prediction technologies such as classical neural networks, the extreme learning machine method, and the support vector regression machine method. The summer and winter data histories are thoroughly and separately examined by all approaches, and it is discovered that the NDBN-based data-driven methodology prediction has realistic future load demand values with the least MAPE percentage value. NDBN approaches also outperform other prediction models in terms of root-mean-square error and index agreement.

5.2. HRE System Optimization

In terms of HRE system optimization, the findings reveal a slew of implications for further research. The main preliminary influencing essential variables for hybrid energy system design and development for effective resource use are identified. Energy balance algorithms are used to build and simulate a variety of hybrid energy systems. In this part, the simulation results and findings are provided as simulation outcomes.

5.2.1. Technical Performance

Four major scenarios are examined here, each with more design impacts such as technical features, economic parameters, and environmental considerations. The energy contribution of each generation component, renewable factors, continuous and quality load supply over the available RE and other resources management, and optimum fit of component selection are all determined in agreement with the technical performances of the system (Table 4). Figure 11 clearly shows that PV/wind/generator/grid with a battery backup system has more advantages than other setups. In example 4, the levelized cost of energy (COE) is IND 14.45 per kWh, which is the lowest COE possible due to energy utilities obtained from a variety of sources. Because of the variability in the behavior of solar and wind potentials; energy output from RE resources may not be able to meet our need. Because of this, so-called oversizing of RE generators could be an option for achieving objectives. As a result, the energy contribution of each system could differ in technical performance. Because of the fixed size of generating resources and the changeable nature of energy utility, Cases 1 and 2 do not sustain any energy contributions. According to resource availability viewpoints, wind turbines provided the most power, followed by solar, conventional grid utility, and finally fossil-fuel-based energy generation. Figure 11 shows how fossil-fuel-based production supports peak load management in fully autonomous grid systems and grid connected systems, enhancing performance in terms of COE reduction, active income addition to the project, and efficient use of excess produced energy from the entire network.

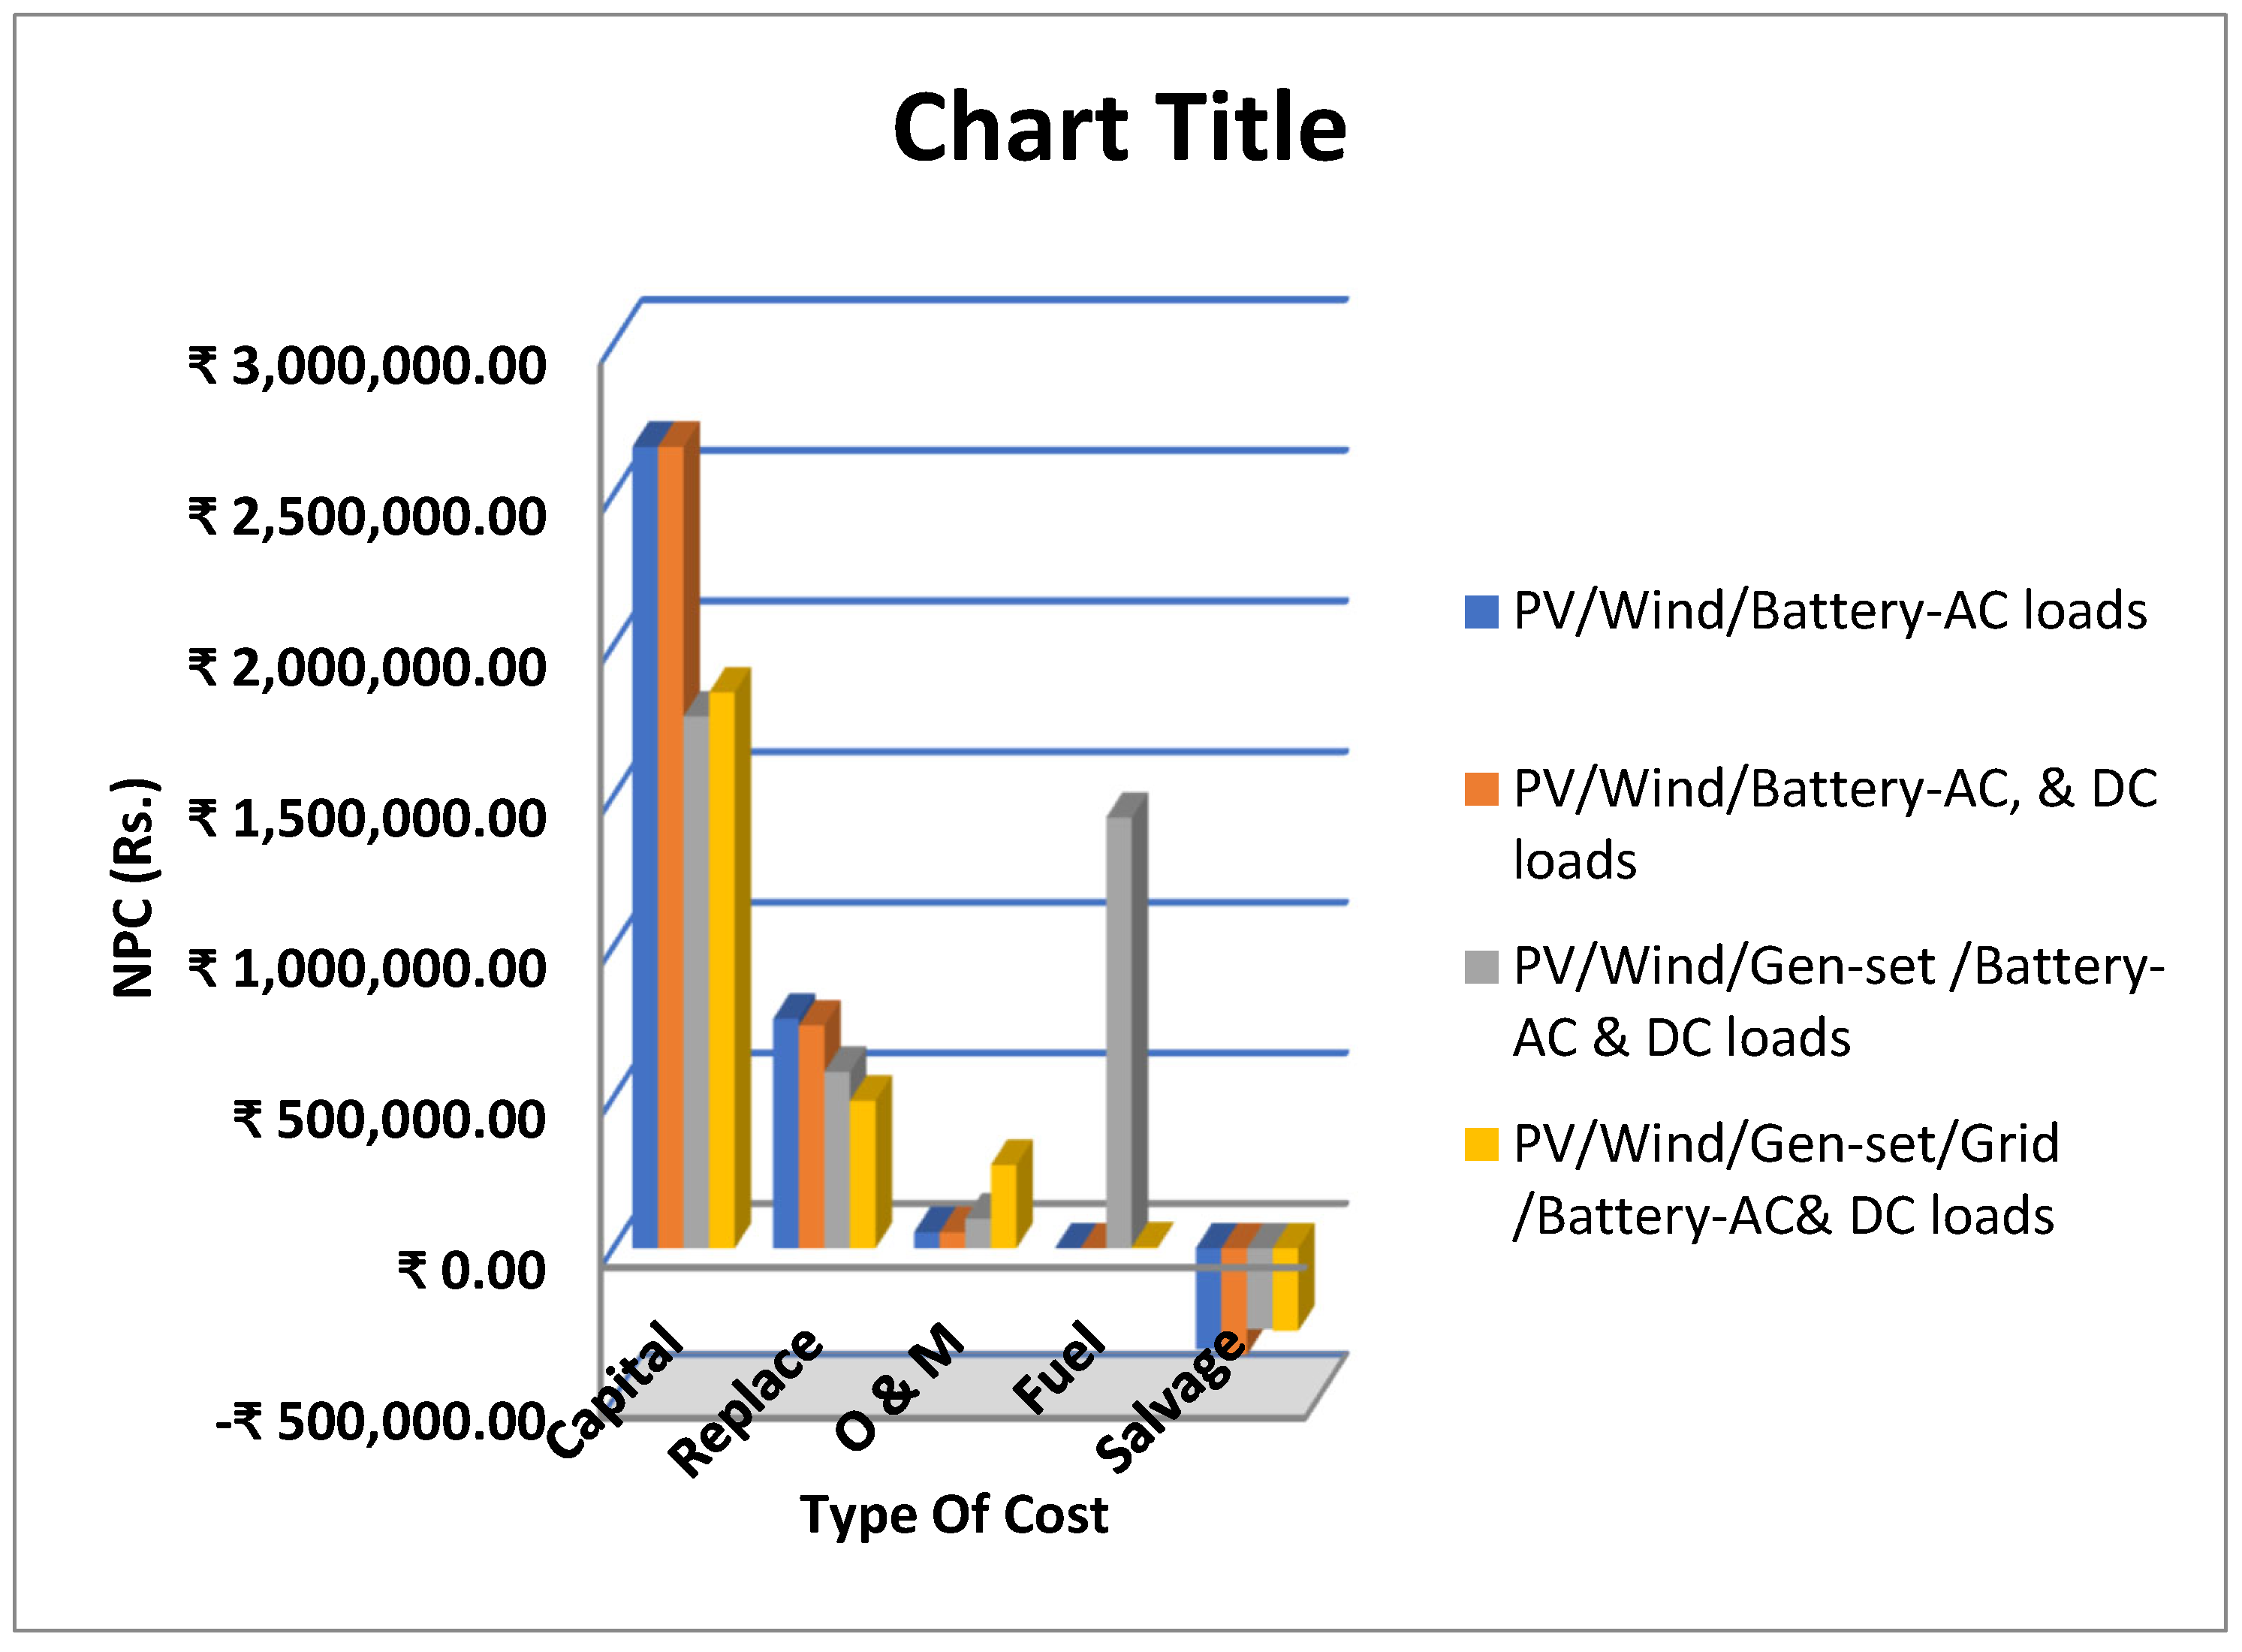
5.2.2. Economic Performance

The decision to choose a hybrid energy system is based mostly on economic considerations. From the start of the art related to this HRE system design, it is boldly stated that the decisions of developed countries are primarily focused on performance-oriented merit systems, while the decisions of developing countries are primarily focused on economically beneficial merit systems, such as initial investments, annual expenditures, the cost per unit of energy production, the complete cash flow in the project over the project’s life span, and so on. Based on total net present cost, this case study identifies an economically viable hybrid arrangement. The NPC shows the project’s current value in terms of system capital and nominal interest rate, as well as system performance depreciation values. The capital values are determined by the sizing of the HRE system components. The cost of replacement is determined by the life span of the HRE components. The operation and maintenance cost NPC varies by the energy flow path between generation and consumption. Expect the genset-powered system to remain in its current configuration with no fuel costs. After the project is completed, the salvage cost expresses the project’s worth in terms of cost values. From Figure 12, it is clearly concluded that pure renewable configurations are stacking more capital expenditures.
The investment sinking features of conventional and renewable energy mix configurations are feasible. One of the deciding factors for replacement and O&M cost expenditures is the kind of energy utility (AC or DC). Oversizing components causes more NPC in the system. Effective peak load control technologies and extra power injections into the conventional grid from the proposed hybrid system can compensate for NPC values.

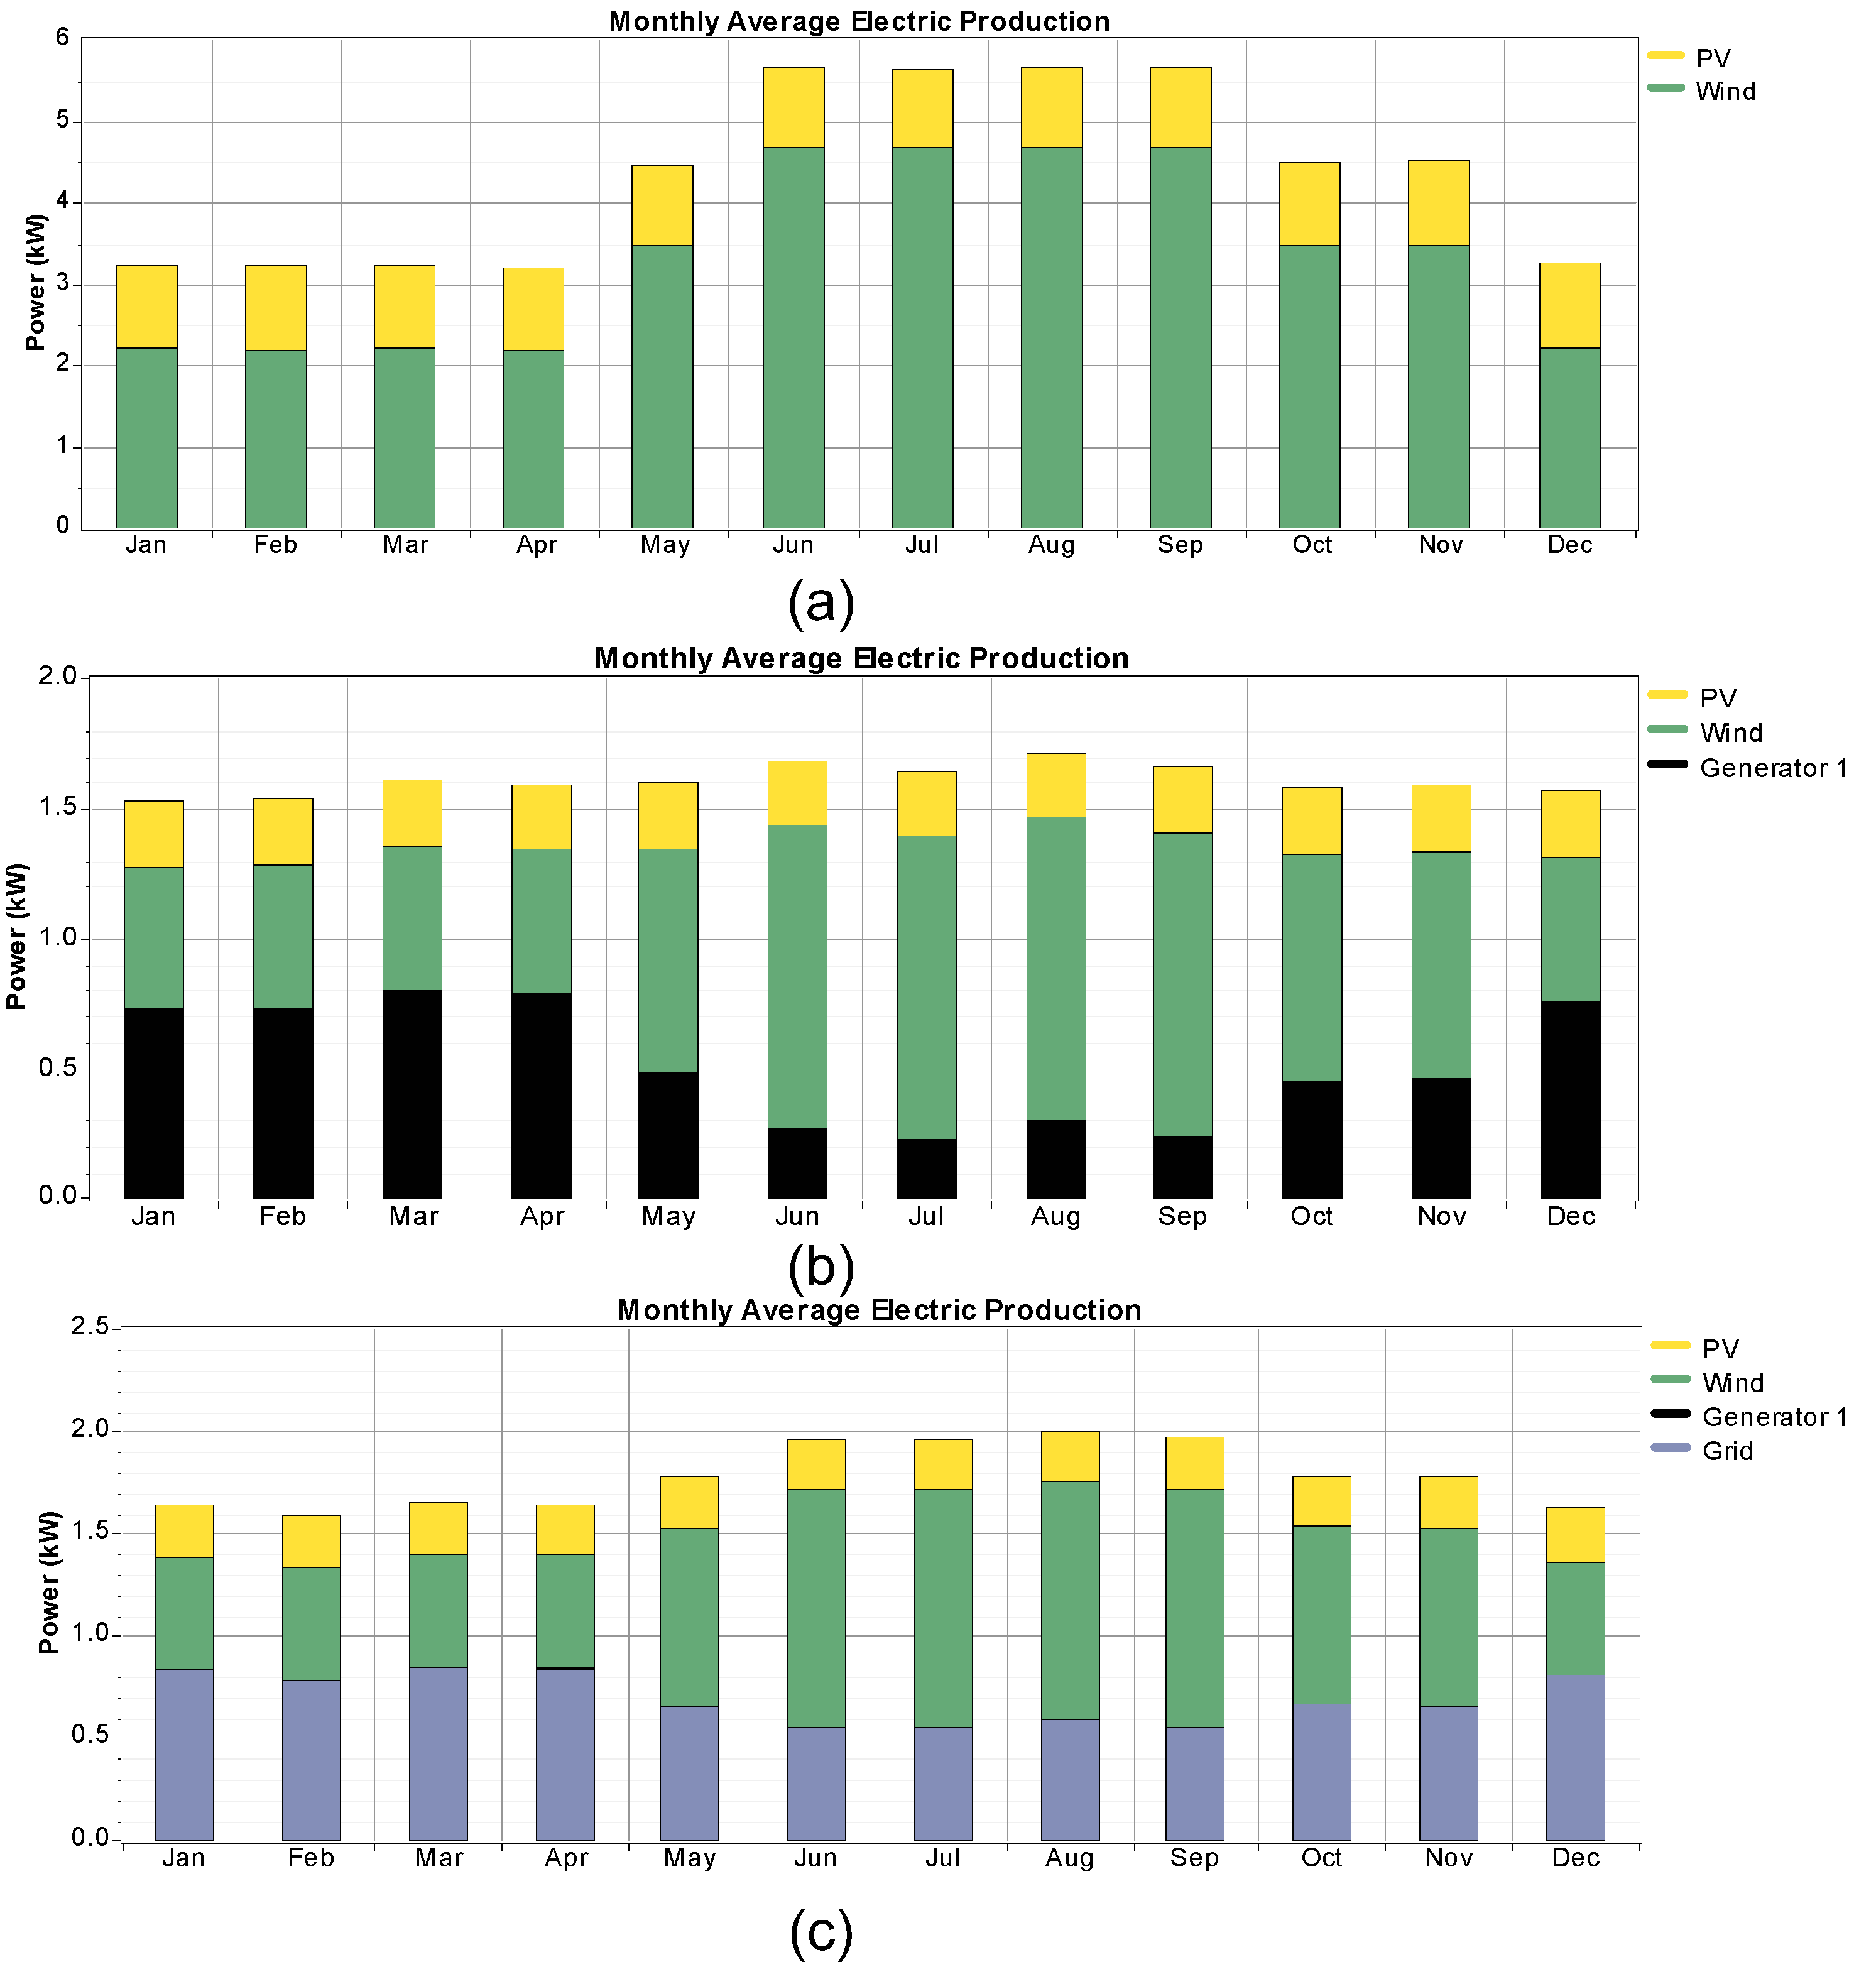
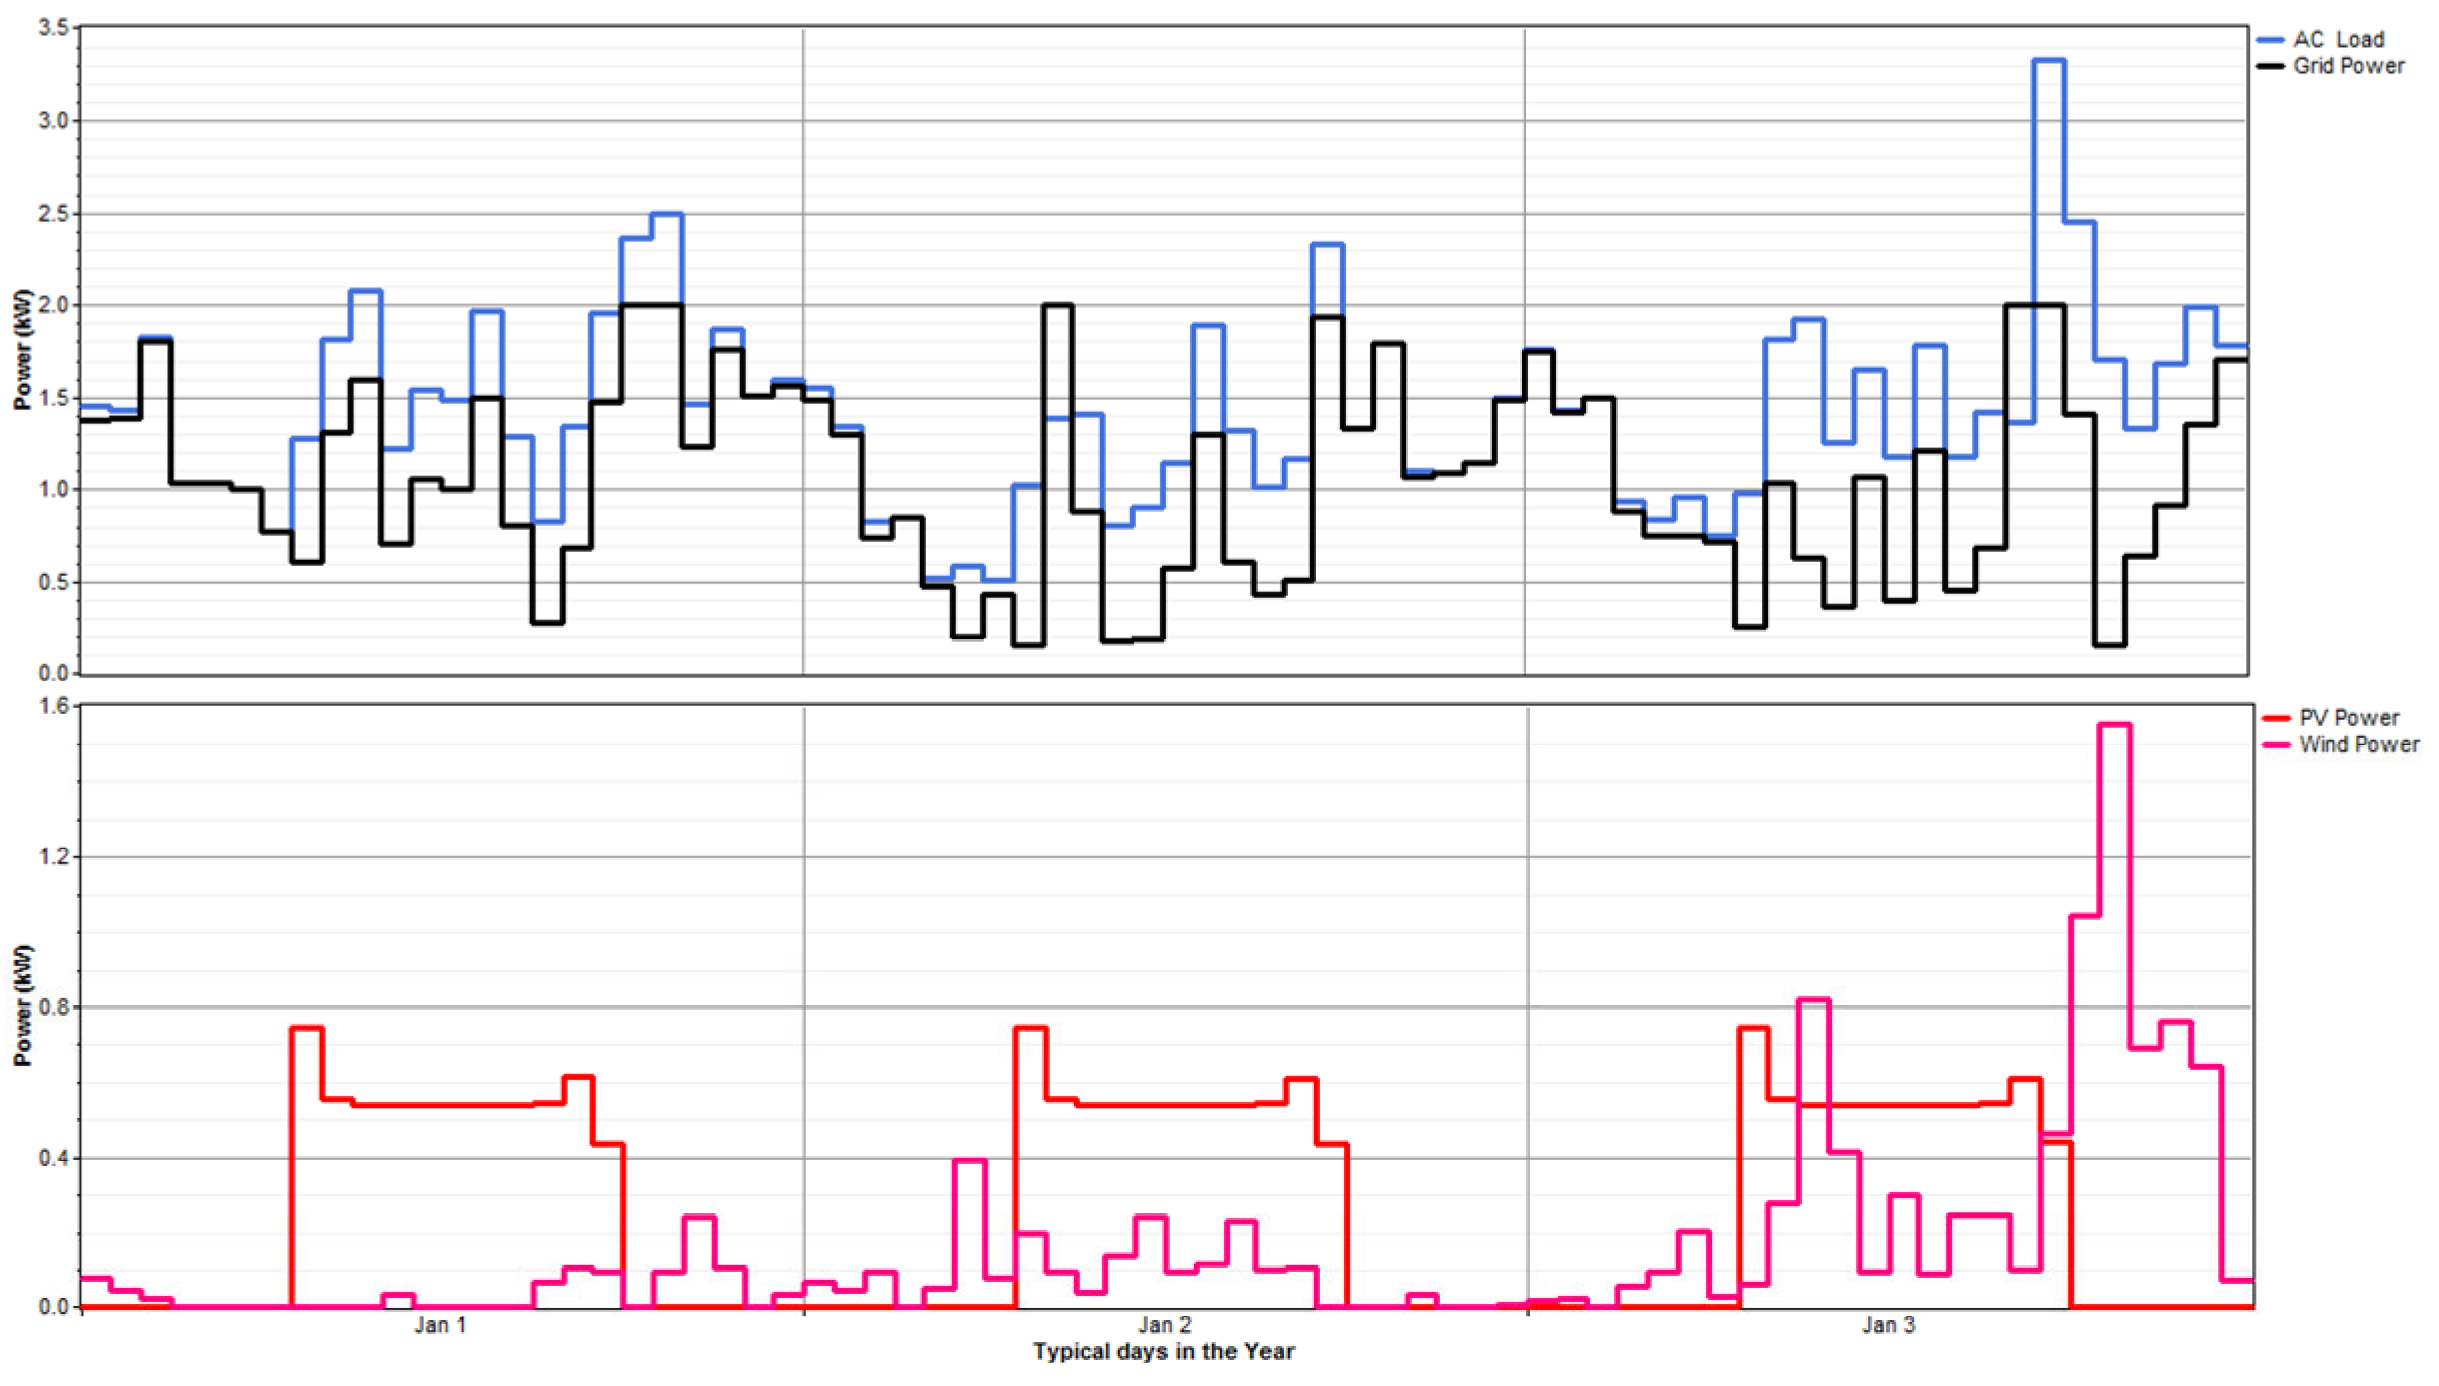
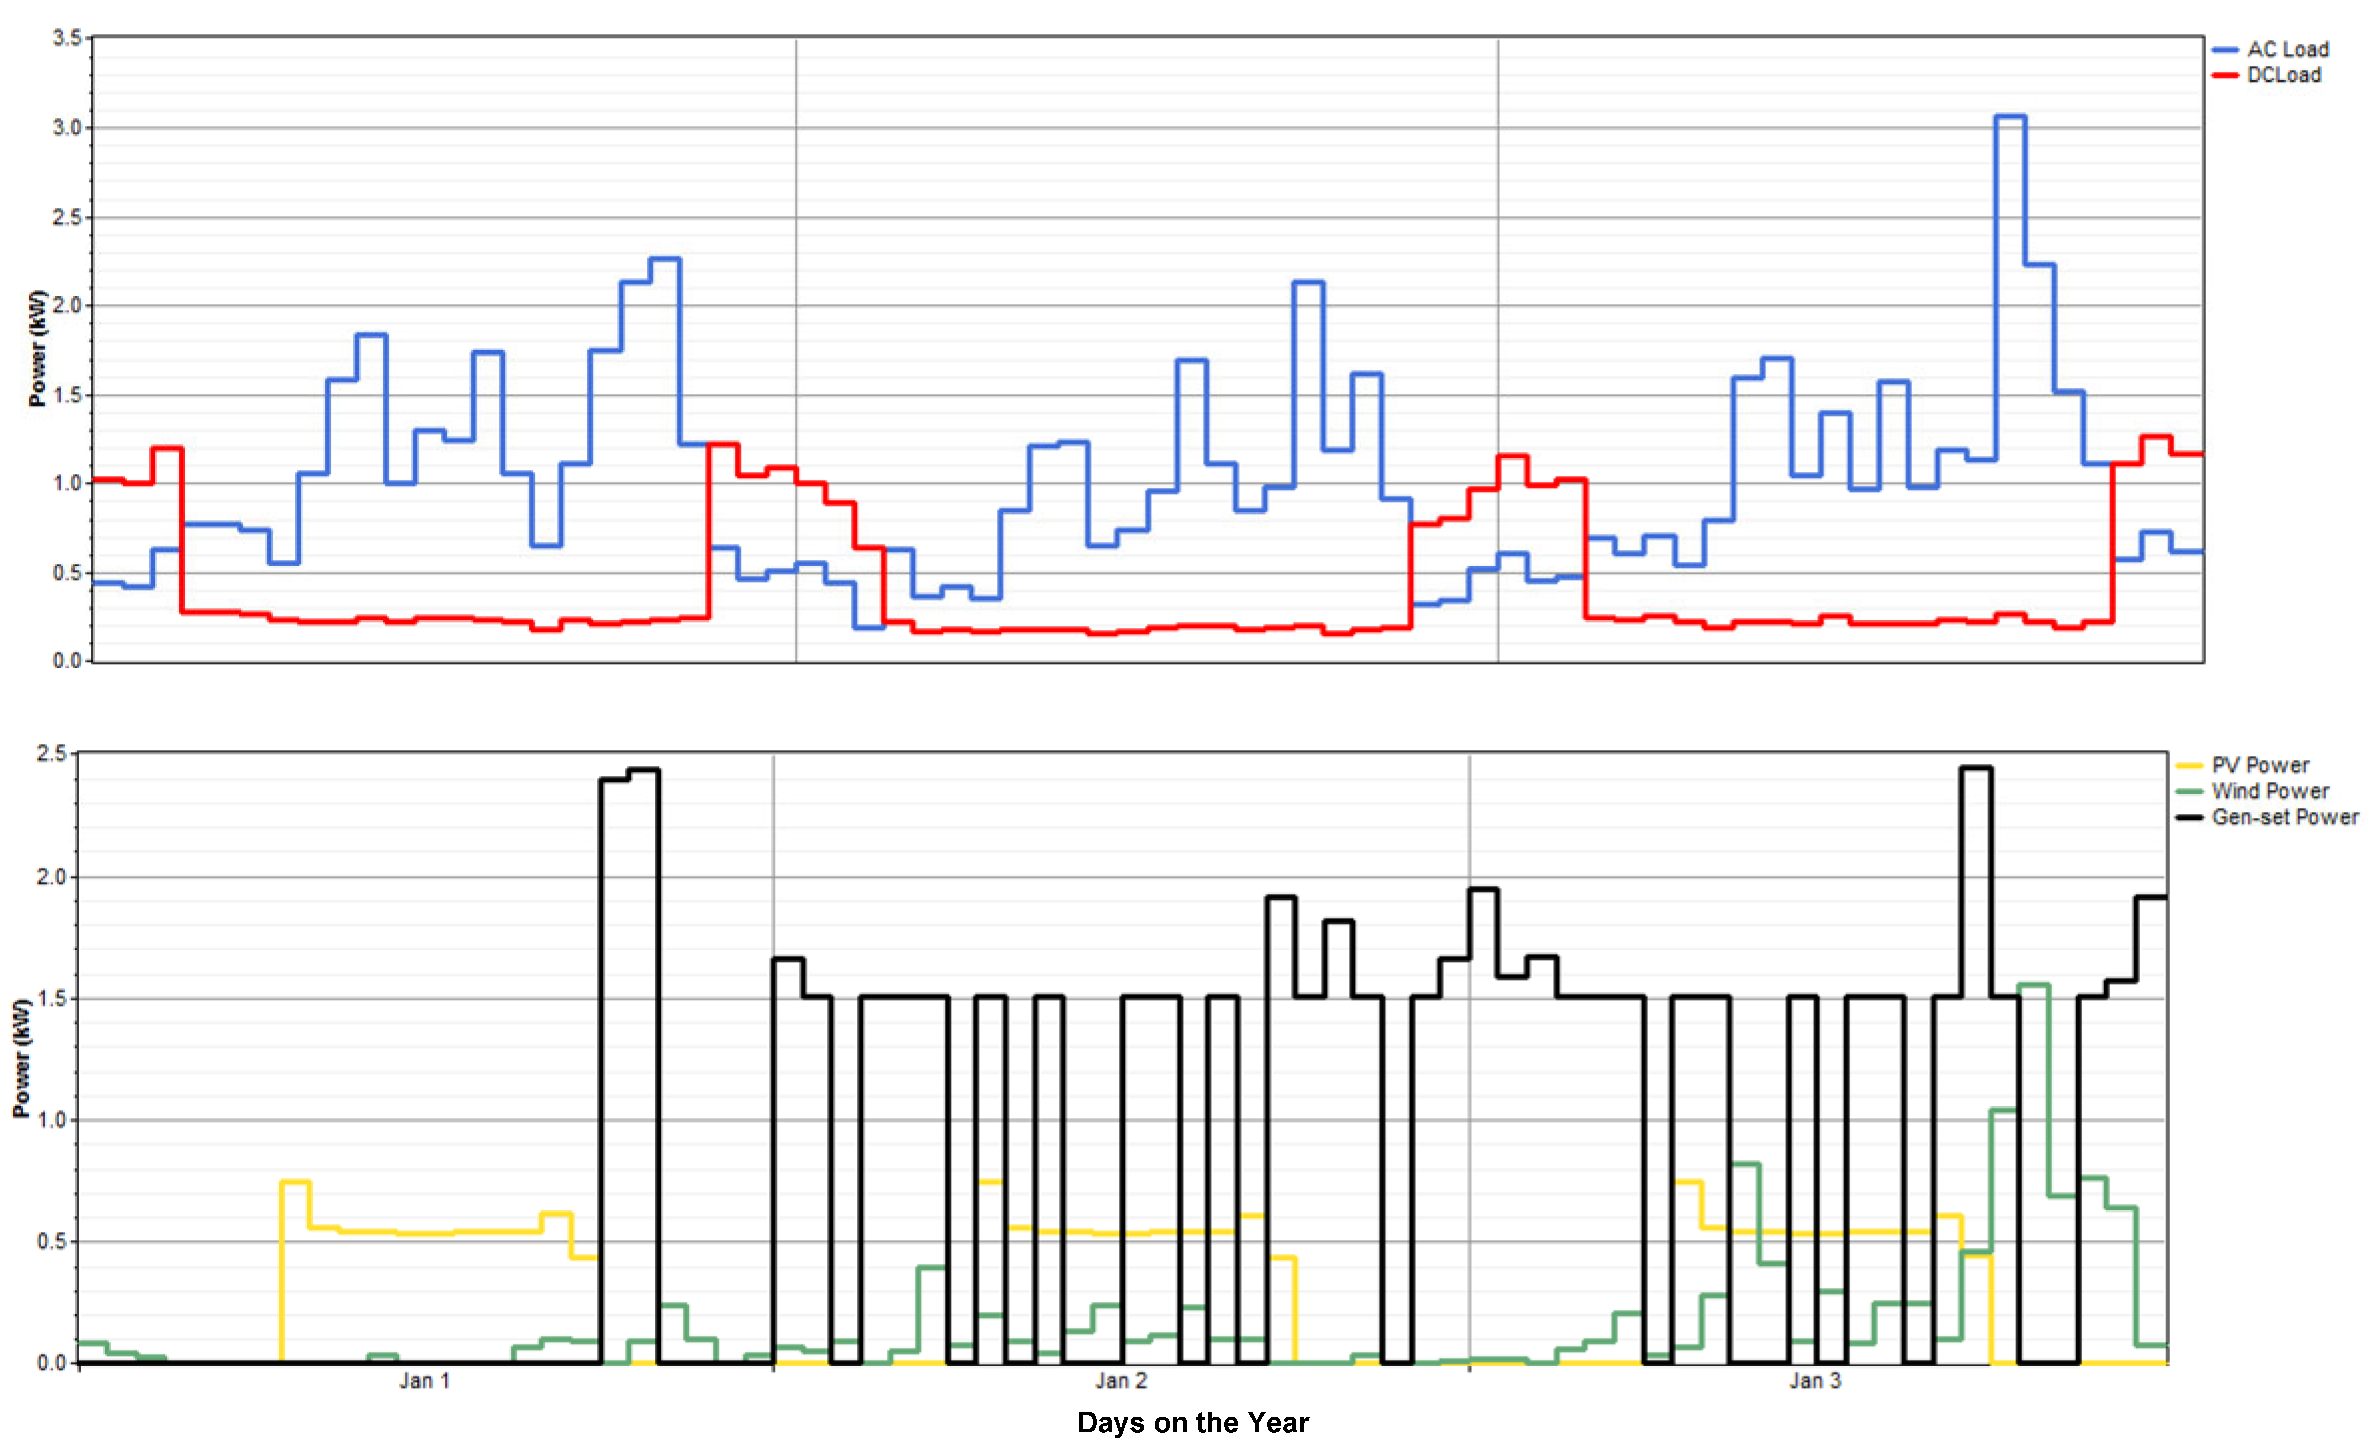
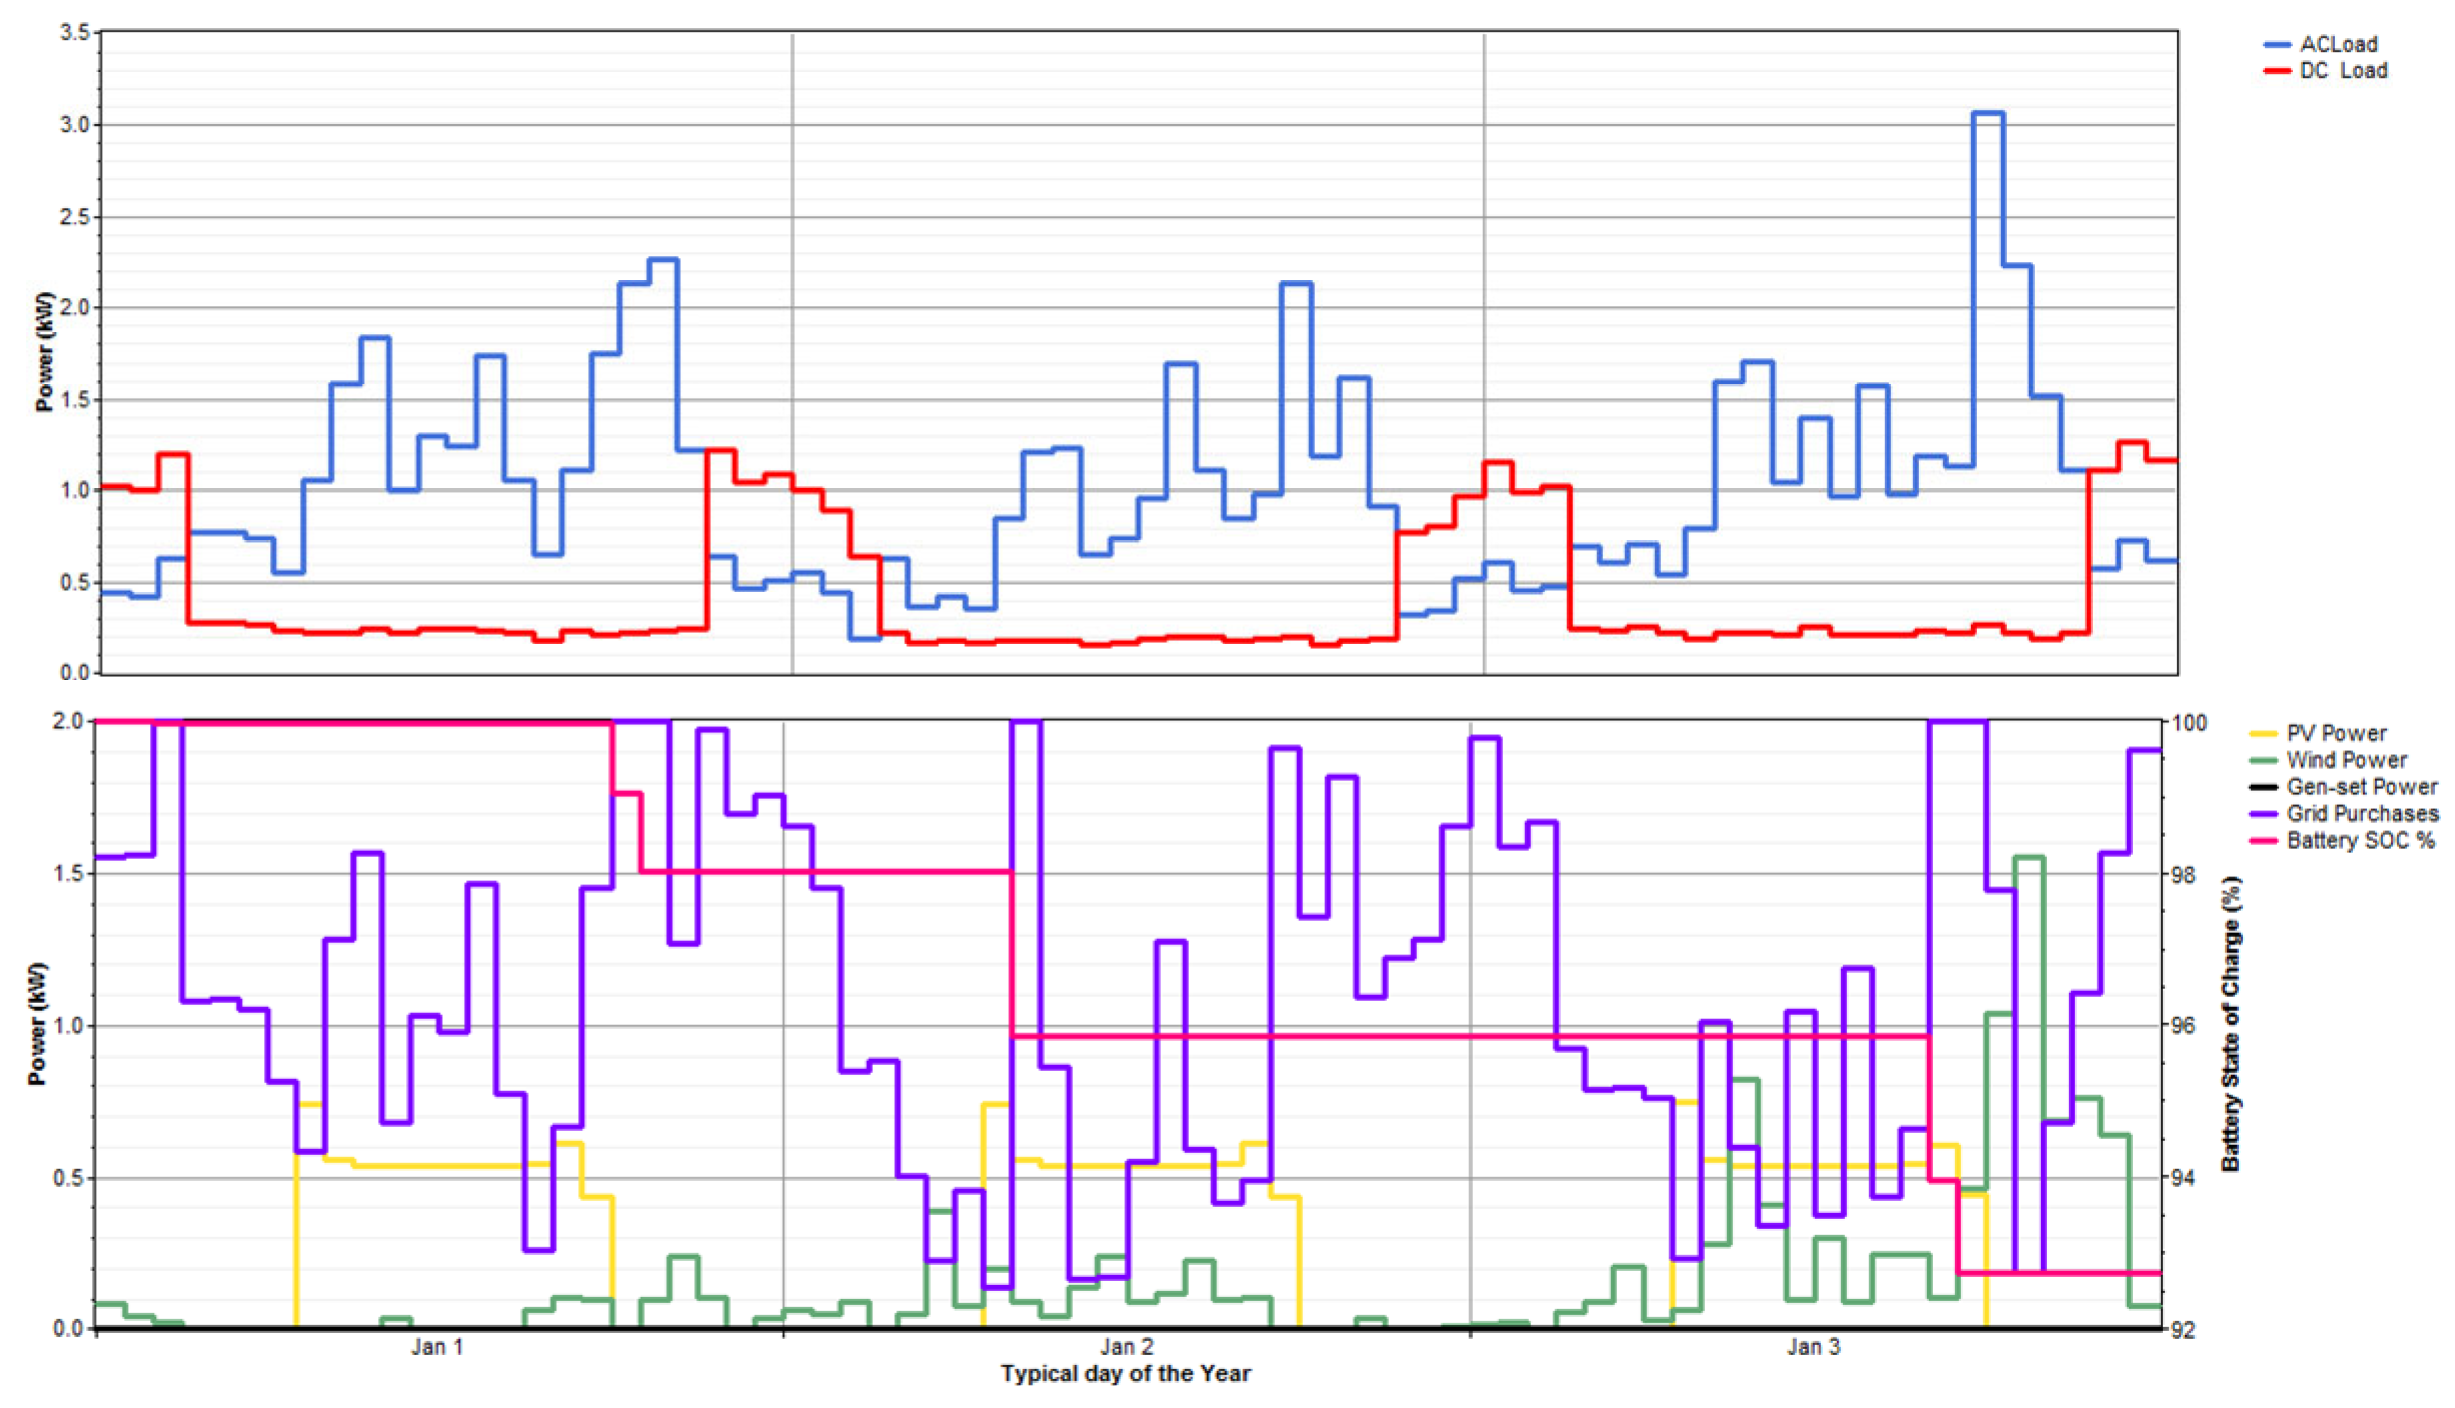
5.2.3. Energy Balance Characteristics of the System

The overall/total performance of system is expressed using a selected optimization technique throughout the year. The performance parameters of energy generators and energy utilities by diverse loads are also available. The normal consecutive three days of the year (i.e., 1–3 January) are displayed in this part. The details of every hour of three consecutive days ‘energy generation and consumption by the load are shown in Figure 13, Figure 14, Figure 15 and Figure 16. Case 1 attempts to meet the developed demand with excess renewable energy of 24,284 units per year and an unmet load of 1.84 kW per year. In this situation, all the energy might be used in the form of AC, resulting in so-called unmet load conditions and even perfect HRE component sizing. When the independent AC and DC loads of form homes are active, this unfulfilled load percentage may be eliminated.
This example has an impact on the excising system by improving net energy utility efficiency and lowering energy conversion losses. Case 3 uses the minimum possible HRE components, as well as additional peak load management technology. As a result of the new technology, our system now has less NPC (net present cost). Providing conventional grid connectivity to the system, as in instance 4, could improve the techno-economic analysis of the HRE system even more. All the multi-objectives of our micro-grid design difficulties, such as oversizing, surplus electrical capacity, enhanced energy supply, and an economically flexible and ecologically sustainable system design, are addressed in this scenario. Table 4 and Table 5 in this paper help to understand this.

5.2.4. Environmental Performance

The environmental consequences of hybrid energy generation configurations are examined in this section. In India, traditional grid systems provide roughly 65%. Most of the concerns with the traditional grid are resolved. The world is now encouraging private investors to participate in renewable energy to promote long-term energy development. This case study demonstrates that current technological updates should be implemented in phases. For solitary rural area electrification, sudden RE generation is highly recommended. When a mix of renewable and conventional energy is used in urban areas, the electricity systems in those areas benefit. Case 3’speak load management results in extra environmental emissions in this case study. This hypothetical HRE sustainability argument can alternatively be solved by biomass-based energy generation or other peak load management technologies including demand-side management, time-of-use pricing implementations, economic load scheduling, etc. In comparison to the performance-enhanced Case 3, Case 4 emits fewer GHG emissions.

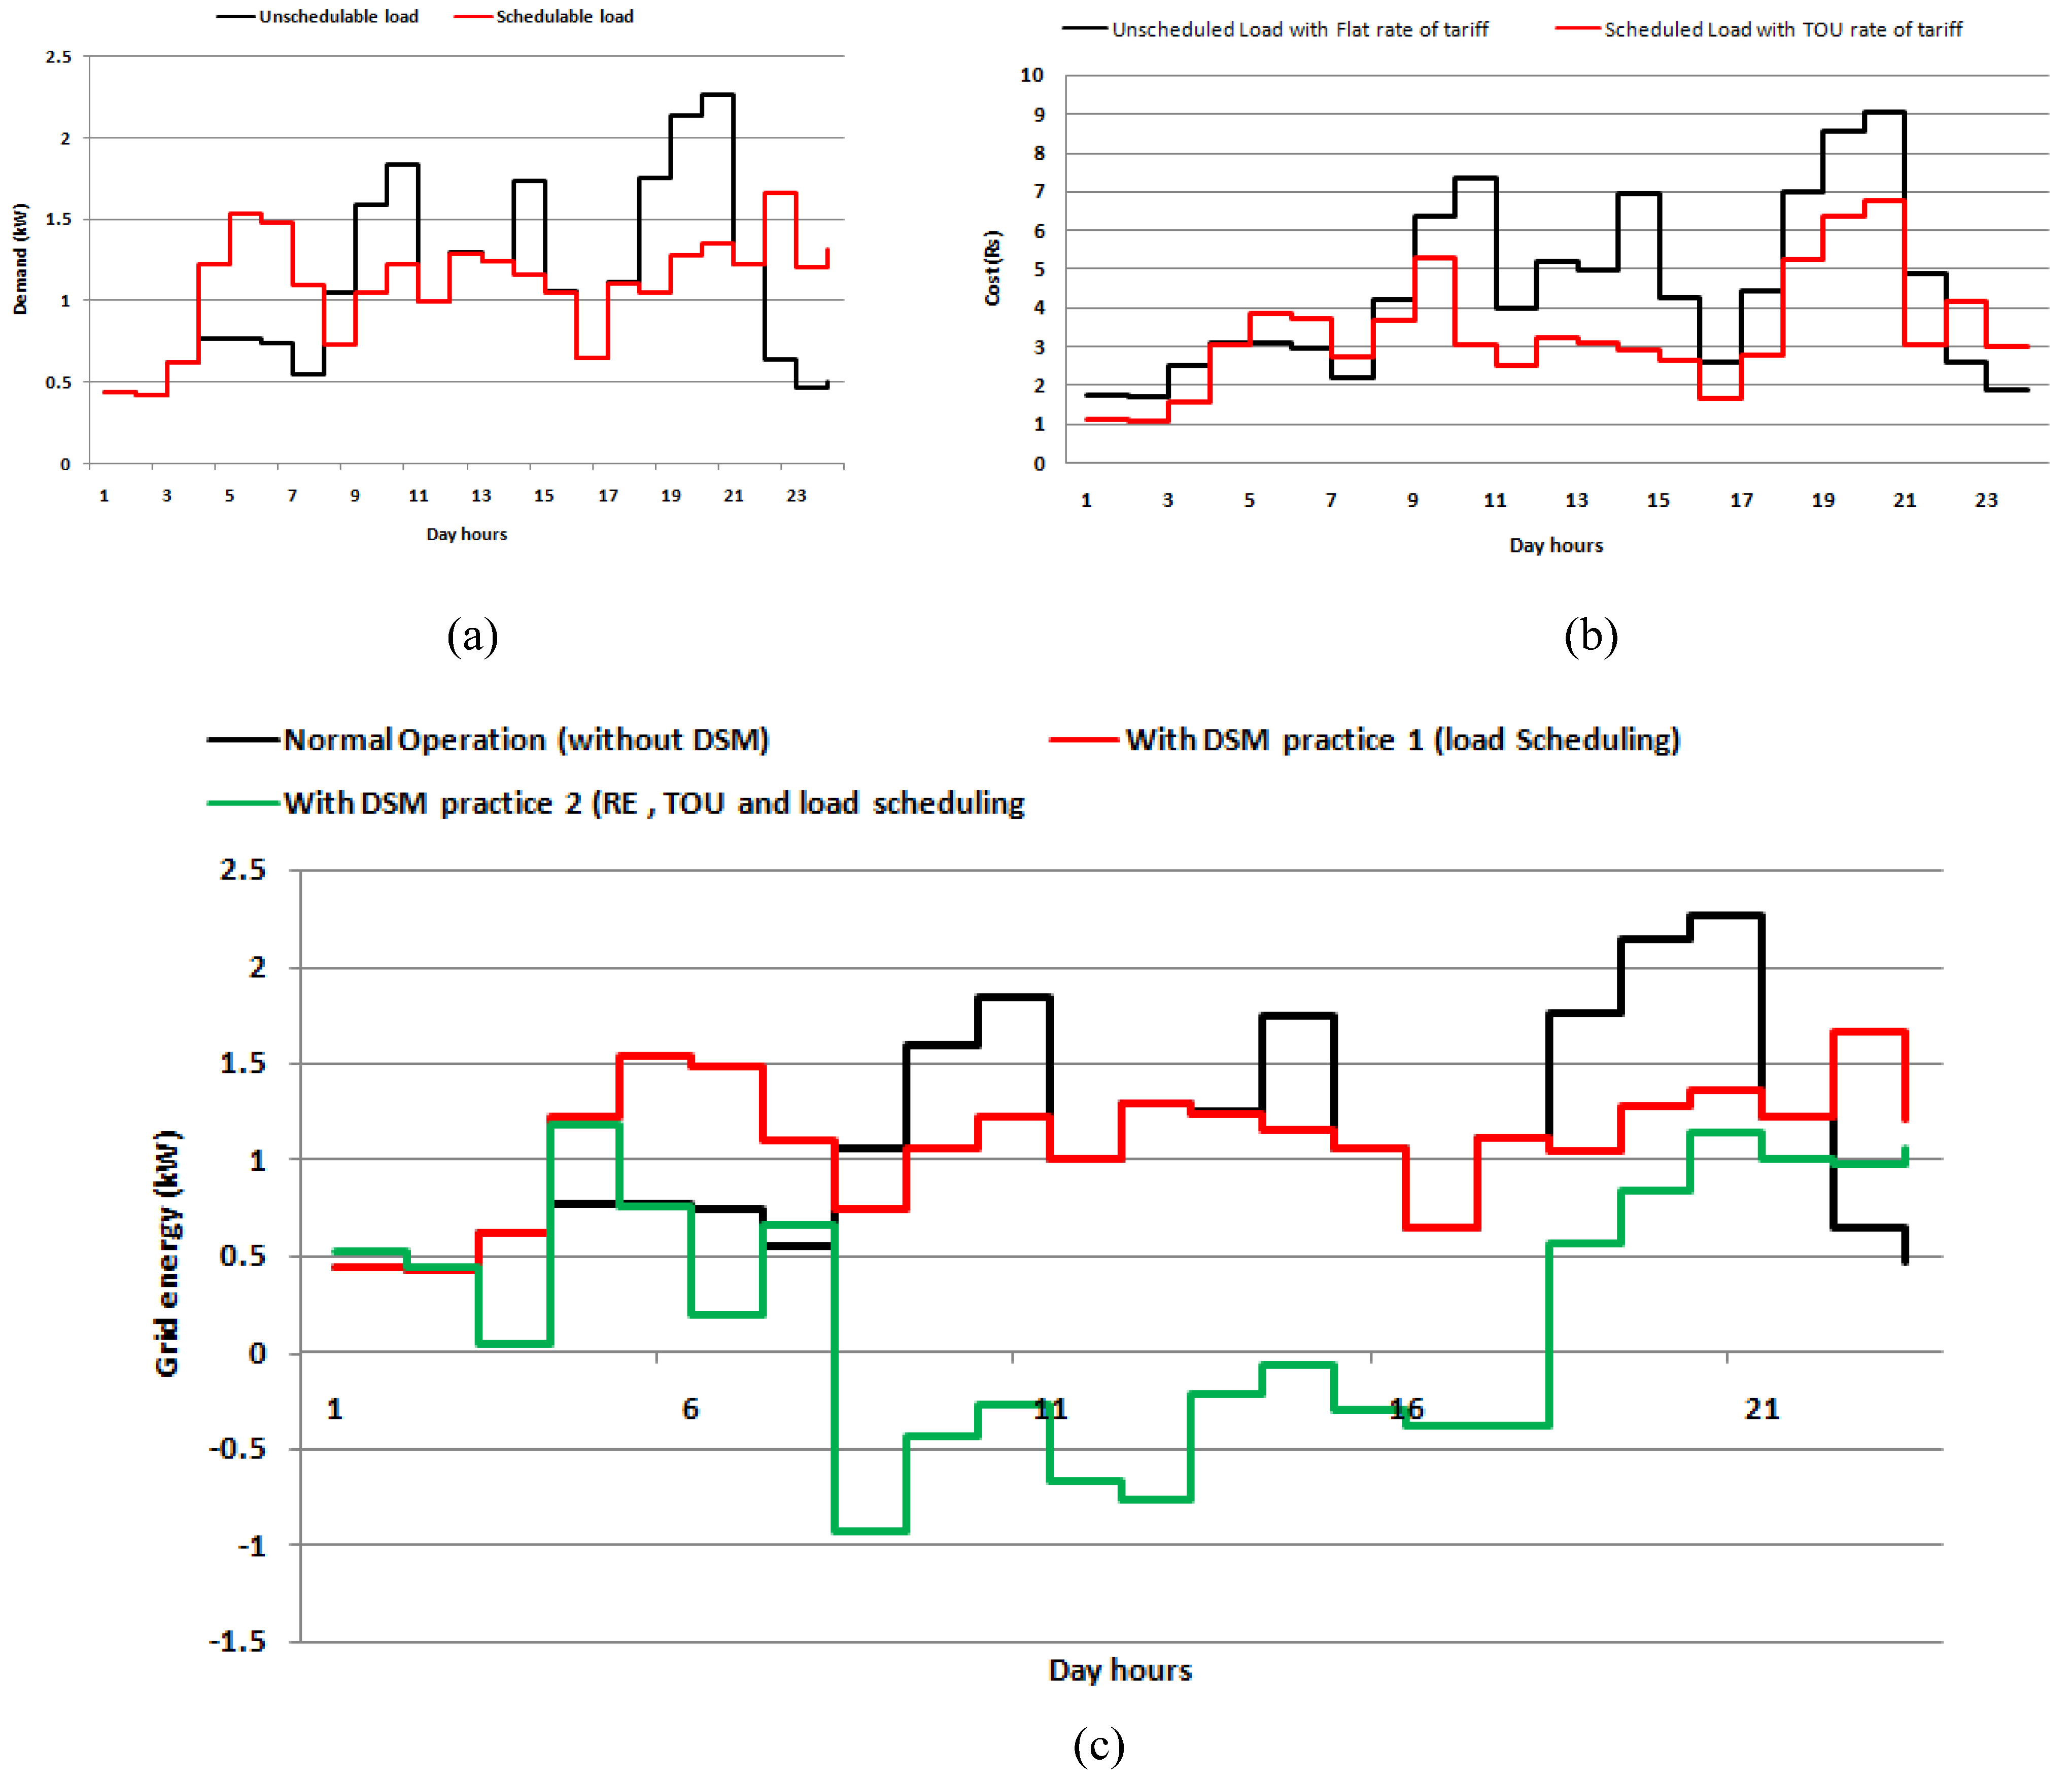
5.3. DSM Practice Impacts on Proposed System

The first two sections of the Results and Discussion sections are focused on elaborating on study findings related to energy supply system optimization and performance enhancement.
This section focuses on the proposed HRE structure’s energy utility. Due to peak load reduction, the load factor of the system is increasing when using the DSM practicing code with the proposed HRE system. Figure 17a depicts the day load profile before and after the load scheduling process is implanted. Figure 17b depicts the relevant impacts on utility tariff rates. Figure 17c depicts the day-to-day changes in grid power requirements following the implementation of the DSM code on a selected HRE system. Table 6 apparently shows the results of the comparisons with and without the DSM code, excluding the best hybrid energy generating system for urban load fulfillment in Indian regions.
Table 5. Optimal performance comparison of hybrid energy systems.
Measuring IndexesUnitsPV/Wind/BatteryAC LoadsPV/Wind/BatteryAC and DC LoadsPV/Wind/Genset/BatteryAC and DC LoadsPV/Wind/Genset/Grid/BatteryAC and DC Loads
Renewablefraction%1001006761
PV system
PV hours of operationhr/yr4371437143714371
PV penetration%73.573.518.418.4
Levelized cost for PV powerIND/kWh7.317.317.317.31
Wind system
Wind hours of operationhr/yr7525752575257525
Wind penetration%2442446161
Levelized costIND/kWh1.851.851.851.85
Genset
Genset fuel consumptionL/yr0022365.54
Generation costIND/kWh0012.512.5
Battery system
Battery autonomyHr17.417.417.417.4
Lifetime throughputkWh62,49062,49062,49062,490
Battery wear costIND/kWh22.2622.2622.2622.26
Converter system
Hours of rectifier operationhr/yr2084268450854542
Hours of inverter operationhr/yr4324382236544218
Grid energy chargeIND/yr00014,652
GHG emission
Carbon dioxide emissionkg/yr0058872374
Nitrogen oxidekg/yr001305.32

6. Conclusions

This paper focuses on an enriched hybrid energy generating design for a residential type of form house in a city. With the help of NDBN-based demand prediction and a DSM-based efficient utility management system, various hybrid energy configurations are built and simulated. The necessary pre- and post-assessments are performed in detail, and a feasibility report is generated using an energy balance approach between energy production and consumption. According to the findings, the chosen area may be electrified using a hybrid system of conventional and renewable energy generators with a battery backup. The site advises a hybrid energy system with a 3 kW PV array, a 9 kW wind turbine, and a 5 kW fossil fuel genset with 30 battery strings to fulfill the form house’s projected load requirement. And it is observed that the proposed configuration has several superior characteristics and techno-economic behaviors compared to other hybrid energy systems. As a future research direction, our study aims to explore the potential of enhancing system efficiency through the implementation of advanced optimization controls, including model predictive control and artificial intelligence algorithms. Additionally, we seek to investigate the benefits of integrating large-scale energy storage systems into the setup.

Author Contributions

Conceptualization, M.K. and P.A.-D.-V.R.; methodology, M.K.; software, M.K. and N.P.S.; validation, P.A.-D.-V.R. and M.S.; formal analysis, M.K.; investigation, M.K.; writing—original draft preparation, M.K. and A.R.; writing—review and editing, M.K. and P.A.-D.-V.R.; visualization, M.K.; supervision, P.A.-D.-V.R. All authors have read and agreed to the published version of the manuscript.

Funding

This research was funded by the All-India Council for Technical Education, New Delhi, India, under Research Promotion Scheme, File No. 8-119/FDC/RPS (POLICY-1)/2019-20, for financial grant toward this research project.

Institutional Review Board Statement

Not applicable.

Informed Consent Statement

Not applicable.

Data Availability Statement

Data are available from the relevant author and will be provided if required and requested.

Acknowledgments

The authors are highly thankful to the All-India Council for Technical Education, New Delhi, India.

Conflicts of Interest

The authors declare no conflict of interest.

References

  1. International Energy Agency. Available online: https://www.iea.org/reports/global-energy-review-2020 (accessed on 1 May 2020).
  2. Ministry of New and Renewable Energy. Available online: https://mnre.gov.in/img/documents/uploads/file_f-1585710569965.pdf (accessed on 25 April 2020).
  3. Camargo, L.R.; Valdes, J.; Macia, Y.M.; Dorner, W. Assessment of on-site steady electricity generation from hybrid renewable energy systems in Chile. Appl. Energy 2019, 250, 1548–1558. [Google Scholar] [CrossRef]
  4. Ceran, B. The concept of use of PV/WT/FC hybrid power generation system for smoothing the energy profile of the consumer. Energy 2019, 167, 853–865. [Google Scholar] [CrossRef]
  5. Gabbar, H.A.; Abdussami, M.R. Feasibility Analysis of Grid-Connected Nuclear-Renewable Micro Hybrid Energy System. In Proceedings of the 2019 IEEE 7th International Conference on Smart Energy Grid Engineering (SEGE), Oshawa, ON, Canada, 12–14 August 2019; pp. 294–298. [Google Scholar]
  6. Kong, W.; Teng, L.; Zhang, S.; Zhang, D.; Liu, X.; Shao, B. A power peak load shifting mixing with solar energy solution for hybrid energy system of the telecommunication base station. In Proceedings of the 2018 IEEE International Telecommunications Energy Conference (INTELEC), Turino, Italy, 7–11 October 2018; pp. 1–3. [Google Scholar]
  7. Singh, R.; Bansal, R.C.; Singh, A.R.; Naidoo, R. Multi-objective optimization of hybrid renewable energy system using reformed electric system cascade analysis for islanding and grid connected modes of operation. IEEE Access 2018, 6, 47332–47354. [Google Scholar] [CrossRef]
  8. Zhao, D.; Ma, J.; Qian, M.; Zhu, L.; Yao, L.; Ding, K.; Han, H. Construction of an example system for AC/DC hybrid power grid with high-proportion renewable energy. J. Eng. 2019, 2019, 1117–1121. [Google Scholar] [CrossRef]
  9. Sami, B.S. Intelligent Energy Management for Off-Grid Renewable Hybrid System Using Multi-Agent Approach. IEEE Access 2020, 8, 8681–8696. [Google Scholar] [CrossRef]
  10. Huang, L.; Chen, Z.; Cui, Q.; Zhang, J.; Wang, H.; Shu, J. Optimal planning of renewable energy source and energy storage in a medium-and low-voltage distributed AC/DC system in China. J. Eng. 2019, 2019, 2354–2361. [Google Scholar] [CrossRef]
  11. Zhou, B.; Xu, D.; Li, C.; Chung, C.Y.; Cao, Y.; Chan, K.W.; Wu, Q. Optimal scheduling of biogas–solar–wind renewable portfolio for multicarrier energy supplies. IEEE Trans. Power Syst. 2018, 33, 6229–6239. [Google Scholar] [CrossRef]
  12. Zhou, B.; Xu, D.; Li, C.; Cao, Y.; Chan, K.W.; Xu, Y.; Cao, M. Multi objective generation portfolio of hybrid energy generating station for mobile emergency power supplies. IEEE Trans. Smart Grid 2017, 9, 5786–5797. [Google Scholar] [CrossRef]
  13. Suresh, V.; Muralidhar, M.; Kiranmayi, R. Modelling and optimization of an off-grid hybrid renewable energy system for electrification in a rural area. Energy Rep. 2020, 6, 594–604. [Google Scholar] [CrossRef]
  14. Cuesta, M.A.; Castillo-Calzadilla, T.; Borges, C.E. A critical analysis on hybrid renewable energy modeling tools: An emerging opportunity to include social indicators to optimize systems in small communities. Renew. Sustain. Energy Rev. 2020, 122, 109691. [Google Scholar] [CrossRef]
  15. Kosai, S.; Cravioto, J. Resilience of standalone hybrid renewable energy systems: The role of storage capacity. Energy 2020, 196, 117133. [Google Scholar] [CrossRef]
  16. Javed, M.S.; Zhong, D.; Ma, T.; Song, A.; Ahmed, S. Hybrid pumped hydro and battery storage for renewable energy-based power supply system. Appl. Energy 2020, 257, 114026. [Google Scholar] [CrossRef]
  17. Venkatesan, K.; Govindarajan, U. Optimal power flow control of hybrid renewable energy system with energy storage: A WOANN strategy. J. Renew. Sustain. Energy 2019, 11, 015501. [Google Scholar] [CrossRef]
  18. Murugaperumal, K.; Raj, P.A.D.V. Energy storage-based MG connected system for optimal management of energy: An ANFMDA technique. Int. J. Hydrogen Energy 2019, 44, 7996–8010. [Google Scholar] [CrossRef]
  19. Mahmoud, F.S.; Ahmed, A.Z.D.; Ziad, M.A.; Abou-Hashema, M.E.-S.; Thamer, A.; Mahrous, A.; Husam, A.R. Optimal sizing of smart hybrid renewable energy system using different optimization algorithms. Energy Rep. 2022, 8, 4935–4956. [Google Scholar] [CrossRef]
  20. Krishnamoorthy, M.; Raj, P.A.D.V. Optimum design and analysis of HRES for rural electrification: A case study of Korkadu district. Soft Comput. 2020, 24, 13051–13068. [Google Scholar] [CrossRef]
  21. Cho, M.Y.; Hwang, J.C.; Chen, C.S. Customer short term load forecasting by using ARIMA transfer function model. In Proceedings of the 1995 International Conference on Energy Management and Power Delivery EMPD’95, Singapore, 21–23 November 1995; Volume 1, pp. 317–322. [Google Scholar]
  22. Ouyang, T.; He, Y.; Li, H.; Sun, Z.; Baek, S. A deep learning framework for short-term power load forecasting. arXiv 2017, arXiv:1711.11519. [Google Scholar]
  23. Niu, D.; Wang, Y.; Wu, D.D. Power load forecasting using support vector machine and ant colony optimization. Expert Syst. Appl. 2010, 37, 2531–2539. [Google Scholar] [CrossRef]
  24. Bakirtzis, A.G.; Petridis, V.; Kiartzis, S.J.; Alexiadis, M.C.; Maissis, A.H. A neural network short term load forecasting model for the Greek power system. IEEE Trans. Power Syst. 1996, 11, 858–863. [Google Scholar] [CrossRef]
  25. Xu, Y.; Dong, Z.Y.; Meng, K.; Zhang, R.; Wong, K.P. Real-time transient stability assessment model using extreme learning machine. IET Gener. Transm. Distrib. 2011, 5, 314–322. [Google Scholar] [CrossRef]
  26. Deepica, S.; Kalavathi, S.; Angelin Blessy, J.; Maria Manuel Vianny, D. Machine Learning Based Approach for Energy Management in the Smart City Revolution. In Hybrid Intelligent Approaches for Smart Energy: Practical Applications; Wiley: Hoboken, NJ, USA, 2022; pp. 161–179. [Google Scholar]
  27. Tiwari, R.; Babu, N.R. Recent developments of control strategies for wind energy conversion systems. Renew. Sustain. Energy Rev. 2016, 66, 268–285. [Google Scholar] [CrossRef]
  28. Pushpabala, V.; Rajan, C.C.A. Optimal design and development of renewable based multi-energy system for village sustainability: A case study simulation. Environ. Prog. Sustain. Energy 2023, 42, e14038. [Google Scholar] [CrossRef]
  29. Kumar, K.; Tiwari, R.; Babu, N.R.; Prabhu, K.R. Analysis of MISO Super Lift Negative Output Luo Converter with MPPT for DC Grid Connected Hybrid PV/Wind System. Energy Procedia 2018, 145, 345–350. [Google Scholar] [CrossRef]
  30. Murugaperumal, K.; Raj, P.A.D.V. Integrated energy management system employing pre-emptive priority-based load scheduling (PEPLS) approach at residential premises. Energy 2019, 186, 115815. [Google Scholar] [CrossRef]
  31. Dudek, G. Multilayer perceptron for short-term load forecasting: From global to local approach. Neural Comput. Appl. 2020, 32, 3695–3707. [Google Scholar] [CrossRef]
  32. Dash, S.K.; Patel, D. Short-term electric load forecasting using Extreme Learning Machine-a case study of Indian power market. In Proceedings of the 2015 IEEE Power, Communication and Information Technology Conference (PCITC), Bhubaneswar, India, 15–17 October 2015; pp. 961–966. [Google Scholar]
  33. Wu, J.; Wang, Y.G.; Tian, Y.C.; Burrage, K.; Cao, T. Support vector regression with asymmetric loss for optimal electric load forecasting. Energy 2021, 223, 119969. [Google Scholar] [CrossRef]
Figure 1. Solution methodology for hybrid energy harvesting system.
Sustainability 15 13773 g001
Figure 2. Model architecture and key expressions of the different load prediction techniques. (a) MLP, (b) ELP, (c) SVM, and (d) NDBN.
Sustainability 15 13773 g002
Figure 3. The design structure of NDB network.
Sustainability 15 13773 g003
Figure 4. HRE system design architecture.
Sustainability 15 13773 g004
Figure 5. Flowchart for DSM practicing code implementation.
Sustainability 15 13773 g005
Figure 6. Monthly load assessment. (a) annual AC load profile, (b) annual DC load profile, and (c) annual deferrable load demand.
Sustainability 15 13773 g006
Figure 7. Typical Day load demand. (a) day AC load demand and (b) day DC load demand.
Sustainability 15 13773 g007
Figure 8. RE resource assessments at selected site locations (a) solar resource (b) wind resource.
Sustainability 15 13773 g008
Figure 9. Possible hybrid energy configurations’ structure for (a) Case 1, (b) Case 2, (c) Case 3, and (d) Case 4.
Sustainability 15 13773 g009
Figure 10. (a) A day-ahead load demand prediction by NDBN and other approaches. (b) A week-ahead load demand prediction by NDBN approach. (c) Historical annual load demand and its prediction values.
Sustainability 15 13773 g010
Figure 11. Energy contribution by the system. (a) Case 1 and Case 2, (b) Case 3, and (c) Case 4.
Sustainability 15 13773 g011
Figure 12. Cost-type NPC comparisons for all possible hybrid energy cases.
Sustainability 15 13773 g012
Figure 13. Typical days’ (1–3 January) energy production and energy consumption behavior for Case 1 system: PV/wind/battery AC loads.
Sustainability 15 13773 g013
Figure 14. Typical days’ (1–3 January) energy production and energy consumption behavior for Case 2 system: PV/wind/battery AC and DC loads.
Sustainability 15 13773 g014
Figure 15. Typical days’ (1–3 January) energy production and energy consumption behavior for Case 3 system: PV/wind/genset/battery AC and DC loads.
Sustainability 15 13773 g015
Figure 16. Typical days’ (1–3 January) energy production and energy consumption behavior for Case 4 system-: PV/wind/genset/grid/battery AC and DC loads.
Sustainability 15 13773 g016
Figure 17. DSM implementation. (a) impacts on load demand, (b) impacts on utility tariff cost, and (c) impacts on grid energy due to DSM practice code implementation.
Sustainability 15 13773 g017
Table 1. Summary of field research gap identification.
State-of-the-Art Ref. No.Objective HandledOutcomes MeasuredLimitation
Sizing OptimizationLoad PredictionPeak Load Management
[5,7]Design of grid-connected HRE system, Multi objective function-based hybrid renewable energy system designSizing optimization
on-grid system
feasibility report creation
--Peak load management and load prediction parts are missing
[6,9]HRE system design for telecommunication applicationOff-grid system
energy commitment analysis
-Peak load management by unit commitmentSizing optimization and load prediction
[8]AC/DC hybrid power grid system designElements sizing identificationAssumed load-required level; different load patents considered-DSM concepts implementation
[10]Distribute generation system design for low- and medium-voltage applicationsSizing optimization with different voltage levels and types of loadsSeasonal load prediction followed-DSM concepts implementation
[11]Wind, solar, and biogas-based HRE system designSizing issues are consideredTime-series-based load assessmentLoad scheduling program implementedPerformance enhancement needed
[12,13]Mobile emergency power supply design with multi-objective functionsSizing optimization, performance enhancement, and cost optimizationFixed-load profile considered-DSM impacts the different load conditions
[14]HRE system design for community load profileSizing issues are handledTime-to-time and day-to-day load variations not consideredUnit-commitment-based load scheduling programTechno–economic–environmental feasibility analysis
Table 2. Comparison analysis of different load prediction techniques.
Multilayer Perceptron (MLP)Extreme Learning Machine (ELM)Support Vector Machine (SVM)Novel Deep Belief Network (NDBN)
Model architectureMLP is a feedforward neural network with multiple hidden layers.ELM is a single-hidden-layer feedforward neural network with randomly initialized hidden layer weights.SVM is a supervised machine learning model, aiming to find an optimal hyperplane to separate data points into classes.NBDN is a type of deep learning model that utilizes a stack of restricted Boltzmann machines to form a generative model, with unsupervised pre-training and fine-tuned learning.
Training approachMLP requires iterative optimization to find the optimal weights and biases. Back-propagation training approach used.One-shot learning by directly computing output weights by random hidden layer weights.Iterative optimization techniques are used to find the optimal weights and biases; quadratic programming is employed for trainingNDBN is a layer-wise unsupervised training strategy for pre-training (Boltzmann machines), followed by supervised fine-tuning for better feature representation.
Complexity and computationMLP is computationally intensive with large datasets and a complex architecture.ELM is computationally efficient due to its random weight initialization.SVM is computationally intensive due to datasets and architecture.Unsupervised pre-training, hierarchical representation learning, and generalization abilities make NDBN into a powerful and promising approach for complex data modeling.
GeneralizationMLP suffers by overfitting when the data is limited.ELM may generalize well for simple tasks but may not handle complex datasets as effectively.SVM tends to suffer from overfitting, requiring careful regularization and hyper-parameter tuning.NDBN has a better ability to capture underlying patterns and generalize new data, making it more suitable for complex tasks.
PerformanceMLP is be used for various applications with high-choice scenarios.Simple and efficient for trouble-free tasks.SVM can demonstrate for robust performance by the simple settingsNDBN demonstrates a robust ability to generalize unseen data by learning knowledge-rich training representations.
Table 3. Day-ahead load prediction indexes.
Prediction ModelMean Absolute Percentage Error (MAPE) in %
(Equation (9))
Root-Mean-Square Error (RMSE)
(Equation (10))
Index Agreement
(Equation (11))
SummerWinterSummerWinterSummerWinter
MLP/Classical NN [31]18.4119.070.4420.4010.8630.812
ELM [32]16.0416.960.3350.320.9150.871
SVR [33]14.715.810.2950.2810.9430.913
NDBN (Proposed)5.996.960.0970.0920.9930.961
Table 4. Optimal sizing comparison of hybrid energy systems.
Measuring IndexesUnitsPV/Wind/BatteryAC LoadsPV/Wind/BatteryAC and DC LoadsPV/Wind/Genset/BatteryAC and DC LoadsPV/Wind/Genset/Grid/BatteryAC and DC Loads
System architecture
NPCIND in millions3.143.093.612.34
COEIND/kWh19.419.1522.314.45
Optimal sizingPV in kW121233
Wind in kW121233
Genset in kW0055
Grid in kW0002
Battery30 string30 string30 string30 string
Converter50505050
Operating costIND/year37,59134,398144,38738,788
Energy production
PV power contributionin %23231614
Wind powerin %77775246
Genset powerin % 0321
Grid salesin % 0039
Energy consumption
By AC loadin %95676757
By DC loadin %0282823
By deferrable loadin %5554
Grid salesin %00016
Excess electricityin kW/year24,28424,32388.90
Unmet loadin kW/year1.84000
Capacity shortagein kW/year7.35000
Table 6. DSM code impacts on proposed system.
ParametersWithout DSM Practice CodeWith DSM Practice Code and Enrichment of Load Components
Daily load demand23.4 kWh19.3 kWh
Peak load demand3.4 kW2.6 kW
Average load0.97 kW0.825 kW
Load factor0.290.31
Annual energy requisite from grid8541 kWh7044 kWh
Annual utility billIND 37,704IND29,038
Disclaimer/Publisher’s Note: The statements, opinions and data contained in all publications are solely those of the individual author(s) and contributor(s) and not of MDPI and/or the editor(s). MDPI and/or the editor(s) disclaim responsibility for any injury to people or property resulting from any ideas, methods, instructions or products referred to in the content.

