Article

Non-Linear Nexus of Technological Innovation and Carbon Total Factor Productivity in China

1
Institute of Economics, Jilin Academy of Social Sciences, Changchun 130033, China
2
College of Agriculture and Life Sciences, Seoul National University, Seoul 08826, Republic of Korea
3
School of Economics, Henan Institute of Technology, Xinxiang 453003, China
4
Economic Review Journal, Jilin Academy of Social Sciences, Changchun 130033, China
5
School of Business, Nanjing University of Information Science and Technology, Nanjing 210044, China
6
School of Economics and Management, University of Science and Technology Beijing, Beijing 100083, China
7
School of Economics and Management, Xinjiang University, Urumqi 830046, China
*
Authors to whom correspondence should be addressed.
Sustainability 2023, 15(18), 13811; https://doi.org/10.3390/su151813811
Submission received: 6 July 2023 / Revised: 15 August 2023 / Accepted: 29 August 2023 / Published: 16 September 2023
(This article belongs to the Section Environmental Sustainability and Applications)

Abstract

:
Scientific and technological innovation is the main driving force of the growth in the 14th Five-Year Plan with the aim of “carbon peaking and neutralization.” This research analyzes the carbon total factor productivity (CTFP) improvement mechanism induced by micro-subject technological innovation and macro-technological progress (TP). This research constructed the Malmquist index based on a relaxed nonparametric DEA model, measured the TP level and CTFP in China, and considered the non-strict externalization of technological progress. The endogenous dynamic threshold model was used to test the nonlinear dynamic effect of TP driving the increase in CTFP. Through the intertemporal distance DEA model, undesired output model, and dynamic threshold regression model, we found that science and technology innovation of the TP drive the function of the carbon total factor productivity; there was a threshold effect (−0.556) on the driving impact of TP caused by technological innovation on CTFP, and the lag period of TP and CTFP had a positive driving role for CTFP. The driving effect on the left side of the threshold value was better than that on the right side. Considering the reality of slowing down the growth of capital and labor factor input in the 14th Five-Year Plan, it is essential to take active policy measures to promote the growth rate of TP by promoting the speed of micro-scientific and technological innovation. It is crucial to promote green TP in micro renewable energy enterprises, which, in turn, drive the growth of CTFP, improve the performance of low-carbon development, and reduce the negative impact of the “two-carbon” target on economic growth while realizing low-carbon transition.

1. Introduction

With the aim of “carbon peaking and neutralization, ” the Chinese government maintains reasonable economic growth and meets the binding target of carbon dioxide reduction to achieve a “carbon turning point” and “carbon neutrality” in the future [1]. Neoclassical growth theory holds that economic growth is driven by capital, labor, resource inputs, and total factor productivity [2,3]. In the last three years, the COVID-19 pandemic has affected China’s economy, causing unemployment and plant shutdowns to decrease capital efficiency, reducing the marginal driving role of capital for economic growth [4]. In addition, with the development of the clean energy industry, workers in the traditional industries of oil, gas, and coal will also perceive the risk and anxiety of turnover and even experience job burnout, which will affect the human capital of the traditional energy industry and will undoubtedly have an impact on industrial economic growth [5]. Moreover, there is also the energy security problem caused by the Russia-Ukraine war, and the issue of Chinese human capital caused by an aging population and declining birth rate is the same as that of Japan and South Korea. Thus, the aging population poses a difficult challenge for economic growth.
According to the “14th Five-Year Plan” industrial green development plan issued by the Ministry of Industry and Information Technology of China, it is proposed that carbon emission intensity should continue to decline, pollutant emission intensity should be significantly reduced, and energy efficiency should be steadily improved. The plan emphasizes other development goals: “adhering to innovation as the first driving force, strengthening scientific and technological innovation and institutional innovation, optimizing the innovation system, and stimulating innovation vitality.” This intends to “Accelerate the green and low-carbon scientific and technological revolution and cultivate and strengthen the new momentum of green industrial development.” The low-carbon development of the 14th Five-Year Plan will rely more on total factor productivity [6]. The experience of developed countries shows that innovation is the driving force in the stage of high-quality economic growth. Moreover, both developing and less developed countries are also aggressively pushing carbon neutrality; these countries have vigorously promoted scientific and technological innovation and green finance, and existing research shows that scientific and technological innovation and the adjustment of the renewable energy structure can promote the growth of a low-carbon economy [7,8].
Due to differences in population, resources, and land factor endowments, traditional and renewable energy consumption in different provinces and stages of economic development are also different. In this research, we consider the lag and endogenous of China’s carbon total factor productivity across provincial regions in China. For example, Cheng et al. argued that the effects of environmental regulations in different areas are quite different, showing a descending spatial heterogeneity in eastern and western regions. The strict regulation policy inhibits technological innovation’s impact in the western and central regions [9]. Using provincial data from 1998 to 2007, Zhang et al. analyzed environmental regulation and green technology innovation in different areas. They proposed that the two presented a U-shaped relationship [10]. Moreover, we consider that the enterprise’ green low-carbon technology innovation may be affected by time lag.
We explore the lag and dynamics by combining the intertemporal distance DEA and undesirable input-output threshold dynamic model to solve this heterogeneity and dynamic problem [1,2,3]. In addition, during the 14th Five-Year Plan period, China needs to take scientific and technological innovation as the core driving force and improve the performance of low-carbon growth [11]. Moreover, improving carbon total factor productivity driven by scientific and technological innovation is the key to realizing the low-carbon transformation of China during the 14th Five-Year Plan period. In front of a background of “carbon peaking and neutralization,” we consider the total factor productivity of carbon reduction as an effective method to evaluate low-carbon growth performance.
The contributions of this research are as follows: This present paper analyzes carbon total factor productivity (CTFP) improvement through micro-subject technological innovation and macro-technological progress (TP). Based on the relaxed nonparametric DEA model, the Mann index is constructed to measure China’s TP level and CTFP. Under the condition that TP is not strictly exogenous, the endogenous dynamic threshold model is used to test the TP-driven CTFP improvement. It is found that there is a threshold effect (−0.556) on the driving impact of TP caused by scientific and technological innovation on CTFP. The lag period of TP and CTFP has a positive driving impact on CTFP. The driving impact on the left side of the threshold weight is better than that on the right side, but the energy intensity target falls on the right side in the 14th Five-Year Plan. Considering the reality that the growth rate of capital and labor factor input is slowing down, it is urgent to take active policy measures to promote the micro scientific and technological innovation speed as the entry point, improve the growth rate of TP, and then drive the growth of CTFP, improve the performance of low-carbon development, reduce the negative impact of carbon peaking and neutralization target on economic growth, and realize the low-carbon transition.
This research is arranged as follows: The second part presents the theoretical background. The third part mainly introduces the research design. The fourth part is the empirical analysis and results. The last part is the main conclusions and policy suggestions.

2. Theoretical Background

2.1. Technological Innovation and Total Factor Productivity

The related literature mainly includes the driving role of scientific and technological innovation for total factor productivity and associated issues of carbon emissions during the 14th Five-Year Plan period. Firstly, regarding the driving impact of scientific and technological innovation on total factor productivity, the research of Wu et al. found that innovation and green innovation significantly promoted the total factor productivity of enterprises [12]. The innovation behavior of enterprises with R&D investment significantly affected the total factor productivity improvement. The higher the education level in the region where the enterprise is located, the more influential the impact of its innovation behavior on improving total factor productivity. The higher the degree of environmental regulation in the region of an enterprise, the higher the enterprise’s green innovation ability will be, and the more obvious its impact on improving total factor productivity. Huang et al. used the entropy weight TOPSIS method to study total factor productivity. They found that scientific and technological innovation improved economic development by enhancing the total factor productivity of manufacturing enterprises [13]. Cao’s research empirically found that scientific and technological innovation played an essential role in promoting the total factor productivity of enterprises, based on the 103 cities evidence [14].
Su and Zhou found that scientific and technological innovation was essential for improving green total factor productivity in the Yangtze River Economic Belt [15]. Jia et al. thought that the middle-income stage of science and technology innovation could contribute to total factor productivity [16]. In addition, two studies have suggested financial industry science and technology innovation; Ba et al. conducted a study using the data from the 2011-2018 study and found that the financial innovation vitality of science and technology and the economic scale of the enterprise technology innovation have a significant role in promoting total factor productivity [17]. Tang et al. used the panel data of 31 provinces and cities. They found that the financial innovation of science and technology alleviates information asymmetry, the derivative of the innovative financial infrastructure, and encourages new forms of financial business. As well as finding that new economic business models help the region’s total factor productivity and under the spatial knowledge spillovers conduction, and the financial innovation of science and technology can effectively improve the total factor productivity [18]. According to the research of Shang et al. scientific and technological innovation can further improve the quality of economic development by promoting scientific and technical progress [19].
The other aspect is the study on carbon emission during the 14th Five-Year Plan period. Ping et al. found that during the 14th Five-Year Plan period, the focus and difficulties of further reducing carbon emission intensity in China lie in the eight high-emission provinces in the north, namely Qinghai, Gansu, Liaoning, Hebei, Shanxi, Xinjiang, Inner Mongolia, and Ningxia, and attention should be paid to the power industry [20]. According to the study by He et al. based on mixed frequency data and the ADL-MIDAS model, it is estimated that by the end of the 14th and 15th Five-Year Plans, the total carbon dioxide emission in China may be close to 11.5 billion tons per year. Compared with the previous period, the 13th Five-Year Plan, the carbon emission structure is stable, in which the proportion of the secondary industry is 82%~85%, with a rebound of 1% compared with the past, and the proportion of the tertiary industry has slightly dropped to less than 14%. Still, the carbon emission of the transportation and logistics industry has increased significantly [21].
In summary, there has been abundant research on the driving impact of scientific and technological innovation on total factor productivity and economic development, and there has also been some research on carbon emissions based on the 14th Five-Year Plan, which provides a valuable reference for the examination of this paper and is the starting point of this research. However, the existing literature has ignored that the driving role of technological progress generated by scientific and technological innovation for carbon total factor productivity is endogenous and has not fully explored the nonlinear and dynamic role.
Compared with the existing academic research, the contribution of this paper has the following three points: Firstly, China has set a “carbon turning point “and“carbon neutral” timetable; in this context, a more accurate measure of scientific and technological innovation driven effect helps to target the formulation and implementation of the “carbon peaking and neutralization” policies and measures, to achieve their goals on time. Secondly, considering the binding target of carbon emission reduction and the driving role of scientific and technological innovation is conducive to a more comprehensive analysis of the realistic situation of low-carbon growth during the 14th Five-Year Plan period. It ensures the smooth completion of the planning objectives. Thirdly, for the first time, the endogenous dynamic panel threshold model is applied to measure the effect of scientific and technological innovation on the driving impact of carbon total factors, which effectively solves the problems of the endogenous, nonlinear, and dynamic effects of scientific and technological innovation on the carbon total productivity.

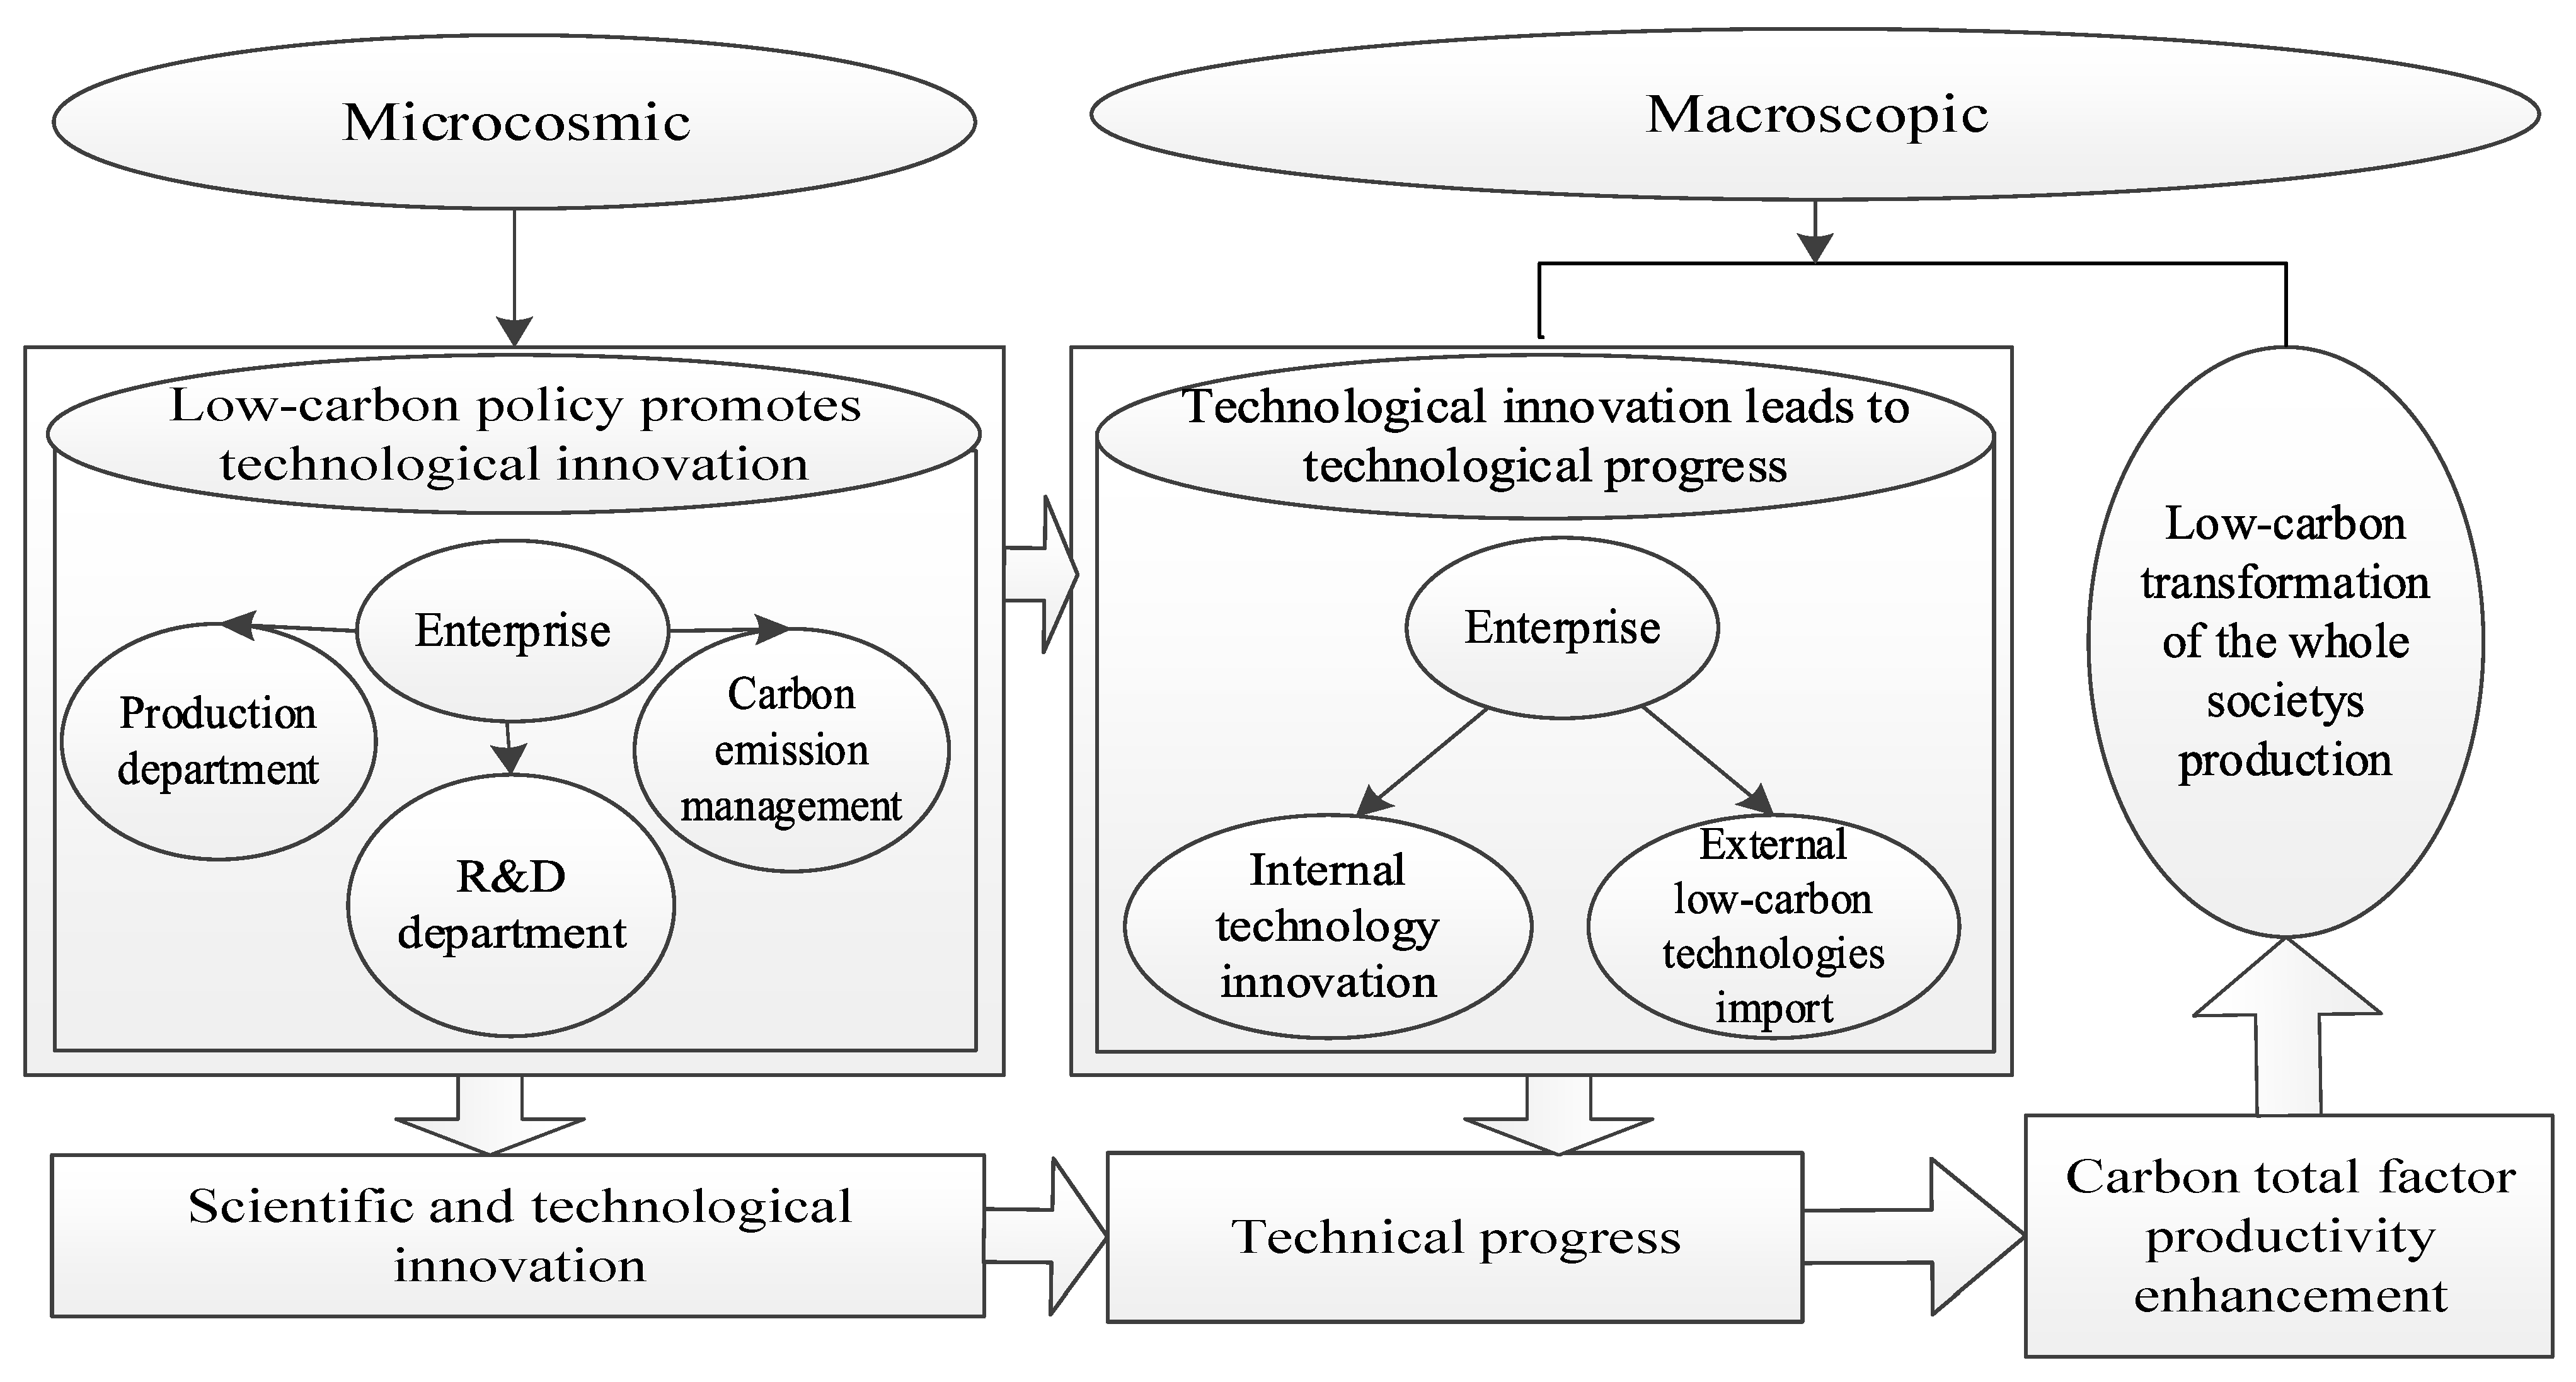
2.2. The Influence Mechanism of Scientific and Technological Innovation on Total Factor Productivity under “Carbon Peaking and Neutralization”

Classical growth theory holds that scientific and technological innovation, an essential economic growth source, triggers macro-technological progress. However, scientific and technological innovation with the aim of “carbon peaking and neutralization” will promote growth and the transformation of the economy to a low-carbon growth mode. Total factor productivity (TFP) is an important index to measure the efficiency of economic growth. Improving carbon TFP driven by scientific and technological innovation is the key to judging the success of the low-carbon economic transformation. Figure 1, below, shows the mechanism of low-carbon TFP improvement with the aim of “carbon peaking and neutralization”. At the micro level, Porter’s hypothesis holds that appropriate environmental regulation can stimulate enterprises’ scientific and technological innovation; after this, Porter hypothesizes that the current “low-carbon environmental regulation” will encourage enterprises to develop carbon reduction technology and provide low-carbon products to improve their competitive advantages. Many enterprises try to take this path to gain a competitive advantage. At the same time, enterprises with insufficient internal R&D capability will also upgrade their low-carbon technology level through external import. With the scarcity of low-carbon technology, low-carbon technologies’ prices will increase. According to the theory of induced technological progress [1,21], the reasonable low-carbon environmental policy will provide innovation incentives for the macro-induced low-carbon growth of technological progress and advancement, drive the improvement of the carbon total factor productivity, and guide the social production of low-carbon transformation [1].

3. Research Design

Based on the above analysis, it can be seen that micro-scientific and technological innovation is manifested as technological progress in macro-production and then drives the improvement of carbon total factor productivity. Therefore, macro-technological progress can be used to characterize the impact of scientific and technological innovation on social production and measure its promotion role for the carbon total factor productivity.
The research design of this paper primarily comprises two steps. Firstly, the slackness-based model with non-parameters, including undesired output, is used to construct the Manquist index (M-index) to measure the total factor carbon productivity and technological progress with the aim of “carbon peaking and neutralization” [22]. According to the literature review analysis, the total factor productivity and low-carbon technology estimated based on the model based on the endogenous dynamic threshold is used to build a regression model and measure the driving role of technological progress for carbon total factor productivity. Generally, the technological progress and advancement of total factor productivity may be nonlinear, but it promotes an impact. Since technological progress is not strictly exogenous, there is the problem of endogeneity, which may lead to the inconsistency of parameter estimation, as well, in the field of environmental economy, such as environmental Kuznets and nonlinear theories.

3.1. M Index Based on the Undesirable Slackness-Based Model

According to Fare et al. and Färe and Grosskopf [23,24,25,26], we broke down the production function; we suppose the production technique has n DUMs, the energy input vector is x e R + m 1 , the non-energy input matrix is x n R + m 2 , and the vector of the desired output is y d R + s 1 . The vector of the non-desirable output results (carbon dioxide emissions) is y n R + s 2 . Then, the production possibility set can be defined as:
P = { ( x e , x n , y d , y u ) x e X λ , x n X λ , y d Y d λ , y u Y u λ , e λ = 1 , λ 0 }
Here ,   X e = [ x 1 e , , x n e ] R + m 1 × n ,   X n = [ x 1 n , , x n n ] R + m 2 × n ,   Y u = [ y 1 u , , y n u ] R + s 2 × n
Based on the production possibility set (1), we can define the undesirable slackness-based efficiency model, s e R m 1 as the efficiency of energy input. s R m 2 is the efficiency of non-energy input, s d R s 1 the efficiency of the desired output, and the efficiency of undesirable outcome.
The following frontier optimization problem can find the production possibility in the low-carbon scenario:
min η = 1 1 m 1 + m 2 ( i = 1 m 1 s i e x i 0 e + i = 1 m 2 s i x i 0 n ) 1 + 1 s 1 + s 2 ( r = 1 s 1 s r d y r 0 d + r = 1 s 2 s r u y r 0 u )
s . t . C 1 : x 0 e = X e λ + s e ; C 2 : x 0 n = X n λ + s ; C 3 : y 0 d = Y d λ s d ; C 4 : y 0 u = Y u λ + s u ; C 5 : e λ = 1 ; C 6 : s e 0 , s 0 , s d 0 , s u 0 , λ 0 .
C1, C2, C3, and C4 represent one DMU ( x 0 e , x 0 n , y 0 d , y 0 u ).
Then, the low-carbon M index based on an undesirable slackness-based model can be expressed as:
L U S M t , t + 1 = η t ( x 0 e , x 0 n , y 0 d , y 0 u , t + 1 ) η t ( x 0 e , x 0 n , y 0 d , y 0 u , t ) × η t + 1 ( x 0 e , x 0 n , y 0 d , y 0 u , t + 1 ) η t + 1 ( x 0 e , x 0 n , y 0 d , y 0 u , t )
η t ( x 0 e , x 0 n , y 0 d , y 0 u , t ) and η t + 1 ( x 0 e , x 0 n , y 0 d , y 0 u , t + 1 ) can be proposed as the efficiency in periods t and t + 1 , respectively, and η t ( x 0 e , x 0 n , y 0 d , y 0 u , t + 1 ) and η t + 1 ( x 0 e , x 0 n , y 0 d , y 0 u , t ) can be represented as their inter-zone distance functions, respectively, and represent the distance function with constant returns to scale. A DEA model can calculate the distance function in different periods. However, the traditional DEA model may have no solution when solving the interpterion distance function, which will affect the decomposition of the efficiency index of the Malmquist.
The above index (3) can be used to break down the low-carbon technology efficiency:
L U S M _ C t , t + 1 = η t + 1 ( x 0 e , x 0 n , y 0 d , y 0 u , t + 1 ) η t ( x 0 e , x 0 n , y 0 d , y 0 u , t )
And low-carbon technology progress:
L U S M _ F t , t + 1 = η t ( x 0 e , x 0 n , y 0 d , y 0 u , t ) η t + 1 ( x 0 e , x 0 n , y 0 d , y 0 u , t ) × η t ( x 0 e , x 0 n , y 0 d , y 0 u , t + 1 ) η t + 1 ( x 0 e , x 0 n , y 0 d , y 0 u , t + 1 )

3.2. Endogenous Dynamic Panel Threshold Model

The existing threshold models Hansen and Caner and generally assume that the explanatory variables are exogenous [27,28]. However, the dynamic panel threshold model proposed by Seo and Shin solves this problem well and can study the lag effect [29]. The formula is as follows:
y i t = 1 , x i t ϕ 1 1 q i t γ + 1 , x i t ϕ 2 1 q i t > γ + ε i t   i = 1 ,   ,   n ; t = 1 ,   ,   T
Here, 1{.} is an indicative function, q i t the threshold variable, γ the threshold critical value, and ϕ 1 and ϕ 2 are the coefficients for different zoning. The error term ε i t consist of two terms:
ε i t = α i + v i t
Here, α i represents individual fixed effects. v i t represents the random error term, and it is a martingale difference sequence:
E v i t F ~ t 1 = 0
When the threshold variable in the model is exogenous, it can be estimated by the two-stage least squares method based on the first difference. Model (8) can be transformed into:
Δ y i t = β Δ x i t + δ X i t 1 i t ( γ ) + Δ ε i t
And Δ is the first-order difference operator,
β k 1 × 1 = ϕ 12 ,   ,   ϕ 1 ,   k 1 + 1 , δ k 1 + 1 × 1 = ϕ 2 ϕ 1 , X i t 2 × 1 + k 1 = 1 ,   x i t 1 ,   x i ,   t 1 ,   1 i t ( γ ) = 1 q i t > γ 1 q i t 1 > γ

4. Empirical Analysis

The empirical part of this paper covers the period from the tenth Five-Year Plan to the thirteenth Five-Year Plan from 2001 to 2018. The National Bureau of Statistics and provincial statistical yearbooks obtained labor force and energy data. Gross regional product is actual gross regional development based on 2000 prices. The capital stock is estimated according to the perpetual inventory method. The CO2 emission data were estimated according to Shan et al. [30].
Due to China’s energy primarily coming from fossil energy, which produces a large amount of emissions in the production process, reducing the amount of fossil fuels used has become one of the keys to reducing carbon emissions. Reducing energy intensity has been written into the binding index of the 14th Five-Year Plan; therefore, this article selects the unit energy output (real GDP and the energy ratio) growth as a threshold variable to build a regression model [28,29,30,31]. Table 1, below, is the descriptive statistics of the data.
This part includes two sections: the analysis of empirical results, the analysis of the 14th Five-Year Plan, and the robustness test.

4.1. Empirical Results and “14th Five-Year Plan” Analysis

The two-stage least squares method based on the first-order difference was used to estimate Equation (9)’s endogenous dynamic threshold, as seen in Model (6). The regression results are shown in Table 2 below. The results show a threshold effect on the driving impact of scientific and technological innovation on total factor carbon productivity, which shows nonlinear characteristics. Among these findings, we found that the lag issue of the carbon TFP coefficient is positive, under two intervals under the threshold weight on the left side of the slightly larger, shows that the threshold is variable in the threshold weight on the right side of the threshold weight on the left side of the situation. The carbon total factor productivity currently has a positive role in promoting the lag issue. It causes an effect under the threshold weight on the left side, which is slightly better in the existing technology. When the growth rate of GDP output per unit of energy is low, the change in carbon TFP with one lag period has a slightly better-promoting role.
When the growth rate of GDP output per unit of energy increases, the promoting role of the one-period lag change for carbon total factor productivity on carbon total factor productivity decreases slightly. The coefficient of technological progress is positive in both intervals and more significant on the left side of the threshold weight, indicating that technological progress promotes the improvement of carbon total factor productivity on both the right and left sides of the threshold weight. However, there is asymmetry, and its promoting impact is better on the left side of the threshold weight; that means that under the existing technological conditions when the GDP output per unit of energy is low, the change in technological progress will play a more significant role in promoting the carbon total factor productivity. When the growth rate of GDP output per unit of energy increased (the growth rate was more significant than −0.556), the promoting impact of technological progress on carbon total factor productivity declined instead.
Because China’s energy structure is dominated by fossil energy, which is the primary source of carbon dioxide, the 14th Five-Year Plan sets a binding target of reducing cumulative energy consumption per unit of GDP by 13.5% over five years. The annual average is −2.7%. Next, we propose energy consumption per unit of GDP as X, and the reduction in annual energy consumption per unit of GDP set in the 14th Five-Year Plan is
x t x t 1 x t × 100 % 2.7 %
Unit energy output is the inverse of energy consumption per unit GDP, as shown by the regression results in Table 2. When ( 1 / x _ t 1 / x _ ( t 1 ) ) / ( 1 / ( x _ t ) ) 0.556 , the lag term of carbon TFP and technological progress has a more significant driving role for TFP. The above formula can be transformed into:
x t x t 1 x t 35.75 %
It can be seen that the regression results show that when the growth rate of energy consumption per unit GDP is not less than 35.75% in that year, social production is in the middle of the left side of the threshold weight, which can better promote the rate of total factor productivity. However, there is no intersection between Formulas (10) and (11); in other words, if we want to meet the binding energy consumption target of Equation (10) during the 14th Five-Year Plan period, China’s social production will not be on the left side of the threshold weight but needs to be on the right side of the threshold weight. The situation that China will face is that the lag term of carbon total factor productivity and the promotion role of technological progress for carbon total factor productivity will be weakened, that is to say, to achieve the 14th Five-Year Plan obligatory targets for low carbon in the future, the reduction of carbon intensity economy will be under the threshold weight on the right side; this means that the same scientific and technological innovation that drove the growth of social production and carbon and total factor productivity will drive these to a lesser extent. At the same time, the current carbon total factor productivity’s effect on the next phase of ascension is more minor. It constitutes the superposition of two kinds of impact if the technology innovation speed is to remain constant. The slowdown in total factor productivity during the 14th Five-Year Plan period, coupled with the predictability of slower growth in capital and labor, calls for proactive responses to prevent the possibility of a slowdown in economic growth.

4.2. Robust Tests

This part conducts the linear (nonlinear) test based on the bootstrapping method, ensuring the rationality and robustness of model selection. In Model (9), the null hypothesis can be set as:
H 0 : δ = 0 , for   random   γ Γ
The alternative hypothesis can be conducted as follows:
H 1 : δ 0 , γ Γ
Then, the natural statistic of the null hypothesis H 0 is
s u p W = s u p γ Γ   W n ( γ )
Wn (γ) is the standard Wald statistic weight for each fixed γ.
After that, we followed the method of Hansen to simulate the asymptotic critical value (p) using the bootstrapping method [32]. The simulation results are shown in Table 3, below. The p-value of the asymptotic statistic is zero, through the simulation analysis of the bootstrapping method run 10,000 times. The regression results in the following table are consistent with those in Table 2, meaning the empirical results are relatively robust.

5. Conclusions and Policy Implications

5.1. Findings and Discussions

In this paper, we analyzed the impact path and its mechanism, broke down efficiency and low-carbon technology progress, and discussed the impact of innovation induced by low-carbon environmental regulation on low-carbon technology progress and total factor productivity through the threshold value of energy intensity. Specifically, we first applied Porter’s hypothesis and the theory of inducible technological progress proposed by Xiong et al. and Liu et al. and Du and Li [33,34,35]. In addition, the mechanism of micro-technological innovation inducing macro-technological progress and driving the improvement of carbon total factor productivity was summarized [36,37]. Also, through the linear (nonlinear) test based on repeating the bootstrapping method 10,000 times, it was found that the role of scientific and technological innovation for the improvement of carbon total factor productivity is nonlinear. There is a threshold effect using nonparametric M, not radial Angle index to measure China’s technological progress and low carbon based on total factor productivity. Using the model based on the endogenous dynamic threshold method to measure the innovation of science and technology of carbon total factor productivity of nonlinear driving action, it was found that the use of both science and technology innovation to promote carbon total factor productivity has increased. However, when the unit of energy output growth is less than 0, with the aim of carbon peaking and neutralization, since the proportion of fossil energy in China’s energy structure is about 80%, during the 14th five-year period, we need to reduce energy intensity, that is, the amount of energy consumed per unit of GDP.
In the future, when the strength of fossil fuels is reduced, the economy will be under the threshold weight on the right side, which means that the same scientific and technological innovation drive for the growth of social production of carbon and total factor productivity is smaller. At the same time, the hysteresis of carbon total factor productivity is more negligible, constituting the superposition of two kinds of effect, without changing the existing technology based on economic and social conditions; thus, during the 14th or 15th Five-Year Plan, carbon total factor productivity growth will likely slow. In addition, investment and labor force growth is unsustainable. It needs positive policies and measures to try to accelerate energy-saving low-carbon science and technology innovation to promote carbon total factor productivity and improve growth performance, which can prevent policy measures from reducing carbon emissions’ impact on economic growth, achieving low-carbon growth.

5.2. Policy Implications

To achieve the above stated carbon targets, we can start from the following aspects:
They are, firstly, accelerating research on the quality of innovation in addressing climate change. Today, carbon emissions have peaked, and economic growth has still been maintained in the country; most developed countries generally realized USD 20,000 more per capita after the carbon peak. China is in the process of economic development and will discover a carbon turning point; coupled with the impact of the outbreak of COVID-19, the situation is more complex than that faced by “carbon peak” countries. There are few precedents to look at and a tight time frame, so researchers need to develop innovative Chinese solutions to climate change in the short term.
Secondly, adjusting the renewable energy structure is needed to encourage micro-renewable energy enterprises, such as wind, hydro, solar, and other multi-energy complementary energy structures, to reduce the proportion of fossil energy in power generation. It is better to promote green R&D and innovation and encourage scientific and technological innovation of renewable enterprises through environmental protection subsidies and climate investment and financing to alleviate climate pressure.
Thirdly, focus on researching, developing, and applying four necessary low-carbon-related technologies is recommended. The first is energy storage technology. China produces a large amount of new energy every year. However, due to the shortage of energy storage technology, there are still many power abandonment problems in northwest China, where new energy is produced. Second, carbon capture, utilization, and storage (CCUS) technology, considered one of the most promising cutting-edge emission reduction technologies, has yet to be extensively applied and commercialized in China. Third, the human capital of green and low-carbon technology should be improved, mainly in electricity, and the emissions of agriculture, transportation, petrochemical, chemical, building materials, steel, nonferrous metals, paper making, and other key industries that are particularly prominent. There is still tremendous potential for improving low-carbon technology’s energy efficiency and human capital. Fourth, pay attention to the construction of carbon sink forests. Traditional coal chemical bases pay attention to ecological protection and afforestation and support the carbon cycle and environmental green development. It is better to increase the amount of credit support for energy-saving, low-carbon, and innovative businesses. For energy-saving and low-carbon innovative entrepreneurship, we can increase the amount of financial credit support, promote their industrialization, and improve the conversion rate and transformation cycle of low-carbon scientific and technological innovation.
Fourthly, it is better to increase the amount of credit support for energy-saving and low-carbon innovative entrepreneurship [38,39]. The amount of financial credit support for energy-saving and low-carbon creative entrepreneurship can be increased, as well as promoting its industrialization and improving the conversion rate and transformation cycle of low-carbon scientific and technological innovation. It is better to accelerate energy technology development and the innovation of science and technology in the field of digital and intelligent quality data as a new type of element in the information era, improve the innovative use of digital components, improve the quality of digital innovation, promote the ecological wisdom urban construction, and improve the allocation efficiency of social production, improving carbon total factor productivity.
Fifthly, China has a large population, and has considerable manufacturing power. However, since the beginning of this century, China has achieved the INDC target of 2020 stipulated in the Paris Agreement in the following carbon peaking and neutralization. With this objective, the comparative advantages of energy factors in various regions should be compared. The Chinese government should develop traditional and new forms of energy according to local conditions and create a new energy industry while improving carbon efficiency to ensure China’s energy security and green and low-carbon economic development.
Sixthly, attention must be paid to low-carbon policy matching. China should publish related incremental policies and also pay attention to the different regional heterogeneous types of industrial manufacturing of low-carbon environmental policy matching, ensuring the safety of China’s energy efficiency at the same time, to lend a diverse policy mix to the manufacturing enterprise green patent and carbon efficiency incentives, to promote low-carbon economic growth.
Seventhly, for developing countries where traditional energy fuels industrial economic development, the government should promote environmental protection subsidies, climate investment, and green financing policies to support enterprises’ green R&D and low-carbon transformation. This can be achieved by subsidizing low-carbon technology innovation such as renewable energy enterprise, and regulating and investing in the green and low-carbon innovation of enterprises in energy-intensive industries [40]. While ensuring traditional energy security, we should develop renewable energy and fully use the synergistic effect of energy complementarity and heterogeneous environmental regulations to stimulate green and low-carbon development. We can balance ecological and environmental economic development through the circular economy and advanced industrial parks.

Author Contributions

All authors contributed substantially to the conception and design of the work and have drafted and substantively revised it. Specifically, J.X., T.Z., G.J., L.L. and H.S. performed material preparation, data collection, analysis, reviewing, and editing. All authors have read and agreed to the published version of the manuscript.

Funding

This work is supported by the Chey Institute for Advanced Studies’ International Scholar Exchange Fellowship for the academic year of 2020–2021, 2023 Jilin Province Overseas Returnees Science and Technology Innovation and Entrepreneurship selected funding project ’Research on the Nonlinear Driving Role of Scientific and Technological Innovation for Low Carbon Total Factor Productivity (17)’, National Natural Science Foundation of China (71804063), Innovation Center for Digital Business and Capital Development of Beijing Technology and Business University (SZSK202308) and (SZSK202233), National Statistical Science Research Project (2021LY055), and Natural Science Foundation of Jiangsu Province, China (BK20220462).

Institutional Review Board Statement

Not applicable.

Informed Consent Statement

Not applicable.

Data Availability Statement

Not applicable.

Acknowledgments

Thanks to anonymous reviewers’ suggestions, we appreciate the financial support from the project funding and the corresponding author’s Sun support.

Conflicts of Interest

The authors declare no conflict of interest.

References

  1. Bai, C.; Du, K.; Yu, Y.; Feng, C. Understanding the trend of total factor carbon productivity in the world: Insights from convergence analysis. Energy Econ. 2019, 81, 698–708. [Google Scholar] [CrossRef]
  2. Li, W.; Wang, W.; Wang, Y.; Ali, M. Historical growth in total factor carbon productivity of the Chinese industry–a comprehensive analysis. J. Clean. Prod. 2018, 170, 471–485. [Google Scholar] [CrossRef]
  3. Cheng, Z.; Li, L.; Liu, J.; Zhang, H. Total-factor carbon emission efficiency of China’s provincial industrial sector and its dynamic evolution. Renew. Sustain. Energy Rev. 2018, 94, 330–339. [Google Scholar] [CrossRef]
  4. Wang, Y. Exploring resource endowment and human capital impact on regional energy efficiency in China in the context of COP26. Resour. Policy 2023, 81, 103422. [Google Scholar] [CrossRef]
  5. Liu, M.; Tan, R.; Zhang, B. The costs of “blue sky”: Environmental regulation, technology upgrading, and labor demand in China. J. Dev. Econ. 2021, 150, 102610. [Google Scholar] [CrossRef]
  6. Gao, Y.; Zhang, M.; Zheng, J. Accounting and determinants analysis of China’s provincial total factor productivity considering carbon emissions. China Econ. Rev. 2021, 65, 101576. [Google Scholar] [CrossRef]
  7. Chien, F.; Ajaz, T.; Andlib, Z.; Chau, K.Y.; Ahmad, P.; Sharif, A. The role of technology innovation, renewable energy and globalization in reducing environmental degradation in Pakistan: A step towards sustainable environment. Renew. Energy 2021, 177, 308–317. [Google Scholar] [CrossRef]
  8. Sun, Y.; Chang, H.; Vasbieva, D.G.; Andlib, Z. Economic performance, investment in energy resources, foreign trade, and natural resources volatility nexus: Evidence from China’s provincial data. Resour. Policy 2022, 78, 102913. [Google Scholar] [CrossRef]
  9. Cheng, Y.; Ren, J.; Chen, Y.; Xu, C. Dynamic evolution of spatial pattern of environmental regulation efficiency in China and its driving mechanism. Geogr. Res. 2016, 35, 123–136. [Google Scholar]
  10. Zhang, C.; Lu, Y.; Guo, L.; Yu, T.S. The intensity of environmental regulation and technological progress of production. Econ. Res. 2011, 2, 113–124. [Google Scholar]
  11. Wang, M.; Pang, S.; Hmani, I.; Hmani, I.; Li, C.; He, Z. Towards sustainable development: How does technological innovation drive the increase in green total factor productivity? Sustain. Dev. 2021, 29, 217–227. [Google Scholar] [CrossRef]
  12. Wu, L.; Chen, W.; Lin, L.; Feng, Q. Research on the impact of innovation and green technology innovation on enterprise total factor productivity. Math. Stat. Manag. 2021, 2, 319–334. [Google Scholar]
  13. Huang, Z.; Han, P.; Huang, Z. Technological innovation, enterprise total factor productivity and regional economic development: A case study of Guangdong province. Reg. Financ. Res. 2021, 4, 74–81. [Google Scholar]
  14. Cao, S.; Feng, F. Research on the relationship between market competition, two-stage innovation and enterprise total factor productivity; University of Science and Technology of China: Hefei, China, 2020. [Google Scholar]
  15. Su, K.; Zhou, C. Human capital, scientific and technological innovation and green total factor productivity: An analysis of urban data in the Yangtze River Economic Belt. Economic Issues 2021, 71–79. [Google Scholar]
  16. Jia, K.; Liu, W.; Zhang, J. Innovation leading high-quality development of cities: Discussion on the principles, ideas and essentials of innovation. Contemp. Econ. Sci. 2021, 43, 83–93. [Google Scholar]
  17. Ba, S.; Bai, H.; Hu, W. Fintech innovation, total factor productivity and economic growth: From the perspective of new structural economics. Res. Financ. Econ. Issues 2020, 46–53. [Google Scholar] [CrossRef]
  18. Tang, S.; Lai, X.; Huang, R. How does fintech innovation affect total factor productivity: Facilitating or inhibiting? Theoretical analysis framework and regional practice. China Soft Sci. 2019, 134–144. [Google Scholar] [CrossRef]
  19. Shang, G.; Ge, B. Scientific and technological innovation, environmental regulation and high-quality economic development: Empirical evidence from 278 prefecture-level and above cities in China. China Popul. Resour. Environ. 2020, 30, 95–104. [Google Scholar]
  20. Ping, X.; Zheng, M.; Cao, H. Change trend of China’s carbon emission intensity and optimization of carbon emission reduction policies during the 14th Five-Year Plan Period. Reform 2020, 11, 37–52. [Google Scholar]
  21. He, Y.; Wen, H.; Sun, C. Prediction of total carbon emission and its structure in China during the 14th Five-Year Plan Period: Based on ADL-MIDAS model with mixed frequency data. Econ. Issues 2021, 4, 31–40. [Google Scholar]
  22. Tone, K. Dealing with undesirable outputs in DEA: A slacks-based measure (SBM) approach. Nippon. Opereshonzu Risachi Gakkai Shunki Kenkyu Happyokai Abus. 2004, 2004, 44–45. [Google Scholar]
  23. Färe, R.; Grosskopf, S.; Lovell, C.K.; Pasurka, C. Multilateral productivity comparisons when some outputs are undesirable: A nonparametric approach. Rev. Econ. Stat. 1989, 71, 90–98. [Google Scholar]
  24. Färe, R.; Grosskopf, S.; Pasurka, C.A., Jr. Pollution abatement activities and traditional productivity. Ecol. Econ. 2007, 62, 673–682. [Google Scholar] [CrossRef]
  25. Färe, R.; Grosskopf, S.; Whittaker, G. Network DEA. In Modeling data irregularities and structural complexities in data envelopment analysis; Springer: Berlin/Heidelberg, Germany, 2007; pp. 209–240. [Google Scholar]
  26. Färe, R.; Grosskopf, S. Directional distance functions and slacks-based measures of efficiency. Eur. J. Oper. Res. 2010, 200, 320–322. [Google Scholar] [CrossRef]
  27. Hansen, B.E. Threshold effects in non-dynamic panels: Estimation, testing, and inference. J. Econom. 1999, 93, 345–368. [Google Scholar] [CrossRef]
  28. Caner, M.; Hansen, B.E. Instrumental variable estimation of a threshold model. Econom. Theory 2004, 20, 813–843. [Google Scholar] [CrossRef]
  29. Seo, M.H.; Shin, Y. Dynamic panels with threshold effect and endogeneity. J. Econom. 2016, 195, 169–186. [Google Scholar] [CrossRef]
  30. Shan, Y.; Huang, Q.; Guan, D.; Hubacek, K. China CO2 emission accounts 2016–2017. Sci. Data 2020, 7, 54. [Google Scholar] [CrossRef] [PubMed]
  31. Huang, W.; Fan, Y.; Feng, B.; Wang, M. Impact of environmental regulation on green technology innovation efficiency of pharmaceutical manufacturing industry in Yangtze River Economic Belt—Analysis based on panel threshold regression model. J. Hubei Norm. Univ. 2022. [Google Scholar] [CrossRef]
  32. Hansen, B.E. Inference when a nuisance parameter is not identified under the null hypothesis. Econom. J. Econom. Soc. 1996, 64, 413–430. [Google Scholar] [CrossRef]
  33. Xiong, A.; Ding, Y.; Hu, Y. Effects of green innovation subsidies on total factor productivity under low carbon threshold. Resour. Sci. 2020, 42, 2184–2195. [Google Scholar]
  34. Liu, B.; Ding, C.J.; Hu, J.; Su, Y.; Qin, C. Carbon trading and regional carbon productivity. J. Clean. Prod. 2023, 420, 138395. [Google Scholar] [CrossRef]
  35. Du, K.; Li, J. Towards a green world: How do green technology innovations affect total-factor carbon productivity. Energy Policy 2019, 131, 240–250. [Google Scholar] [CrossRef]
  36. Hao, X.; Li, Y.; Ren, S.; Wu, H.; Hao, Y. The role of digitalization on green economic growth: Does industrial structure optimization and green innovation matter? J. Environ. Manag. 2023, 325, 116504. [Google Scholar] [CrossRef] [PubMed]
  37. Luo, S.; Yimamu, N.; Li, Y.; Wu, H.; Irfan, M.; Hao, Y. Digitalization and sustainable development: How could digital economy development improve green innovation in China? Bus. Strategy Environ. 2023, 32, 1847–1871. [Google Scholar] [CrossRef]
  38. Tariq, G.; Sun, H.; Ali, I.; Pasha, A.A.; Khan, M.S.; Rahman, M.M.; Mohamed, A.; Shah, Q. Influence of green technology, green energy consumption, energy efficiency, trade, economic development and FDI on climate change in South Asia. Sci. Rep. 2022, 12, 16376. [Google Scholar] [CrossRef]
  39. Sun, H.; Pofoura, A.K.; Mensah, I.A.; Li, L.; Mohsin, M. The role of environmental entrepreneurship for sustainable development: Evidence from 35 countries in Sub-Saharan Africa. Sci. Total Environ. 2020, 741, 140132. [Google Scholar] [CrossRef]
  40. Edziah, B.K.; Sun, H.; Adom, P.K.; Wang, F.; Agyemang, A.O. The role of exogenous technological factors and renewable energy in carbon dioxide emission reduction in Sub-Saharan Africa. Renew. Energy 2022, 196, 1418–1428. [Google Scholar] [CrossRef]
Figure 1. Improvement mechanism of carbon total factor productivity.
Sustainability 15 13811 g001
Table 1. Descriptive statistics of the data.
SamplingMinimumMaximumMeanStandard Deviation
Labor (ten thousand)570275.5006767.0002488.6541690.398
Capital (100 million yuan)570211.800192,708.40030,437.66636,245.903
Energy (ten thousand tons of standard coal)570479.95039,501.00011,287.7137963.594
Regional GDP (million yuan)570263.68066,257.88010,405.37310,590.008
Carbon dioxide (megaton equivalent)5700.8101609.710266.509241.019
Table 2. Regression results.
Carbon Total Factor ProductivityCoefficientStandard Errorp > |z|
Lag term of carbon total factor productivity (left of threshold weight)0.4450.0290.000
Technological progress (left of threshold)1.1920.0350.000
Constant term (difference between the right and left side of threshold weight)−0.0260.0030.000
Lag term of carbon total factor productivity
(difference between right and left of threshold weight)
−0.4430.0310.000
Technical progress (difference between the right and left side of the threshold)−0.1920.0370.000
The growth rate of energy output per unit (threshold variable)−0.5560.0090.000
Table 3. Robust regression results based on repeating the bootstrapping method 10000 times.
Carbon Total Factor ProductivityCoefficientStandard Errorp > |z|
Lag term of carbon total factor productivity (left of threshold weight)0.4450.0290.000
Technological progress (left of threshold)1.1920.0350.000
Constant term (difference between right and left side of threshold weight)−0.0260.0030.000
Lag term of carbon total factor productivity (difference between right and left of threshold weight)−0.4430.0310.000
Technical progress (difference between the right and left side of the threshold)−0.1920.0370.000
The growth rate of energy output per unit (threshold variable)
Critical Value of bootstrap nonlinear test (p)
−0.5560.0090.000
0.000
Disclaimer/Publisher’s Note: The statements, opinions and data contained in all publications are solely those of the individual author(s) and contributor(s) and not of MDPI and/or the editor(s). MDPI and/or the editor(s) disclaim responsibility for any injury to people or property resulting from any ideas, methods, instructions or products referred to in the content.

