Article

Market Structure Analysis of Revenue of International Construction Professional Service (I-CPS): A Country-Level Analysis

Post-Construction Evaluation and Management Center, Department of Construction Policy Research, Korea Institute of Civil Engineering and Building Technology, Goyang-si 10223, Republic of Korea
Sustainability 2023, 15(18), 13836; https://doi.org/10.3390/su151813836
Submission received: 12 July 2023 / Revised: 31 August 2023 / Accepted: 15 September 2023 / Published: 17 September 2023

Abstract

:
International construction professional service (I-CPS) refers to a knowledge-intensive professional service (KIPS), such as architecture, engineering, and consultancy, which uses technology/human capital as its major input and is better positioned to create new market opportunities and profitability. While the I-CPS market has recently stagnated owing to political, economic, and social uncertainties, the continuous growth and survival of I-CPS firms are becoming an issue, and a country’s competitiveness in supporting these firms is becoming increasingly important. The market structure of an industry results from the competition between countries or firms, which helps identify future market opportunities and establish a timely competitive strategy. The objective of this study is to quantitatively analyze the I-CPS market structure based on top international design firms (TIDFs). This study analyzes the revenue structures of TIDFs by nationality to identify country-specific factors in the I-CPS industry. The Engineering News-Record’s (ENR) Top 225/200 International Design Firms List for the past decade (2011–2021) was used to analyze international revenue in the major 15 countries. This study analyzed the I-CPS industry’s concentration for static analysis, and for dynamic analysis, the rank distribution of TIDFs, their mobility, and instability by firm nationality were analyzed sequentially. The results confirmed that market forces shifted from Europe and USA to Canada and China and that the market position was unstable in many countries. Additionally, this study divides the 15 countries into four static and dynamic combinations: high-static and high-dynamic, high-static and low-dynamic, low-static and high-dynamic, and low-static and low-dynamic. The findings of this study help understand country-level competition in the I-CPS market from a macro perspective, and provide directions for follow-up studies related to the I-CPS market structure.

1. Introduction

The global construction market is categorized into construction professional services (CPS) and contracting services. A CPS refers to a knowledge-intensive professional service (KIPS), such as architecture, engineering, and consultancy, which uses technology/human capital as its major input, whereas a contracting service refers to general construction works, procurement, and non-design services [1]. Although CPS and contracting services are classified as different activities under the industry classification by the World Trade Organization [2] and the United Nations [3], it is easy to see a multidisciplinary business or complementary approach in recent years in which CPS firms provide contracting services or contracting firms provide CPS.
Although the business base of CPS firms is primarily in the domestic market, international market entry is essential for CPS firms not only to mitigate the impact of the cyclic nature of their domestic market, but also to stabilize firms’ financial performances by increasing their global activities [4]. As one of the representative non-manufacturing industries, the construction industry is very sensitive to macro-level uncertainties due to its project-based and on-site production characteristics [5]. To overcome these industrial characteristics and limitations, major countries have supported contracting and CPS firms’ international businesses through the following specialized organizations: the European International Contractors, the International Contractors Association of Korea, the China International Contractors Association, the Turkish Contractors Association, and the Overseas Construction Association of Japan. Regardless of the size of the domestic market, the export of the construction industry is an important issue at the national level.
In international markets, especially those with more uncertainty than domestic markets, a CPS is crucial for creating new markets and driving high value addition [1,6]. First, the international CPS (I-CPS) has a knock-on effect on related business areas, including construction and materials/equipment export. While international contracting businesses are exposed to many different constraints, including land use; construction regulations and technical requirements; construction permits and inspection; registration of proprietors, contractors, and professionals; regulation of fees and remuneration; and environmental regulations [7], CPS is a software industry that is relatively free from such constraints. Furthermore, as project delivery systems become more diverse with construction management at-risk, lump sum turnkey, and integrated project delivery and clients’ needs are becoming more complex, the role of CPS firms as economic agents becomes increasingly important from the initial stage of a project. The integrated approach of CPS and contracting services is increasingly being used as a business strategy by international construction firms, as this approach helps solidify bonds with clients and ensures a continuous track record. Many firms such as Worley (Australia), Wood (UK), Fluor (USA), Power Construction Corp. of China (China), China Energy Engineering Corp. (China), and Larsen and Toubro (India) are included in both the Top 225 International Design Firms List [8] and the Top 250 International Contractors List [9]. Engineering News-Record (ENR) independently categorizes CPS firms and contracting firms in international markets into top international design firms (TIDFs) and top international contractors (TICs) and publishes the revenue of top-tier firms; TIDFs tend to deliver more profits than TICs [1,6]. According to ENR data as of 2021 [8,9], while 17 of 170 TICs reported losses (international loss rate: 10.0%), 5 of 153 TIDFs reported losses (international loss rate: 3.3%). As described above, the I-CPS is a software industry that delivers high added value relative to input resources and has the following characteristics, as mentioned by Jewell et al. [10,11]: host-country/location-specific, often client-led, highly customized bespoke output, extrinsic demand, project-based, heterogeneous, and knowledge-intensive.
According to the ENR, the international revenue of TIDFs has been on the rise until the early 2010s but has since stagnated at approximately USD 70 billion because of market uncertainties, including financial turmoil in Europe and USA [12], low oil prices [13], geopolitical tensions and economic nationalism [14], the COVID-19 pandemic [15], and the Ukraine war [8] (Figure 1). More specifically, the international revenue of TIDFs was USD 17.8 billion in 2001, USD 65.3 billion in 2011, and USD 67.7 billion in 2021, with the compound annual growth rate greatly decreasing from 13.9% in 2001–2011 to 0.4% in 2011–2021 [8,12,16]. Owing to these low-growth conditions and uncertainties in I-CPS markets, the continuous growth and survival of TIDFs have become important issues in recent years, and their success depends on their strategic choices (e.g., strategic alliances, diversification, and mergers and acquisitions) and capabilities. As the author stated earlier, the long-term presences of TIDFs are meaningful for maintaining construction competitiveness both at the firm- and country-levels in terms of creating new I-CPS market opportunities and knock-on effects on related business areas (construction services and materials/equipment export).
Emerging firms, firms delivering steady performance, and declining firms change over time based on the overall results of firms’ economic activities [23,24]. Market structure is determined by the dynamics between clients and suppliers (I-CPS firms) or competition between suppliers and represents a given industry’s competitiveness [25]. In this context, identifying the I-CPS industry’s market structure helps to identify future market opportunities and establish competitive strategy in a timely manner. Country-level competition has become increasingly important in recent years as newly industrialized countries (NICs), including China, have increased their market share through strong government support and low-cost strategies [24,26].
This study analyzes the underlying market structure of I-CPS revenue by firm nationality based on ENR’s TIDF data. Using industry-level information, the primary goal is to answer, “How is the competitive environment structured?” and the following hypothesis is established accordingly: the I-CPS revenue structure by country varies significantly across country-specific circumstances (e.g., market players, national environment, and government support). By analyzing the revenue structure of TIDFs by nationality, this study examines the country-specific factors that affect firms’ continuous growth and survival in the I-CPS market. To do so, this study considered how the revenue structure of firms changed by nationality and discussed its originality through a literature review. This study uses the static and dynamic indices introduced by Jiang et al. [23] and Lee and Kim [24] to compare revenue structures in 15 countries. ENR’s Top 225/200 International Design Firms List for the past decade (2011–2021) was used for analysis.

2. Research Background

2.1. I-CPS Competitiveness and Revenue Performance

Considering that I-CPS firms are smaller and find it more difficult than international contractors to achieve a track record across markets, a country’s competitiveness is important in the I-CPS industry. The Netherlands Engineering Consultants (NEDECO) operated from 1951 to 2001 and set best practices as a country-level I-CPS firm consortium. NEDECO covered water, ports and transport, environment, infrastructure, and corporate and institutional development, and provided I-CPS across policy preparation, research, feasibility studies, design and engineering, and project management in 135 countries [27]. This country-level consortium effectively incubated I-CPS firms based on their universally recognized status in international markets [28]. I-CPS firms, such as Fugro NV (ENR’s TIDFs rank in 2021: 14th of 225 firms) and Royal HaskoningDHV (ENR’s TIDFs rank in 2021: 37th of 225 firms), were part of NEDECO [27,28]. There are also public or private-led consortiums by sector, and examples of the water industry are as follows: German Water Partnership, Korea Water Partnership, Singapore’s Environment and Water Industry Programme, Canada’s (Ontario’s) Water Technology Acceleration Project, Israel’s NewTech, and the US’s (Milwaukee’s) The Water Council [29]. As previously described, a country’s competitiveness in the I-CPS industry is crucial for mitigating risk and ensuring a track record when I-CPS firms advance to international markets. Considering its importance, in-depth academic research has been conducted on the CPS industry in different countries, such as UK [10,30,31], Ireland [32], China [6], and Malaysia [33], and covers various topics, including a firm’s evolutionary path [34], quality issues [30,35], human resource issues [36,37], sustainability issues [38], and market structure [23]. In the most recent studies, Raphael et al. [39] evaluated service quality gaps of Nigerian CPS firms to improve their global competitiveness. Murphy and Seriki [40] provided empirical evidence of the impact of environmental volatility on the strategic decision-making process in Irish CPS firms. Adesi et al. [41] investigated complex factors that hinder effective pricing of CPSs in Ghana to suggest strategies for mitigating their negative impacts. In addition, according to ENR [42] published in August 2023, the I-CPS market is facing climate change, and resilient design demands grow to provide solutions to unexpected temperatures and water/energy shortages. In this situation, I-CPS firms are accelerating digital transformation (e.g., advanced building information modeling, artificial intelligence integration, etc.). For the market structure, revenue performance has been adopted as a key competitiveness factor of countries and firms in the construction industry [24,26,43,44,45]. Revenue performance due to business activities is an effective measure for capturing a country’s or firm’s static position or dynamic changes in a certain market [23,24]. It is difficult to consider all variables that affect the market structure. Previous studies have used market concentration [46,47,48] as a static index and market mobility and instability [23,24,49] as dynamic indices. Market concentration is an index that quantifies revenue or assets captured by a certain group of firms in a particular market and is considered a measure of market power or market entry barriers, as it shows the outcome of competition between firms [46,47,48]. Meanwhile, because market concentration is a static market share measure at a particular time and has limitations in capturing dynamic market changes, few studies have used market mobility and instability concepts as alternatives to explain the dynamics of the competitive environment [23,24,49]. Competitive powers in a market are categorized as emerging firms (new entrants), declining firm (exiting firms), and firms delivering steady performance (continuing firms). Market mobility describes the shift in market share from exiting firms to new entrants, whereas market instability describes the situation of continuing firms defending their market positions [23,24,49]. Some of the most notable studies are based on a complementary combination of the aforementioned static and dynamic indices in the construction sector. Jiang et al. [23] analyzed the market structure of I-CPSs by sector (e.g., transportation, buildings, petroleum, power, and water), contributing to a better understanding of the I-CPS market at the industry level. More recently, Lee et al. [24] analyzed country-specific factors in the international construction industry in 12 major countries (e.g., China, Spain, USA, France, and Germany) and quantitatively explained how country-level competitiveness was maintained. As a follow-up to Lee et al. [24], this study sheds new light on the I-CPS industry from the perspective of a country’s competitiveness and differentiates itself from other studies, as it examines country-specific factors contributing to continuous growth and survival in 15 major countries.

2.2. Recent Revenue Structure of TIDFs

The I-CPS market is sensitive to macro factors such as political, social, and economic factors [23], and the share of their revenue changes dynamically according to region (Figure 2) and firm nationality (Figure 3). The mean share by geographic region in the past decade (2011–2021) includes North America (25.8%), Europe (24.5%), Asia/Australia (23.0%), the Middle East (14.6%), Latin America/Caribbean (6.2%), Africa (5.8%), and others (0.1%). In recent years, the combined share of Europe, North America, and Asia has accounted for more than 80% of the overall market, whereas while the shares of other regions have tended to stagnate or decline.
On the other hand, the mean shares by firm nationality in the past decade included Europe (35.1%), USA (29.1%), Canada (12.5%), Australia (8.5%), China (5.2%), Republic of Korea (1.4%), and Japan (1.3%). Specifically, in Europe, UK (9.9%), The Netherlands (9.1%), Spain (3.4%), France (3.1%), Denmark (2.7%), Italy (1.4%), and Germany (1.0%) account for high market shares. Although firms in the US have seen a huge decline in their share in recent years, European and American firms account for 64.2% of international revenue. Firms in Canada and China have shown the fastest growth over the last decade, from 10.9% in 2011 to 24.8% in 2021. Considering the dynamic changes in the I-CPS market, this study focuses on 15 countries contributing to I-CPS revenue over the past decade (2011–2021): USA (29.0%), Canada (12.5%), UK (9.9%), The Netherlands (9.1%), Australia (8.5%), China (5.1%), Spain (3.4%), France (3.1%), Denmark (2.7%), Sweden (2.3%), United Arab Emirates (1.8%), Egypt (1.7%), Republic of Korea (1.4%), Italy (1.4%), and Japan (1.3%). These countries accounted for 93.2% of the overall international design revenue.

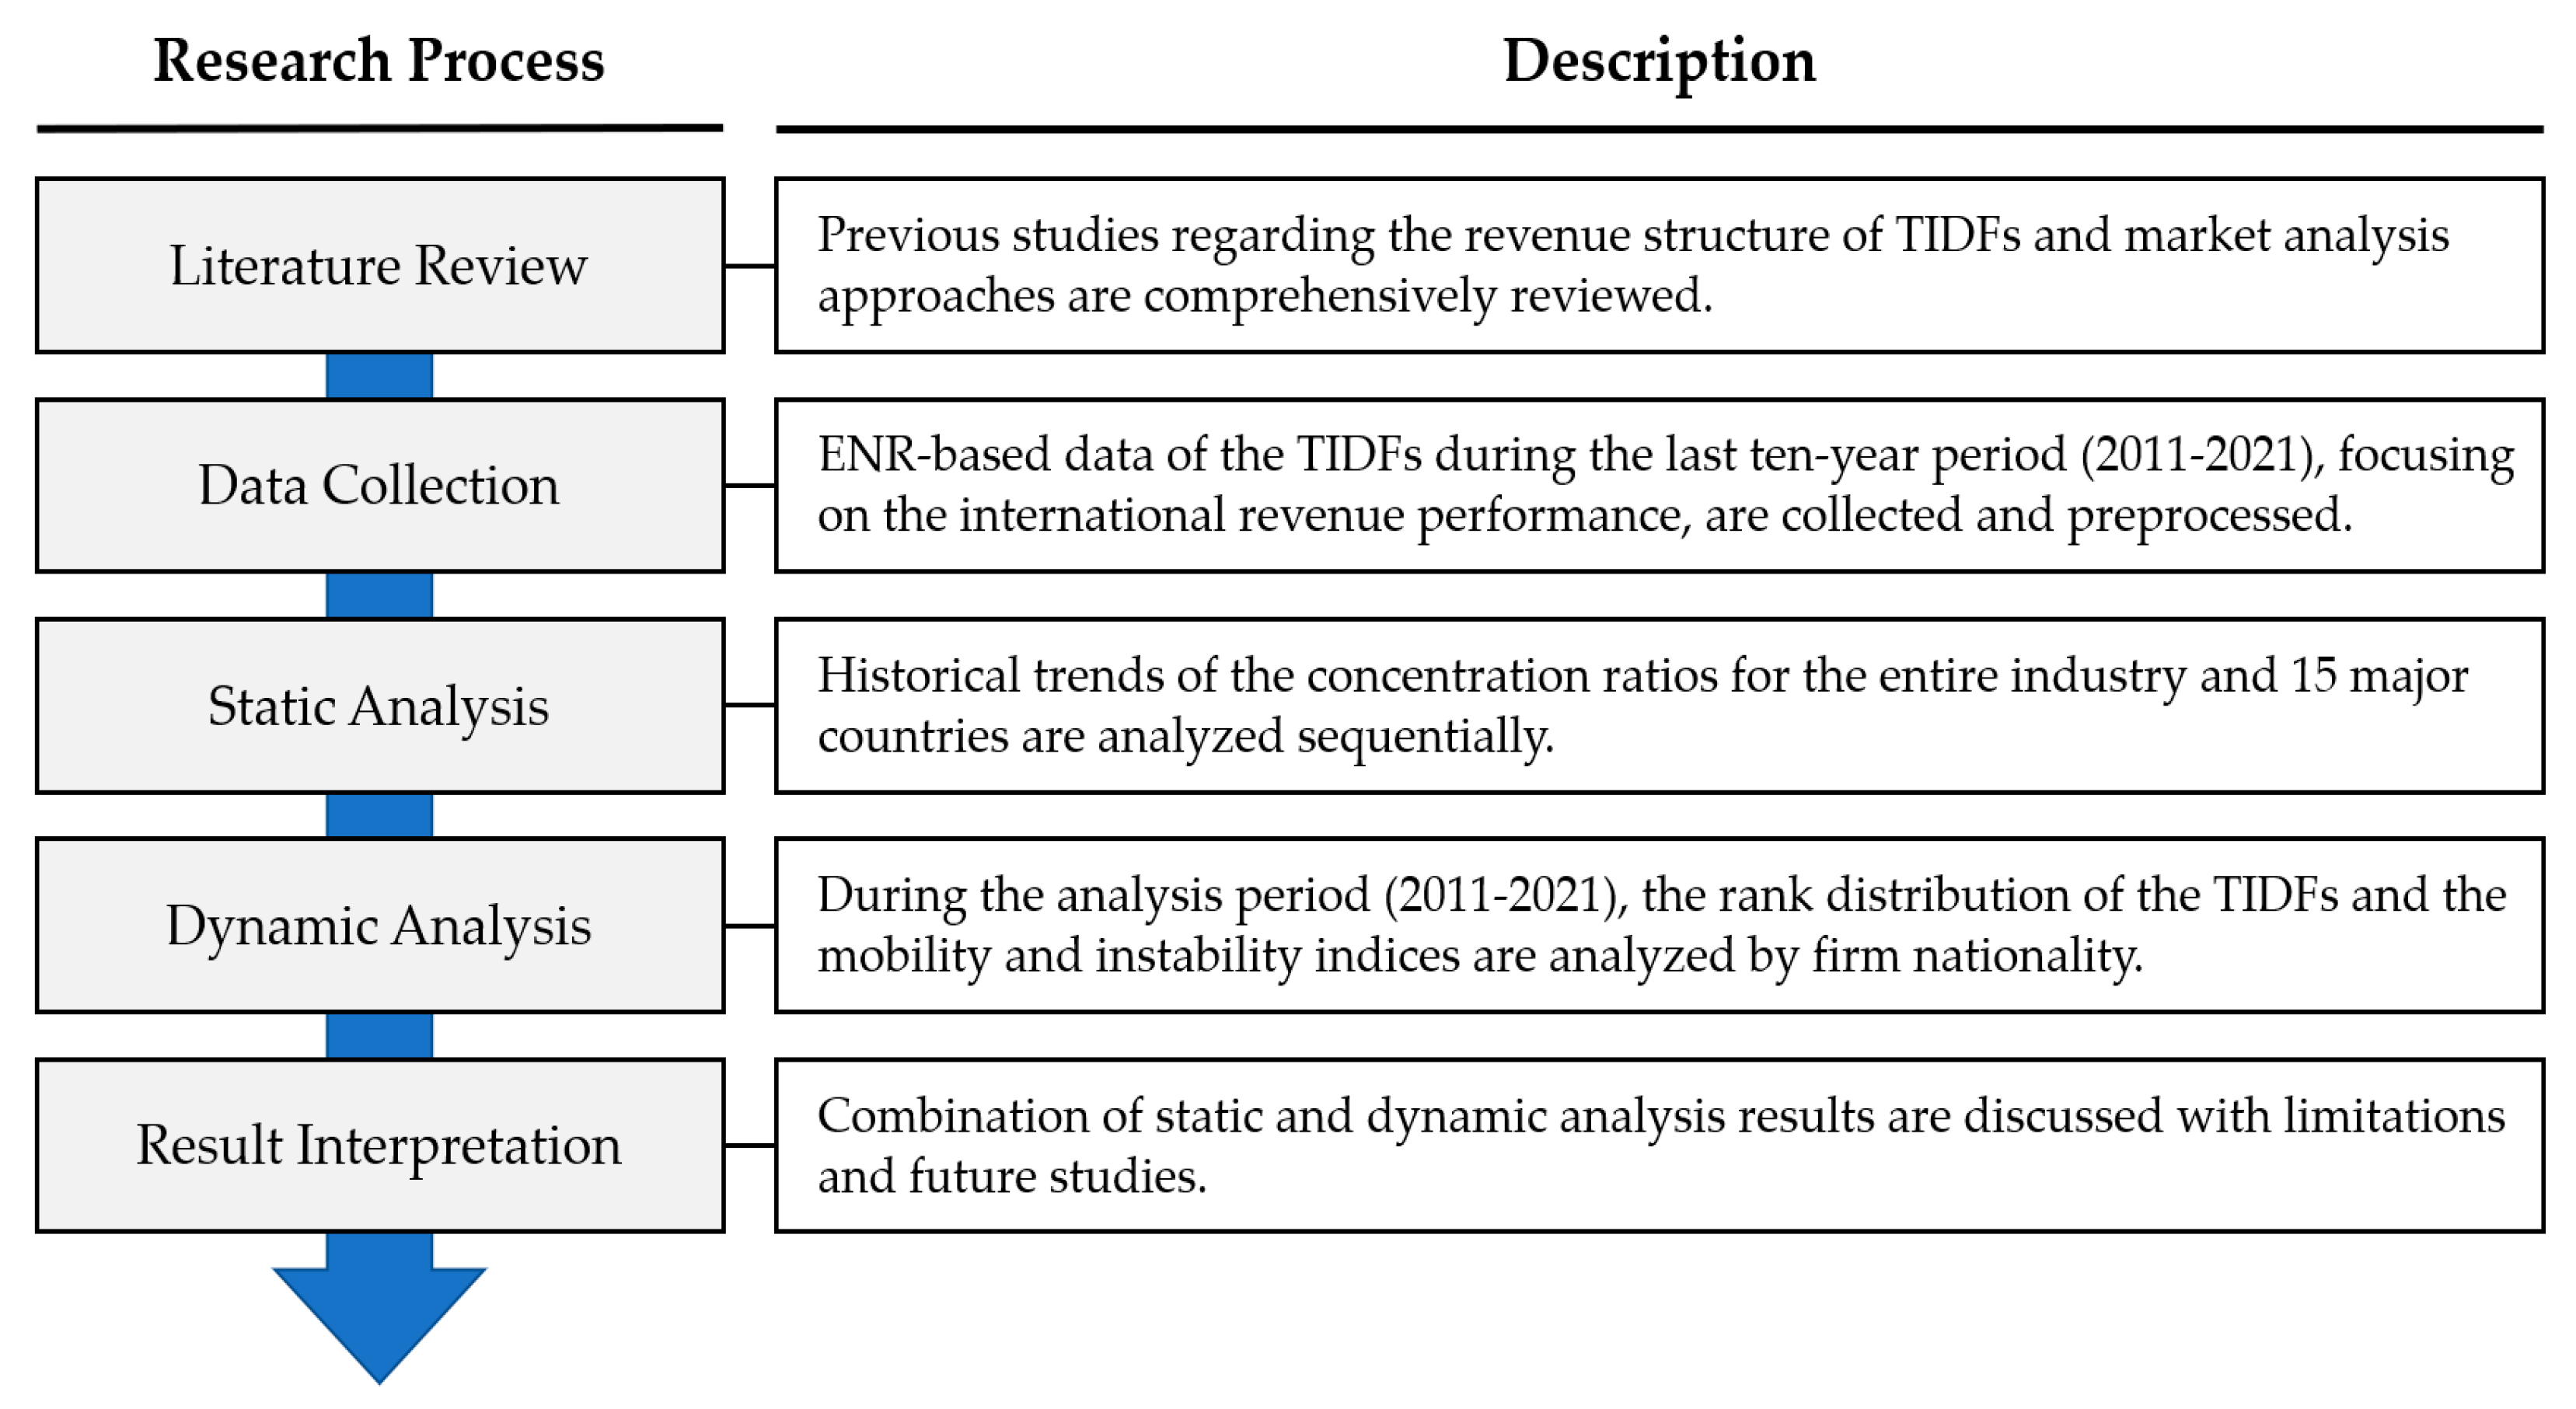
3. Research Methodology

3.1. Research Process

The purpose of this study is to quantitatively analyze the I-CPS market structure based on TIDFs. This section describes the research methodology for collecting and preprocessing data and measuring the static and dynamic indices. First, the study uses preprocessed data from ENR’s TIDFs list for the last decade (2011–2021) to analyze market shares. Second, this study analyzes the industry’s concentration (level of market entry barriers) and 15 major countries for static analysis. Third, for dynamic analysis, this study analyzes the rank distribution of TIDFs, their mobility (market share shifting from exiting firms to entrants), and instability (phenomenon of changing market share in continuing firms) by firm nationality. Finally, this study interprets the results of the static and dynamic analyses and discusses directions for further research. Figure 4 illustrates the overall research process.

3.2. Market Concentration

The concentration ratio ( C R n ), Herfindahl index, entropy, and Gini coefficient are used to measure market concentration.  C R n  measures aggregate market shares of top n firms, where n is usually 4 [49]. Herfindahl index measures aggregate market shares of all firms by weighting their market revenues [50]. Entropy measures the degree of disorder, uncertainty, or randomness to reflect market competition intensity [51]. Gini coefficient measures the extent to which firms in a specific industry are unequal in firm size distribution [52]. While there are differences in the calculations of these indices, they commonly use the following two variables for analysis: the number of top firms and the share of firms [23,46]. This study measures the concentration ratio of the top four firms ( C R 4 ), as in Lee and Kim [24], using the following equation:
C R 4 = i = 1 4 S i
where  C R 4  is the share of the top four firms, and  S i  is the share of firm i.
The concentration ratio ranges between 0 (completely dispersed) and 1 (completely concentrated) and represents the market power of a particular group of firms. Previous studies categorize the ratios into highly concentrated markets (1.000–0.750), moderately concentrated markets (0.749–0.500), slightly concentrated markets (0.499–0.250), and atomistic markets (0.249–0.000) [23,24,49], and higher  C R 4  means a monopolistic market and lower means an intensely competitive market.

3.3. Market Mobility and Instability

This study uses Baldwin and Gorecki’s [49] TURN model to measure market mobility. The TURN model mathematically measures overall market changes based on the changing shares of entrants, continuing firms, and exiting firms for the period from 0 to t [0, t]. The share of entrants begins at 0% at time zero, the share of exiting firms ends at 0% at time t, and the share of continuing firms is positive. The TURN model explains market mobility using the concepts of TURNE and TURNC. TURNE represents the market force of entrants and exiting firms, whereas TURNC represents the market force of continuing firms. TURN is the sum of TURNE and TURNC and ranges from 0 to 1, where 0 indicates low market mobility [23,49].
T U R N = T U R N E + T U R N C
T U R N E = 0.5 ( E N + E X )
T U R N C = 0.5 ( C N G N + C N L S )
where EN is the sum of the shares of entrants at time t, EX is the sum of the shares of exiting firms at time 0, CNGN is the sum of the increased shares of continuing firms from time 0 to time t, CNLS is the sum of the absolute decreased shares of continuing firms from time 0 to time t, TURNE is the changing shares of entrants and exiting firms, TURNC is the changing shares of continuing firms, and TURN is the changing shares in the overall market.
In addition, market instability is measured based on the changing shares of continuing firms using CORSH and REGSH statistics [23,24,49]. CORSH is the correlation coefficient between the shares of firms at times 0 and t, and as a CORSH value approaches 1, it indicates that the market structure has remained stable. REGSH is the ordinary least squares regression coefficient between the shares of firms at times 0 and t, and as a REGSH value approaches 1, it indicates that market changes have been stable. A REGSH value greater than 1 indicates higher growth for firms with larger market shares, while REGSH equal to 1 indicates no change in the shares of firms [23,24,49].
C O R S H = i = 1 n m i , 0 μ 0 ( m i , t μ t ) i = 1 n ( m i , 0 μ 0 ) 2 i = 1 n ( m i , t μ t ) 2
R E G S H = i = 1 n m i , 0 μ 0 ( m i , t μ t ) i = 1 n ( m i , 0 μ 0 ) 2
where n = the number of continuing firms for the period from 0 to t;  μ 0  = the mean market share of continuing firms at time 0;  μ t  = the mean market share of continuing firms at time t;  m i , 0  = the market share of firm i at time 0; and  m i , t  = the market share of firm i at time t.

3.4. Data Collection and Treatment

This study analyzes ENR’s TIDFs list from the past decade (2011–2021). Among the diverse performance indicators for TIDFs (e.g., total revenue, international revenue, and revenue portfolio by sector), this study focused on international revenue performance and collected and analyzed data from the ENR’s Top List reports published from 2012 to 2022. Based on these data, the author assume that entrants are firms included in the 2022 report but not in the 2012 report. By contrast, exiting firms are included in the 2012 report but not in the 2022 report. Continuing firms were continuously included in the report throughout the analysis period.
This study conducted the following data preprocessing: First, this study converted the annual revenue of TIDFs into annual market shares to calculate concentration, mobility, and instability indices. Next, considering that the names of TIDFs may change for some reason (e.g., business diversification and M&A), the author cross-checked their correct names based on information such as TIDFs’ annual ENR rankings or websites.

4. Analysis Results

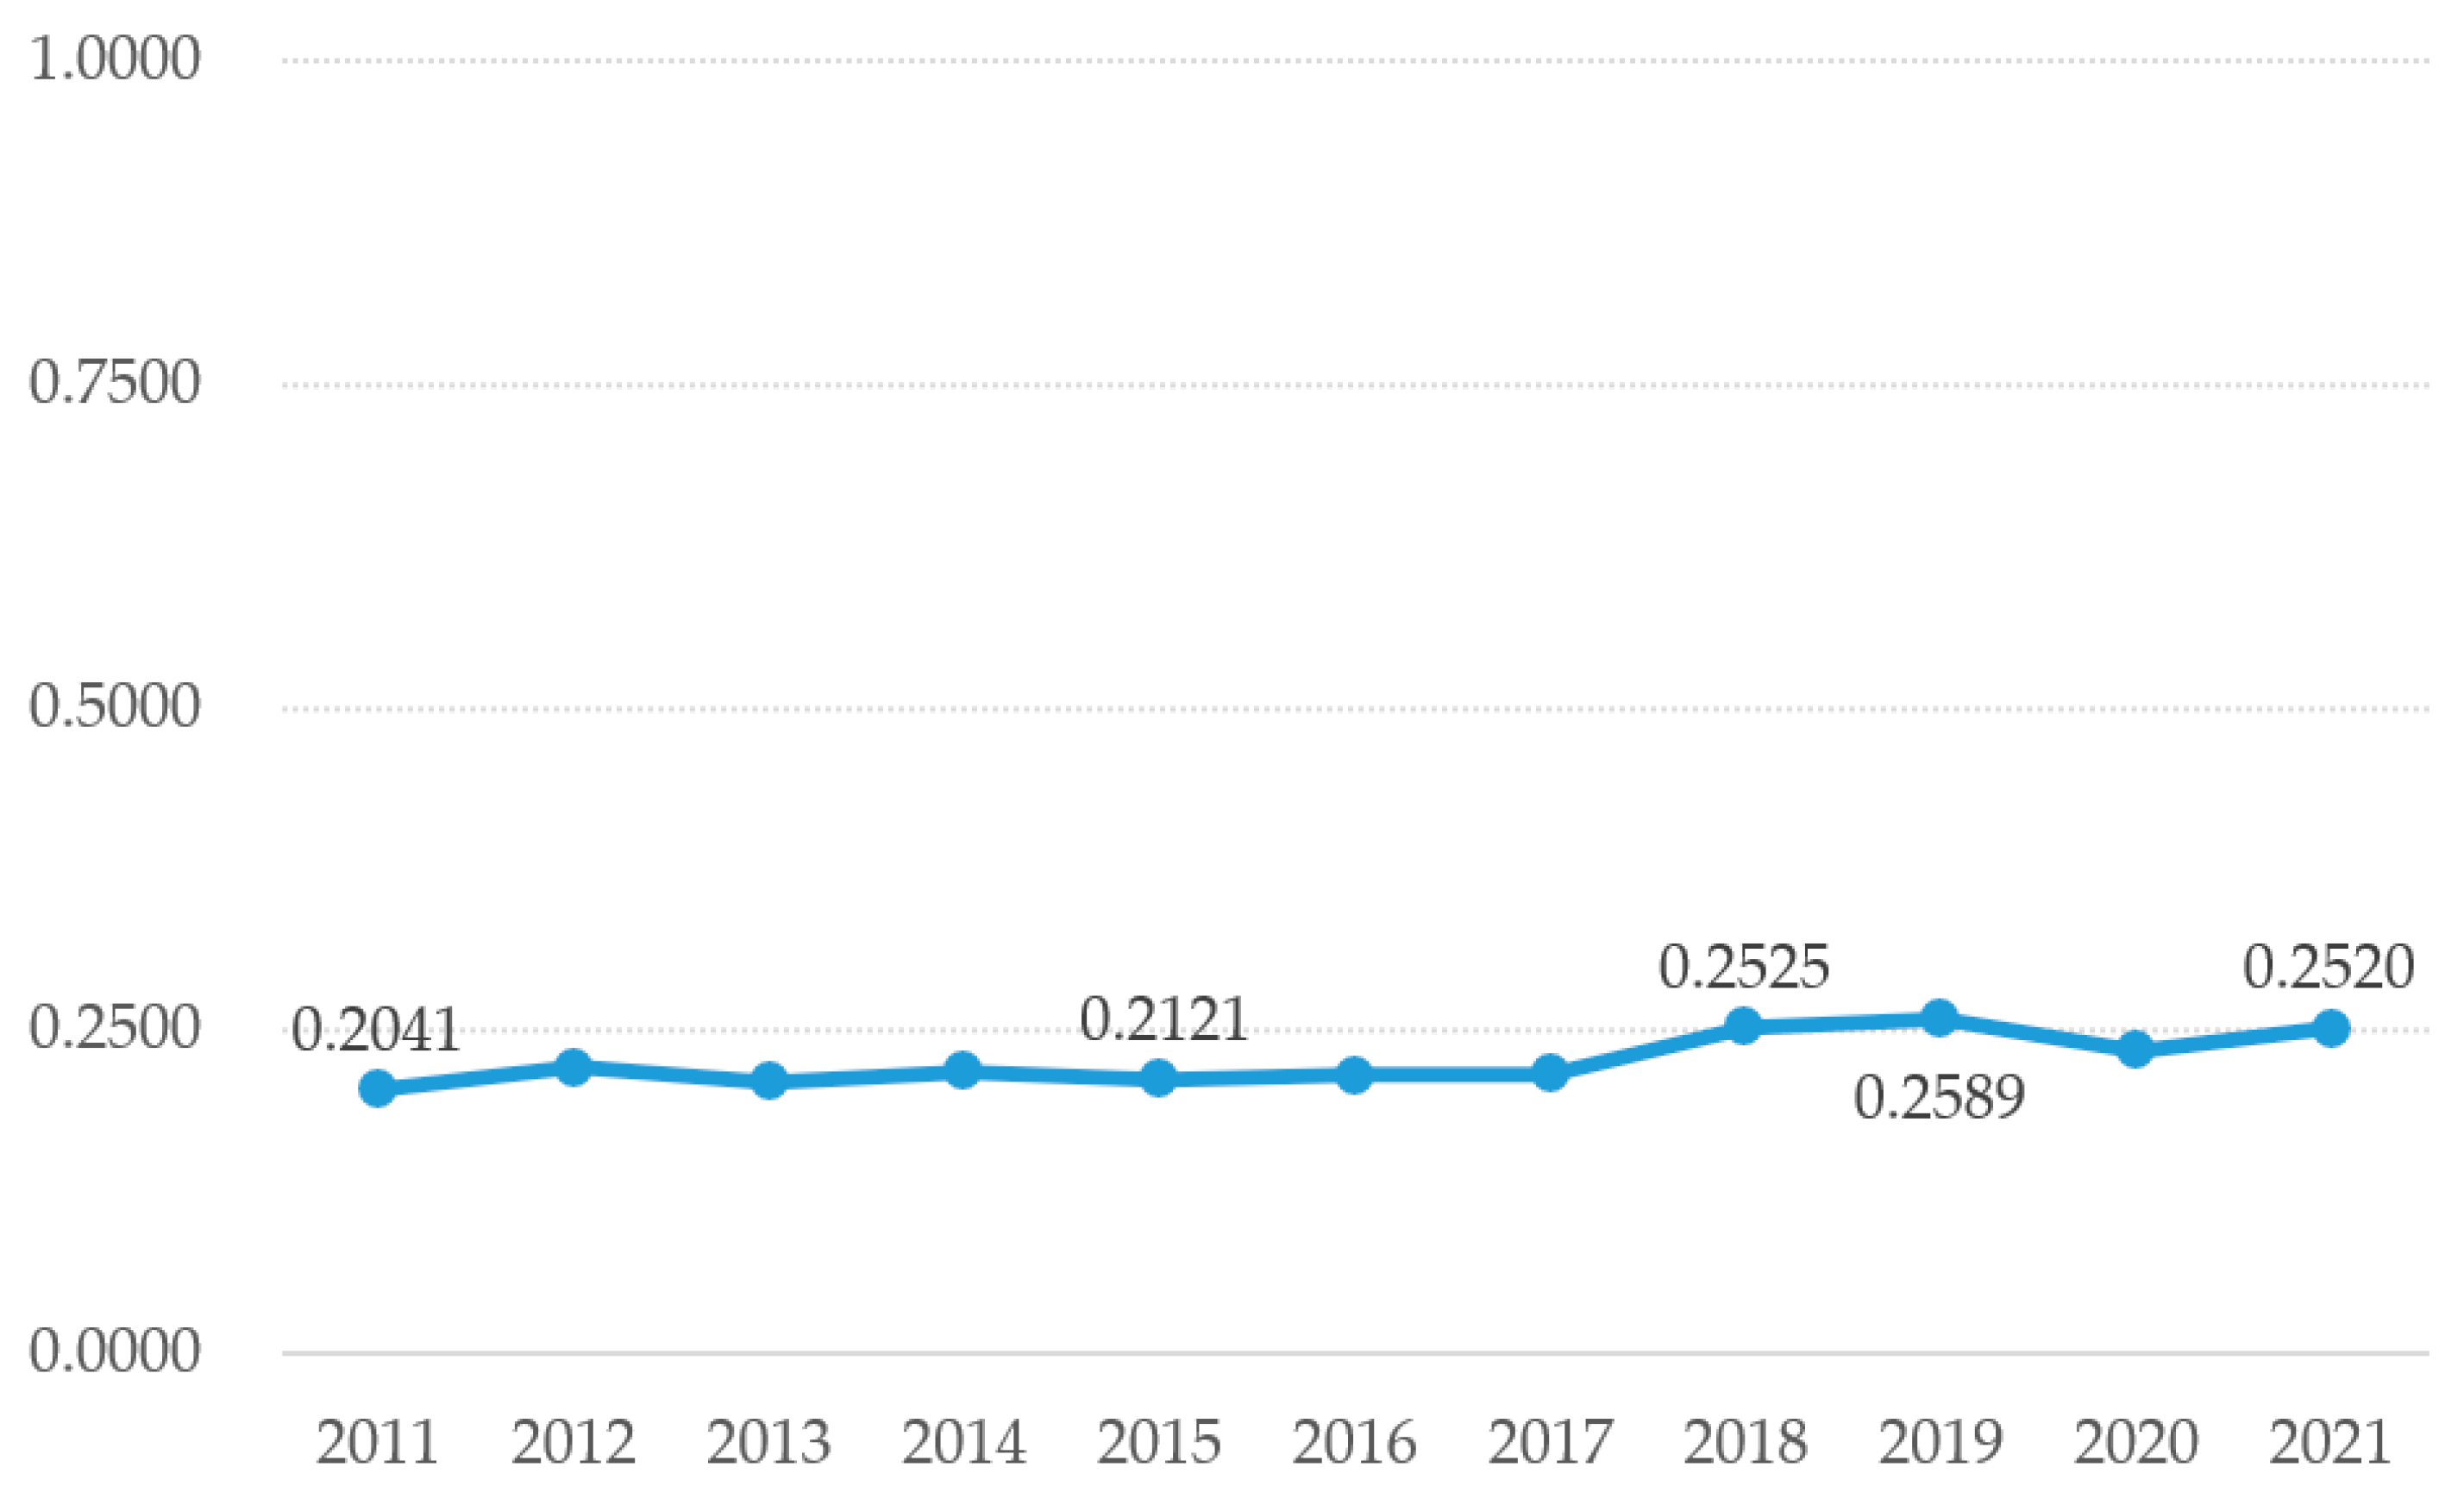
4.1. Concentration Ratios

Figure 5 illustrates the concentration ratios ( C R 4 ) of the TIDFs over the past decade.  C R 4  for the overall industry ranges from 0.2041 to 0.2589, with a mean of 0.2270, indicating that it is an atomistic market with fierce competition.  C R 4  has been above 0.2500 since 2018, suggesting a higher market power for the top four firms. During the analysis period (2011–2021), a total of 440 I-CPS firms generated revenues and the average share of the top 4 firms was 20.0%, 40.5% for the top 10 firms, 57.3% for the top 20 firms, and 67.2% for the top 30 firms. The remaining 410 firms accounted for 32.8% of the total revenue, each with a market share of less than 1.0%. Also, the construction industry is a project-based industry, and each project is unique [5]; thus, economies of scale do not exist due to mass production. Furthermore, as mentioned by Jewell et al. [10,11], the I-CPS industry is a typical buyer’s market and must provide output customized to clients’ needs. Finally, the construction industry is classified as a low-margin and high-risk industry due to the lowest price bid, disputes between diverse stakeholders, transparency, and quality/safety issues [53,54]. As stated above, the I-CPS market can be regarded as an atomistic market.
As shown in Table 1, the annual mean above 0.9000 by firm nationality includes Canada (0.9435), UK (0.9276), The Netherlands (0.9920), Australia (0.9177), France (0.9163), Denmark (1.0000), Sweden (1.0000), United Arab Emirates (0.9996), and Egypt (0.9194), indicating that revenue in these countries comes from a few large firms: WSP, SNC-Lavalin, and Stantec in Canada; Wood, Arup, and Mott MacDonald in UK; Arcadis and Fugro in The Netherlands; Worley and GHD in Australia; EGIS, SYSTRA, and Artelia in France; Ramboll and COWI in Denmark; Sweco and AFRY in Sweden; DAR in United Arab Emirates; and EHAF, Enppi, and ECG in Egypt. In particular, Denmark and Sweden can be regarded as completely concentrated markets as the two firms have dominated the total revenue for each country (i.e., oligopoly). Meanwhile, USA (0.5501), China (0.6009), and Japan (0.7932) showed relatively lower means and higher standard deviations, suggesting that revenue in these countries is produced through fierce competition among many different firms.

4.2. Mobility and Instability Indices

As mentioned in Section 3.1. Research Process, this study analyzed rank distribution of TIDFs as well as the mobility and instability indices for dynamic analysis. Table 2 lists the changing revenue rankings among the TIDFs over the past decade (2011–2021). Regarding the three types of competitive powers (entrants, exiting firms, and continuing firms), 122 entrants, 97 exiting firms, and 103 continuing firms were identified over the past decade (2011–2021). Regarding continuing firms (surviving), 49 firms maintained their rankings, 10 moved up, and 44 moved down. Overall, the I-CPS market structure is characterized by high market entry barriers with differences in TIDFs’ revenue, depending on the corporate strategy and market environment.
Table 3 presents the results of the TURN market mobility model. Based on the TURN values, countries with high mobility are listed as follows: United Arab Emirates (0.9745), Egypt (0.9464), Republic of Korea (0.8170), China (0.7880), Spain (0.7592), UK (0.6919), Japan (0.6262), Italy (0.5949), France (0.5337), Canada (0.4965), USA (0.4762), The Netherlands (0.3572), Australia (0.2905), Denmark (0.0843), and Sweden (0.0455). Countries with TURNE are larger than those with TURNC, including Italy, UK, United Arab Emirates, Egypt, and China. Specifically, in 2017, the DAR Group (ENR’s TIDFs rank in 2017: 6th among 225 firms) changed its nationality from Egypt to United Arab Emirates, and this event had a significant impact on the TURNE for both countries. The emergence of the Wood Group (ENR’s TIDFs rank in 2019: 1st of 225 firms) in 2019 and the absence of the AMEC plc (ENR’s TIDFs rank in 2015: 9th of 225 firms) since 2016 had a huge impact on TURNE for UK. In China, 13 entrants (e.g., China Energy Engineering and China Petroleum Engineering) and 10 exiting firms (e.g., HydroChina and China Chengda Engineering) contributed to the high TURNE value. In contrast, countries with TURNC greater than TURNE include Japan, The Netherlands, Denmark, and Sweden. In these countries, the market power of continuing firms has a greater impact than that of entrants and exiting firms. The major continuing firms of these countries are identified as follows: Nippon Koei Group, Oriental Consultants Global, and CTI Engineering Group in Japan; Arcadis NV/Callison RTKL and Fugro NV in The Netherlands; Ramboll and COWI in Denmark; and Sweco AB and AFRY in Sweden.
Table 4 provides the market instability index by firm nationality, which shows how continuing I-CPS firms maintain their market status. As mentioned in Section 3.3. Market Mobility and Instability, CORSH is the correlation coefficient between the shares of firms from 2011 to 2021, and REGSH is the regression coefficient between the shares of firms during the same period. Under these concepts, countries with stable revenue structures include USA, Australia, France, Denmark, Egypt, and Italy. The other countries have a relatively unstable revenue structure, which can be categorized into the following four types: two countries with CORSH less than 0.7 (The Netherlands and Spain), a country with REGSH less than 0.7 (Sweden), five countries with neither CORSH nor REGSH close to 1 (Canada, UK, China, Republic of Korea, and Japan), and a country with only one continuing firm (United Arab Emirates). The mean REGSH of 14 countries, excluding United Arab Emirates, was 1.6146, suggesting that growth is generally higher for firms with larger market shares. Countries with a REGSH greater than one include USA, Australia, Spain, France, Denmark, Egypt, and Italy, whereas countries with a REGSH less than one include Canada, UK, The Netherlands, China, Sweden, Republic of Korea, and Japan.
Figure 6 and Figure 7 illustrate the changing market share of continuing firms in USA and China, respectively. In USA, 85.7% of continuing firms (30 of 35 firms) maintained a revenue share of less than 5%. The other five firms had relatively higher market shares, including three firms (AECOM, Jacobs, and Tetra Tech) with increased shares and two firms (Fluor and Bechtel) with decreased shares. The estimated regression equation for USA firms is  y = 1.4077 x + 0.0015   ( R 2 = 0.8241 ) , which shows a stable revenue structure. The estimated regression equation for Chinese companies is  y = 0.0543 x + 0.0473   ( R 2 = 0.0004 ) , indicating a relatively unstable revenue structure. While the increased share of POWERCHINA has been noticeable in recent years (from 2.6% in 2011 to 30.4% in 2021), the share of companies other than CCCC was less than 5%.

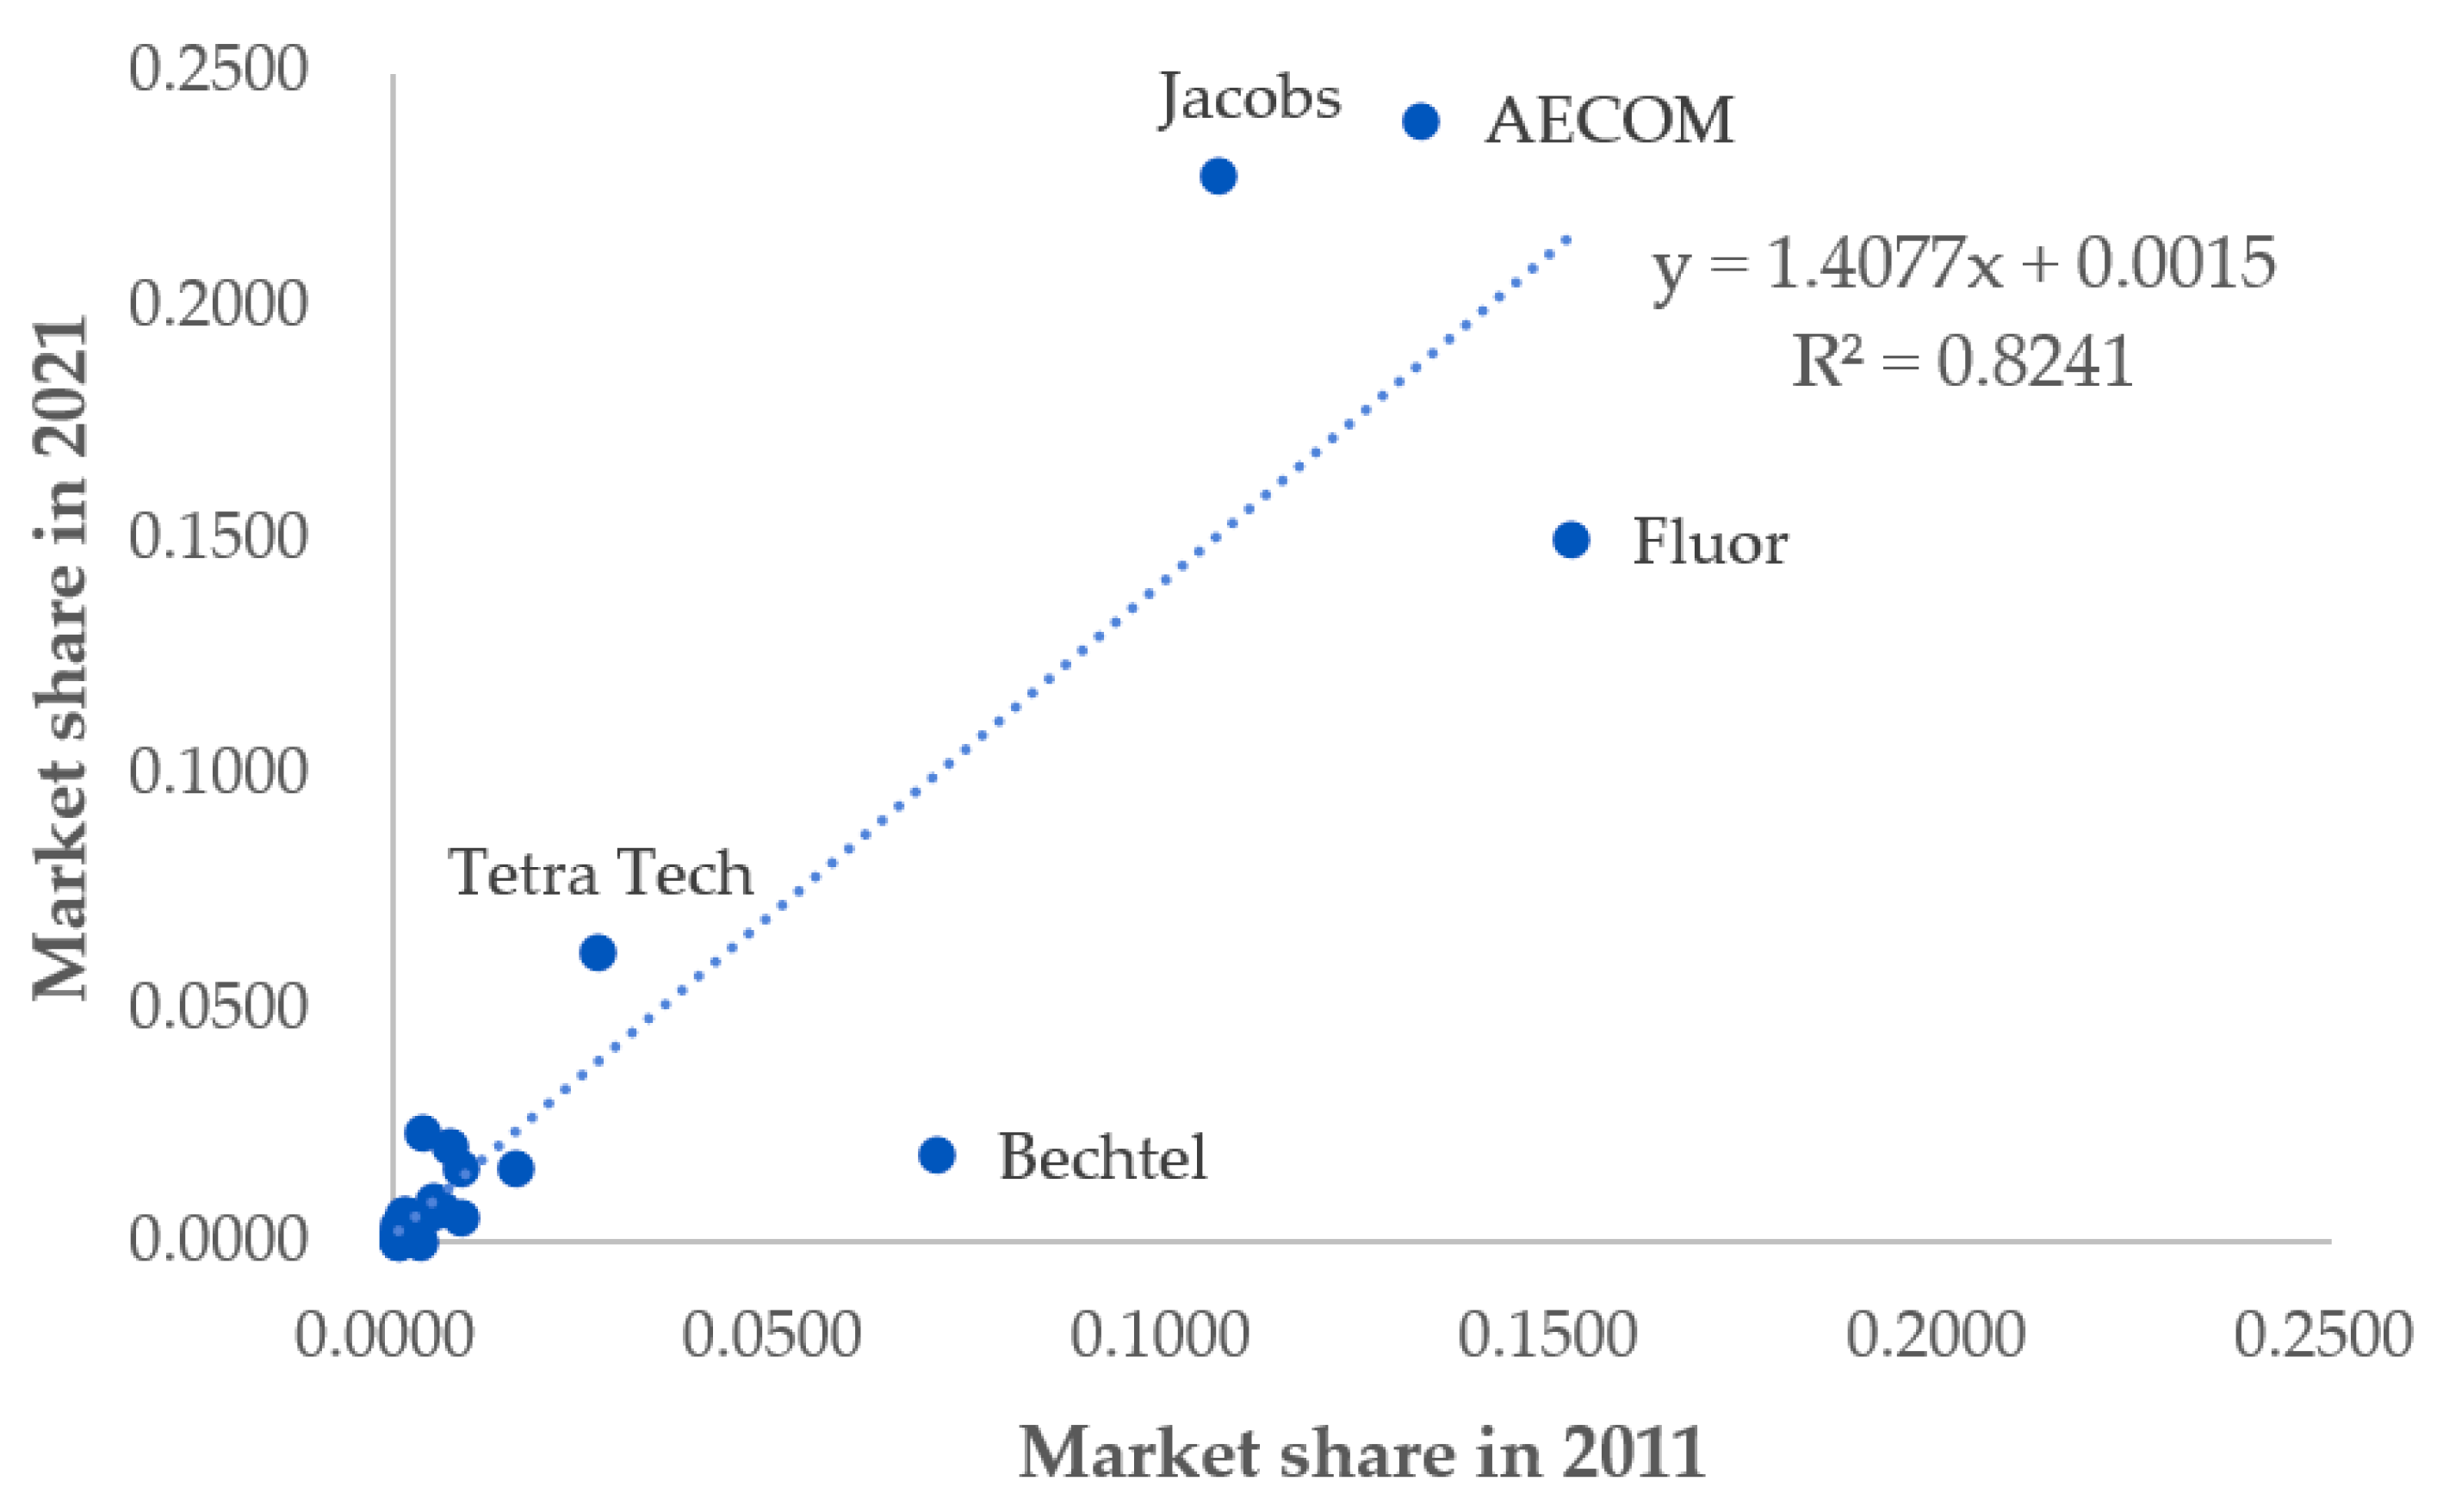
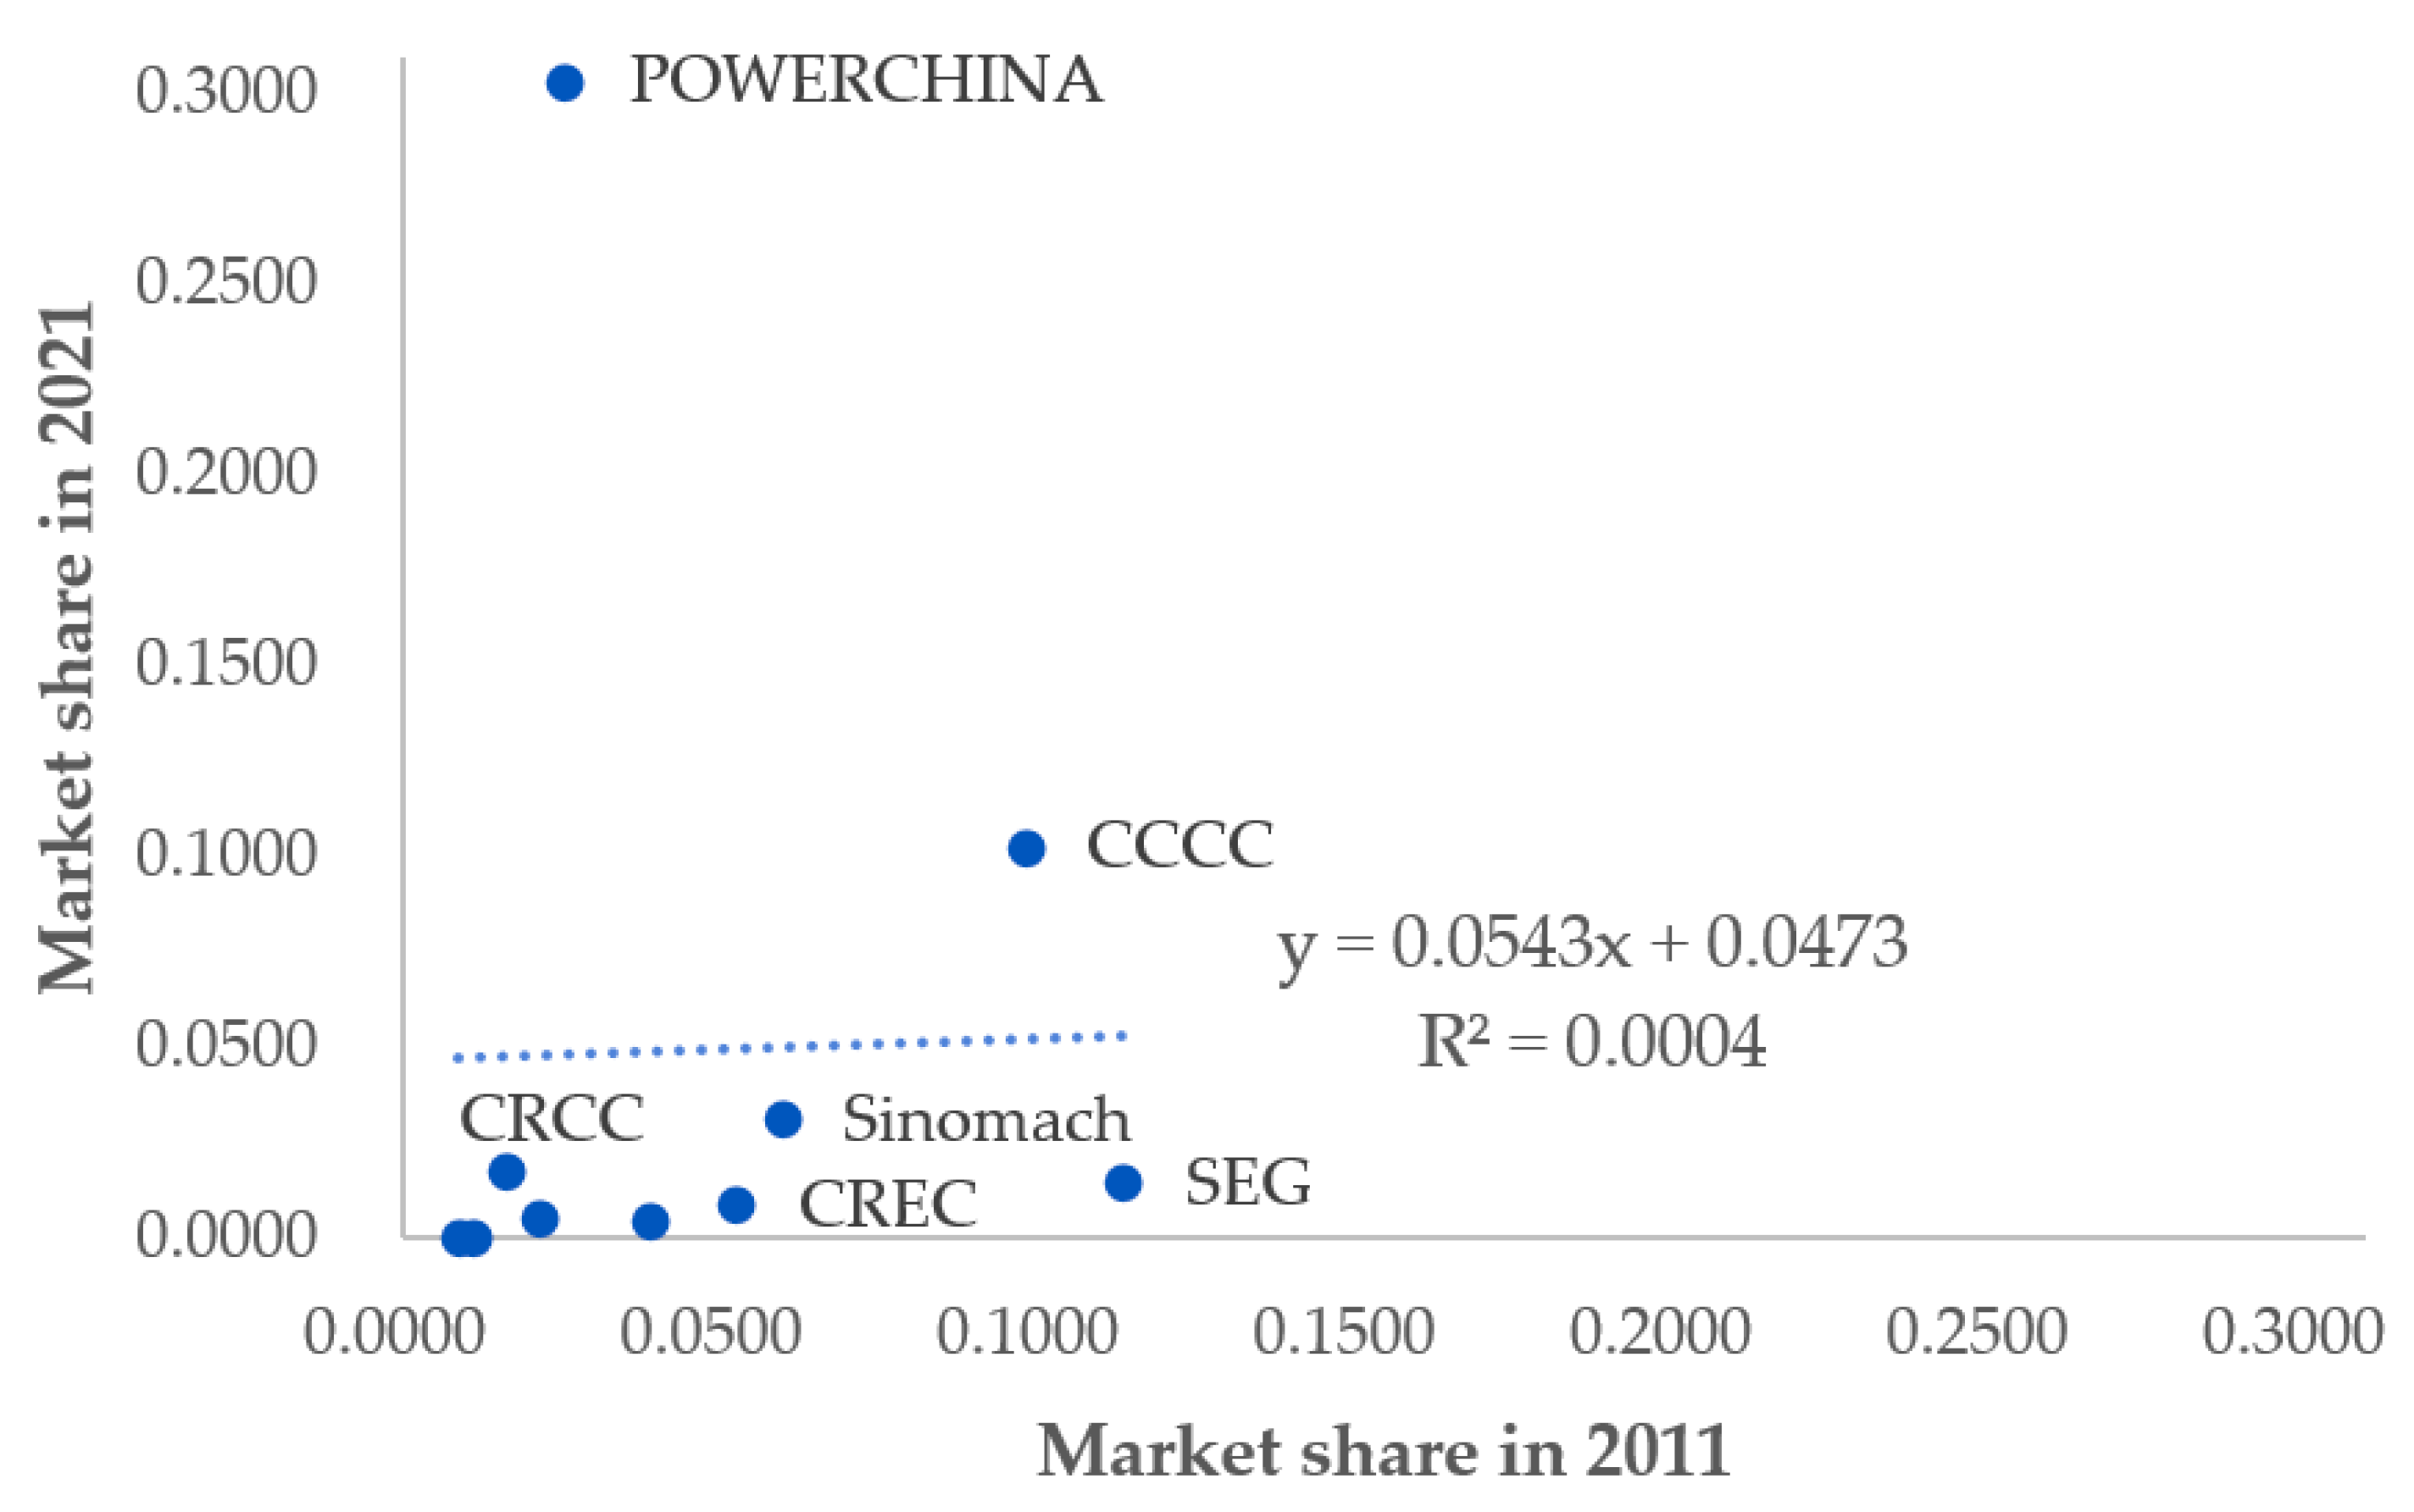
4.3. Cross-Comparison between Static and Dynamic Indices

This study compared the characteristics of 15 countries based on the aforementioned three indices. The following classification criteria were used for the indices, as suggested by Lee and Kim [24]: (1) market mobility (TURN) that is high mobility (0.500 or more), moderate mobility (0.499–0.250), and slight mobility (0. 249 or less) and (2) market instability (CORSH and REGSH) considered a stable structure (0.700 or more) and an unstable structure (less than 0.700). Table 5 summarizes the characteristics of the 15 countries based on these criteria. Spearman’s correlation coefficient ( ρ ) was also calculated from the classification of the three indices, and no significant correlation was found (Table 6). This suggests a gap between the three indices and that the indices independently explain the concentration, mobility, and instability aspects of the I-CPS revenue structure. Consequently, the 15 countries were categorized into four types based on their static and dynamic indices (Table 7). Compared to conventional static (concentration) analysis, the combination of static and dynamic indices suggested in this study may offer some clues to explain the continuous growth and competitiveness of countries in the I-CPS market.

5. Discussion and Conclusions

This study analyzed the revenue structures of TIDFs by firm nationality to examine the country-specific factors that affect firms’ continuous growth and survival in the I-CPS industry. ENR’s TIDFs list from the past decade (2011–2021) was used to statically and dynamically analyze the market structure in 15 major countries, accounting for 93.2% of the overall international design revenue. These findings offered meaningful information for understanding major countries’ underlying competitive forces and the I-CPS industry’s overall market conditions.
The macro analysis in the Research Background section revealed that market forces have shifted from Europe and the US to Canada and China. As shown in Figure 3, the combined market share of Europe and USA declined from 71.9% in 2011 to 56.8% in 2021, whereas that of Canada and China increased from 10.9% to 24.8% during the same period. More specifically, Europe, including UK, The Netherlands, Spain, France, and Denmark, has maintained a share of 30–40%, while USA has seen its share decline from 34.9% in 2011 to 23.2% in 2021, as its major firms, such as KBR, CH2M, URS, Parsons Brinckerhoff, and CB&I, were removed from the ENR list due to M&A or nationality changes. Canada maintained a market structure with its four leading firms (WSP, SNC-Lavalin, Stantec, and Hatch) with a huge increase in share from 7.4% in 2011 to 18.1% in 2021. In addition, China’s share has nearly doubled from 3.5% in 2011 to 6.7% in 2021. Lu et al. [6] reported a strengths, weaknesses, opportunities, and threats (SWOT) analysis of the Chinese I-CPS industry. Lu et al. [6] stated that the strengths of the I-CPS industry in China include low prices, a large pool of talent, and strong government support and mentioned strong delivery capability by partnering with Chinese international contractors as an opportunity. An in-depth analysis of I-CPS competitiveness in major countries such as China holds significance for academia and practice in identifying sources of continuous competitive advantage. Furthermore, this study is significant because it provides a macro and quantitative analysis of country-level competition based on international design revenue before conducting an in-depth case study by country.
Next, the combination of the static and dynamic indices used in this study is useful, as it offers clues to explain the continuous growth and competitiveness of countries in the I-CPS market. The 15 countries analyzed in this study can be categorized into the following two types based on their characteristics: The first type consists of four countries with markets driven by a small number of large firms: The Netherlands, Sweden, United Arab Emirates, and Denmark. The common characteristics among these four countries include a concentration ratio close to one, some large firms having an oligopoly structure, and a similar revenue structure expected in the future. The second type comprises 11 countries: USA, China, Italy, Republic of Korea, Japan, Canada, UK, Spain, Australia, Egypt, and France. Unlike the first type, the number of TIDFs in these 11 countries averages 30, ranging from 10 (France) to 160 (USA), with relatively low concentration ratios and high mobility indices. USA, Australia, France, Egypt, and Italy had relatively stable revenue structures, whereas the other six countries had unstable ones. In summary, similar to the TICs analysis [24], the recent competitive environment for TIDFs was intense, and many countries had unstable market positions. This is attributable to the characteristics of the I-CPS industry: host-country/location-specific, often client-led, highly customized bespoke output, extrinsic demand, project-based, heterogeneous, and knowledge-intensive [10,11]. To maintain a country’s competitiveness in the I-CPS market, it is necessary to understand the underlying competitive forces based on a systematic analysis of the latest performance and establish country- and firm-level strategies to take on changing markets in the future. Revenue information of I-CPS firms can easily be found on their website; however, it is fragmented by year and firm, and, so far, a systematic approach for analyzing the entire industry over a long time period is insufficiently addressed. The results of this study are meaningful because they provide clues for targeting similar types of countries, not only for the 15 countries but also for other countries, and for establishing customized benchmarking or competitive strategies. Also, the findings of this study help understand country-level competition in the I-CPS market from a macro perspective, and provide directions for follow-up studies related to the I-CPS market structure.
Despite the contributions discussed above, this study has the following limitations. First, the scope of the study is limited to the ENR’s TIDFs list from the last decade (2011–2021), which does not fully represent the entire I-CPS market. Despite this limitation, the ENR data can be considered a representative and reliable source for the following reasons as stated by Ye et al. [46] and Lu et al. [55]: (1) firms not ranked in the ENR’s Top List have negligible market power as their market shares are relatively very small, (2) the market power that changes the international market structure mainly comes from top-tier firms, and competition also takes place on a similar scale, and (3) the ENR’s Top List has a long history and provides a wealth of reliable data. Meanwhile, while the results of this study provide quantitative values and interpretations of country-specific factors affecting continuous growth and survival in the I-CPS market, the author could not conduct an in-depth analysis of the evolutionary path for a country’s competitiveness at the firm level. In this regard, the international processes of countries and TIDFs are worth exploring in the future based on the structure–conduct–performance theory [56,57] by conducting in-depth case studies on major countries and firms. In addition, future follow-up studies from a more macroscopic perspective than the market structure could provide meaningful insights in relation to the I-CPS industry. Recent issues such as the COVID-19 pandemic, climate change, Corporate Social Responsibility, Environmental Social Governance, sustainability, and Sustainable Development Goals are having a great impact on I-CPS firms’ businesses and will also affect the I-CPS market structure in the long term [42,58,59,60]. In this regard, the author’s follow-up research will cover the impact of these macro factors on the financial and non-financial performance of I-CPS firms, and the direction for assessing the sustainability level of the I-CPS industry. Finally, comprehensive research that covers firms’ resources/capabilities (financial, managerial, technical, etc.), profitability, and government support in relation to country competitiveness as well as revenue performance is also very important, and the author will improve it through follow-up research.

Funding

This research was carried out under the Korea Institute of Civil Engineering and Building Technology (KICT) Research Program (Project No. 20230026-001, Operation of Post-Construction Evaluation and Management Center), funded by the Ministry of Land, Infrastructure, and Transport (MOLIT) of Korea.

Data Availability Statement

Not applicable.

Conflicts of Interest

The author declares no conflict of interest.

References

  1. Lu, W.; Ye, K.; Flanagan, R.; Jewell, C. Nexus between contracting and construction professional service businesses: Empirical evidence from international market. J. Constr. Eng. Manag. 2014, 140, 04013049. [Google Scholar] [CrossRef]
  2. United Nations. International Standard Industrial Classification of All Economic Activities—Revision 4; Series M: Miscellaneous Statistical Papers, No. 4/Rev. 4, ST/ESA/STAT/SER.M/4/REV.4; United Nations: New York, NY, USA, 2008. [Google Scholar]
  3. World Trade Organization. Service Sectoral Classification List; WTO Document Code: MTN.GNS/W/120; World Trade Organization: Geneva, Switzerland, 1991. [Google Scholar]
  4. Han, S.H.; Park, S.H.; Kim, D.Y.; Kim, H.; Kang, Y.W. Causes of bad profit in overseas construction projects. J. Constr. Eng. Manag. 2007, 133, 932–943. [Google Scholar] [CrossRef]
  5. Lee, K.W.; Han, S.H.; Park, H.; Jeong, H.D. Empirical analysis of host-country effects in the international construction market: An industry-level approach. J. Constr. Eng. Manag. 2016, 142, 04015092. [Google Scholar] [CrossRef]
  6. Lu, W.; Ye, K.; Flanagan, R.; Jewell, C. Developing construction professional services in the international market: SWOT analysis of China. J. Manag. Eng. 2013, 29, 302–313. [Google Scholar] [CrossRef]
  7. World Trade Organization. Construction and Related Engineering Services: Background Noted by the Secretariat; S/C/W/38; World Trade Organization: Geneva, Switzerland, 1998. [Google Scholar]
  8. Engineering News-Record. The Top 225 International Design Firms. 2022. Available online: https://www.enr.com/ext/resources/Issues/National_Issues/2022/15-August/ENR08152022_TIDF_compressed.pdf (accessed on 15 August 2022).
  9. Engineering News-Record. The Top 250 International Contractors. 2022. Available online: https://www.enr.com/ext/resources/Issues/National_Issues/2022/29-August/ENR08292022_TIC250_R1_compressed.pdf (accessed on 29 August 2022).
  10. Jewell, C.; Flanagan, R.; Anac, C. Understanding UK construction professional services exports: Definitions and characteristics. Constr. Manag. Econ. 2010, 28, 231–239. [Google Scholar] [CrossRef]
  11. Jewell, C.; Flanagan, R.; Lu, W. The dilemma of scope and scale for construction professional service firms. Constr. Manag. Econ. 2014, 32, 473–486. [Google Scholar] [CrossRef]
  12. Engineering News-Record. The Top 200 International Design Firms. 2012. Available online: https://www.enr.com/ext/resources/static_pages/PDFs/national_toplists/Intl-Design-Firms/ENR_IDF_Top200_Overview_07232012.pdf (accessed on 23 July 2012).
  13. Engineering News-Record. The Top 225 International Design Firms. 2015. Available online: https://www.enr.com/ext/resources/static_pages/PDFs/national_toplists/Intl-Design-Firms/ENR_Top_225_International_Design_Firms_2015.pdf (accessed on 3 August 2015).
  14. Engineering News-Record. The Top 225 International Design Firms. 2019. Available online: https://www.enr.com/ext/resources/static_pages/Top-600/Top-Lists/2019/Files/ENR_2019_Top225_Intl_Design_Firms_Complete.pdf (accessed on 29 July 2019).
  15. Engineering News-Record. The Top 225 International Design Firms. 2020. Available online: https://www.enr.com/ext/resources/static_pages/Top-600/Top-Lists/2020/Files/ENR08032020_TIDF_combined.pdf (accessed on 10 August 2020).
  16. Engineering News-Record. The Top 200 International Design Firms. 2011. Available online: https://www.enr.com/ext/resources/static_pages/PDFs/national_toplists/Intl-Design-Firms/2011-Intl_Design_Global_Firms.pdf (accessed on 25 July 2011).
  17. Engineering News-Record. The Top 225 International Design Firms. 2013. Available online: https://www.enr.com/ext/resources/static_pages/PDFs/national_toplists/Intl-Contractors/enr_the_top_250_international_contractors_2013.pdf (accessed on 5 August 2013).
  18. Engineering News-Record. The Top 225 International Design Firms. 2014. Available online: https://www.enr.com/ext/resources/static_pages/PDFs/national_toplists/Intl-Contractors/2014_enr_top_250_intl_cont.pdf (accessed on 4 August 2014).
  19. Engineering News-Record. The Top 225 International Design Firms. 2016. Available online: https://www.enr.com/ext/resources/static_pages/Top-600/Top-Lists/2016/ENR07182016_Top225.pdf (accessed on 18 July 2016).
  20. Engineering News-Record. The Top 225 International Design Firms. 2017. Available online: https://www.enr.com/ext/resources/Issues/National_Issues/2017/07-July/17-Jul/ENR0717_TIDF_full.pdf (accessed on 17 July 2017).
  21. Engineering News-Record. The Top 225 International Design Firms. 2018. Available online: https://www.enr.com/ext/resources/static_pages/Top-600/Top-Lists/2018/Files/0716_TIDF_combined_compressed.pdf (accessed on 16 July 2018).
  22. Engineering News-Record. The Top 225 International Design Firms. 2021. Available online: https://www.enr.com/ext/resources/static_pages/Top-600/Top-Lists/2021/Files/ENR08022021_TIDF_compressed.pdf (accessed on 9 August 2021).
  23. Jiang, W.; Hu, X.; Ye, K.; Wong, J.K.W. Market structure of international construction professional services: Evidences from top design firms. J. Manag. Eng. 2016, 32, 4015033. [Google Scholar] [CrossRef]
  24. Lee, K.W.; Kim, D.Y. Market structure analysis of international construction revenue: A country level analysis. KSCE J. Civ. Eng. 2022, 26, 4960–4970. [Google Scholar] [CrossRef]
  25. Porter, M.E. Competitive Strategy: Techniques for Analyzing Industries and Competitors; Free Press: New York, NY, USA; Collier-MacMillan: London, UK, 1980. [Google Scholar]
  26. Gunhan, S. Factors affecting international contractors’ performance in the 21st century. Pract. Period. Struct. Des. Constr. 2020, 25, 05020011. [Google Scholar] [CrossRef]
  27. International Water and Sanitation Centre. Water Related Institutions in The Netherlands. 2001. Available online: https://www.ircwash.org/sites/default/files/210-01RE-17079.pdf (accessed on 23 June 2023).
  28. Luchtenbelt, A.W. Nederlandse Ingenieursbureaus in het Buitenland: Alleen of Samen Sterk? Een Vergelijking Tussen de Samenwerkingsverbanden Nedeco en het NWP. Master’s Thesis, Universiteit Utrecht, Utrecht, The Netherlands, 2016. Available online: https://studenttheses.uu.nl/handle/20.500.12932/22212?show=full (accessed on 23 June 2023).
  29. K-Water Institute. A Study on the Korea’s Water Industry Advancement to Abroad: Focusing on the Country-Customized Entry Strategy Establishment. Available online: https://www.kwater.or.kr/kiwe/resu/reportDown.do?otxt_atchfl_id=LIB20070614400049826&fileSeq=1 (accessed on 25 August 2023).
  30. Hoxley, M. Measuring UK construction professional service quality: The what, how, when and who. Int. J. Qual. Reliab. Manag. 2000, 17, 511–526. [Google Scholar] [CrossRef]
  31. Connaughton, J.; Meikle, J. The changing nature of UK construction professional service firms. Build. Res. Inf. 2013, 41, 95–109. [Google Scholar] [CrossRef]
  32. Murphy, R. Strategic planning in construction professional service firms: A study of Irish QS practices. Constr. Manag. Econ. 2013, 31, 151–166. [Google Scholar] [CrossRef]
  33. Abdul-Aziz, A.R.; Pengiran, D.N.; Law, Y.H.; Nor Azmi, H.A.C.M.; Ramayah, T. Export of Malaysia’s construction professional services. Malays. Constr. Res. J. 2013, 12, 59–81. [Google Scholar]
  34. Connaughton, J.; Meikle, J.; Teerikangas, S. Mergers, acquisitions and the evolution of construction professional services firms. Constr. Manag. Econ. 2015, 33, 146–159. [Google Scholar] [CrossRef]
  35. Hoxley, M. Are competitive fee tendering and construction professional service quality mutually exclusive? Constr. Manag. Econ. 2000, 18, 599–605. [Google Scholar] [CrossRef]
  36. Kissi, J.; Dainty, A.; Liu, A. Examining middle managers’ influence on innovation in construction professional services firms: A tale of three innovations. Constr. Innov. 2012, 12, 11–28. [Google Scholar] [CrossRef]
  37. Ugural, M.; Giritli, H. Three-way interaction model for turnover intention of construction professionals: Some evidence from Turkey. J. Constr. Eng. Manag. 2021, 147, 04021008. [Google Scholar] [CrossRef]
  38. Adabre, M.A.; Chan, A.P.C.; Darko, A.; Osei-Kyei, R.; Abidoye, R.; Adjei-Kumi, T. Critical barriers to sustainability attainment in affordable housing: International construction professionals’ perspective. J. Clean. Prod. 2020, 253, 119995. [Google Scholar] [CrossRef]
  39. Raphael, A.O.; Samuel, O.S.; Dipeolu, A.A. Evaluation of service quality gaps in construction professional service firms in Nigeria. J. Constr. Dev. Ctries. 2022, 27, 25–40. [Google Scholar] [CrossRef]
  40. Murphy, R.; Seriki, O. The impact of environmental turbulence on the strategic decision-making process in Irish quantity surveying (QS) professional service firms (PSFs). Constr. Manag. Econ. 2021, 39, 739–758. [Google Scholar] [CrossRef]
  41. Adesi, M.; Owusu-Manu, D.; Boateng, F.; Addy, M.N.; Kissi, E. The challenges of pricing quantity surveying professional services in Ghana. Front. Eng. Built Environ. 2023, 3, 77–92. [Google Scholar] [CrossRef]
  42. Engineering News-Record. The Top 225 International Design Firms. 2023. Available online: https://www.enr.com/ext/resources/Issues/National_Issues/2023/14-Aug/ENR08142023_TIDF_compressed.pdf (accessed on 21 August 2023).
  43. Han, J.G.; Park, H.P.; Ock, J.H.; Jang, H.S. An international competitiveness evaluation model in the global construction industry. KSCE J. Civ. Eng. 2015, 19, 465–477. [Google Scholar] [CrossRef]
  44. Sung, Y.K.; Lee, J.; Yi, J.S.; Son, J. Establishment of growth strategies for international construction firms by exploring diversification-related determinants and their effects. J. Manag. Eng. 2017, 33, 04017018. [Google Scholar] [CrossRef]
  45. Zhao, Z.Y.; Tang, C.; Zhang, X.; Skitmore, M. Agglomeration and competitive position of contractors in the international construction sector. J. Constr. Eng. Manag. 2017, 143, 04017004. [Google Scholar] [CrossRef]
  46. Ye, K.; Lu, W.; Jiang, W. Concentration in the international construction market. Constr. Manag. Econ. 2009, 27, 1197–1207. [Google Scholar] [CrossRef]
  47. Zhao, Z.Y.; Guo, X.L.; Chang, R.D. Market concentration and competitive intensity of the international engineering contracting industry. J. Constr. Eng. Manag. 2019, 145, 04019026. [Google Scholar] [CrossRef]
  48. Zilke, J.P.; Taylor, J.E. Evaluating the suitability of using international market analyses to characterize the global construction industry. J. Manag. Eng. 2015, 31, 04014078. [Google Scholar] [CrossRef]
  49. Baldwin, J.R.; Gorecki, P.K. Concentration and mobility statistics in Canada’s Manufacturing Sector. J. Ind. Econ. 1994, 42, 93–103. [Google Scholar] [CrossRef]
  50. van Kranenburg, H. Mobility and market structure in the Dutch daily newspaper market segments. J. Media Econ. 2009, 15, 107–123. [Google Scholar] [CrossRef]
  51. Davies, S. Choosing between concentration indices: The iso-concentration curve. Economica 1979, 46, 67–75. [Google Scholar] [CrossRef]
  52. Sawyer, C.M. The Economics of Industries and Firms; Croom Helm: London, UK, 1981. [Google Scholar]
  53. Infrastructure Intelligence. Construction Can no Longer Ignore Low Profit Margins. Available online: http://www.infrastructure-intelligence.com/article/sep-2019/construction-can-no-longer-ignore-low-profit-margins (accessed on 30 August 2023).
  54. Accountancy Age. The Construction Sector Is “Fragile” with “Low Margins and High Risks”, Says ICAEW. Available online: https://www.accountancyage.com/2019/03/28/the-construction-sector-is-fragile-with-low-margins-and-high-risks-says-icaew/ (accessed on 30 August 2023).
  55. Lu, W. Reliability of Engineering News-Record international construction data. Constr. Manag. Econ. 2014, 32, 968–982. [Google Scholar] [CrossRef]
  56. Dunning, J.H. The eclectic paradigm of international production: A restatement and some possible extensions. J. Int. Bus. Stud. 1988, 19, 1–31. [Google Scholar] [CrossRef]
  57. Dunning, J.H. Reappraising the eclectic paradigm in an age of alliance capitalism. J. Int. Bus. Stud. 1995, 26, 461–491. [Google Scholar] [CrossRef]
  58. OECD iLibrary. OECD Investment Policy Reviews: Egypt 2020. Chapter 7. Toward sustainable Economic Development Through Promoting and Enabling Responsible Business Conduct. Available online: https://www.oecd-ilibrary.org/sites/f7813858-en/index.html?itemId=/content/component/f7813858-en (accessed on 21 August 2023).
  59. Siegerink, V. Beyond the Bottom Line: Measuring the Non-Financial Performance of Firms through the Lens of the OECD Well-Being Framework. Available online: https://oecdstatistics.blog/2022/12/12/beyond-the-bottom-line-measuring-the-non-financial-performance-of-firms-through-the-lens-of-the-oecd-well-being-framework/ (accessed on 21 August 2023).
  60. Popescu, C.R.G. Sustainability assessment: Does the OECD/G20 inclusive framework for BEPS (Base Erosion and Profit Shifting Project) put an end to disputes over the recognition and measurement of intellectual capital? Sustainability 2020, 12, 10004. [Google Scholar] [CrossRef]
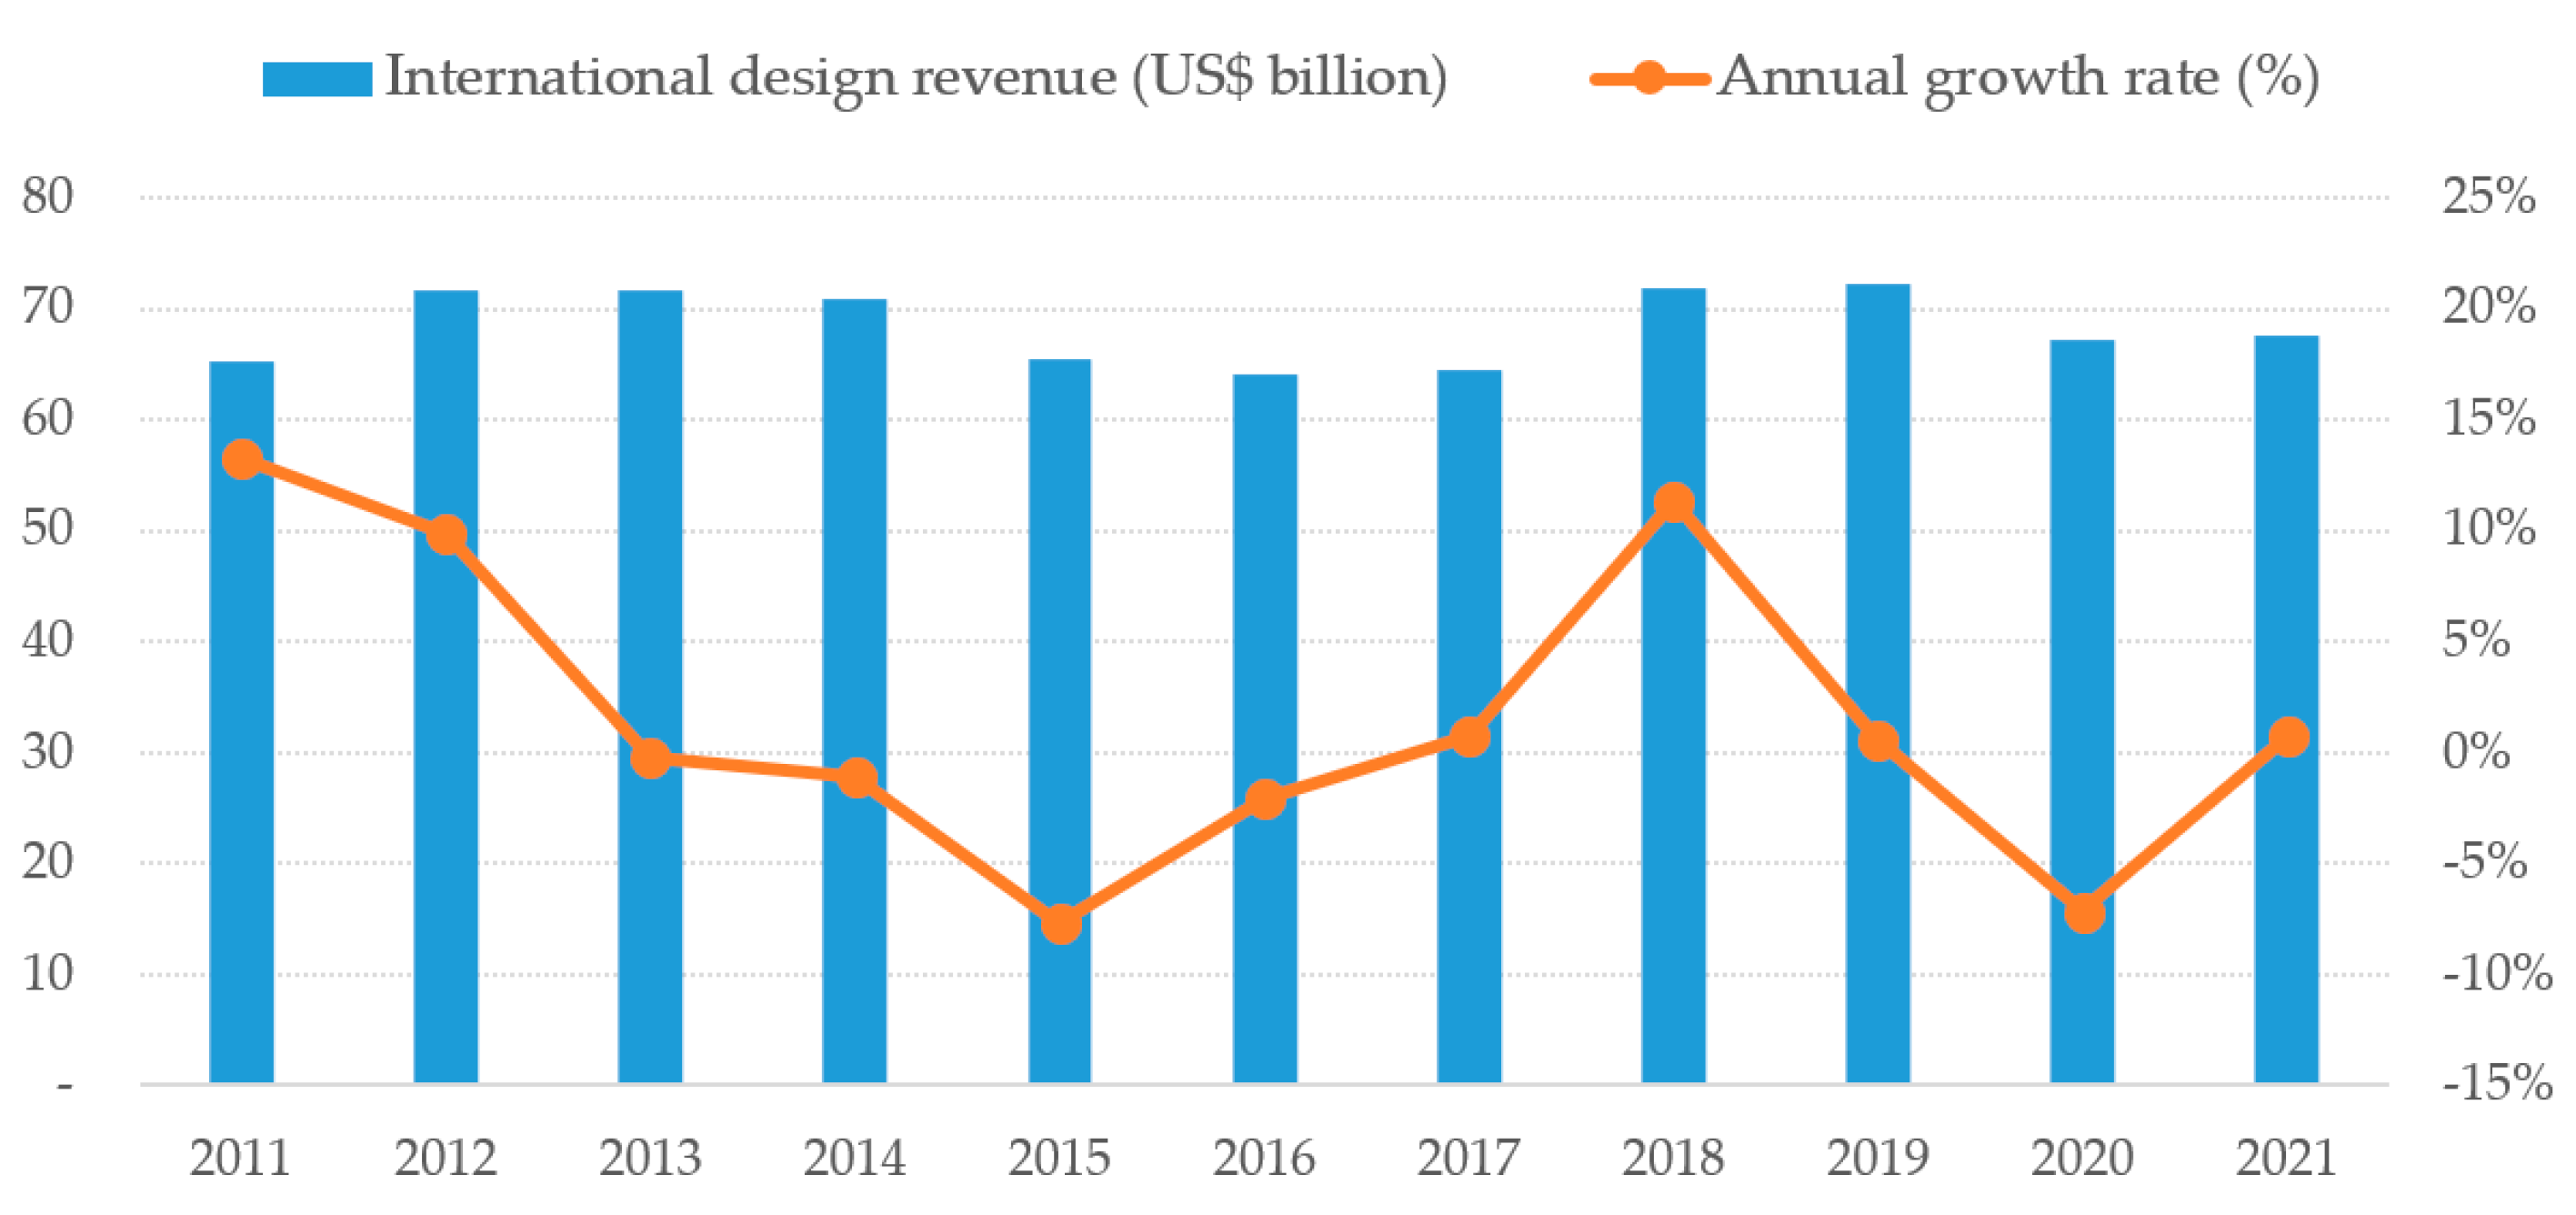
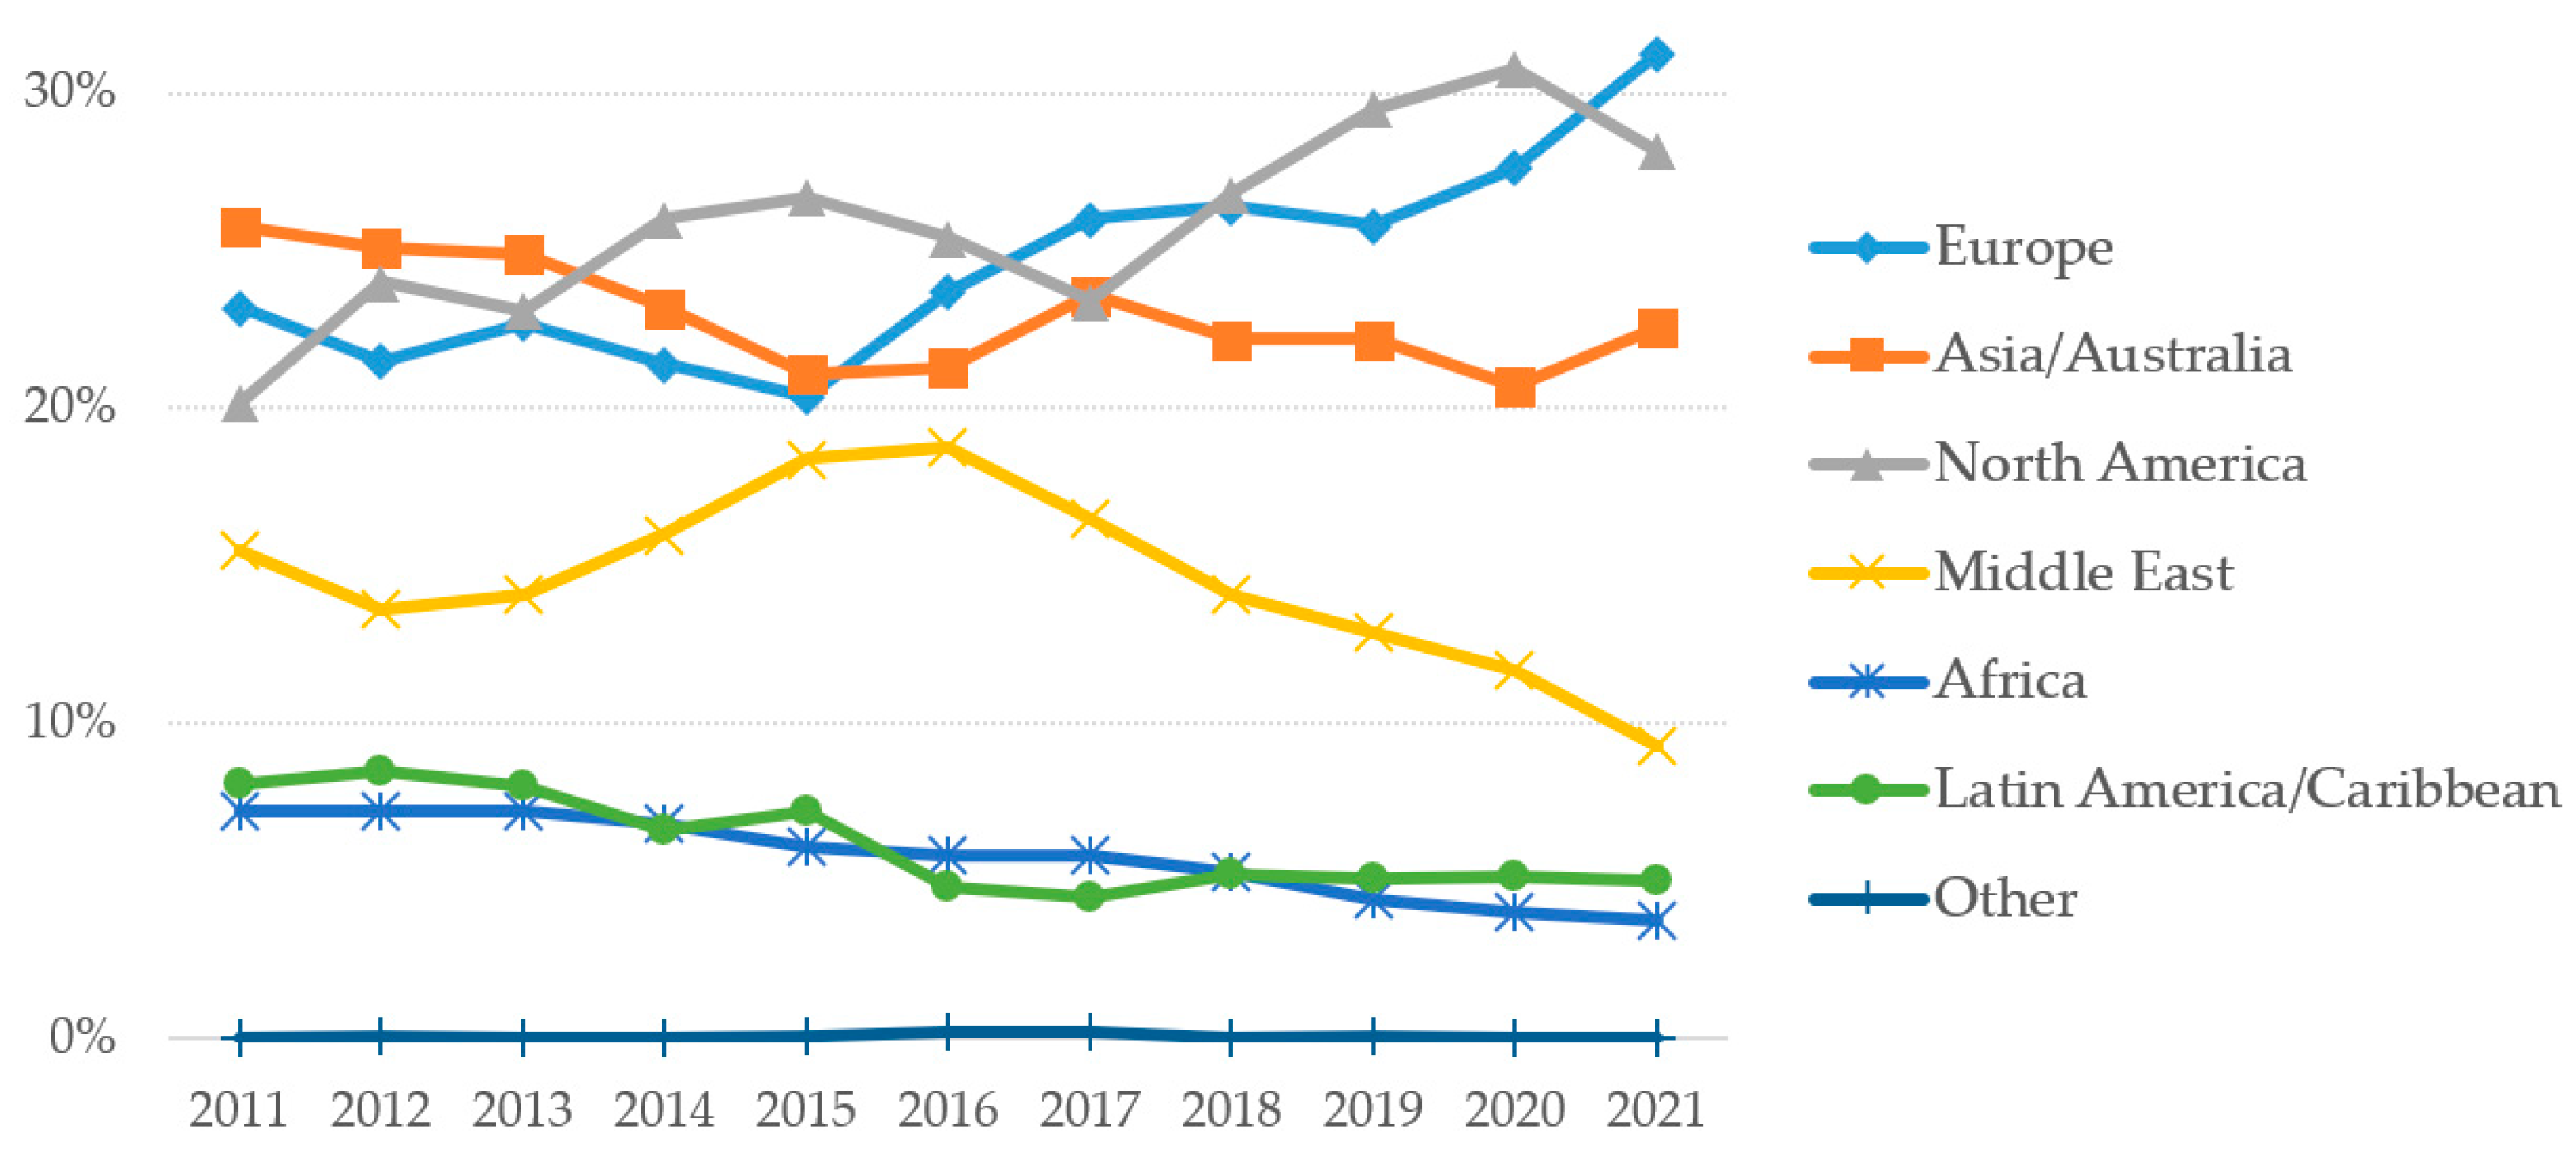
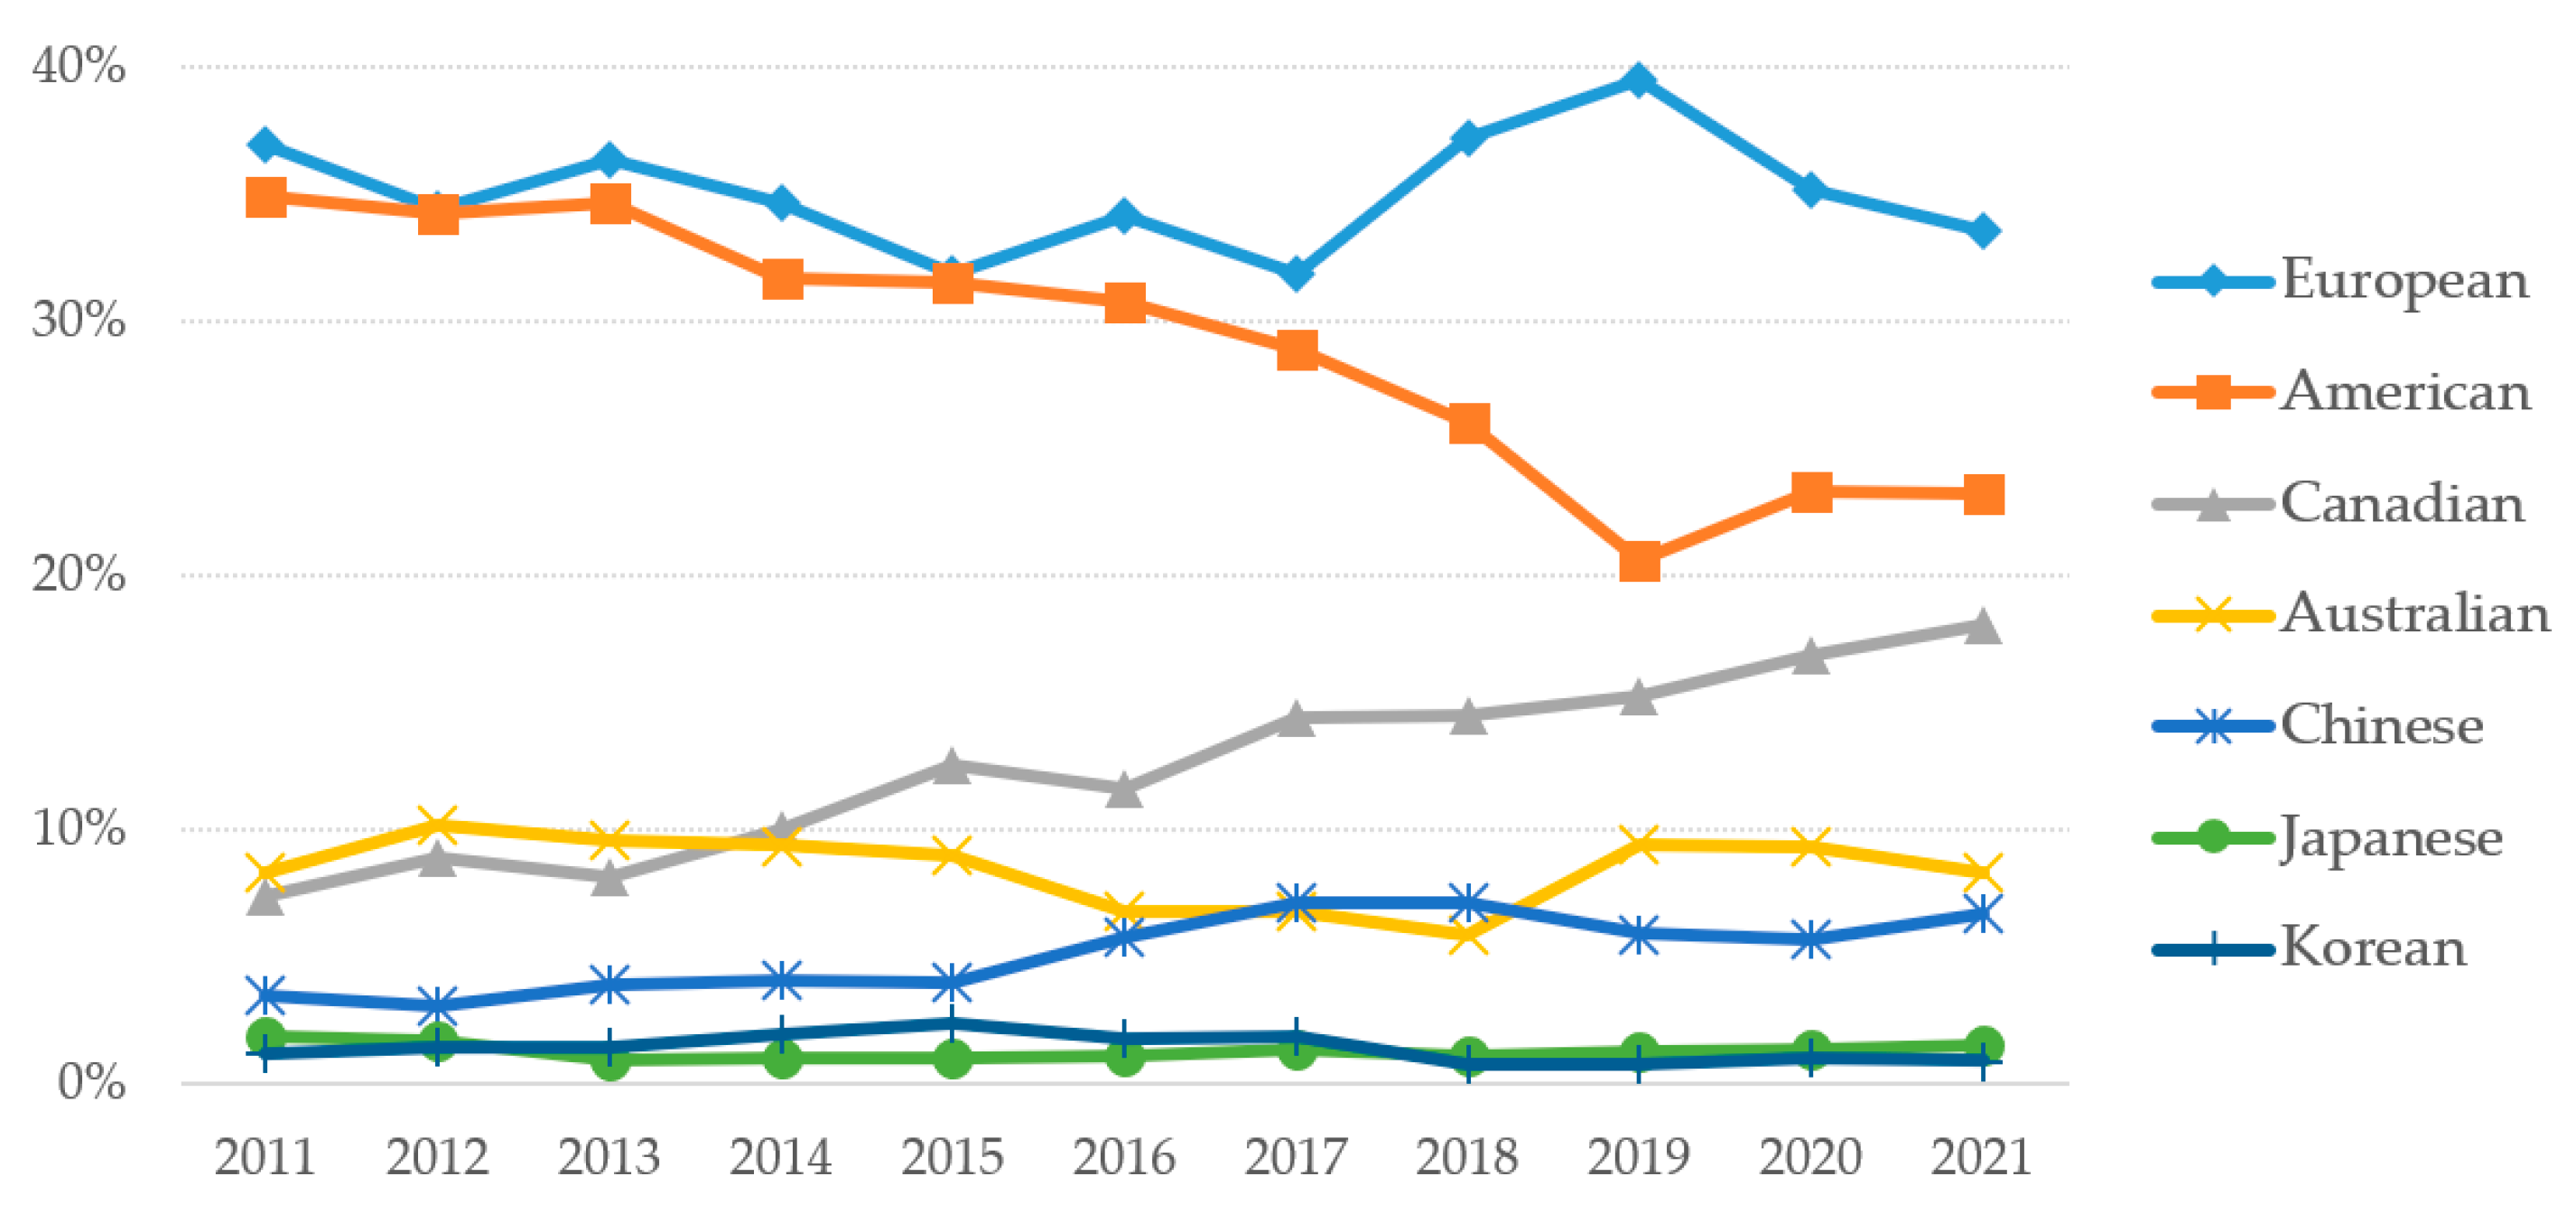
Figure 1. Recent trend of top international design revenue (ENR [8,12,13,14,15,16,17,18,19,20,21,22]).
Sustainability 15 13836 g001
Figure 2. Share of TIDFs’ revenue by region (ENR [8,12−22]).
Sustainability 15 13836 g002
Figure 3. Share of TIDFs’ revenue by firm nationality (ENR [8,12−22]).
Sustainability 15 13836 g003
Figure 4. Research process and description.
Sustainability 15 13836 g004
Figure 5. Concentration ratios of TIDFs.
Sustainability 15 13836 g005
Figure 6. Market share changes of American design firms in 2011 and 2021.
Sustainability 15 13836 g006
Figure 7. Market share changes of Chinese design firms in 2011 and 2021.
Sustainability 15 13836 g007
Table 1. Concentration ratios by firm nationality.
YearUSCanadaUKThe NetherlandsAustraliaChinaSpain
20110.47380.89170.76390.97460.85250.47220.8500
20120.46700.83840.80690.97850.90390.43810.7855
20130.49320.87830.84540.97110.88870.47900.7843
20140.53900.90040.84181.00000.88840.54390.8473
20150.44650.90881.00001.00000.92400.53390.8736
20160.49301.00001.00000.99380.91730.62400.8859
20170.59400.96981.00001.00000.90300.63210.8626
20180.63920.99581.00001.00000.95930.65660.7984
20190.56610.99550.94581.00000.93500.71950.8693
20200.65851.00001.00001.00000.92460.72490.8742
20210.68081.00001.00000.99390.99790.78580.8428
Mean0.55010.94350.92760.99200.91770.60090.8431
Std. dev.0.07920.05780.08910.01090.03680.11030.0352
YearFranceDenmarkSwedenUnited Arab EmiratesEgyptRepublic of KoreaItalyJapan
20110.88621.00001.00001.00000.99230.94340.89300.8504
20120.93161.00001.00001.00000.99170.85090.83170.8733
20130.88191.00001.00001.00001.00000.84460.89450.7179
20140.91761.00001.00001.00000.99520.87390.98180.7308
20150.91781.00001.00001.00000.99050.89640.95750.7353
20160.90331.00001.00000.99580.91990.85300.90220.7407
20170.92461.00001.00001.00000.90300.83420.90610.7321
20180.95571.00001.00001.00000.78820.76710.87920.8158
20190.94841.00001.00001.00000.86190.78870.83510.8555
20200.90731.00001.00001.00000.86020.79330.86570.8342
20210.90521.00001.00001.00000.81010.78760.81490.8389
Mean0.91631.00001.00000.99960.91940.83940.88740.7932
Std. dev.0.02210.00000.00000.00120.07630.05070.04870.0582
Table 2. Change in revenue rankings among TIDFs.
Year2021
Rank1–1011–2021–4041–6061–8081–100>100Others
20111–1061000003
11–2003010006
21–40133101011
41–60016001111
61–8000247016
81–10000233039
>1000103783051
Others317831090-
Table 3. Market mobility indices by firm nationality.
IndicesUSCanadaUKThe NetherlandsAustraliaChinaSpain
EN0.12680.44210.49930.00610.04990.50240.0875
EX0.41670.26120.69190.12970.29050.55320.7592
CNGN0.34940.05440.19270.35120.24060.28560.6717
CNLS0.05940.23530.00000.22750.00000.23480.0000
TURNE0.27180.35170.59560.06790.17020.52780.4234
TURNC0.20440.14480.09630.28930.12030.26020.3359
TURN0.47620.49650.69190.35720.29050.78800.7592
IndicesFranceDenmarkSwedenUnited Arab EmiratesEgyptRepublic of KoreaItalyJapan
EN0.07760.00000.00000.97450.43010.51190.56260.1391
EX0.53370.00000.00000.49910.94640.41950.59160.1556
CNGN0.45610.08430.04550.00000.51630.30520.03230.4872
CNLS0.00000.08430.04550.47540.00000.39750.00330.4706
TURNE0.30570.00000.00000.73680.68830.46570.57710.1474
TURNC0.22810.08430.04550.23770.25810.35130.01780.4789
TURN0.53370.08430.04550.97450.94640.81700.59490.6262
Table 4. CORSH and REGSH statistics by firm nationality.
Firm NationalityNo. of Continuing FirmsCORSHREGSH
USA350.90781.4077
Canada30.58590.4658
UK2−1.0000−2.5487
The Netherlands40.63740.8314
Australia30.99111.0817
China100.02110.0543
Spain60.64342.5112
France50.98261.6071
Denmark21.00001.6399
Sweden21.00000.6822
United Arab Emirates1n/an/a
Egypt30.858714.3158
Republic of Korea4−0.5770−0.3946
Italy21.00001.0967
Japan5−0.2081−0.1457
Table 5. Summary of analysis results for 15 countries.
Firm NationalityMarket ConcentrationMarket MobilityMarket Instability
CanadaHighModerateUnstable
UKHighHighUnstable
The NetherlandsHighModerateUnstable
AustraliaHighModerateStable
SpainHighHighUnstable
FranceHighHighStable
DenmarkHighModerateStable
SwedenHighModerateUnstable
United Arab EmiratesHighHighn/a
EgyptHighHighStable
Republic of KoreaHighHighUnstable
ItalyHighHighStable
JapanHighHighUnstable
USAModerateModerateStable
ChinaModerateHighUnstable
Table 6. Correlation relationships ( ρ ) among the three indices.
Market IndexConcentration (ρ)Mobility (ρ)Instability (ρ)
Concentration
Mobility−0.080 (0.777)
Instability0.059 (0.841)0.125 (0.670)
Table 7. Country classification based on the analysis results.
CategoryFirm Nationality (No. of Continuing Firms/TIDFs)
High-static and high-dynamicCanada (3/13), UK (2/13), The Netherlands (4/7), Spain (6/13), Sweden (2/2),
United Arab Emirates (1/7), Republic of Korea (4/18), and Japan (5/15)
High-static and low-dynamicAustralia (3/12), France (5/10), Denmark (2/2), Egypt (3/12), and Italy (2/24)
Low-static and high-dynamicChina (10/47)
Low-static and low-dynamicUSA (35/160)
Disclaimer/Publisher’s Note: The statements, opinions and data contained in all publications are solely those of the individual author(s) and contributor(s) and not of MDPI and/or the editor(s). MDPI and/or the editor(s) disclaim responsibility for any injury to people or property resulting from any ideas, methods, instructions or products referred to in the content.

