Article

Land-Use Assessment and Trend Simulation from a Resilient Urban Perspective: A Case Study of Changsha City

1
School of Architecture and Planning, Hunan University, Changsha 410082, China
2
Hunan Architectural Design Institute Group Co., Ltd., Changsha 410012, China
*
Author to whom correspondence should be addressed.
Sustainability 2023, 15(18), 13890; https://doi.org/10.3390/su151813890
Submission received: 29 June 2023 / Revised: 30 August 2023 / Accepted: 11 September 2023 / Published: 19 September 2023

Abstract

:
As the challenges of globalization and climate change intensify, the importance of urban resilience in city planning is becoming increasingly evident. To adapt to this trend, innovations and improvements are essential in traditional urban land-use patterns to better fulfill the requirements of resilient urban development. In this context, this study constructs an urban resilience evaluation index system from four perspectives: social resilience, engineering resilience, ecological resilience, and security resilience to evaluate the urban resilience of Changsha City. A thorough assessment of the resilience mechanisms in Changsha’s urban layout was conducted, employing the SD-FLUS model. A resilient urban scenario is also established to restrict the conversion of high-resilience land into other land types and to predict urban land-use structures under a resilience-oriented directive. The findings indicate that areas with high ecological and safety resilience in Changsha are primarily located in the western Weishan mountain system, along with eastern mountain systems like Jiuling, Lianyun, and Mufu, forming the “green veins”. The central areas are characterized by “blue veins”, mainly represented by rivers such as the Xiangjiang, Weishui, Longwanggang, Jinjiang, Liuyang, and Laodao. Within the central urban area, high-resilience regions are primarily distributed along a framework consisting of “one ring (the city’s three-ring line), two mains (Xiangjiang and Liuyang rivers), one heart (urban green core), and six wedges”, specifying various green corridors. Under the resilience-oriented scenario, the model predicts that by 2025, the total built-up area in Changsha will be 1416.79 km². Areas with high social and engineering resilience are mainly concentrated in the central urban areas of Changsha, as well as Ningxiang and Liuyang, aligning closely with the objectives of Changsha’s latest round of national spatial planning. The built-up area layout should complement Changsha’s topography and water systems, expanding in a wedge-like manner. Overall, Changsha’s planning has successfully integrated social, engineering, ecological, and safety resilience, enhancing its adaptability and long-term sustainability. This research proposes a land-use simulation method guided by the concept of urban resilience, providing valuable insights for resilience-oriented city planning in Changsha and other cities facing similar challenges.

1. Introduction

As global climate change and socio-economic pressures intensify, cities face unprecedented challenges. The question of how to enhance a city’s adaptability and resilience has emerged as a key topic of research and practical implementation. Urban resilience, defined as a city’s ability to maintain its core functions, swiftly recover, and adapt to new environmental conditions in the face of various external pressures and internal risks, has gradually become a cornerstone concept in urban planning and construction [1,2].
In this context, forecasting and simulating the scale of urban construction land involves not just optimizing the allocation of urban land resources but is also intrinsically tied to urban resilience. The land-use patterns of a city directly influence its ability to respond to natural disasters or economic crises. Previous studies mostly focused on traditional methods of predicting and simulating land-use scale, such as Chen Guojian’s application of the grey system model to predict the scale of construction land in Chongqing [3] and Li Aimin’s use of remote sensing technology to forecast land use in Zhengzhou [4]. International scholars have also contributed, with Galster and Hanson utilizing the robust spatial analysis capabilities of GIS to simulate patterns and scales of urban expansion [5,6,7]. Ewing et al. used principal component analysis to calculate urban sprawl indices [8], while Hasse and colleagues analyzed urban expansion characteristics of 566 towns in New Jersey from a land resource effectiveness perspective [9]. To better capture the complexity of urban systems, researchers have begun shifting towards more holistic models. The System Dynamics (SDs) model focuses on the relationships between structure, function, and dynamic behavior in complex systems [10,11,12,13,14,15,16,17,18], while the Cellular Automaton (CA) model emphasizes the spatiotemporal evolution of geographic information [19,20,21]. Within CA model research, Liu Xiaoping and others introduced the FLUS model based on the CA model. This model employs an adaptive inertia competition mechanism based on the roulette wheel selection method, significantly improving the accuracy of land-use change simulation [22,23,24,25,26]. However, there has been limited in-depth research and consideration regarding urban resilience among scholars, resulting in a disconnect between their predictions and the actual city development with its resilience goals.
Furthermore, assessing the resilience of complex urban systems accurately and enhancing resistance and adaptability has been a focus of extensive research, particularly from a perspective of urban safety. Internationally, scholars have mainly centered on defining, evaluating, and understanding the driving factors behind urban resilience. For instance, Godschalk delved deeply into the concept of urban resilience and proposed new recovery plans [27]. Cutter et al. approached resilience from a natural disaster viewpoint, developing a comprehensive evaluation system to assess community disaster resistance [28]. Parizi and others zeroed in on the physical aspects of urban resilience, conducting in-depth research on its driving factors. In China, although urban resilience research started relatively late, significant outcomes have been achieved. Scholars have not only explored how cities can address natural disasters [29,30] and climate change [31,32] but have also ventured into comprehensive evaluations of urban resilience. For example, Shao Yiwen, Zhou Limin, and Sun Yang have constructed a comprehensive evaluation index system of urban resilience, which provides valuable theoretical and empirical support for urban resilience research in China, providing valuable theoretical and empirical support for urban resilience research in the country.

2. Research Methodology

This research is mainly composed of three parts: (1) construction of an urban resilience evaluation system; (2) land-use quantity prediction module based on the SD model; (3) and land-use spatial simulation module based on the FLUS model. The technical route is shown in Figure 1:

2.1. Construction of an Urban Resilience Evaluation System

2.1.1. Selection of Resilience Indicators

At this stage, the purpose of urban resilience evaluation is different, and the selection of resilience evaluation indexes is also different, generally adopting the main elements of the city such as social, economic, housing, and infrastructure, environment, disaster susceptibility, institutional organization and so on as the main elements [33,34,35]. This paper draws on existing research results to construct the urban green and safety resilience indicator system based on the concept of green and safe city construction, taking into account the principles of localization and data accessibility, and selecting the four resilience perspectives of social, engineering, ecological and district-wide systems, and 19 tertiary indicators, and Table 1 shows the selected indicators and the meaning of the indicators.

2.1.2. Determination of Indicator Weights

To avoid the arbitrariness of subjective weighting, this paper uses the entropy method [36]. The steps are as follows:
The first step is raw data preprocessing.
The raw data were standardized, where the positive indicators were processed:
y i j = X i j X i j m i n X i j m a x X i j m i n
Negative indicators are treated as:
y i j = X i j m a x X i j X i j m a x X i j m i n
where yij denotes normalized indicator data.
Normalization is performed:
P i j = y i j / i = 1 n y i j
where Pij denotes the normalized value of the j indicator for the i evaluation object.

2.2. System Dynamics (SDs) Model

System dynamics (SDs), founded by Professor Forrester, is a science that studies the modeling, simulation, and control of complex dynamic systems [29]. It utilizes a combination of qualitative and quantitative studies, as well as system integration reasoning to address complex system issues. SD models are a type of model that studies the structure, function, and dynamic behavior of feedback systems on the basis of control theory, system theory, and information theory. Their outstanding feature is that they can reflect the interaction relationship between the structure, function, and dynamic behavior of complex systems, providing dynamic simulation experiments to examine the changing behavior and trends of complex systems under different scenarios, and providing decision support [37,38,39]. According to relevant studies, incorporating SD methods into urban land-use prediction processes can effectively analyze the coupling relationship between various factors that affect urban land use.
The specific simulation process of the system dynamics (SDs) model is as follows: (1) Firstly, construct a questionnaire system that affects the scale of urban land use. Based on the research on the factors affecting the scale of urban land use in China’s large cities by Wei Xiaolong and other scholars, the factors that affect the scale of urban land use can be divided into three categories: basic factors, driving factors, and policy factors [40,41]. Specifically, factors such as economic volume, financial ability, investment and construction, social population, social labor force, water resource capacity, and built-up area can be selected to construct a questionnaire system for urban size. (2) Then, construct the relationship between indicators based on the questionnaire system, and construct the causal loop diagram of each factor. After clarifying the internal structure of each sub-system and the causal loop diagram between the main variables, a causal loop diagram of the causal relationship between indicators is formed. (3) Based on the causal loop diagram of indicators, construct a system dynamics flowchart that reflects the interaction between factors, and simulate it using the VENSIM PLE 7.3 simulation software.

2.3. FLUS Model

The FLUS model is developed by the team of Professor Liu Xiaoping from Sun Yat-sen University, and it is an interactive future land-use simulation model based on the coupling of human activities and natural factors. The FLUS model is mainly composed of two main parts: a probability calculation module based on neural network algorithms (ANN) and a CA spatial simulation module based on adaptive inertia mechanisms [23,42]. Firstly, the FLUS model uses the artificial neural network (ANN) algorithm to obtain the suitability probability of various land-use types within the study area from multiple driving factors that include human activities and natural effects. Secondly, in the process of land change simulation, the FLUS model proposes an adaptive inertia competition mechanism based on roulette wheel selection, which can effectively deal with the uncertainty and complexity of the mutual transformation of various land-use types under the joint influence of natural effects and human activities. As a result, the FLUS model has high simulation accuracy and can achieve results similar to the actual land-use distribution.

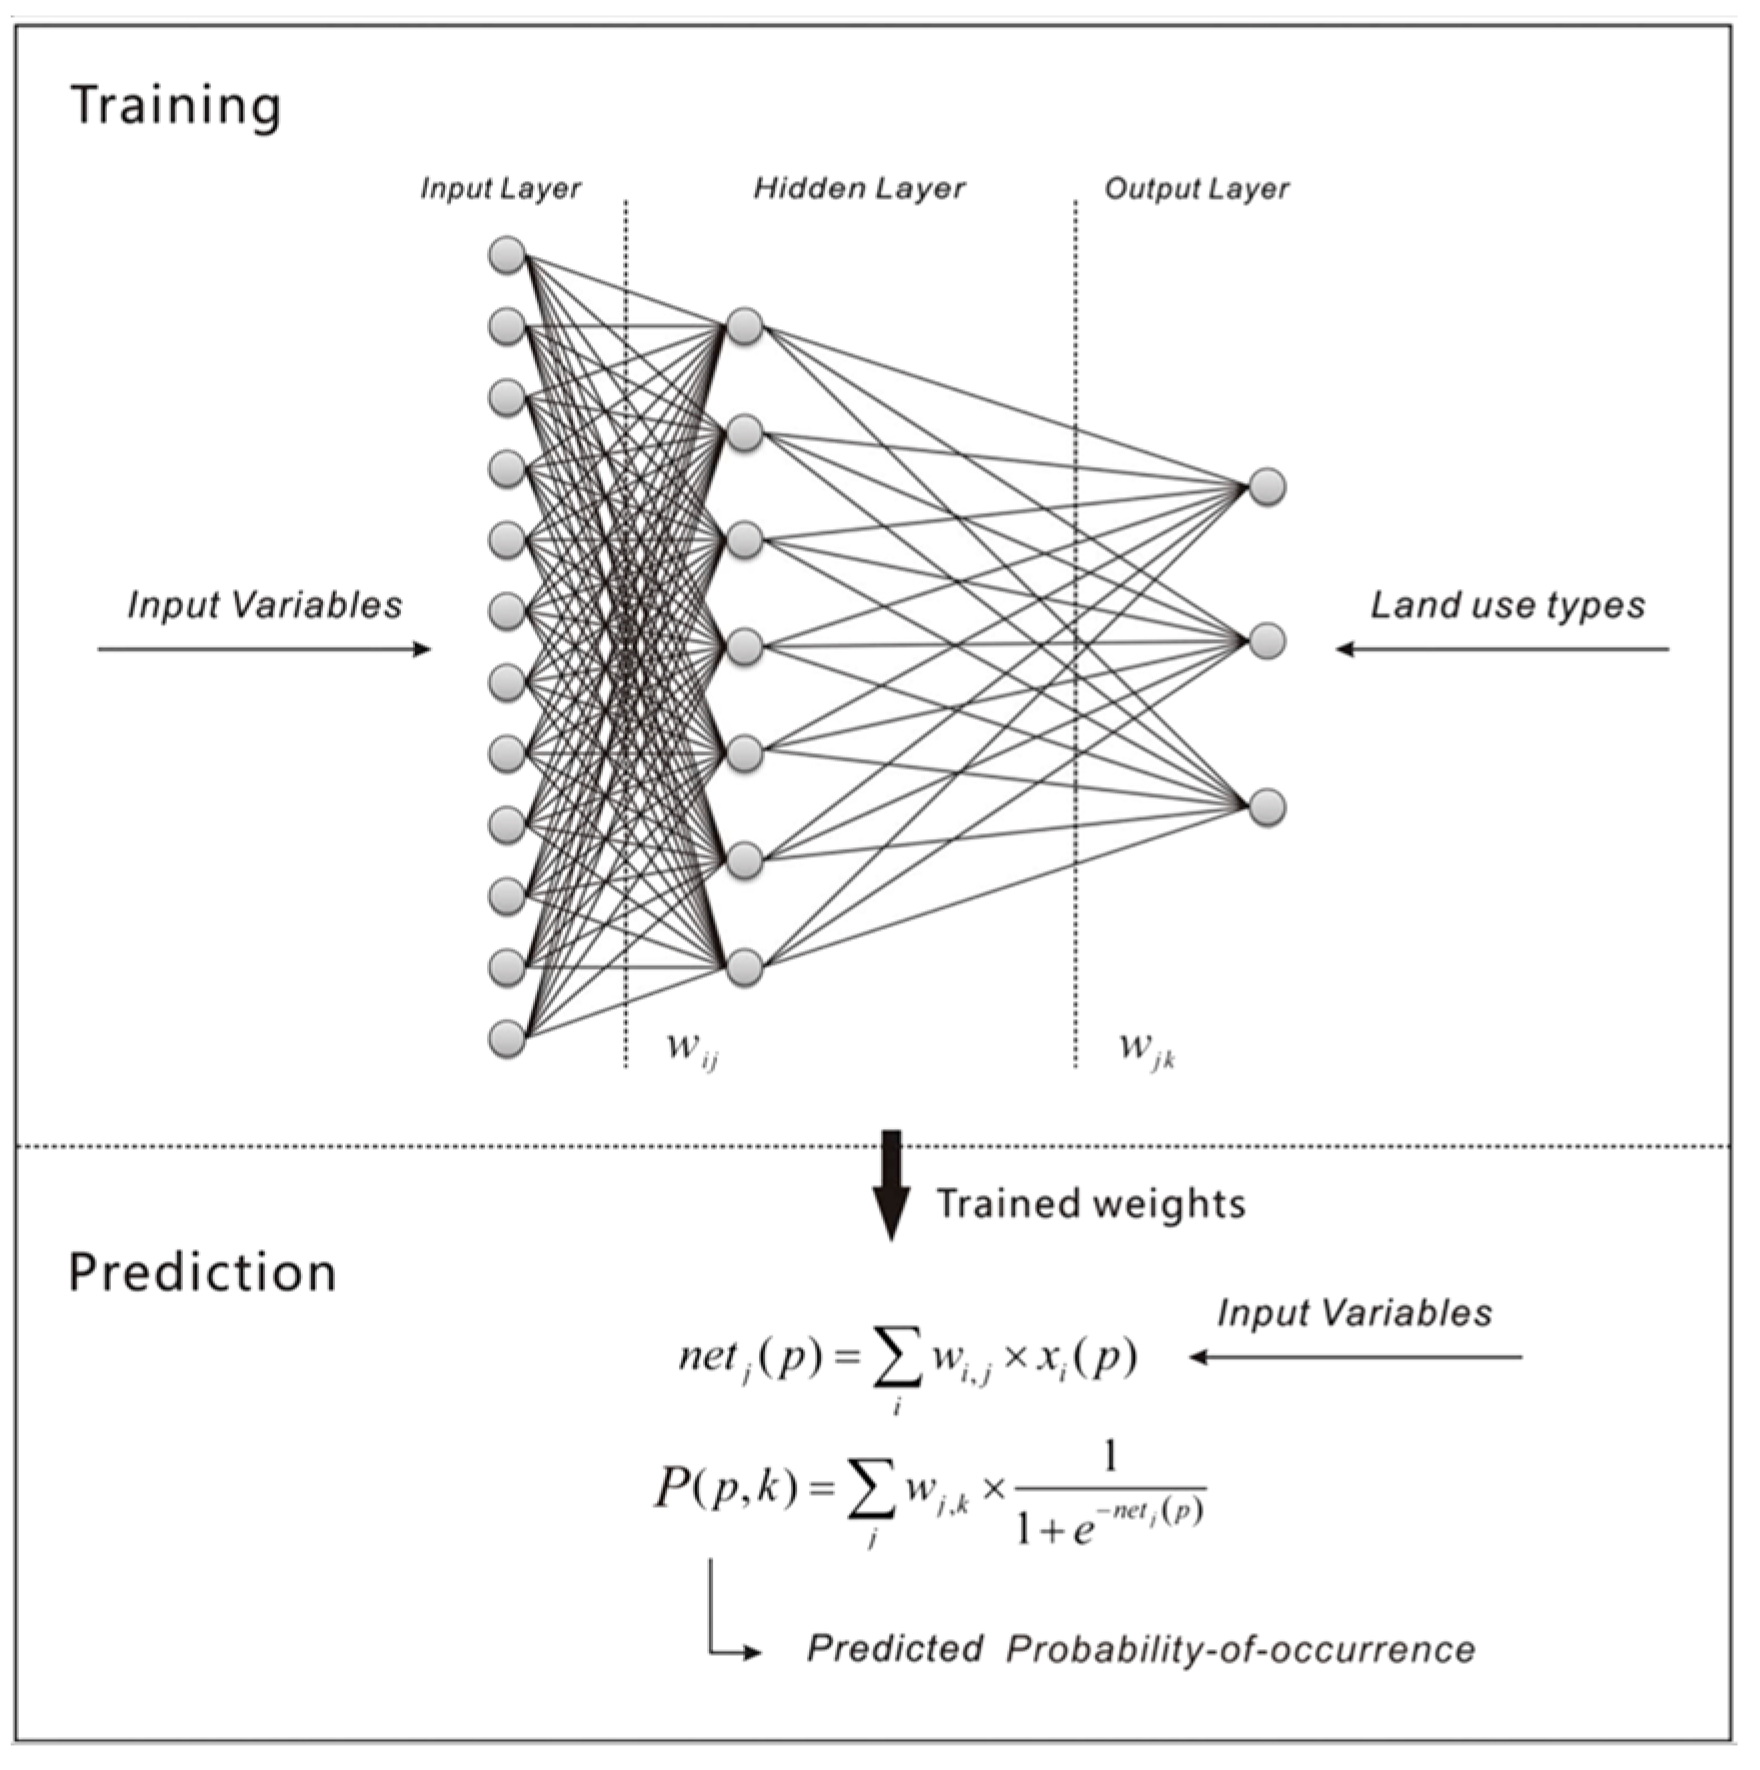
2.3.1. Probabilistic Simulation for Suitability Calculation

The suitability probability calculation simulation mainly calculates the probability of converting different land-use types. The simulation process uses a 3-layer (input layer, hidden layer, and output layer) BP neural network model. Through the random sampling of samples from various spatial driving factors and urban land-use distribution layers of multiple factors, the ANN is trained, and the probability of converting various land-use types (i.e., the suitability probability of cell expansion) is obtained. The calculation formula is as follows in Figure 2:
X = [x1, x2, ···, xn]T,
where xi represents the i-th input neuron, X represents their set, and T represents the transposed matrix.
n e t j p , t = j ω i , j × x j ( p , t )
where netj(p, t) and xj(p, t) represent the signals received by the j-th hidden layer and the i-th input layer neuron in the pixel p and training time t, respectively. The input layer and the hidden layer signal. ω(i, j) is the adaptive weight between the input layer and the hidden layer, which has been corrected during the training process. The input layer and hidden layer are connected by an activation function, the formula is as follows:
s i g m o i d n e t j p , t = 1 1 + e n e t j ( p , t )
and the formula for calculating suitability probability is:
P p , k , t = j ω j , k × s i g m o i d n e t j p , t = j ω j , k × 1 1 + e n e t j ( p , t )
where ωj,k is the weight between the hidden layer and the output layer, similar to ωj,k, and is adaptively adjusted during ANN training.

2.3.2. The Cellular Automata with Adaptive Inertia Competitive Learning

In the FLUS model, the neighborhood influence is similar to that of the traditional CA model. On cell p, the neighborhood development density of land-use type k is defined as:
Ω p , k t = N × N C O N ( C p t 1 = k ) N × N 1 × ω k ,
where ΣN×N con ( C p t 1 = k ) represents the total number of pixels of land-use type kin the N × N window after the previous iteration t − 1, where ωk is the neighborhood weight that takes into account different land-use types.
The FLUS model introduces an adaptive inertia coefficient during the training process to adjust the current land-use quantity and make the simulated land-use development refer to actual demand. The core idea is that if the development trend of a specific land-use type is in conflict with macro demand, the inertia coefficient will dynamically increase the demand for that land-use type in order to correct the land-use trajectory in the next iteration. The inertia coefficient is defined as:
I n e r t i a I n e r t i a k t 1                                 i f       D k t 1 D k t 2 I n e r t i a k t 1 × D k t 2 D k t 1           i f           0 > D k t 2 > D k t 1 I n e r t i a k t 1 × D k t 1 D k t 2           i f           D k t 1 > D k t 2 > 0
where Inertia represents the inertial coefficient of land type kat iteration time t. Dk (k − 1) represents the difference between the actual demand and allocation of land type k at time t − 1. Based on the calculation conditions of the formula, by iteratively adjusting the inertial coefficients of all land types in CA, a mechanism of mutual competition among different land allocation types is formed, until all land allocations match the land demand.
The overall conversion probability of land use for each cell can be obtained by combining the suitability probability of the above cells, neighborhood influence factors, and adaptive inertia coefficients. The formula is:
T P p , k t   =   P p , k t   ×   Ω p , k t   ×   I n e r t i a p , k t   ×   ( 1     s c c k ) ,
where TP(p, k)t represents the total probability of cell p converting to land-use type k after t iterations, P(p, k)t is the suitability probability, Ω (p, k)t is the neighborhood influence, Inertia is the adaptive inertia coefficient, and s c c k is the cost of converting land-use type c to type k (value between 0 and 1).
After obtaining the total transformation probability of cells, the FLUS model uses a roulette competition mechanism to determine whether the land-use type transformation occurs in urban units. Then, the simulation iteration process is controlled based on the predicted future urban development scale of the quantity model, so as to realize the coupling between the quantity model and the CA model, and finally obtain the simulated land-use changes.

3. Overview of the Study Area and Data Sources

3.1. Overview of Changsha City

Changsha City is located in the central region of China, downstream of the Xiangjiang River, on the western edge of the Changliu Basin, and to the north of the eastern part of Hunan Province, between longitudes 111°53′ and 114°15′ east, and latitudes 27°51′ and 28°41′ north. It is the capital city of Hunan Province, a comprehensive supporting reform pilot zone for the national “Two-Type Society”, an important grain production base in China, a key node city in the middle reaches of the Yangtze River urban agglomeration, and an important central city in the Yangtze River Economic Belt in the central region of the Yangtze River. As of the end of 2020, the city has jurisdiction over 6 districts and 1 county, managing 2 county-level cities, with a total area of 11,819 square kilometers and a construction land area of 1143.25 km2, and a total resident population of 10.2393 million. In 2021, Changsha achieved a regional GDP of CNY 1.21 trillion. In recent years, the economic development of Changsha City has been relatively fast, and it has become an important political and economic development center in Hunan Province. Under the guidance of the “Strong Provincial Capital” policy in Hunan Province in the new era, the expansion of urban land in Changsha City and the integration and conflict between basic farmland and ecological red line have become increasingly prominent. In recent years, Changsha has seen a relatively fast economic development and high intensity of urban development, making it an important political and economic development center in Hunan Province. With the guidance of the policy to build a strong provincial capital in the new era, the conflict between the expansion of urban land use and the integration and protection of basic farmland and ecological redlines in Changsha has become increasingly prominent.

3.2. Data

The study takes Changsha city in Hunan province as its research object. The research data mainly includes land-use data, distance accessibility data, natural environmental data, and socio-economic data. Among these, the land-use data are sourced from the Third National Land Survey Database for the years 2015 and 2020, and it is classified according to the “Land Use and Land Cover Classification System of the Chinese Academy of Sciences” into cultivated land, forest land, grassland, water area, construction land, and unused land. Distances from rivers, rural settlements, the city center, railways, expressways, provincial roads, national roads, and county roads were extracted by using the Euclidean distance function of ArcGIS. Topographic data such as slope and aspect were extracted from this DEM.
Temperature, precipitation, population density, GDP, and other data are sourced from the “Hunan Statistical Yearbook” and “Changsha Statistical Yearbook” for the years 2015 and 2020, as well as the “Changsha Water Resources Bulletin”. Finally, all the data are based on the land-use data, unified into raster data with a grid cell size of 30 m × 30 m in the same projection coordinate system, and the same number of rows and columns.

4. Results and Analysis

From the perspective of urban resilience, this paper carries out a simulation study of urban construction land based on the SD+FULS model, and takes Changsha City as an example for demonstration. Firstly, a set of evaluation index system for urban resilience is constructed, and the urban resilience of Changsha City is assessed. The SD model was used to predict the total amount of construction land in Changsha City in 2025. Then, the simulated data in 2020 were compared with the actual data using the FULS model to verify the accuracy of the model. On this basis, the land-use layout and construction land scale of Changsha in 2025 were simulated by restricting the land conversion of highly resilient cities.

4.1. Results of the Urban Resilience Evaluation

In the evaluation results of urban resilience, to fully accommodate the social, engineering, ecological, and safety resilience of urban development, areas within the territorial scope of Changsha with higher ecological and safety resilience are primarily characterized by the “green veins” of the Weishan mountain range in the west and the Jiuling, Lianyun, and Mufu mountain ranges in the east. The central parts, featuring the Xiangjiang River, Wei River, Longwang Port, Jin River, Liuyang River, and Laodao River, are considered the “blue veins.” Within the central urban area, the layout is predominantly guided by “One Ring (the city’s third ring road), Two Mains (Xiangjiang River and Liuyang River), One Heart (Chang-Zhu-Tan urban green core), and Six Wedges (Gu Mountain-Wushan corridor, Yuelu Mountain-Lotus Mountain corridor, Dawang Mountain-Jin River corridor, Green Core-Liuyang River corridor, Sutuo Embankment-Laodao River corridor, and Heimu Peak-Sand River corridor)”. Areas with higher social and engineering resilience are mainly concentrated around the “Main” (central urban area of Changsha) and the “Two Cores” (central urban areas of Ningxiang City and Liuyang City).
In an integrated perspective, to effectively adapt to the requirements of resilient urban development, the construction land layout of Changsha should complement the city’s natural mountain and water patterns, expanding in a wedge-like manner.

4.2. Construction Land Scale Prediction Based on the SD Model

4.2.1. System Dynamics Model Testing and Correction

The historical validation of the built-up area simulation model of Changsha City was conducted using the VENSIM PLE software. The research selected 2010 as the initial year of the study, and compared the simulated data from 2011 to 2020 with the historical data of Changsha City. The relative error was used to determine whether the model was feasible. Based on relevant studies, indicators such as economic, population, and land supply have the greatest impact on city development. Therefore, the GDP, total population, and built-up area of Changsha City were selected as key variables for this validation. The results showed that the accuracy of the prediction of the total population and built-up area of Changsha City from 2011 to 2020 was higher than 90%, and the accuracy of the GDP prediction increased year by year to reach 98.9%. The average accuracy was over 83%. The calculation formula for accuracy is as follows:
a c c u r a c y = 1 e r r o r = 1 p r e d i c t e d a c t u a l a c t u a l
Overall, the simulation results show a small error compared with the actual values, and the model had good simulation capabilities. It can be used for predicting the urban size of Changsha City from 2021 to 2025. The model’s testing results are shown in Table 2.

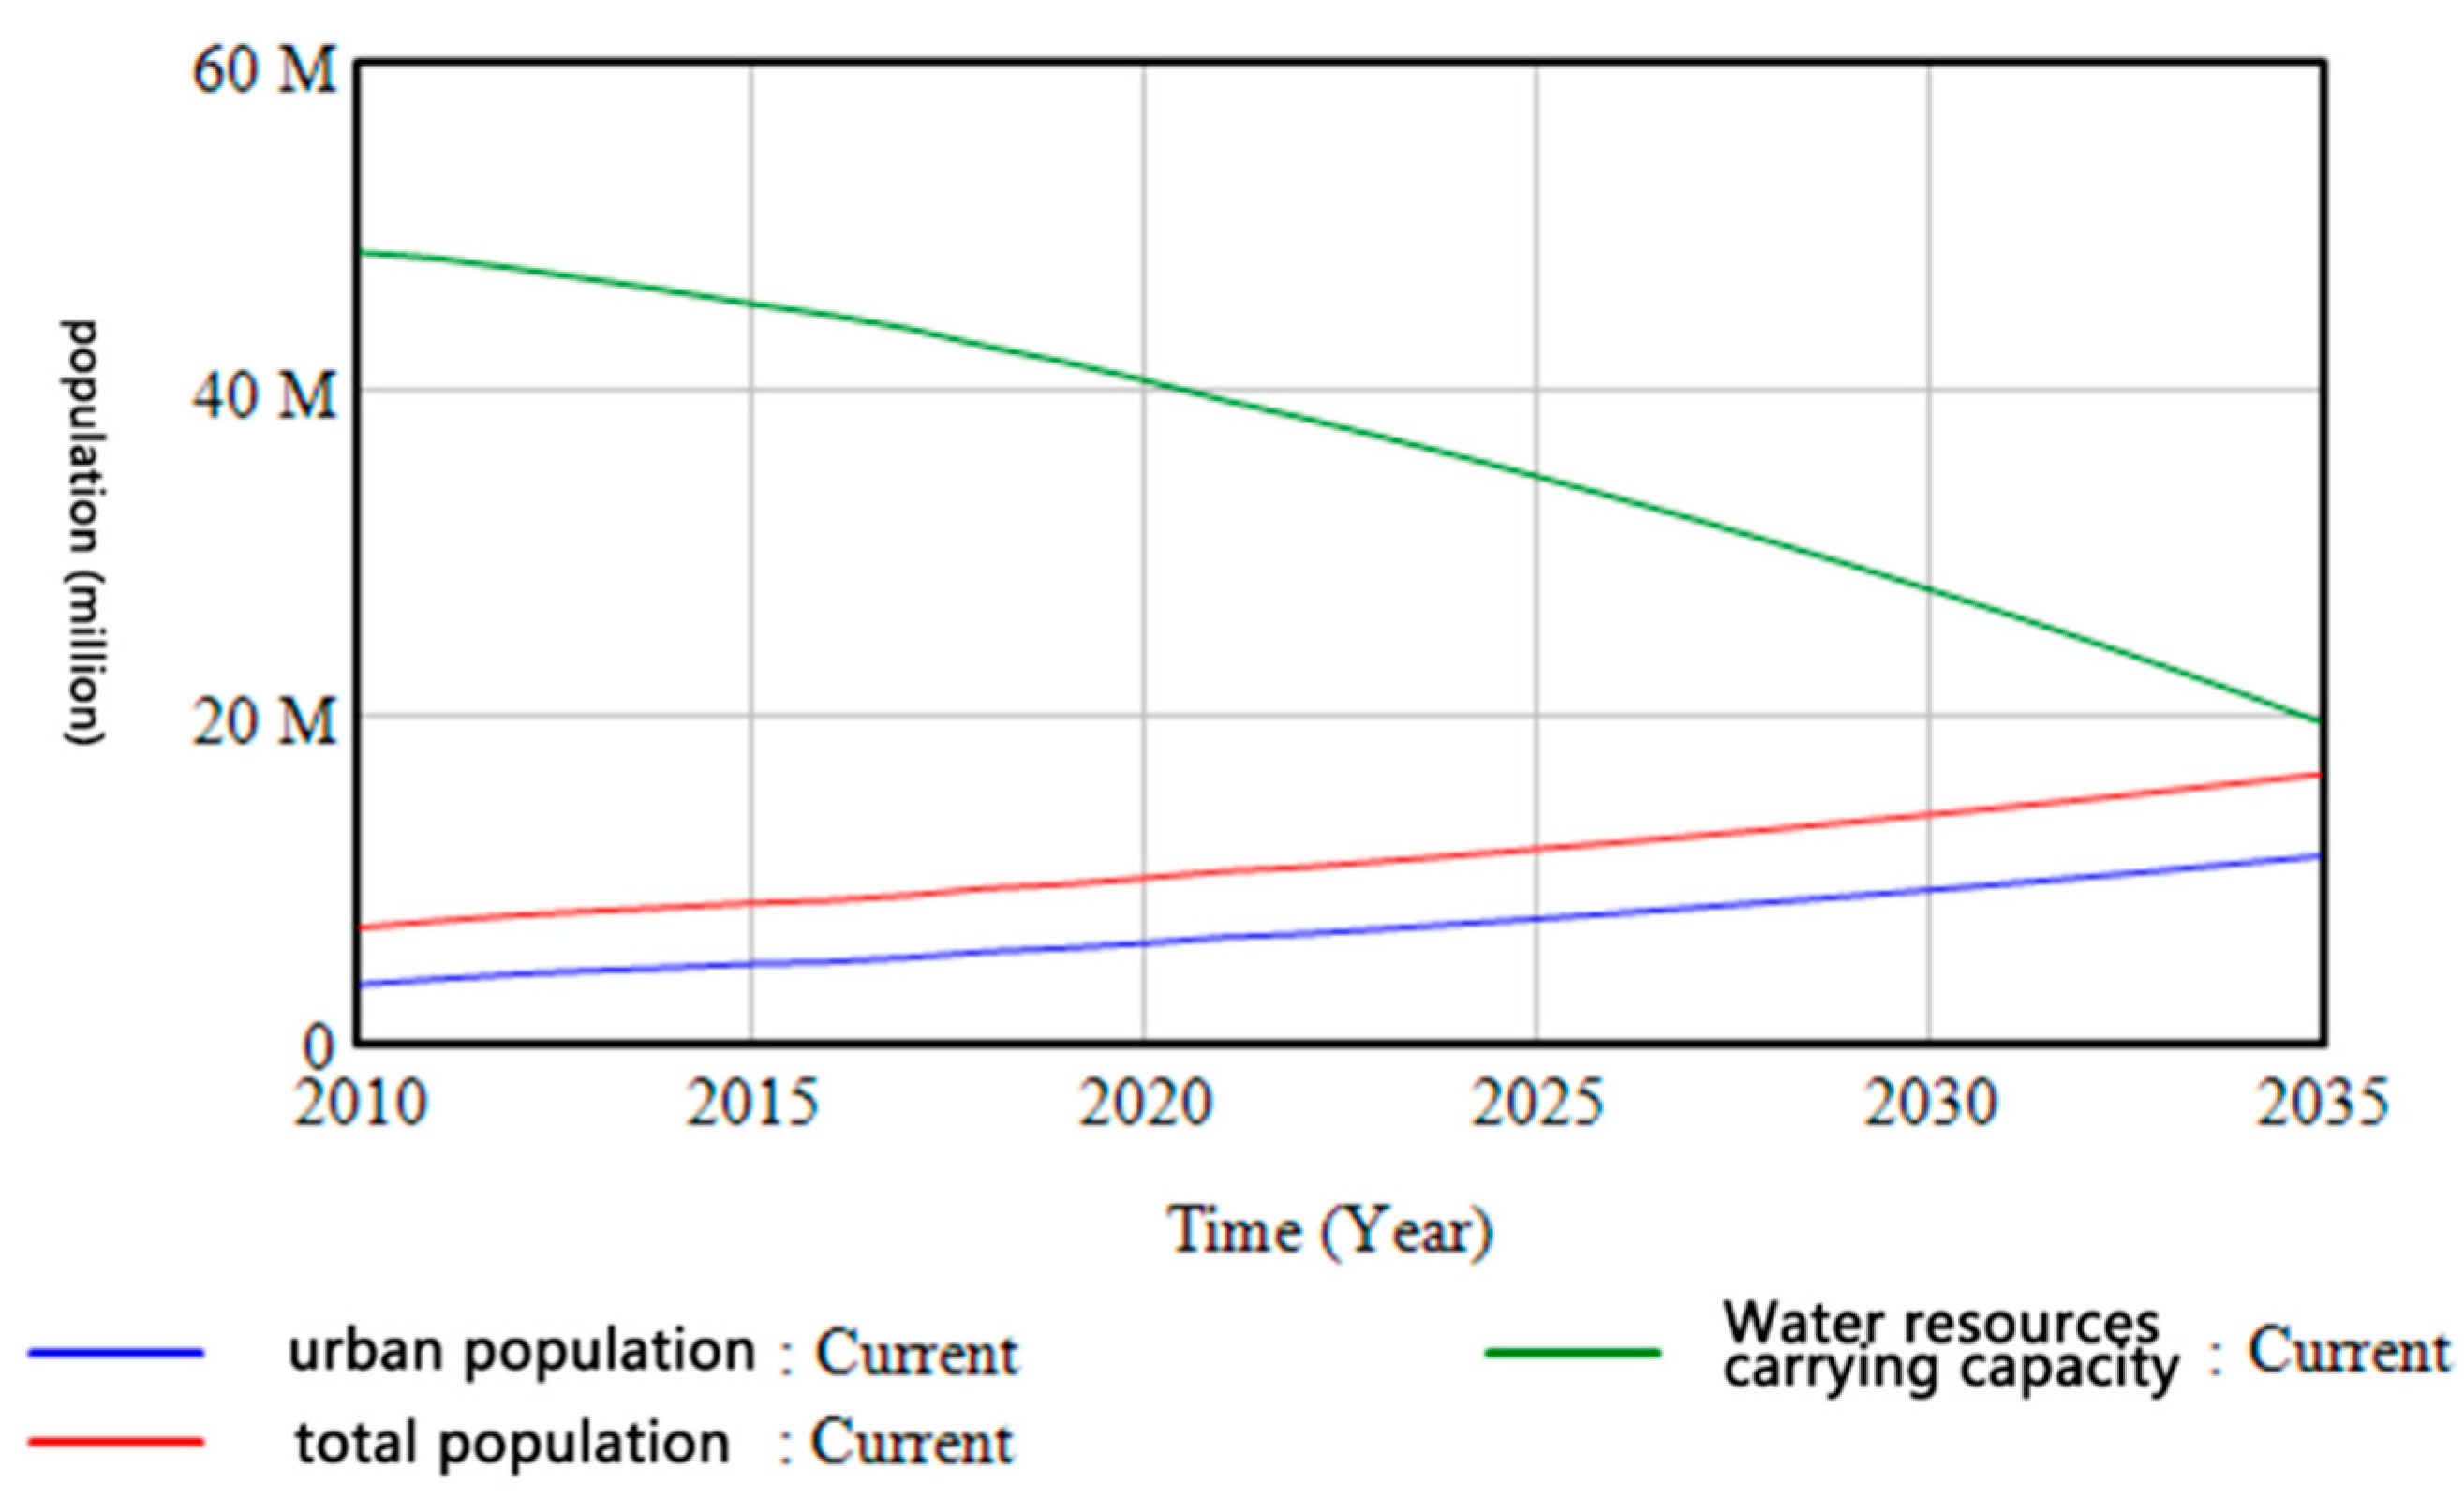
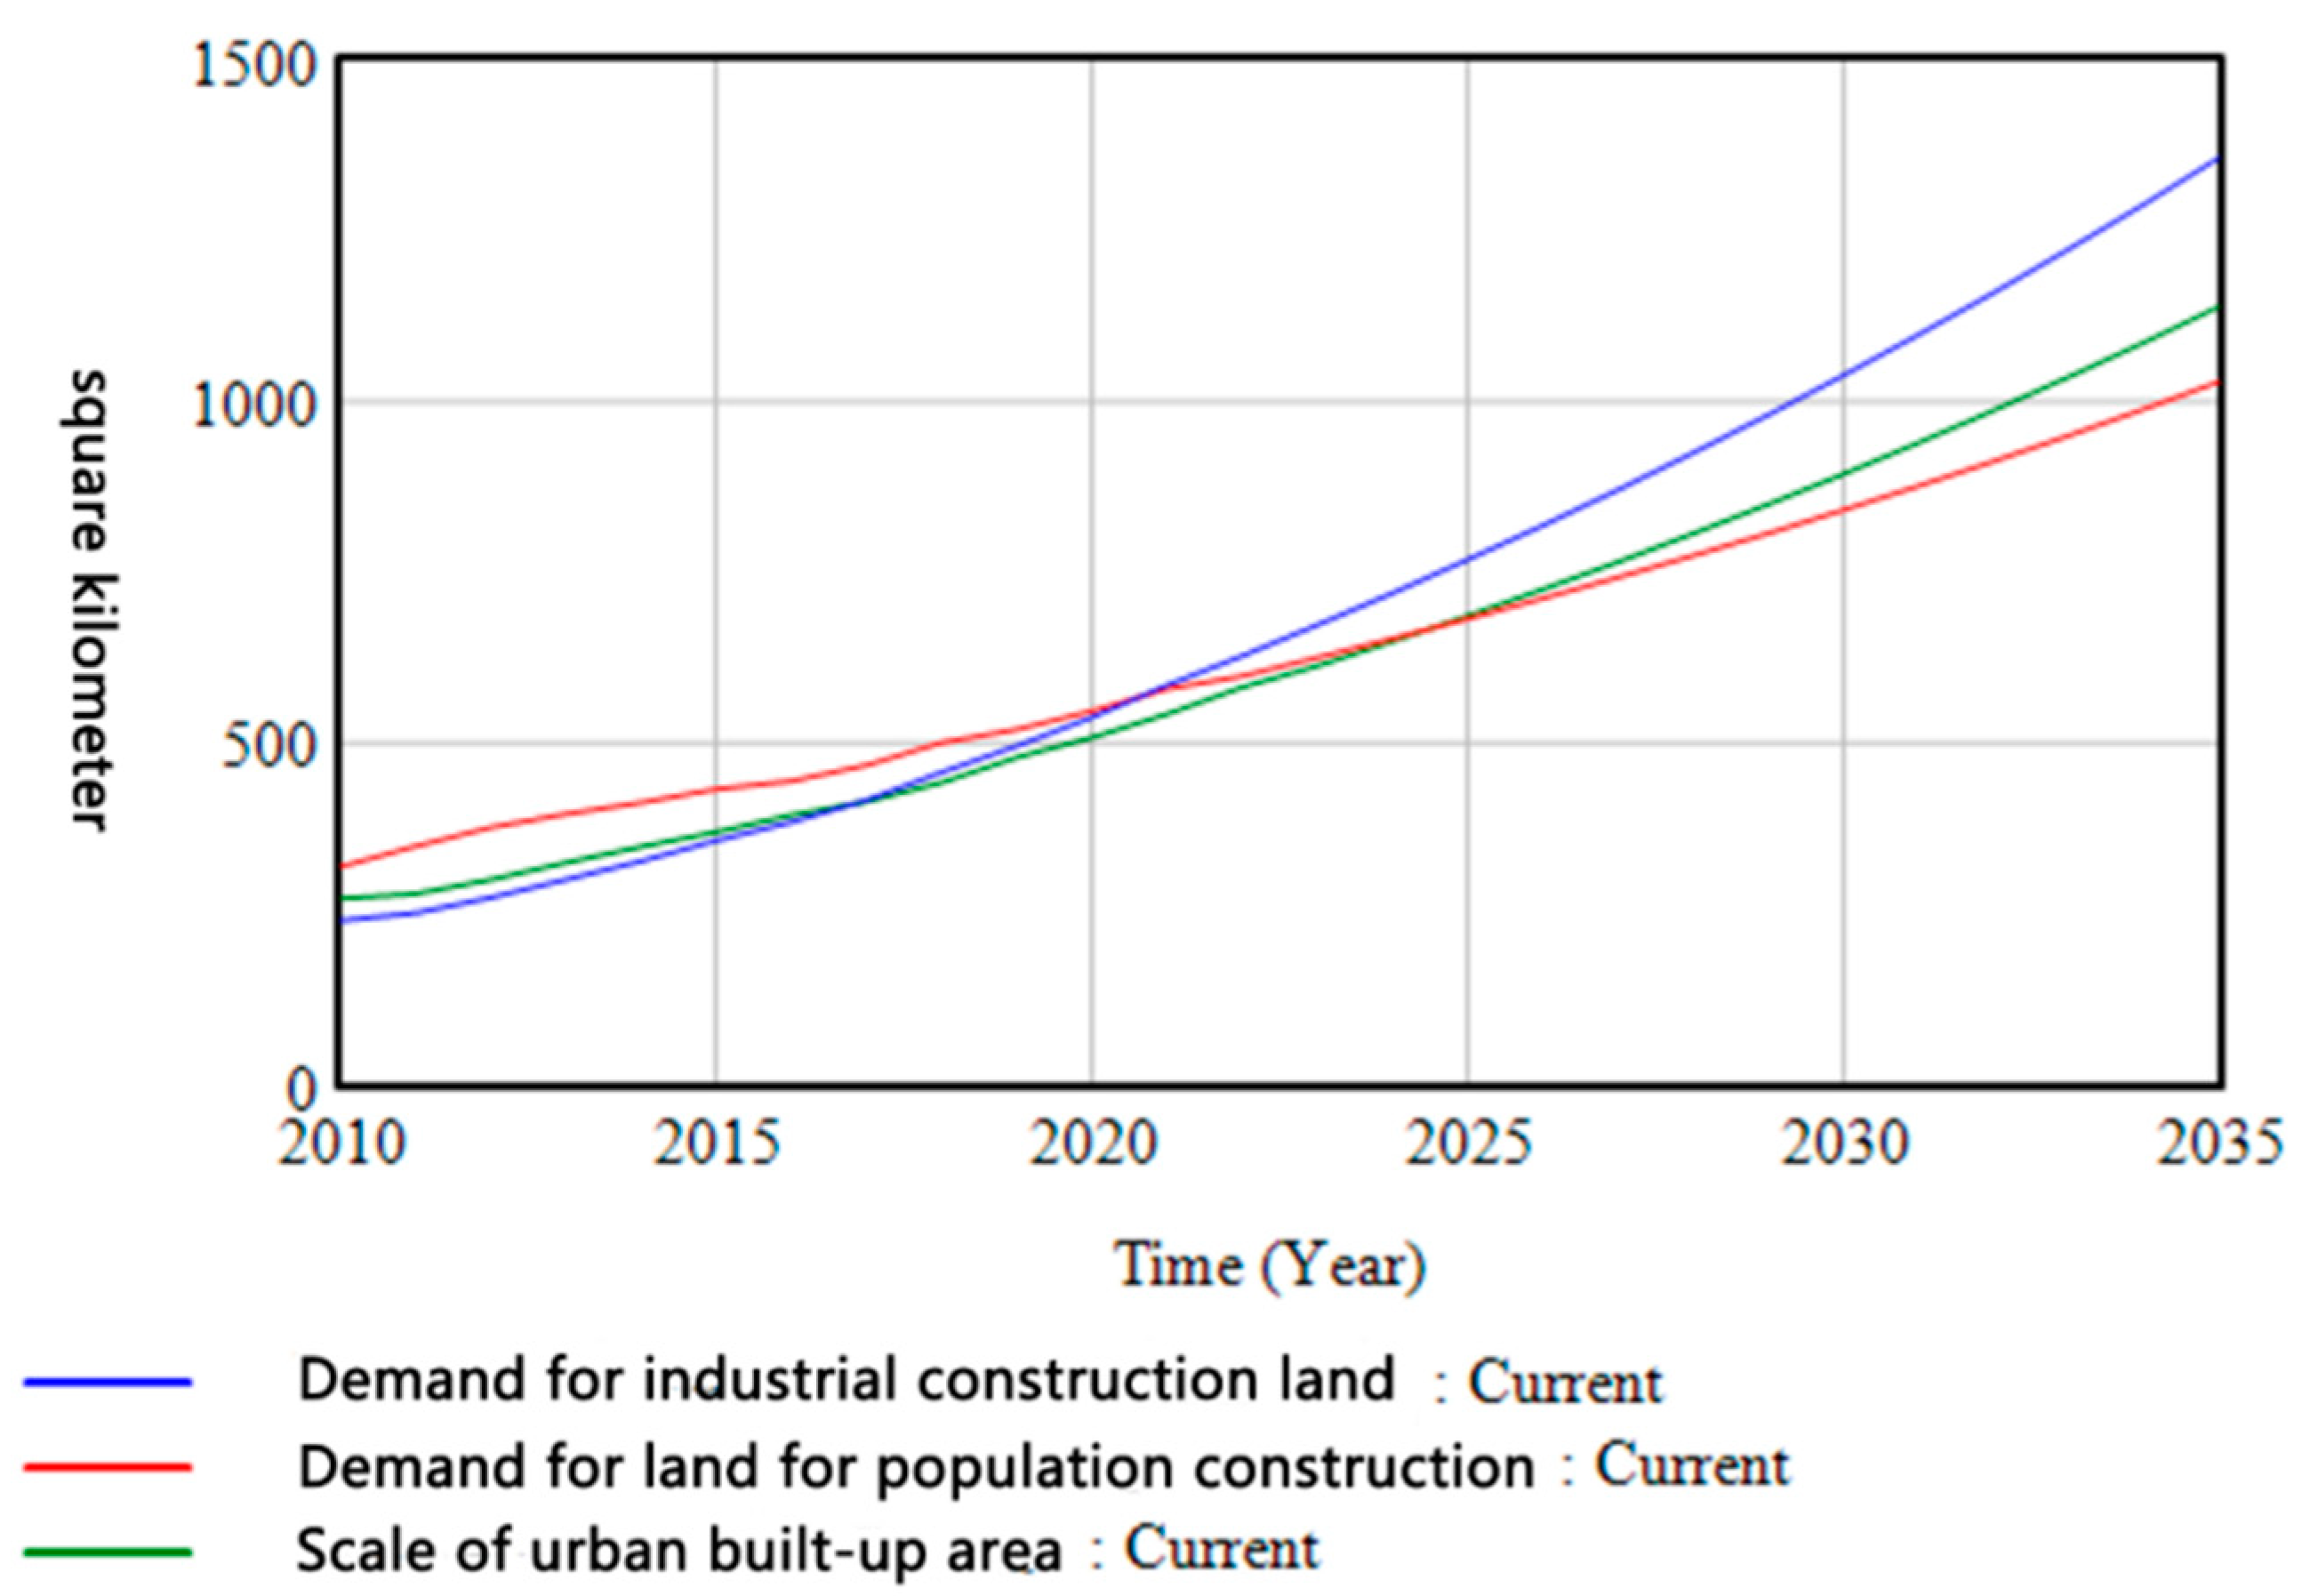
4.2.2. Simulation and Modeling of the SD Model

Setting of control variables. Based on the above simulation model, a simulation prediction was conducted for 2021–2025, with each year simulated in increments of one. According to the causal loop analysis built on the SD model, the total population plays an important role in all three systems, so the model selects the total population as the control variable of the system. The gray GM (1,1) system model is used to predict the future total population of Changsha.
The modeling steps for the gray GM (1,1) model are as follows:
Given the original data sequence
x(0) = {x(0)(1), x(0)(2), …, x(0)(n)}.
Generate accumulation of the original data sequence to obtain a new sequence
x(1) = {x (1)(1), x(1)(2), …, x (1)(n)},
where x (1)(k) = i = 1 k x ( 0 ) ( i )
Calculate the mean generation sequence of the accumulation generation sequence
z(1) = { z(1)(2), z(1)(3), …, z(1)(n) },
where z(1)(k) = 1 2 [ x 1 k 1 + x 1 k ]
Establish a gray differential equation
d x ( 1 ) d t + a x ( 1 ) = b
where a and b are parameters to be determined
Utilize the least squares method to solve for parameters a and b, obtaining
a ^ = k = 2 n [ z 1 k x 0 k ] k = 2 n [ z 1 k ] 2 b ^ = k = 2 n x 0 ( k ) n 1 a ^ k = 2 n z 1 ( k ) n 1
Solve the gray differential equation to obtain a predictive model
x ^ 1 k + 1 = x 0 1 b ^ a ^ e a ^ k + b ^ a ^
Implement accumulation reduction and restore to obtain the prediction value
x ^ 0 k + 1 = x ^ 1 k + 1 x ^ 1 ( k )
where x ^ (0) (k + 1) is the prediction value of the GM (1, 1) model for the next time step.
Based on the Changsha population prediction model, the prediction time is set to 5 years, and the predicted population of Changsha in the next 5 years is outputted, as shown in Table 3.
System dynamics simulation results and analysis. The total amount of urban construction land in Changsha City in 2025 was predicted using VENSIM software. The total time span of the prediction was from 2011 to 2025, with a duration of 15 years and a time step of 1 year. The 2011 data were used as the simulation base year by inputting it into the simulation equation, and the total population was used as the control variable. The prediction results are shown in Table 4.
In terms of the population scale of Changsha, it is estimated that the total permanent population of Changsha will be around 12 million by 2025 (Figure 3). With respect to water resources carrying capacity, the total water resources are expected to meet the development needs of 2025, but with the growth of the economy and population, the carrying capacity of water resources is likely to decline gradually. However, with the advancement of technology and innovation in the future, this situation may improve.
From the perspective of the scale of the main urban area of Changsha City, it is estimated that by 2025, the size of the built-up area of the main urban area of Changsha City will be approximately 686.55 square kilometers. The simulation results show that before 2021, the demand for construction land driven by population took the dominant advantage, while after 2021, the demand for construction land driven by industry took the lead, becoming the main driver of the growth of the main urban area size, indicating a good development trend of Changsha’s industry (Figure 4).

4.3. Simulation of Land-Use Layout Based on FLUS Model

The study utilized ArcGIS 10.6 to conduct spatial data conversion and standardization processing for the data of Changsha City, using a map scale of 7788 × 3139 pixels and a resolution of 30 m as the standard. The processing was conducted using GeoSOS-FLUS V2.4 model to simulate and predict the changes in construction land in Changsha City.

4.3.1. Calculating Suitability Probability Based on Neural Network

This paper extracted urban centers, village centers, highways, main roads, and railways as transportation and location driving factors, and prohibited construction areas, water bodies, beaches, and tidal flats as restriction areas from the land-use database. The slope factor was calculated using DEM elevation. During the artificial neural network training using GeoSOS-FLUSV2.4, uniform distribution sampling was adopted with a sampling proportion of 2‰, and the hidden layer was set to 13. The suitability probability maps for each factor are shown in Figure 5. The calculated root mean square error (RMSE) of training is 0.32, indicating high training accuracy. The formula for the RMSE is as follows:
R M S E = 1 n i = 1 n ( y ^ i y i ) 2
where n is the number of data points, y ^ i is the predicted value of the ith data point, and yi is the observed value of the ith data point.

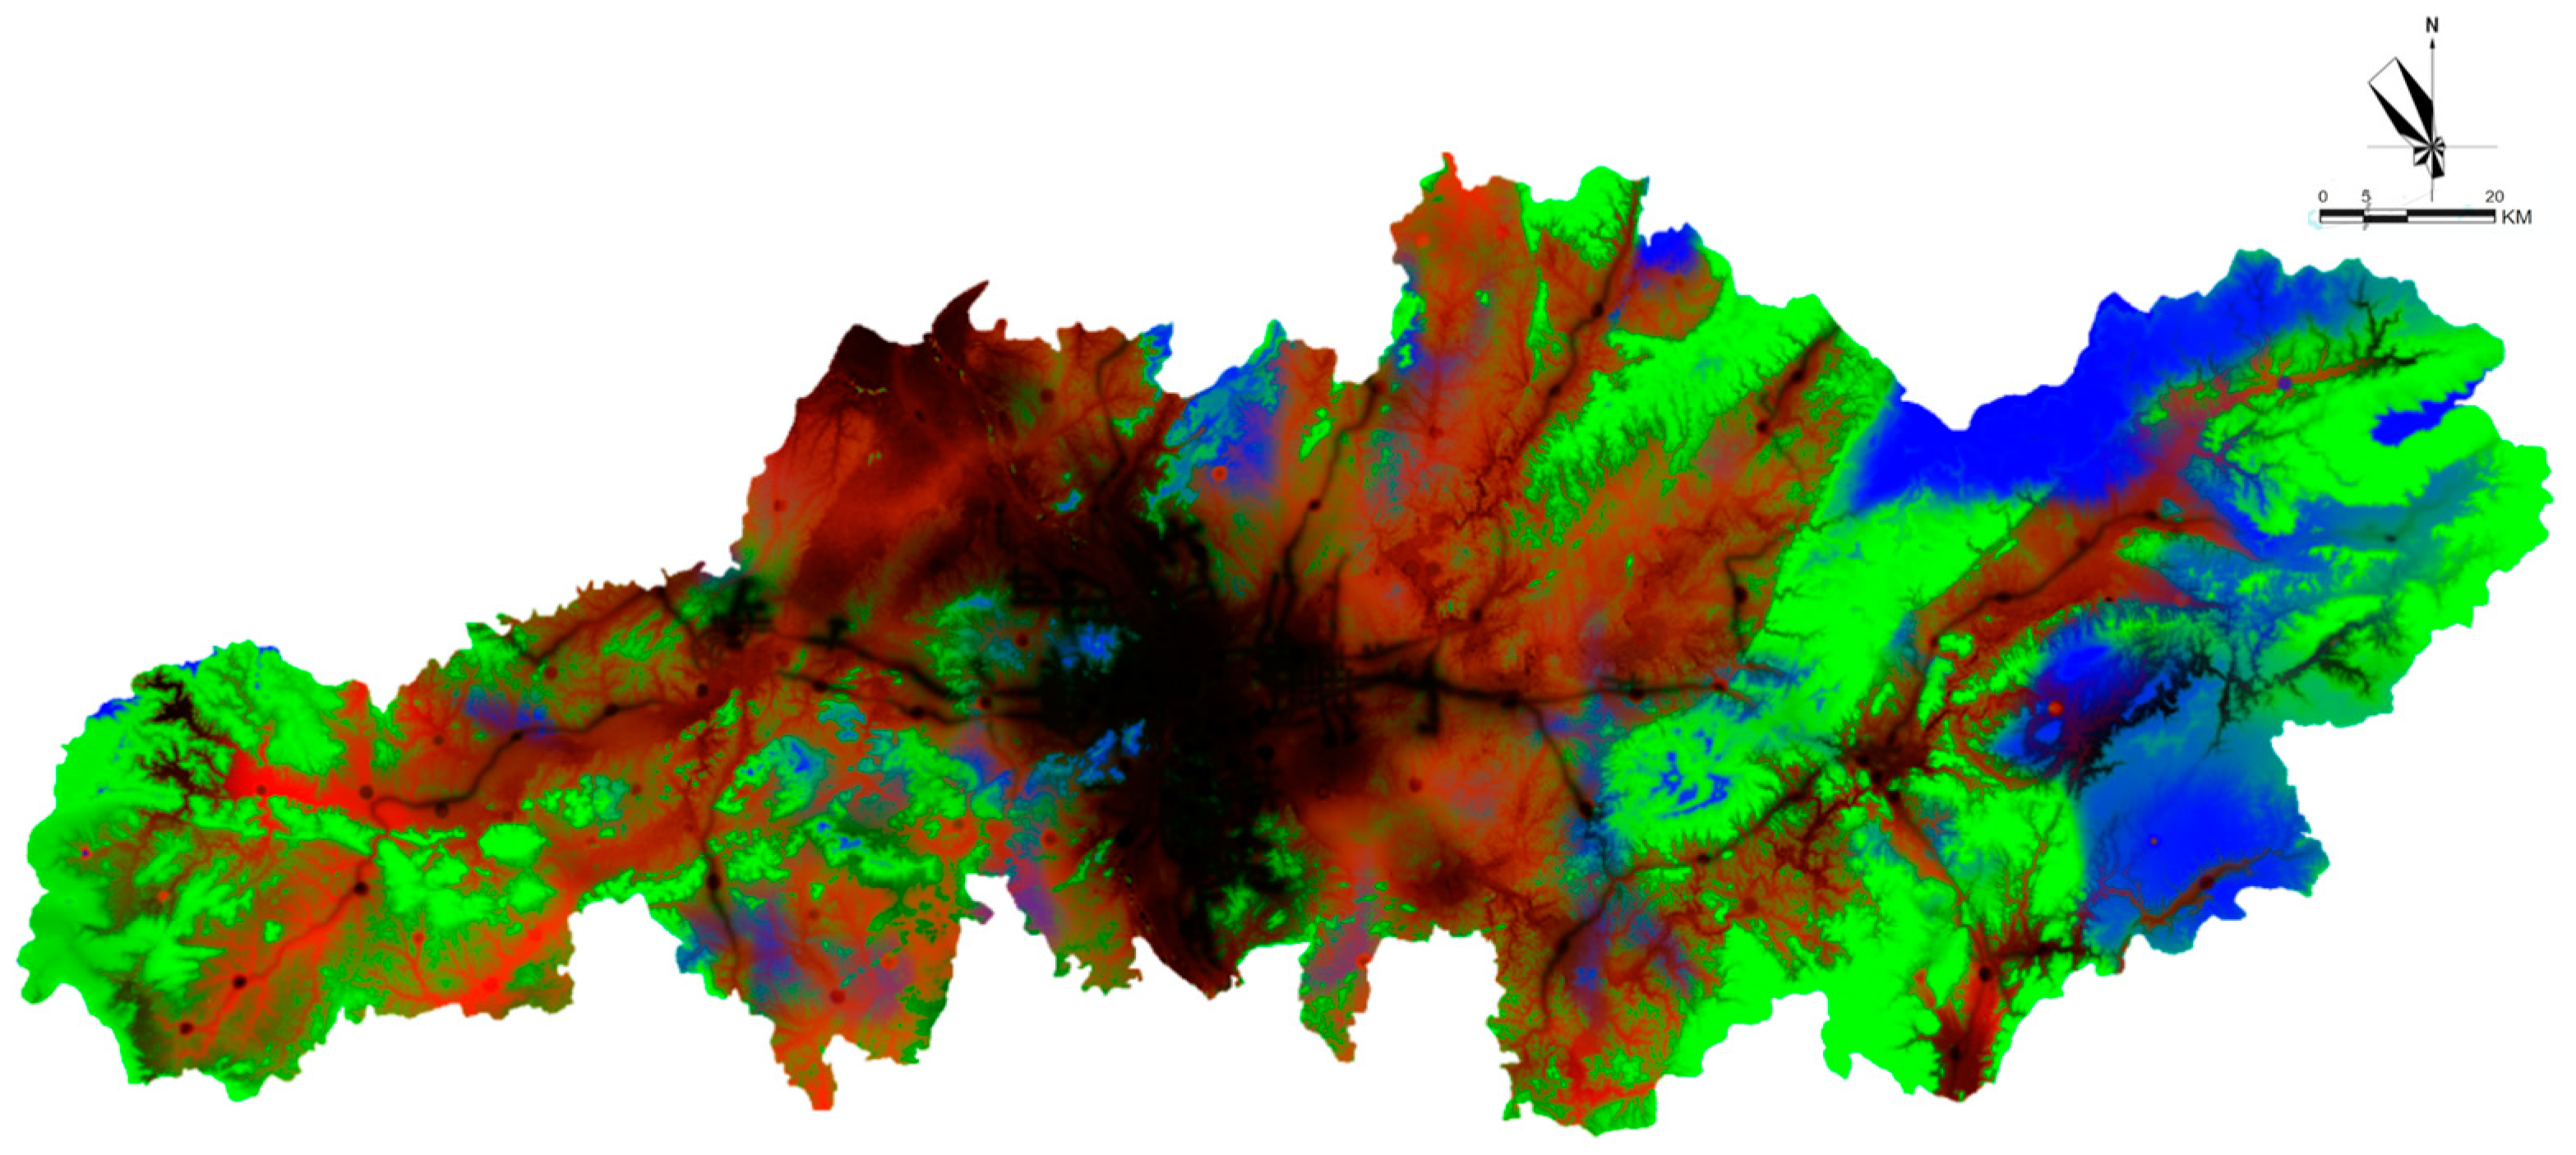
4.3.2. Cellular Automaton Simulation Based on Adaptive Inertia Mechanism

The GeoSOS-FLUS model requires the input of conversion quantity, conversion cost, and neighborhood factor weights to improve simulation accuracy. In the cellular automaton, the neighborhood value is odd and the size is set to 3, meaning the cellular automaton adopts a 3 × 3 Moore neighborhood. The acceleration factor is set to 0.1.
This paper obtained the future land-use changes in each type based on the land-use classification data of the base year and the end year, and used the SD model to predict them. The relative weights of the neighborhood factors were obtained through multiple experiments based on the conversion ratios of various land-use types in the confusion matrix. After the simulation was completed, the final simulation results were output. To ensure the accuracy of the simulation results, the simulated data for 2010, 2015, 2018, and 2020 were first obtained using the 2010 data, and the simulated parameters were corrected based on the comparison of the simulated data for 2015, 2018, and 2020 with the actual data for these three years. The simulated data for 2025 was then simulated based on this revised parameter set.
Simulation accuracy verification. After setting the model parameters, 300 iterations were performed to simulate the urban land-use scale of Changsha City for the years 2015, 2018, and 2020, which were 885.27 km2, 1028.65 km2, and 1156.67 km2 (Figure 6), respectively. The actual urban land-use scale for these three years were 879.24 km2, 1019.34 km2, and 1143.25 km2 (Figure 7), respectively, with an error value within 1%. To further verify the accuracy of the simulation, Kappa values and FoM values were introduced. The Kappa mean values for each year were 0.90, and the overall accuracy was 0.94. The FoM mean values were 0.10. The results showed that this simulation had a high accuracy, and the suitability probability based on neural networks met the characteristics of urban land-use changes in Changsha City. The simulation model and relevant parameters can be used for future land-use spatial pattern analysis of Changsha City.
Simulation of building land in 2025 under urban resilience scenario: Based on the verification of the urban land-use simulation for 2015, 2018, and 2020, the base year data were set to 2020, and the target prediction year was set to 2025. Using the total urban land-use scale predicted by the SD model, the urban land-use scale for 2025 was simulated. The data were divided into seven primary categories according to the “Chinese Academy of Sciences Land Use Coverage Classification System”, namely, grassland, arable land, urban land use, forest land, other land use, water bodies, and unutilized land. Restrictions on conversion of high-resilience land to other land uses. Meanwhile, the 30 m resolution digital elevation model (DEM) of Changsha City was obtained from the internet as terrain data. GeoSOS-FLUSV2.4 was used to complete the land-use change simulation.
The results show that the total construction land scale in Changsha city for the year 2025 is 1392.79 km2, accounting for 15.72% of the total land area of the city, with an incremental increase of 273.54 km2 compared with the construction land in 2020. According to the new round of national land spatial planning for Changsha city, the estimated permanent population size for 2025 is approximately 13.9 million people, and the estimated construction land scale for the whole city in 2025 is around 1400 km2. The simulation results match the planning expectations with a high degree of accuracy, reaching up to 98%. The simulation result is shown in Figure 8.
In terms of spatial distribution, the simulated distribution of construction land for the entire city in 2025 shows a high degree of overlap with the schematic map of the three spatial zones (ecological, agricultural, and urban) in Changsha city’s 2025 urban planning (Figure 9). The simulated distribution of construction land aligns well with the spatial distribution of the three zones, indicating a significant correlation.

5. Conclusions

As the concept of resilience becomes increasingly integrated into urban construction, building resilient cities has emerged as one of the paramount tasks for urban development. This paper, stemming from a resilience perspective, introduces a method for predicting and simulating the scale of construction land required to meet the needs of urban resilient development, using Changsha as a case study for verification. Initially, an indicator system for resilient urban development is established. Subsequently, the SD model is employed to forecast the total construction land demand for Changsha’s future development, and the FULS model is used to simulate the land-use layout for Changsha’s resilient urban development. The simulation indicates that by 2025, the total construction land scale of Changsha will be approximately 1416.79 km2. Compared with the recent territorial spatial planning forecast of about 1400 km2 for Changsha in 2025, the simulation corresponds closely with the planned outcome. This suggests that Changsha’s territorial spatial planning adequately addresses the requirements of resilient urban development.
Guided by the doctrine of resilient cities, this study actively seeks to balance the multifaceted developmental needs of social, engineering, ecological, and safety resilience. Spatially, Changsha has made significant efforts in preserving its ecological and safety resilience. This is evident as the city accentuates core elements of its natural landscape; the Weishan mountain range in the west and the Jiuling, Lianyun, and Mufu mountain ranges in the east serve as ecological “green veins.” Simultaneously, waterways such as the Xiangjiang River, Wei River, Longwang Port, Jin River, Liuyang River, and Laodao River in the city’s center constitute the “blue veins” of water resources. These geographical features not only offer essential ecological services like air purification, biodiversity conservation, and climate regulation but also mitigate risks from floods and other natural disasters, thereby augmenting the city’s ecological and safety resilience.
For the central urban area, a more holistic planning approach has been adopted. On one hand, the emphasized “One Ring, Two Mains, One Heart, Six Wedges” framework ensures the interconnectedness of the city’s green and blue corridors, reinforcing ecological and safety resilience. On the other, the heartlands of social and engineering resilience—primarily centralized in Changsha’s central urban area, Ningxiang city, and Liuyang city—underscore the vitality of economic activities and social services. This strategy, which amalgamates ecological, safety, social, and engineering resilience, empowers Changsha to adapt to a spectrum of external challenges, whether natural or anthropogenic. Crucially, this approach is not just a reaction to the existing environment; it outlines how Changsha envisages sustainable growth while navigating uncertainties in the future.
In summary, the simulation and prediction of urban construction land based on a resilience viewpoint constitute vital research in the context of eco-civilization and high-quality urban development. This research bolsters the formulation of territorial spatial planning, providing a robust framework for governmental departments to undertake annual land-monitoring and adjustments to annual land-supply plans. Concurrently, the methodology offers guidance for cities worldwide to conduct urban scale forecasting studies from a resilience perspective, serving as a significant addition to current resilient city research practices. Additionally, the level of urban resilience fluctuates with socio-economic evolution and environmental changes. This study’s exploration of resilience indicators and dynamic shifts remains preliminary. In the future, further research will be devoted to refining the resilience indicator system, integrating time coupling, and optimizing dynamic simulation methods, all in pursuit of bolstering the growth of resilient cities.
Shortcomings:
  • Although the selection of indicators in this project has been as extensive as possible, the strict rules and the accuracy of data acquired suggest that there are certain shortcomings in the prediction of low-utility land and the decomposition of land-use indicators, and the accuracy of the outcomes of prediction and analysis needs to be improved.
  • This project only predicts the urban development stage and construction land scale in Changsha, and it is necessary to further expand the scope of the study to the whole province in the future, so as to analyze in more depth the expansion mechanism of urban construction land scale in each city of Hunan Province under the guidance of resilience, and to provide more active and stable solutions and measures for the high-quality evolution of their urban systems.
  • This study adopts the research method of coupling the SD model with the FLUS model, which can compensate for the deficiency of dynamic changes in factors in urban scale prediction. However, this study only focuses on using Changsha as a case study, lacking comparisons with the application of multiple cities and comparisons with various similar models. These aspects should be the focus of future efforts.
Prospects:
Urban construction land prediction covers a wide range of aspects and has great research value in future directions, areas involved, theory and practice, etc. This project only takes Changsha City as a case study and discusses it in terms of construction land. There are several issues that deserve more in-depth discussion in the research process.
  • Under the guidance of the concepts of putting people first, constructing a resilient city and ecological civilization, how to establish the evaluation index system of urban construction land scale expansion and quality growth from the perspectives of theoretical connotation, coverage, and consistency of expression.
  • In view of the long history of China’s urban development and planning and construction, obtaining long-term historical data for a longer period of research on dynamic monitoring and model simulation of urban system operation process is needed.
  • In order to systematically reveal the influencing factors of urban construction land scale prediction and their mechanism of action, quantitative measurement research of specific factors combined with the qualitative analysis mentioned in the paper is needed to provide a basis for formulating diversified effective measures and paths to promote the rationality of urban land scale and layout.
  • In the next step, we can further develop the two achievements of “Operation Guide for Urban Development Potential Evaluation” and “Technical Guidelines for Urban Land Simulation Delineation” to assist the province to do great in technological innovation in land-use management, while the algorithm model can be further optimized and integrated with the one map system of land space, which can realize the annual monitoring and prediction of land use and assist in adjusting annual land supply plan and planning construction land scale prediction. Based on this, further research work can be carried out in an urban development potential model, urban land correction model, urban land scale index decomposition model, etc., to deepen the research achievements and improve the application value of them.

Author Contributions

Y.C. was responsible for the idea and the experimental part of the paper, W.Z. was responsible for the experimental process design and the writing of the paper, S.J. was responsible for funding acquisition and project administration, Z.W. was responsible for the writing of the paper, and L.O. was responsible for the literature search. All authors have read and agreed to the published version of the manuscript.

Funding

This research received no external funding.

Institutional Review Board Statement

Not applicable.

Informed Consent Statement

Not applicable.

Data Availability Statement

The experimental data used to support the findings of this study are available from the corresponding author upon request.

Conflicts of Interest

The authors declare that they have no conflict of interest regarding this work.

References

  1. Shao, Y.; Xu, J. Urban Resilience: A Conceptual Analysis Based on International Literature Review. Int. Urban Plan. 2015, 30, 48–54. [Google Scholar]
  2. Seto, K.C.; Ramankutty, N. Hidden linkages between urbanization and food systems. Science 2016, 352, 943–945. [Google Scholar] [CrossRef] [PubMed]
  3. Chen, G.; Diao, C.; Huang, M.; Li, M. Study on Prediction of Urban Construction Land in Chongqing City. Resour. Environ. Yangtze Basin 2002, 11, 403–408. [Google Scholar]
  4. Li, A. Study on Urban Built-Up Area Expansion and Land Use Scale Based on Remote Sensing Images. Ph.D. Thesis, PLA Information Engineering University, Zhengzhou, China, 2009. [Google Scholar]
  5. Zhu, M.; Wang, W. Prediction of Urban Construction Land Demand—A Case Study of Jiujiang City. J. Southwest Univ. Nat. Sci. Ed. 2015, 40, 74–79. [Google Scholar]
  6. Liu, K. Application of Principal Component Analysis-Based BP Neural Network in Predicting Urban Built-Up Area: A Case Study of Beijing. Prog. Geogr. 2007, 26, 129–137. [Google Scholar]
  7. Galster, G.; Hanson, R.; Ratcliffe, M.R.; Wolman, H.; Coleman, S.; Freihage, J. Wrestling sprawl to the ground: Defining and measuring an elusive concept. Hous. Policy Debate 2001, 12, 681–717. [Google Scholar] [CrossRef]
  8. Ewing, R.; Pendall, R.; Chen, D. Measuring sprawl and its transportation impacts. Transp. Res. Rec. 2003, 1831, 175–183. [Google Scholar] [CrossRef]
  9. Hasse, J.E.; Lathrop, R.G. Land resource impact indicators of urban sprawl. Appl. Geogr. 2003, 23, 159–175. [Google Scholar] [CrossRef]
  10. Cong, P.; Jia, Y.; Wang, Q. Prediction of urban built-up land based on nonlinear orthogonal regression model. Geogr. Geo-Inf. Sci. 2008, 24, 75–79. [Google Scholar]
  11. Qiao, L.; Zhou, W.; Cao, Y. Prediction of urban built-upland based on two factors—Taking Lanzhou City as an example. Resour. Ind. 2010, 12, 100. [Google Scholar]
  12. Guo, J.; Ou, M.; Liu, Q.; Ou, W. Prediction of construction land demand in Nantong City based on BP neural network. Resour. Sci. 2009, 31, 1355–1361. [Google Scholar]
  13. Li, A.; Lv, A.; Li, G.; Yu, C. Research on Forecasting Urban Built-Up Area Size Considering Multiple Factors—Taking Zhengzhou City as An Example. Bull. Surv. Mapp. 2009, 53, 26–28. [Google Scholar]
  14. Li, Y. Study on the Influencing Factors and Maximum Scale of Urban Land Expansion in Zhengzhou City. Ph.D. Thesis, Henan University, Zhengzhou, China, 2011. [Google Scholar]
  15. Yang, X.; Yang, J.; He, L. Logical delineation of urban development boundaries: Scale, form and governance—Also on the technical basis for national land spatial planning reform. Planner 2019, 35, 63–68. [Google Scholar]
  16. Zhang, L.; Zeng, H. Main model types and characteristics of urban construction land growth prediction. Geogr. Geo-Inf. Sci. 2014, 30, 50–55. [Google Scholar]
  17. Yu, K.; Zhou, N.; Li, D. A new idea for urban land scale prediction: A consideration from the industrial level. City Plan. Rev. 2004, 28, 62–65. [Google Scholar]
  18. Wang, Q. New Advances in Theory and Method of System Dynamics. Syst. Eng.-Theory Pract. 1995, 4, 6–12. [Google Scholar]
  19. Wang, L.; Cen, Y.; Li, R.; Xie, N.; Song, C. Study on cellular automata land use evolution model based on block characteristics. Geogr. Geo-Inf. Sci. 2009, 25, 74–76. [Google Scholar]
  20. Yang, X.; Liu, Y.; Wang, X.; Duan, T. A Constrained Cellular Automata Model for Land Use Planning and Layout. Geomat. Inf. Sci. Wuhan Univ. 2007, 12, 64–67. [Google Scholar]
  21. Liu, X.; Liang, X.; Li, X.; Xu, X.; Ou, J.; Chen, Y.; Li, S.; Wang, S.; Pei, F. A future land use simulation model (FLUS) for simulating multiple land use scenarios by coupling human and natural effects. Landsc. Urban Plan. 2017, 168, 94–116. [Google Scholar] [CrossRef]
  22. Liu, X.; Li, X.; Peng, X. Application of “niche” cellular automata inland sustainable planning model. Acta Ecol. Sin. 2007, 27, 2391–2402. [Google Scholar]
  23. Zhang, Y.; Liao, H.; Li, Y. Research on Urban Growth Boundary Delimitation Based on Counter Planning and FLUS Model—A Case Study of Yubei District in Chongqing City. Resour. Environ. Yangtze Basin 2019, 4, 757–767. [Google Scholar]
  24. Chen, Y.; Li, X.; Liu, X.; Ai, B.; Li, S. Capturing the varying effects of driving forces over time for the simulation of urban growth by using survival analysis and cellular automata. Landsc. Urban Plan. 2016, 152, 59–71. [Google Scholar] [CrossRef]
  25. Li, G. Research on Land Use Change and Simulation of Shenzhen City Based on FLUS Model. Master’s Thesis, Wuhan University, Wuhan, China, 2018. [Google Scholar]
  26. Rahim, F.H.A.; Hawari, N.N.; Abidin, N.Z. Supply and demand of rice in Malaysia: A system dynamics approach. Int. J. Supply Chain. Manag. 2017, 4, 234–240. [Google Scholar]
  27. Portela, R.; Rademacher, I. A dynamic model of patterns of deforestation and their effect on the ability of the Brazilian Amazonia to provide ecosystem services. Ecol. Model. 2001, 143, 115–146. [Google Scholar] [CrossRef]
  28. Cutter, S.L.; Barnes, L.; Berry, M.; Burton, C.; Evans, E.; Tate, E.; Webb, J. A place-based model for understanding community resilience to natural disasters. Glob. Environ. Chang. 2008, 18, 598–606. [Google Scholar] [CrossRef]
  29. David, R.; Goldschalk, C.H. Urban disaster mitigation: Creating resilient cities. Int. Urban Plan. 2015, 30, 22–29. [Google Scholar]
  30. Li, Y.; Zhai, G. Research on China’s urban disaster resilience assessment and its enhancement strategy. Planner 2017, 33, 5–11. [Google Scholar]
  31. Xie, X.; Zheng, Y. Research on evaluation index system of climate-adapted cities—Taking Beijing as an example. Urban Environ. Res. 2016, 5, 50–66. [Google Scholar]
  32. Dai, W.; Sun, Y.; Han, M. A study on resilience planning for delta cities under climate change. Urban Plan. 2017, 41, 26–34. [Google Scholar]
  33. He, J.; Meng, Y.; Zheng, P. Progress and Trends of Urban Resilience Governance Research in China (2000–2021)—A Visualization Analysis Based on CiteSpace V. Disaster Sci. 2022, 37, 148–154. [Google Scholar]
  34. Zhang, J.; Fan, L.; Zhang, Z.; Yu, W.; Zhu, L. Research and practice on safety resilience impact assessment of megacities under multiple hazards. Disaster Sci. 2023, 38, 7–12. [Google Scholar]
  35. Zhang, M.; Feng, X. Comprehensive evaluation of China’s urban resilience. Urban Issues 2018, 10, 27–36. [Google Scholar]
  36. Chen, W.; Xia, J. An optimal combination assignment method synthesizing subjective and objective weighting information. Pract. Recognit. Math. 2007, 1, 17–22. [Google Scholar]
  37. Zhang, X.; Li, A.; Nancy; Lei, G.; Wang, C. Multi-scenario simulation of land use change in China-Pakistan Economic Corridor based on coupled FLUS-SD model. J. Geo-Inf. Sci. 2020, 22, 2393–2409. [Google Scholar]
  38. Gu, M.; Ye, C.; Hu, M.; Lyu, X.; Li, X.; Hu, H.; Huang, X. Multi-scenario simulation of land use change based on MCR-SD-FLUS model: A case study of Nanchang, China. Trans. Gis 2022, 26, 2932–2953. [Google Scholar] [CrossRef]
  39. Wang, X.; Che, L.; Zhou, L.; Xu, J. Spatio-temporal Dynamic Simulation of Land use and Ecological Risk in the Yangtze River Delta Urban Agglomeration, China. Chin. Geogr. Sci. 2021, 31, 829–847. [Google Scholar] [CrossRef]
  40. Liang, X.; Liu, X.; Li, D.; Zhao, H.; Chen, G. Urban growth simulation by incorporating planning policies into a CA-based future land use simulation model. Int. J. Geogr. Inf. Sci. 2018, 32, 2294–2316. [Google Scholar] [CrossRef]
  41. Geng, S.; Yang, Z.; Dang, X.; Sui, B.; Cao, X.; Li, P.; Zheng, Z. Multi-scenario simulation of land use in Ningxia based on SD-FLUS model. J. Earth Sci. Environ. 2023, 45, 806–818. [Google Scholar]
  42. Wei, X. An Empirical Analysis of Factors Influencing Urban Land Use Scale in Large Cities of China. Ph.D. Thesis, Zhejiang University, Hangzhou, China, 2007. [Google Scholar]
Figure 1. The technological route.
Sustainability 15 13890 g001
Figure 2. Probability-of-occurrence model.
Sustainability 15 13890 g002
Figure 3. The simulation results of population size prediction for Changsha city.
Sustainability 15 13890 g003
Figure 4. Simulation and prediction results of the main urban area of Changsha city.
Sustainability 15 13890 g004
Figure 5. Urban and rural land suitability probability map.
Sustainability 15 13890 g005
Figure 6. 2020 land-use simulation results.
Sustainability 15 13890 g006
Figure 7. Real land-use situation in 2020 (data source: Third Land Survey Database).
Sustainability 15 13890 g007
Figure 8. Simulated distribution map of construction land in Changsha in 2025.
Sustainability 15 13890 g008
Figure 9. The schematic diagram of the three spatial zones (ecological, agricultural, and urban) in the Longshan City’s urban area plan for 2025.
Sustainability 15 13890 g009
Table 1. Resilient city evaluation indicator system.
Primary IndexSecondary IndexTertiary IndexMeaning of the Indicator
Urban resilienceSocial resiliencepopulation densityUrban population pressure
GDP per capitaCity Economic Prosperity
Financial services density
Density of cultural industriesCultural and educational level
15-min living areaEase of living for residents
Amount of urban land set asideUrban emergency land security
Engineering resilienceRoad lengthCapacity of urban transportation services
Length of leveeUrban flood control capacity
Drainage network dischargeUrban drainage capacity
Ecological resiliencegreen area coverageLevel of urban greening
forest cover
water areaUrban flood storage capacity
Impervious surface densityUrban water-prone areas
Security resilienceShelter areaUrban sheltering capacity
Shelter accessibility
Service capacity of medical facilitiesMedical security capacity
Width of urban ventilation corridorsUrban space purification capacity
Municipal garbage removalMunicipal waste removal capacity
Non-hazardous treatment rate of domestic waste
Table 2. Changsha city resilient city scale SD model main parameters and equations.
YearPopulationGDP (×104 CNY)Built-Up Area (km2)
ActualPredictedAccuracyActualPredictedAccuracyActualPredictedAccuracy
20117,403,6007,439,20099.5%54,764,22341,854,70076.4%306.39 279.7391.3%
20127,661,8007,803,72098.1%61,979,45144,989,90072.6%315.81 300.3295.1%
20137,874,6008,066,71097.6%69,022,67951,733,10075.0%325.51 325.2999.9%
20148,131,1008,284,51098.1%75,346,76759,775,20079.3%336.25 348.3396.4%
20158,282,7008,545,47096.8%85,025,98468,177,70080.2%363.69 370.1798.2%
20168,590,3008,701,86098.7%91,664,02777,371,00084.4%374.64 394.9594.6%
20179,029,4009,013,38099.8%100,501,98185,828,00085.4%434.82 414.4695.3%
20189,280,0009,451,43098.2%104,056,31795,687,10092.0%444.36 442.2899.5%
20199,635,6009,706,62099.3%115,527,308108,109,00093.6%483.8 479.1199.0%
202010,060,80010,064,800100.0%121,425,166120,081,00098.9%560.8 508.0790.6%
Table 3. The forecast results of total population in Changsha city from 2021 to 2025.
YearPredicted Population
202110,307,390.89
202210,663,094.11
202311,031,072.48
202411,411,749.61
202511,805,563.73
Table 4. The forecast results of city scale and GDP in Changsha from 2021 to 2025.
YearPredicted PopulationPredicted GDP
(×104 CNY)
Predicted Built-Up
Area (km2)
202110,490,500133,010,000542.57
202210,741,500147,456,000582.13
202311,099,800160,810,000613.1
202411,470,100174,721,000649.16
202511,852,700189,175,000686.55
Disclaimer/Publisher’s Note: The statements, opinions and data contained in all publications are solely those of the individual author(s) and contributor(s) and not of MDPI and/or the editor(s). MDPI and/or the editor(s) disclaim responsibility for any injury to people or property resulting from any ideas, methods, instructions or products referred to in the content.

