Article

Exploring the Carbon Abatement Strategies in Shipping Using System Dynamics Approach

College of Transport and Communications, Shanghai Maritime University, Shanghai 201306, China
*
Author to whom correspondence should be addressed.
Sustainability 2023, 15(18), 13907; https://doi.org/10.3390/su151813907
Submission received: 22 July 2023 / Revised: 8 September 2023 / Accepted: 12 September 2023 / Published: 19 September 2023
(This article belongs to the Special Issue Green Shipping and Sustainable Maritime Transport)

Abstract

:
Amid growing global concerns about climate change and its environmental impact, the maritime sector is under increasing pressure to reduce carbon emissions. This study presents a system dynamics model that predicts and simulates vessel carbon emissions, considering different scenarios such as the implementation of carbon levies and the use of alternative marine fuels. The research focuses on the Pacific route, a key international container route, as a practical case study to simulate ship emissions along the Shanghai-Los Angeles container route under various emission reduction measures. Through a comparative analysis of different policy combinations, the findings demonstrate the effectiveness of carbon taxation and the adoption of diverse fuels in reducing carbon dioxide (CO2) emissions from ships. Furthermore, the combination of these policies proves to be more effective in reducing emissions than implementing them individually. These results provide valuable insights for policymakers, industry professionals, and researchers working towards achieving low-carbon transitions in the shipping sector.

1. Introduction

Amidst the surge in global trade, the shipping industry faces persistent apprehension regarding the detrimental influence of shipborne CO2 emissions on the climate, necessitating a pressing need for decarbonization. Over the last decade, carbon emissions stemming from maritime operations have surpassed the alarming threshold of 1 billion tons annually, constituting approximately 3% of the overall greenhouse gas emissions. Moreover, their proportion within global anthropogenic carbon emissions has been steadily increasing [1]. In a concerted effort to mitigate the greenhouse effect, the International Maritime Organization (IMO) took a significant stride in April 2018 by endorsing an initial strategy for reducing greenhouse gas emissions during its 72nd session. The objective entails a reduction in the levels of greenhouse gas emissions to an extent that is below 50% of the emissions recorded in 2008, with the stipulated timeline for achieving this being the year 2050 [2]. In 2023, the 80th session of the IMO Maritime Environment Protection Committee (MEPC 80) endorsed stringent measures for the maritime sector. The central theme of the conference remains the reduction of greenhouse gas emissions from maritime vessels. The primary emphasis lies on achieving complete emission neutrality by 2050, with well-defined milestones set for 2030 and 2040. These measures decisively propel the maritime industry towards zero carbon emissions. Thus, the trajectory entails a 20% reduction in total annual greenhouse gas emissions from international shipping by 2030, aspiring for a 30% diminution. Similarly, by 2040, the target calls for a 70% reduction in total annual greenhouse gas emissions with an ambitious 80% reduction, steering the maritime sector unequivocally on the path towards achieving carbon neutrality [3]. Given its pivotal role in global trade, effective management of ship-generated CO2 is pivotal to curbing environmental pollution [4].
In recent years, numerous scholars have conducted extensive research on carbon reduction measures and policies in the maritime industry. The primary focus of ship carbon reduction endeavors revolves around enhancing overall ship optimization, employing environmentally friendly energy sources, and optimizing operational efficiency [5,6]. In 2012, IMO introduced the Energy Efficiency Design Index (EEDI) and the Ship Energy Efficiency Management Plan as key mechanisms to regulate and manage carbon emissions in ship design and operation. These initiatives aim to reduce the energy consumption of ships by addressing two key aspects [7].
The comprehensive optimization of ships primarily concentrates on four key areas: route optimization, propulsion system optimization, utilization of innovative materials, and incorporation of energy-saving devices. Concurrently, Japanese cruise ships are actively engaged in research pertaining to zero-emission vessels, seeking to achieve a significant reduction or complete elimination of emissions [8,9]. The implementation of this system on commercial vessels has been substantiated to effectively decrease fuel costs and CO2 emissions [10,11]. Moreover, the adoption of clean fuels and the reduction of reliance on fossil fuel consumption are pivotal pathways for fostering the future low-carbon development of the shipping industry [12]. Examples of these measures include shore power (SP), low sulfur fuel oil (LSFO), and liquefied natural gas (LNG). Joung et al. [13] conducted an analysis of short-term, medium-term, and long-term alternative measures for carbon reduction in the shipping industry under the framework of the IMOs greenhouse gas reduction strategy. They assessed the emission reduction potential of each measure and reached the conclusion that zero-carbon fuels exhibit the highest potential for emission reduction. In contrast, Wang et al. [14] offered recommendations for the future development of low-carbon fuels in the maritime sector by examining the potential utilization of low-carbon alternative fuels, low-carbon combustion technologies for ships, and innovative clean power sources. The identified alternative fuels for ships include LNG, methanol, biofuels, hydrogen, and ammonia. LNG is considered a favorable transitional fuel, while biofuels such as methanol, hydrogen, and ammonia are targeted for long-term use, albeit requiring further research [15]. Furthermore, Garcia et al. [16] conducted a study focusing on market mechanisms and alternative fuels as the pathway to achieving zero-carbon fuels. Leading shipping companies have been progressively increasing the utilization of green energy sources in their vessel operations. The integration of environmentally friendly energy sources such as LNG, solar power, and wind energy into ship propulsion systems has yielded significant reductions in fossil fuel consumption and greenhouse gas emissions [17]. In their comprehensive analysis of emission reduction technologies for ships, McKinlay et al. [18] identified methanol and hydrogen as genuinely clean energy alternatives. They emphasized that harnessing renewable energy sources to produce hydrogen and methanol represents the most optimal approach for mitigating carbon emissions. However, the industry currently faces limitations in the wider adoption of hydrogen and methanol due to their comparatively high production costs and the need for enhanced safety measures.
In the domain of ship operations optimization, many shipping companies aim to reduce their total costs by lowering vessel speeds to minimize energy consumption and emissions. Xia et al. [19] proposed a novel approach by integrating port ship scheduling optimization with deceleration, effectively demonstrating the method’s efficacy in reducing ship emissions. Zhuge et al. [20] concluded that incentivizing ship deceleration brings benefits to liner shipping operations. Chen et al. [21] discovered that deceleration in shipping channels can significantly reduce CO2 emissions. Additionally, optimal ship speed and fleet size, determined using ECA (Emission Control Area), have been shown to be effective in reducing GHG emissions [22]. To mitigate the negative effects of deceleration, Chang et al. [23] found that speed reduction and the application of SP technology effectively reduced CO2 emissions. However, it is evident that the existing measures and approaches alone are insufficient to achieve the emission reduction targets by 2050 established by the IMO, considering the current level of enforcement of the EEDI. Consequently, there has been a reevaluation of the progress made in technology, operations, and market-based emission reduction pathways, along with the associated controversies. Various emission reduction measures have been analyzed, leading to the proposal of carbon taxation, known as carbon pricing, to tackle carbon dioxide emissions [24]. Ding et al. [25] assert that a carbon tax represents an effective approach to curbing CO2 emissions and has emerged as a critical research focus for emission reduction efforts in China. Market-based emission reduction measures are currently being considered, and the introduction of carbon pricing is being contemplated to intensify emission reduction efforts. The International Chamber of Shipping has proposed the mandatory imposition of a carbon tax of $2 per ton of ship fuel. This measure aims to expedite the transition to zero-carbon fuels, facilitate the development of new technologies, and assist the shipping industry in achieving net-zero carbon dioxide emissions by 2050 [26].
China established a carbon emissions trading system in 2017 with the aim of incentivizing operators to utilize energy-efficient vessels [27]. Considering the significant disparities in carbon emissions across different regions and industries, it is worth considering the introduction of differentiated industry carbon taxes for enterprises. This approach can guide the shipping industry towards technological upgrades and energy transformation [28], facilitating a shift in fuel composition to reduce carbon dioxide emissions. Therefore, the selection of an appropriate carbon tax rate is of great importance for policymakers. The imposition of carbon taxes in the shipping industry is based on the carbon emissions generated by vessels in maritime transportation. Carbon taxes can serve as a component of national fiscal revenue and can also be utilized to fund the development of low-carbon technologies and zero-carbon fuels in the maritime sector [29].
Currently, research on carbon taxation primarily focuses on the macro level, analyzing the impacts of implementing carbon taxes in specific regions or industries. Most studies employ Computable General Equilibrium (CGE) models. For instance, Lin et al. [30] conducted an analysis of the emission reduction effects and the impact on energy, the environment, and the economy using a CGE model. They compared the emission reduction effects of different carbon tax rates at high, medium, and low levels, thereby determining the direction of carbon taxation implementation in China. Similarly, Gao et al. [31] utilized a CGE model to simulate the effects of implementing carbon tax policies at different price levels on the environmental and economic benefits in China. Lee [32] conducted an analysis using a CGE model to assess the impact of the maritime carbon tax on the global economy. Liu et al. [33], through the establishment of a CGE model, compared the development of the Chinese economy before and after the implementation of carbon taxes. The results indicated that the carbon tax rate should be set at a relatively low level to achieve the lowest economic cost. Fu et al. [34] used a CGE model to study the interaction between a progressive carbon tax and different fuel types to determine the optimal carbon tax choice. Li et al. [35] based on a dynamic CGE model, analyzed the impact of carbon tax policies on carbon dioxide emissions and industrial competitiveness in Liaoning Province.
Reducing carbon emissions in the shipping industry is a complex and interconnected system issue that involves multiple levels such as policy, technology, the market, and society. However, the current research on carbon emission reduction in shipping mostly focuses on single-variable and static correlation analysis [30], lacking quantitative analysis and feasibility testing of emission reduction pathways. System Dynamics (SD) is a quantitative method used for analyzing and modeling the behavior of complex systems. It considers the interactions and feedback mechanisms among various components within the system, allowing for a comprehensive understanding of the system’s overall behavior and dynamic evolution [36]. In other words, the System Dynamics approach considers the system’s entirety, nonlinear effects, and long-term behavior, revealing the essence and trends of system behavior. It offers unique advantages in comprehending and addressing complex system problems, providing robust support for decision-making and policy formulation. Consequently, in recent years, numerous scholars have employed system dynamics methodologies to investigate and predict the dynamics of the shipping freight market. For instance, Rebs et al. [37] conducted a comprehensive analysis and summary of the application of System Dynamics in sustainable supply chain management in recent years. Song et al. [38] applied the System Dynamics approach to forecast the demand for international bulk cargo transportation and provided recommendations for the development of the bulk shipping market. Bai et al. [39] utilized System Dynamics to analyze the impact of port congestion on the shipping freight market and predict future freight rates, offering guidance for future planning. Wang et al. [40] analyzed the relationship between CO2 emissions and ship speed, vessel condition, and main/auxiliary engines. Through System Dynamics simulation, they assessed the CO2 emissions from ships. Geng et al. [41] constructed a System Dynamics-based sustainable ecosystem for the regional shipping industry. By developing an SD model, they helped reduce exhaust emissions from ships in the Qingdao Port and predicted both the emissions volume and economic benefits. Different development measures were analyzed to provide a reference for the coordinated development of the port area. Kong et al. [42] constructed a carbon emission reduction model for the maritime supply chain using the System Dynamics approach. They delved into the interactions among enterprises, the economy, energy, the environment, and policies. Taking Shanghai Port as an example, they simulated the effects of various carbon reduction measures. Jing et al. [43] used System Dynamics to forecast carbon dioxide emissions from Arctic shipping, providing valuable insights for Arctic environmental governance.
System Dynamics, distinguished by its capacity to capture causal relationships and dynamic changes within a system, presents a superior understanding of the long-term consequences of system behavior compared to traditional static approaches. It unveils intrinsic temporal and lagged relationships, providing insight into the influence of uncertain factors through modeling and sensitivity analysis. This enables a more comprehensive comprehension of the extent to which factors impact system behavior, thus aiding decision-makers in formulating enduring strategies.
Within the expansive realm of maritime carbon emission reduction, which encompasses an array of mitigation measures, System Dynamics methodology stands adept at discerning interactions among factors through feedback loops. Careful selection of factors within predetermined boundaries is crucial to preventing deviations between results and actual occurrences. This method excels in identifying factors and elucidating interactions within the maritime carbon reduction system, given its effectiveness in dealing with complex systems.
In the realm of research on carbon emission reduction strategies in maritime transportation, a prevailing trend is the tendency to concentrate on isolated emission reduction approaches. Few studies delve into the analysis of systemic dynamics concerning the impact of carbon mitigation measures on shipping routes. Despite the multitude of emission reduction analyses, most remain confined to a static framework. This study adopts a dynamic perspective to simulate optimal emission reduction policies in shipping. While much of the research on carbon taxes leans towards macro-level analysis employing CGE models, this paper employs a fusion of SD methodology for a more nuanced exploration of the effects of carbon tax policies on CO2 emissions during vessel voyages and their ramifications for maritime enterprises.
This study utilizes the System Dynamics approach to comprehensively understand and address complex system problems in the shipping sector. Adopting a dynamic perspective and drawing upon domestic and international emission reduction pathways, an SD model is constructed to analyze carbon emission reduction strategies. The model integrates shipping, energy, economy, policy, and environment elements to provide a comprehensive analysis of carbon reduction measures in maritime transportation. Various policies and measures, including carbon taxation, fuel composition changes, speed reduction, and government subsidies, are considered within the model. The analysis focuses on the carbon dioxide emissions of vessels on the Pacific route. Through comparing simulation results from different policy scenarios, recommended policies are proposed to guide the development of shipping enterprises and offer insights for the establishment of zero-carbon pathways. The structure of the paper is as follows: Firstly, an analysis of the low-carbon development system in the shipping industry is conducted, and a system dynamics model is established. Secondly, based on the system dynamics model, simulation scenario design and model validation are performed, taking the container route between Shanghai and Los Angeles ports as an empirical case study. Thirdly, simulation and analysis are carried out for different emission reduction schemes implemented in the case study, followed by a discussion of the results. Finally, optimization and improvement measures for current carbon reduction initiatives in the shipping industry are proposed based on the simulation results.

2. Materials and Methods

The construction of the system dynamics model entails five fundamental steps. Firstly, the determination of system-wide boundaries is crucial, encompassing the identification of both structural and temporal boundaries. Subsequently, the causality diagram is established, serving as an initial stage in model construction. This diagram plays a vital role in illustrating the feedback structure and visualizing the interrelationships between relevant variables. Causal relationships are depicted using arrows within the diagram. Building upon this foundation, the system dynamics model takes shape by analyzing the interactions between factors, formulating equations, and transforming the causality diagram into a stock-flow diagram. Following that, model verification and debugging will be conducted. In this study, the Vensim PLE 10.0 will be utilized to ensure the structural integrity and dimensional consistency of the model. Additionally, sensitivity analysis will be performed to identify influential parameters. Subsequently, by formulating simulation strategies and determining input and decision variables, simulation predictions will be carried out to determine the optimal strategy or combination of strategies.

2.1. Model Framework

Carbon emissions reduction in the shipping industry involves various factors and processes, and the interactions and feedback relationships among these factors can significantly impact the entire system. The interplay within this complex system arises from the interdependencies between social-economic interests, shipping activities, environmental damage caused by emissions, and government policies aimed at energy and environmental protection, which restrict carbon emissions in specific regions of shipping operations. Therefore, from a systems perspective, the carbon emissions reduction system in the shipping industry consists of multiple subsystems. Based on an extensive review of existing literature, this study constructs an SD model for the low-carbon development of the shipping industry in the context of carbon emissions reduction. The model incorporates five subsystems: shipping, economy, environment, energy, and policy. It aims to forecast and analyze the impacts of carbon taxes and a combination of emission reduction measures on CO2 emissions from ships.
Table 1 illustrates the subsystems and corresponding influencing factors within the SD model. The main logic of the model is as follows: Ships serve as the transportation medium in the shipping system, and their CO2 emissions primarily result from fuel consumption by the main and auxiliary engines. Fuel consumption is determined by factors such as the number and size of ships, sailing speed, and duration, which interact with each other, forming feedback loops.
This study sets the time boundary of the model from 2008 to 2030. Shipping activities consume a significant amount of energy, leading to greenhouse gas emissions, particularly carbon dioxide, which have an impact on the economy. Therefore, the model’s structural boundary is based on the interrelationships between shipping, energy, the environment, the economy, and policy. From a systems perspective, the carbon emissions reduction system in the shipping industry is divided into the following subsystems: shipping, energy, environment, economy, and policy.
The shipping subsystem is the core of the entire system, encompassing factors such as vessel speed, sailing time, and the number of vessels. The energy subsystem involves the consumption of different types of energy, and by improving the energy consumption structure, it is possible to effectively reduce emissions in the shipping industry. The environment subsystem includes the total CO2 emissions generated during ship operations, which are closely related to energy consumption and the sailing conditions of ships. The economic subsystem includes factors such as the total revenue of shipping companies and the cost of energy consumption for ships, which directly influence the shipping subsystem. The policy subsystem mainly involves shipping subsidies and carbon taxation policies. When the shipping subsystem impacts the environment subsystem, CO2 emissions increase, necessitating the implementation of different emission reduction policies to mitigate the impact. Among these five subsystems, the shipping subsystem has input-output relationships with the other four subsystems (as shown in Figure 1).

2.2. Model Hypothesis

To simplify the complexity of the system and focus on assessing the interactive effects of different measures aimed at reducing carbon emissions, the goal-oriented System Dynamics model was constructed based on the following assumptions:
(1)
The calculation of carbon emissions only considers the carbon dioxide produced during the ship’s voyage.
(2)
The quantity of cargo and the cargo tariff remain unchanged, and the container ship is fully loaded.
(3)
Considers only emissions when the ship is sailing and does not consider emissions when the ship is at berth.
(4)
Consider only the carbon tax as well as voyage revenues as influences on shipping company earnings.

2.3. Model Setting

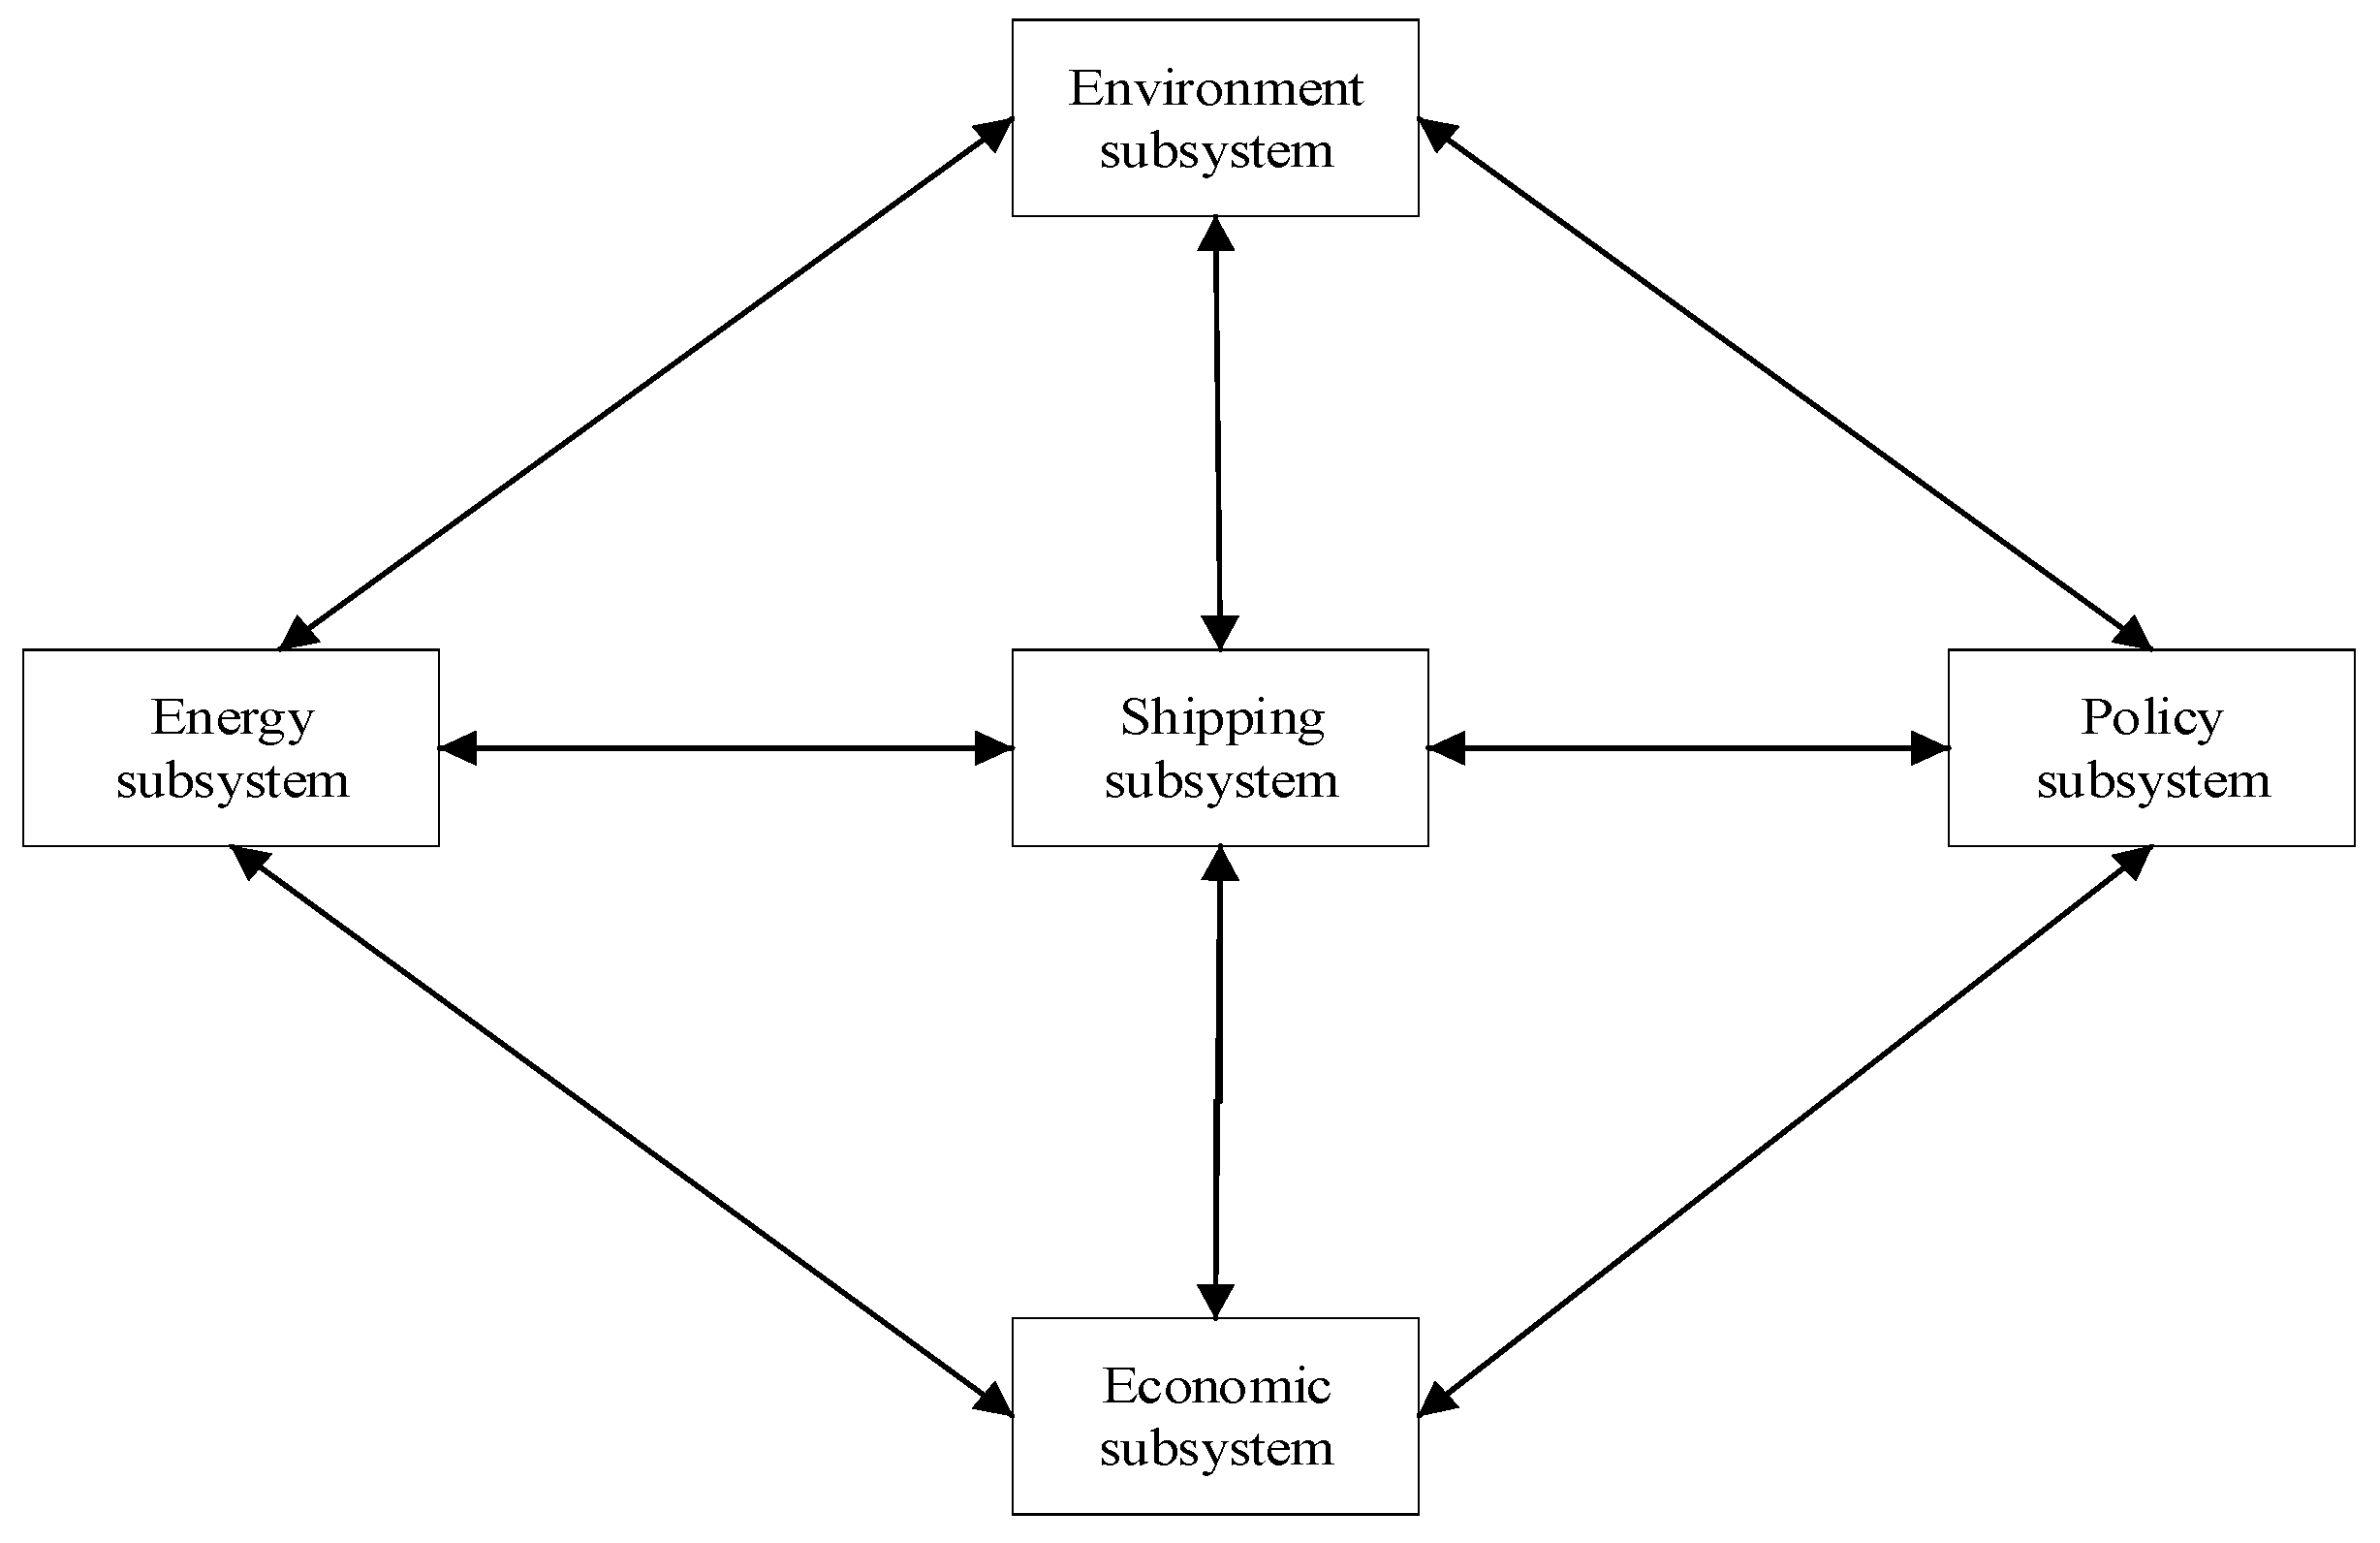
2.3.1. Creation of a Causal Diagram

A causal relationship diagram illustrates the interactions between various factors and represents the causal connections through arrowed lines. Figure 2 depicts the causal relationships among influencing factors within each subsystem. The descriptions of the causal relationships among influencing factors in each subsystem are as follows:
(1)
Shipping subsystem
The shipping industry, through its maritime trade activities, promotes economic development. However, the process of shipping development inevitably results in CO2 emissions, posing certain risks to environmental quality. With the introduction of stringent international regulations, the shipping industry is compelled to reduce CO2 emissions. When governments impose carbon taxes, it increases the pressure on shipping companies and stimulates them to adopt measures to reduce carbon tax costs. Shipping companies can adjust their energy structures by using cleaner energy sources or reducing sailing speeds. However, these measures may increase the overall fuel costs within the shipping subsystem, which, in turn, can impact the overall revenue of shipping companies.
(2)
Economic subsystem
The imposition of carbon taxes leads to increased government revenue. According to the tax fund compensation mechanism, the revenue generated from carbon taxes is reinvested in the low-carbon development of the shipping industry, such as by providing subsidies to shipping companies, thus mitigating the impact of increased shipping costs. The development of low-carbon practices can lead to an increase in shipping costs. Shipping companies have the option to pass on these added costs to cargo owners, thereby transmitting them throughout society. Since society benefits from green shipping practices, it is reasonable to absorb the resulting costs. However, considering that shipping transports over 80% of international trade goods, when the increased costs of shipping are passed on to cargo owners and, subsequently, throughout society, it can affect the competitiveness of shipping and trading nations’ products. For shipping companies, varying degrees of increased shipping costs translate to differing levels of competitiveness, potentially resulting in reduced overall revenue. Shipping companies with weaker competitiveness will experience a decrease in overall revenue when confronting the impact of increased shipping costs.
(3)
Energy subsystem
To cut emissions, companies will adjust their energy sources, including using cleaner energy on ships. This shift can lower carbon emissions during ship operations, easing carbon tax burdens and reducing shipping costs. Cleaner energy sources help reduce carbon emissions. In this study, the most widely used fuel types for long-distance transportation were selected, such as heavy fuel oil (HFO), marine diesel oil (MDO), and LNG. Considering the carbon content and combustion efficiency, the combustion of HFO typically yields around 3 to 3.3 kg of CO2, MDO typically generates approximately 2.7 to 3 kg of CO2, and natural gas combustion usually results in about 2.75 kg of CO2. The increased utilization of clean energy sources such as natural gas would require retrofitting or purchasing new power equipment, which can result in higher overall fuel costs compared to previous configurations.
(4)
Environment subsystem
The implementation of carbon emissions reduction measures and carbon taxation policies incentivizes energy structure adjustments and reductions in energy consumption, resulting in a decrease in carbon dioxide emissions. This not only leads to favorable economic benefits but also improves environmental quality by reducing the negative impact of pollution on overall revenue. As revenue increases, there is a greater potential for receiving subsidies, further supporting the implementation of carbon reduction initiatives in the shipping industry.
(5)
Policy subsystem
Policies targeting carbon emissions reduction in the shipping industry primarily consider the implementation of carbon taxation measures. By levying carbon taxes, stakeholders are motivated to adopt corresponding emission reduction measures to alleviate cost pressures. Different carbon tax systems may have different institutional structures and target different entities. For example, if a consumption-based carbon tax is implemented, it would target ship operators, whereas a production-based carbon tax would target fuel suppliers. However, the specific approach to carbon tax imposition is not the focus of this study. Additionally, regardless of the chosen taxation approach, its impact will not be simply confined to a single link in the supply chain. It will inevitably propagate upstream and downstream within the shipping industry, ultimately impacting shippers or consumers. However, attributing the increased cost directly to consumers neglects the benefits of the system dynamics approach. For instance, examining the cost increase stemming from carbon tax collection entails assessing its effects on upstream and downstream nodes. Utilizing the system dynamics method is necessary to analyze the causal links between these points. In the case of carbon tax collection, both ship owners and shipping companies exert the most direct and significant influence. Implementing a carbon tax increases shipping operational expenses, prompting emission reduction measures to mitigate costs. Yet, applying such measures also heightens operational expenditure.
When carbon taxes are levied, the government’s revenue increases, enabling them to introduce more emission reduction policies and provide greater subsidies to shipping companies. This, in turn, encourages shipping companies to invest in emission reduction measures such as carbon capture and storage technologies, coating technologies, and wind power generation.

2.3.2. Main Feedback Loops

The feedback loops for the relevant factors in the causality diagram are shown in Table 2.
R1 is a feedback loop consisting of six variables, reflecting the causal relationships between factors. If total revenue increases, the number of voyages by ships will also increase. This will result in higher energy consumption and, consequently, more carbon dioxide emissions. The increase in emissions prompts the adoption of corresponding emission reduction measures, with an emphasis on increasing the use of low-carbon fuels to reduce carbon dioxide emissions from fuel consumption. This, in turn, decreases pollution-related losses.
R2 comprises five variables and a cyclic causal relationship. As voyages increase, shipping’s overall energy consumption rises, translating to heightened total ship energy costs. Meanwhile, total income may fluctuate, influenced by the cost-benefit ratio. However, adopting low-carbon fuels or enacting carbon emission reduction measures will unavoidably elevate fuel and shipping expenses, resulting in reduced profit margins for shipping companies.
R3 includes four variables and a cyclic causal relationship. When carbon dioxide emissions increase, the associated environmental pollution losses intensify, leading to a decrease in the profit margins of shipping companies. Reduced profits for liner shipping companies could result in decreased capacity offered by shipping companies. A decrease in cargo volume, specifically containers in this study, which signifies lower shipping demand, leads to a reduction in trips (or voyages) and consequently fewer vessels.
R4 comprises four variables. When carbon dioxide emissions increase, shipping companies reduce ship emissions by lowering the vessel’s sailing speed, leading to a decrease in carbon dioxide emissions. This reduction in emissions is achieved through lower energy consumption, although it results in an increase in voyage duration.
R5 involves seven variables. As carbon dioxide emissions in shipping rise, the application of carbon taxation as an emission reduction strategy comes into play. When carbon taxes are imposed, companies respond by implementing measures such as altering fuel compositions, which result in heightened fuel costs and, consequently, increased shipping expenses. The increased shipping expenses may result in an increase in freight rates. However, the interplay between the freight rate market and shipping company strategies is a complex dynamic influenced by the prevailing economic conditions, particularly the strength of the market. In a strong freight rate market, where demand for shipping services exceeds supply, shipping companies often have more leverage. During such periods, they are more likely to pass on additional costs, such as those incurred from carbon taxes or increased fuel expenses to the customers through higher freight rates. This approach is feasible because customers are willing to pay higher prices due to the robust demand for shipping services. In this scenario, shipping companies may prioritize maintaining their profit margins and overall financial health. Conversely, in a weak freight rate market where supply surpasses demand, shipping companies face a more competitive environment. Under these conditions, they might find it challenging to pass on all additional costs to customers through higher freight rates. Instead, they could absorb a portion of the costs themselves to remain competitive and attract business. This absorption of costs can impact their profit margins.
R6 includes five variables. In the context of carbon taxation, shipping companies aim to reduce costs by adjusting ship speed to impact the vessel’s operational power, ultimately affecting total emissions from the ships.
R7 comprises five variables. When the total revenue of shipping companies increases, it leads to an increase in the number of voyages, impacting the carbon dioxide emissions per voyage. As carbon dioxide emissions increase, the implementation of carbon taxation policies results in substantial tax levies on shipping companies, prompting them to adopt more stringent emission reduction measures.

2.3.3. Establishment of Stock Flow Diagram

The basic elements of a stock and flow diagram include stock variables, rate variables, auxiliary variables, and constants. The stock and flow diagram of the low-carbon development system in shipping illustrates the causal relationships between different variables in the system, as shown in Figure 3.
As shown in Figure 3, variables represented by rectangular boxes are stock variables. Arrows going in and out of cloud-shaped symbols represent rate variables. Inputs without arrows indicate constants, and other variables are auxiliary variables. Each stock variable represents the cumulative value over a certain period, which is the difference between its inflow and outflow. In this diagram, there are three stock variables: “Total Revenue of Shipping Companies”, “Total CO2 Emissions”, and “Number of Voyages on Route”. Rate variables reflect the rate of change of stock variables and include both inflow and outflow. Five rate variables are depicted in the figure. Taking “Total Revenue” as an example, it is a stock variable. Its inflow variables include the increase in income and shipping income. Its outflow variable is the decrease in income. If the increase in income is greater than the decrease in income, the total revenue will increase.
Conversely, if the increase in income is less than the decrease in income, the total revenue will decrease. Auxiliary variables are intermediate variables between stock variables and flow variables. In the diagram, there are numerous auxiliary variables that help describe the underlying mechanisms within the system. Constants refer to system parameters with fixed values, such as engine power and carbon emission factors. These constants are determined through investigation and are inputted into the model to establish mathematical relationships between variables.
(1)
Total revenue of shipping companies (in Billion RMB)
T = ( T i T d ) d t + I V
where, T : total revenue of shipping companies, T i : revenue increase, T d : revenue decrease, I V : initial value
(2)
Revenue increase (in Billion RMB)
T i = S I + S B
where, T i : revenue increase, S I : shipping income, S B : shipping subsidy.
(3)
Carbon tax (in Billion RMB)
C T = C R × C t × 10 4
where, C T : carbon tax, C R : carbon tax rate, C t : total carbon dioxide emission
(4)
Revenue decrease (in Billion RMB)
T i = C T + L + S E T
where L : revenue decreases due to pollution loss and the S E T : energy consumption cost of the ship.
(5)
Total carbon dioxide emissions (in Million tons)
Total CO2 emissions are an integral of annual CO2 emissions and can be obtained as follows:
C t = C a d t + C 0
where, C t : total carbon dioxide emissions, C a : annual CO2 emissions, C 0 : initial value
(6)
Annual CO2 emissions (in Million tons)
Annual CO2 emissions are the sum of carbon emissions from all fuels and can be expressed as:
C a = C j
where C j : Carbon dioxide emissions from fuel j.
(7)
Emissions from every kind of fuel (in Million tons)
Emissions from each kind of fuel could be modeled as below:
C j = F C j ε j
where F C j : CO2 emissions from fuel j are the ε j : CO2 emission factor for fuel j.
(8)
Fuel consumption (in Million tons)
With the global development of carbon reduction technologies for ships, alternative fuels such as MDO and LNG are being used on ships. Different fuels have different carbon emission factors, and the consumption of different fuels and the associated CO2 emissions are listed separately in the Supplementary Materials. In this paper, coefficient α is introduced to indicate the utilization rates of different types of fuels.
F C j = E t i α j s f c j
where, E t i : total energy consumption in year i in kwh, α j : usage rate of fuel j in percentage, s f c j : specific fuel consumption of fuel j in million ton/kwh.
(9)
Total energy consumption (kwh)
Here, only the energy consumption of the ship while sailing is considered.
E t i = n v i E S
where, n v i : number of shipping voyage per year i , E s : energy consumption in shipping each voyage kwh.
(10)
Number of shipping voyages
In a general context, as the volume of trade expands, there is a corresponding increase in the number of vessel voyages. The number of voyages can be assumed to align with the average growth rate of maritime trade along the specific route.
n v i = n v 0 + 0 i n v t G R v d t
where n v 0 : Number of voyages in the first year G R v : Average annual growth rate of the ship.
(11)
Energy consumption in shipping each voyage (kw)
E s = P 0 T s N
where, P 0 : average operation power of the vessel in kw, T s : sailing time in hours, N : Number of vessels.
(12)
Average operating power of the vessel (kw)
P 0 = P A + P M
where, P A : Average operating power of auxiliary engines during the voyage. P M : Average operating power of the main engine during the voyage.
(13)
Operating power of ship’s main engine (kw)
P M = P D M ( V V D ) 3
where, P D M : Design power of ship’s main engine, V : Actual operating speed of the ship, V D : Design speed of ships.
(14)
Operating power of auxiliary engines (kw)
P A = P D A λ
where, λ : load factor of auxiliary engine, P D A : design power of auxiliary engine.
(15)
Sailing time (h)
Referring to reference [25], different types of ships have different sailing distances; therefore, a distance adjustment factor σ is introduced to introduce the average sailing distance.
T s = D σ V
where, D : sailing distance, σ : Distance adjustment factor.

3. Simulation Design and Model Verification

3.1. Model Design

The above SD model simulates to offer decision-making insights for carbon tax policy development. It specifically simulates shipping activities from China to the United States along the Pacific route from 2008 to 2030, with yearly intervals. The distance covered is the Shanghai-to-Los Angeles route, using container ships, specifically focusing on the Panamax type, the most common ship type according to Lloyd’s data (see Figure 4). This subsection provides detailed simulation information and analysis.

3.1.1. Ship Speed Design

The power needed for a ship to maintain a speed increases proportionally to the cube of that speed. Even a slight speed reduction during navigation significantly improves energy efficiency. Research indicates that cutting ship speed by about 2–3 knots substantially reduces fuel consumption, saving costs [50]. Thus, optimizing ship speed is crucial for energy efficiency and emission reduction.
Slow steaming effectively reduces emissions by examining how different speeds impact emissions. Slight speed reductions lead to energy savings and CO2 emission cuts. Carbon tax-based speed adjustments offer insight into CO2 reduction. Two schemes, D1 and D2, were created. After analyzing 2020 maritime activities, Panamax container ships were found to be the most common. Thus, the average speed for Panamax container ships from Shanghai to Los Angeles became the baseline. D1 involves a speed reduction, while D2 entails an increase.

3.1.2. Fuel Composition Design

Most carbon dioxide emissions from ships arise from fuel consumption. Prior to the implementation of policies, most emission reduction measures focused on improving vessel energy efficiency. Compared to traditional marine fuels, cleaner alternative fuels play a significant role in enhancing ship energy efficiency and reducing emissions. These fuels include Liquefied Natural Gas (LNG), Liquefied Petroleum Gas (LPG), biofuels, as well as low-carbon options such as hydrogen, methanol, ammonia, synthetic fuels, and hybrid solutions. Biogenic fuels and low-carbon alternatives are key to the maritime sector’s carbon reduction efforts and are gaining significant attention. Projections indicate their pivotal roles in decarbonizing shipping in the coming decade.
However, biofuel used in maritime operations is limited due to current inexperience. Widespread adoption of biofuels as marine alternatives faces barriers: diverse infrastructure needs, engine adjustments, and cost differences from conventional fuels. Cleaner options such as bio-LNG, hydrogen, methanol, ammonia, and synthetic fuels offer lower-carbon choices than HFO, MDO, and LNG. Yet, technical challenges and fuel resource availability hinder these options in the short term. While this introduces some model imprecision regarding CO2 emissions along the Shanghai-Los Angeles route, note that the paper solely focuses on this route’s emissions. Existing literature leans toward LNG for emissions reduction in shipping. Thus, using the mentioned fuels aligns better with the prevailing circumstances in simulations.
As a clean fuel, there is some debate about the actual impact of LNG on reducing carbon emissions in the global shipping industry [51]. However, it does have the potential to reduce up to 85% nitrogen oxide emissions, as well as the near-complete elimination of sulfur oxides and particulate matter emissions. Especially, the longer term, LNG offers a decarbonization pathway for shipping to become carbon neutral through the use of liquefied biomethane (LBM) produced from biomass and liquefied synthetic methane (LSM) produced from renewable electricity. In contrast to other alternative fuels such as renewable hydrogen and ammonia, LNG is now operationally proven, commercially viable, available, and scalable. Considering these factors, LNG remains one of the primary options for the shipping industry in the foreseeable future. Considering IMO regulations and the trend toward alternative fuels, LNG acts as a transitional fuel until zero-carbon goals are met. Therefore, this study chooses LNG as an alternative clean fuel for gasoline or diesel for research, excluding all forms of biofuels because their use is limited, costs are highly variable, and availability is constrained. However, it has to be clear that this is a modeling choice. The fuel used in the model construction of this study can be replaced; that is to say, the choice of the fuel during modeling will affect the relevance of the results.
To investigate the emission reduction effects of combining fuel compositions with carbon taxes, this study establishes three different fuel compositions: HFO, MDO, and LNG. Five schemes (C1, C2, C3, C4, and C5) are defined to forecast future CO2 emissions by varying the proportions of different fuel types used. Considering the adoption of green shipping corridors, the usage of LNG and MDO is gradually increasing while reducing the use of HFO in ship fuel compositions.

3.1.3. Scheme Design of Subsidy Coefficient

Japan has introduced relevant policies regarding carbon emission subsidies. Firstly, high-polluting enterprises can receive an 80% tax reduction if they take steps to reduce emissions. Secondly, companies investing in energy-saving equipment or adopting low-carbon technologies can receive subsidies or exemptions. For instance, in Denmark, legislation from 1979 provided a 30% subsidy on wind turbine prices to qualifying enterprises that invested in wind energy. Thirdly, companies participating in voluntary emission reduction agreements may receive tax incentives. In Denmark, enterprises meeting specified energy efficiency criteria in voluntary agreements can benefit from an 80% tax incentive.
Considering the current situation in China, the subsidy coefficient cannot be set too high. According to relevant research [52], subsidies based on emission reduction investments require a minimum coefficient of 0.2 or 0.3 to achieve the desired emission reduction. Therefore, this study adopts subsidy coefficients of 0.2 and 0.3.

3.1.4. Carbon Tax Rate Design

IMO recognizes that current emission reduction measures alone will not achieve its 2050 carbon reduction goal of 50% from 2018 levels. To tackle this, a carbon tax system is proposed. It aims to regulate carbon-emitting enterprises by taxing emissions, driving up carbon costs, encouraging energy savings, and reducing emissions. This tax system is designed to promote substantial emission cuts, contributing to maritime industry sustainability. China employs three tax rate types: progressive, proportional, and fixed. To control absolute carbon emissions and align with the 2030 carbon peak commitment in the Paris Agreement, a fixed tax rate is recommended [53].
The minimum carbon tax rate, according to research [31], is 40 yuan per ton of carbon. However, for coordination with the carbon trading market, China suggests the rate fluctuate with market prices [54]. Currently, the rate references 2020s eight carbon emission rights pilot exchanges’ total transaction price, which was 32.821 yuan per ton of CO2 [55]. Considering various recommendations and market data, this study adopts a minimum carbon tax rate of 40 yuan per ton.
According to previous research [41,42,43], this study established a total of 13 different schemes, as outlined in Table 3. The Business-as-Usual (BAU) scheme serves as the control group, representing the continuation of the current system development without policy intervention (policy intervention set to 0). In this study, “A” signifies changes in carbon taxation, “B” represents alterations in the subsidy coefficient, and “C” indicates adjustments in fuel composition. Specifically, A1 to A4 denote varying carbon tax rates of 40, 50, 60, and 70 while maintaining consistent subsidy coefficients, fuel composition, and average speed. B1 and B2 denote distinct subsidy coefficients of 20% and 30%, respectively, with consistent carbon tax rates, fuel composition, and average speed. C1 to C5 reflect different fuel compositions while maintaining constant carbon tax rates, subsidy coefficients, and average speeds. D1 and D2 signify differing average speeds of 13 kn and 15 kn, respectively, alongside consistent carbon tax rates, fuel composition, and subsidy coefficients. Additional details can be found in Table 3.

3.2. Model Validation

To ensure the credibility of the model, it is crucial to assess its validity. Consequently, the established system dynamics model needs to undergo validation procedures in line with the existing literature. Model validation encompasses various methods, such as adaptive testing, sensitivity testing, validity testing, and historical testing. In this study, adaptive testing and sensitivity testing were analyzed.

3.2.1. Adaptive Testing

The model is assessed from two angles. First, the unit test checks if the assigned units for each variable are meaningful. This test in the SD model is passed, confirming the practical relevance of each variable’s units. Second, a structural test is conducted. While the system dynamics model simplifies the real system and cannot replicate all its complexities, it is vital for the model to maintain the same structure as the actual system to ensure its validity. Using the “Model Check” function in Vensim PLE software, this study verifies the presence of feedback loops in the model to confirm its reasonableness. The successful execution of the model means it has passed the structural consistency test, indicating it structurally resembles the actual system and captures essential features through feedback mechanisms.

3.2.2. Sensitivity Analysis

The fuel composition is selected as the sensitivity analysis, and the schemes A1, C2, C4, and C5 are selected as the fuel composition sensitivity analysis samples.
Figure 5a illustrates that the total carbon dioxide emissions exhibit significant variations depending on the proportion of fuel usage in schemes where the average navigation speed remains constant. Specifically, when the usage of heavy fuel oil (HFO) is highest and liquefied natural gas (LNG) usage is lowest, the total carbon dioxide emissions increase substantially. In scheme C2, where LNG consumption surpasses HFO consumption, the emissions are the lowest among the three schemes. Figure 5b presents a stacked area chart that demonstrates the contribution rate of each variable. The height of the broken lines represents the relative value of each variable. Notably, changing the fuel composition under different schemes results in significant changes. It is evident from the figure that scheme C2 occupies the smallest area, indicating the lowest carbon dioxide emissions.
The disparity in fuel composition between schemes A1 and C2 primarily lies in the utilization rates of HFO and LNG. In comparison to scheme C4, there are notable differences in the utilization rates of HFO and MDO, which helps explain why the substitution of LNG for HFO leads to a certain degree of emission reduction. In scheme C5, the utilization rate of HFO is the lowest, while the utilization rate of MDO exceeds that of LNG. Consequently, in terms of emissions, scheme C5 does not yield as significant a reduction as scheme C2, despite the changes in fuel utilization rates.
On the other hand, schemes C2 and C4 differ predominantly in the utilization rates of LNG and MDO. The findings indicate that the reduction in CO2 emissions is primarily attributed to the substitution of HFO with LNG. This is because MDO and HFO have comparable fuel consumption ratios and emission factors, while the carbon emission factors of LNG and HFO differ significantly.
By examining the overall trend of the stacked area chart, one can gain insights into the overall impact of changes in fuel composition parameters on the output results. A significant change in the chart signifies that the structural parameters exert a substantial influence on the output results. Conversely, a small change in the area suggests that the structural parameters have minimal impact on the output results. In Figure 5b, as time progresses, the disparity in area among the four schemes becomes more pronounced, indicating that the fuel composition changes within this range exhibit high sensitivity to the output results. As a result, the sensitivity analysis established in this study has successfully passed the test, and the experimental results and operational effects have been deemed satisfactory.

4. Results and Discussion

4.1. Impact of Carbon Tax Rate

Figure 6a presents the revenue situation of maritime companies under different carbon tax schemes, while Figure 6b illustrates the corresponding variations in their carbon dioxide emissions. The left subfigure in both graphs serves as the parent figure, while the right subfigure represents a specific momentary display. Simulation results demonstrate that the imposition of carbon taxes can effectively reduce the carbon emissions from ships. A higher carbon tax rate leads to a more pronounced emission reduction effect; however, the overall impact remains modest. Under the BAU scheme, the blank control condition, ships exhibit the highest carbon emissions. Considering the implementation of carbon taxes at rates of 40 yuan/ton, 50 yuan/ton, and 60 yuan/ton, the carbon emissions from ships will gradually decrease.
Nevertheless, the imposition of carbon taxes results in a decline in the total revenue of maritime companies. In comparison with the BAU scheme, where the total revenue of maritime companies in 2018 amounted to 1710.69 billion RMB, the total revenue decreases to 1710.19 billion RMB, 1710.07 billion RMB, and 1709.95 billion RMB when the tax rates are set at 40 yuan/ton, 50 yuan/ton, and 60 yuan/ton, respectively. It is evident that an increase in the carbon tax rate exerts a certain adverse impact on the economic development of maritime companies, aligning with empirical observations.
These findings indicate that the increase in the carbon tax rate has a certain negative impact on the economic development of shipping companies, which aligns with real-world circumstances.

4.2. Combination Impact of Carbon Tax and Speed Reduction

Figure 7 represents the carbon dioxide emissions from ships after reducing vessel speed. The simulation results indicate that reducing vessel speed effectively decreases carbon dioxide emissions. When ships increase or decrease their speed by 1 knot, the emissions from reducing vessel speed are significantly lower compared to the BAU scheme. Taking the year 2018 as an example, the carbon dioxide emissions under the BAU conditions were 460.329 million tons, while under the D1 scheme, they were 440.0498 million tons, and under the D2 scheme, they were 484.865 million tons. This reduction is attributed to the cubic relationship between energy consumption and vessel speed, as described by Equation (16).
E = C V 3
where E represents energy consumption and V represents sailing speed. When the sailing speed is slightly reduced, it results in a significant reduction in carbon dioxide emissions.
Figure 8 displays CO2 emissions from ships in schemes combining carbon taxation and reduced vessel speed. Compared to the BAU scheme, different speed settings, high and low, were applied. The graph clearly shows that the D2 scheme (vessel speed at 15 knots) results in significantly higher emissions than D1. Adjusting the average vessel speed leads to notably lower carbon dioxide emissions in D1 compared to the baseline scheme and situations with only carbon taxes. This highlights the effectiveness of emission reduction achieved by combining reduced vessel speed with carbon taxation.
Taking the year 2018 as an example, when the carbon tax rate is set at 40 yuan/ton, the CO2 emissions under scheme A1 amount to 460.329 million tons, with a total revenue of 1710.19 billion RMB. Under the combined policy schemes of D1 and D2, the carbon emissions are 440.498 million tons and 484.865 million tons, respectively, while the total revenues are 1710.22 billion RMB and 1710.16 billion RMB, respectively. Comparing these with scheme A1, the CO2 emission reduction rate for scheme D1 is 4.3%, and for scheme D2, it is −5.3%. It is evident that reducing vessel speed yields better carbon emission reduction results while also contributing to economic development. This can be interpreted as the circumstance in which, with decreased vessel speed, maritime enterprises require no additional funds for other emission reduction measures, and the amount payable for carbon taxes also experiences a reduction. These results demonstrate that the combined use of carbon taxation and reduced vessel speed can achieve significant emission reduction outcomes.
Slowing down maritime vessel speeds, as one of the strategies for carbon emission reduction, can contribute to the attainment of the IMOs emissions reduction objectives to a certain extent, particularly within the short-term horizon. However, the emissions reduction measures achieved through the reduction of ship speed are inherently constrained, offering only a limited decrease in vessel emissions. This reduction is bounded by the fact that diminished ship speed adversely impacts transportation efficiency, subsequently giving rise to elevated transportation costs. Moreover, the decrease in ship speed has the potential to compromise the punctuality and security of cargo delivery.

4.3. Combination Impact of Carbon Tax and Carbon Tax Subsidy

Figure 9 represents the CO2 emissions from ships under the combined policies of carbon taxation and subsidies. The simulation results demonstrate that the joint implementation of carbon taxation and subsidies does not hinder CO2 emissions from the maritime industry; in fact, it can even lead to emission reductions.
Taking the simulated data for the year 2018 as an example, with a carbon tax rate of 40 yuan/ton, scheme A1 resulted in CO2 emissions of 460.329 million tons and a total revenue of 1710.19 billion RMB. Under the combined emission reduction policies, schemes B1 and B2 yielded CO2 emissions of 460.3292 million tons and 460.3294 million tons, with total revenues of 1710.29 billion RMB and 1710.34 billion RMB, respectively.
These two schemes demonstrate a certain level of CO2 emission reduction, with the decrease in total revenue mainly attributed to the partial nature of the subsidies provided by the government. The impact of carbon taxation on enterprises outweighs the effects of subsidies.

4.4. Impact of Carbon Tax and Fuel Composition

Figure 10 presents the CO2 emissions from ships under a carbon tax and different fuel compositions. The simulation results indicate that, in terms of environmental benefits, altering the energy structure and increasing the consumption ratio of LNG and MDO can have a positive impact on reducing carbon dioxide emissions. These changes lead to a reduction in emissions when compared to the baseline scenario, emphasizing the importance of considering different fuel compositions for achieving emission reduction goals.
Taking 2018 as an example, when the proportion of LNG consumption is at its highest, the carbon dioxide emissions decrease to 368.042 million tons, which is a 20% reduction compared to the baseline scenario without changes in the fuel composition (scheme A1). Furthermore, it shows a 19.4% reduction compared to the scenario with only increased consumption of marine diesel oil (scheme C4). When simultaneously increasing the consumption ratio of LNG and MDO, the resulting carbon dioxide emissions are 412.499 million metric tons. Specifically, schemes C1, C3, C4, and C5 yield carbon dioxide emissions of 414.185 million tons, 458.592 million tons, and 412.449 million tons, respectively.
Overall, scheme C2 exhibits the most effective emission reduction. From an economic perspective, increasing the use of clean energy in the context of green shipping channels can alleviate the burden of paying a carbon tax. The total income of shipping companies in scheme C2 is 171.025 billion RMB, which exceeds the income in scheme A1. Similarly, the total income of schemes C1, C3, C4, and C5 is 1710.22 billion RMB, 1710.17 billion RMB, 1710.16 billion RMB, and 1710.2 billion RMB, respectively. Using liquefied natural gas can bring certain economic benefits. Through comparing five different scenarios, it can be observed that increasing the utilization of LNG yields the best emission reduction results.

5. Conclusions and Suggestion

To investigate the effectiveness of carbon emission reduction in the shipping industry, this study establishes a system dynamics model. Various combinations of carbon tax rates, shipping subsidies, different fuel compositions, and voyage speeds are set as parameters to evaluate their impact on carbon emissions. The effectiveness of emission reduction measures was evaluated by examining carbon dioxide emissions over the year. Here are the main findings:
(1)
The imposition of a carbon tax contributes to the reduction of carbon dioxide emissions from ships. Higher carbon tax rates lead to more pronounced emission reduction effects, although the overall impact on emissions may not be substantial. However, it is important to note that the carbon tax can negatively affect the total income of shipping companies.
(2)
Among the 13 emission reduction measures examined, scheme C2 demonstrates the most effective carbon emission reduction. This highlights that the combination of fuel composition adjustments can effectively mitigate the increase in CO2 emissions. Specifically, among the fuel composition adjustment measures, LNG proves to be the most effective transitional fuel in terms of emission reduction.
(3)
Slowing ship speeds effectively cuts emissions and enhances energy efficiency. This approach reduces emissions without additional financial investments in reduction measures or carbon taxes. Combining carbon tax and speed reduction produces superior results, reducing emissions while promoting economic development. Carbon taxation and subsidies together contribute to emission reduction. The tax’s impact on shipping firms outweighs subsidies, emphasizing their importance in emission policies. Altering fuel composition, particularly favoring cleaner energy sources, significantly reduces carbon emissions, outperforming the baseline scenario.
(4)
Combining a carbon tax, ship speed reductions, and fuel composition changes results in more significant emission reductions compared to implementing a carbon tax alone. However, there is an exception where a solitary carbon tax policy outperforms the combination of carbon tax and subsidies. These findings encourage shipping companies to consider speed reduction and fuel composition changes for effective emission reduction.
In summary, our model effectively simulates dynamic carbon emission reductions during ship navigation along specific routes. It accounts for factors such as shipping, energy, the environment, policy, and the economy. Profitability influences voyage numbers, which, in turn, affects ship quantities and carbon emissions, impacting economic development. Reducing carbon dioxide emissions is a dynamic, systemic process requiring stakeholder involvement. Technological measures and carbon taxation policies are significant in reducing emissions on shipping routes. Market mechanisms are emerging as a vital trend for regional emission reductions in the future.
Based on the findings, this study argues that while meeting transportation demands, it is advisable to appropriately reduce ship speeds to achieve maximum economic and environmental benefits. In the early stages of clean energy promotion, shipping companies can mitigate the pressure of carbon emissions by reducing ship speeds. When setting carbon tax rates, a balance should be struck between environmental and economic benefits. Carbon taxation serves as an effective means to control carbon dioxide emissions; however, excessively high carbon taxes can adversely affect the economic viability of shipping enterprises, while excessively low taxes may undermine emission reduction efforts. The design of carbon taxes should consider the capacity of businesses and ensure the continued development of the shipping industry.
Additionally, shipping companies should actively promote the use of clean energy and facilitate the adjustment of the energy structure. The transition from traditional heavy fuel oil to clean fuels and biofuels during ship navigation along routes can effectively reduce pollution emissions. However, cleaner options such as hydrogen, methanol, ammonia, and synthetic fuels’ use in maritime operations is limited due to current inexperience. Widespread adoption of biofuels as marine alternatives faces barriers. The technical challenges and fuel resource availability hinder these options in the short term. Longer term, LNG offers a decarbonization pathway for shipping to become carbon neutral through the use of LBM produced from biomass and the LSM produced from renewable electricity. From a regulatory standpoint, proactive fuel usage regulations should be enacted to incentivize the shift from heavy fuel oil to alternative clean fuels, or biofuels. Shipping companies should also actively promote advancements in carbon reduction technologies and explore alternative energy sources. Governments should coordinate the relationship between carbon taxation in the shipping industry and the economic development of enterprises while establishing corresponding oversight mechanisms.
This paper presents two primary contributions compared to previous research. Firstly, in contrast to prior studies that solely compared individual emission reduction measures, this paper introduces an innovative integration of carbon taxation to examine the cumulative emission reduction effects of combined policies. Secondly, while the majority of maritime carbon reduction studies have focused on regional emissions, this paper combines vessel-specific CO2 emissions during voyages with the SD model for analysis, offering insights into China’s active participation in international green shipping corridors. It constructs a comprehensive maritime carbon reduction framework, evaluating the impact of various emission reduction measures on shipping enterprises’ revenue and CO2 emissions. Simulation results indicate that the implementation of carbon taxes effectively achieves emission reduction, with the most substantial reduction potential realized through the employment of combined policy measures.
The outcomes of this study offer valuable insights and serve as a point of reference for policymakers, shipping companies, and researchers engaged in the low-carbon transition of the shipping industry. Nonetheless, it is essential to acknowledge certain limitations within this study. In practice, additional emission reduction measures, such as the utilization of “zero-carbon fuel” and carbon capture and storage technology, exist but were not fully accounted for in this study. In addition, this study chooses HFO, MDO, and LNG only, excluding all forms of biofuels because their use is limited, costs are highly variable, and availability is constrained. However, it has to be clear that this is a modeling choice that will affect the relevance of the results. Furthermore, the discharge from ports was not factored into the analysis, leading to certain deficiencies in the simulated data. In the future, it is crucial to address these limitations. This can be achieved by considering a more comprehensive range of emission reduction measures, including low and zero carbon fuels, incorporating more detailed and accurate data, enhancing the model, and expanding the research scope to provide a more comprehensive and enriched analysis. By addressing these shortcomings, future research can contribute to a more robust understanding of ship carbon emission reduction, allowing for more informed decision-making and facilitating the low-carbon transformation of the shipping industry.

Supplementary Materials

The following supporting information can be downloaded at: https://www.mdpi.com/article/10.3390/su151813907/s1, File S1: Input parameters and calculation equations for the SD model. File S2: Basic variables and values for the SD model.

Author Contributions

Conceptualization, X.G.; methodology, X.G. and Q.Y.; software, A.Z.; validation, A.Z. and Q.Y.; formal analysis, A.Z., X.G. and Q.Y.; investigation, A.Z.; data curation, A.Z.; writing—original draft preparation, A.Z.; writing—review and editing, X.G. and Q.Y.; funding acquisition, X.G. All authors have read and agreed to the published version of the manuscript.

Funding

This research was funded by the Shanghai Philosophy and Social Science Planning Project, grant number 2020BGL036.

Institutional Review Board Statement

Not applicable.

Informed Consent Statement

Not applicable.

Data Availability Statement

The original contributions presented in this study are included in the article. Further inquiries can be directed to the corresponding author.

Acknowledgments

The authors would like to thank the support of the Shanghai Philosophy and Social Science Planning Project (Grant No.2020BGL036). The authors also acknowledge the anonymous reviewers for their suggestions that improved the manuscript.

Conflicts of Interest

The authors declare that the research was conducted in the absence of any commercial or financial relationships that could be construed as a potential conflict of interest.

References

  1. Li, X.; Sun, B.; Guo, C.; Duo, W.; Li, Y. Speed optimization of a container ship on a given route considering voluntary speed loss and emissions. Appl. Ocean Res. 2020, 94, 101995. [Google Scholar] [CrossRef]
  2. IMO. The Fourth IMO GHG Study 2020. Available online: http://www.Maritimecyprus.com/wp-content/uploads/2021/03/4th-IMO-GHG-Study-2020.pdf (accessed on 10 July 2023).
  3. Wissner, N.; Healy, S. Raising Ambition Levels at the IMO for 2050—An Overview of the Key Issues at Stake at MEPC 80; EPRS, European Parliamentary Research Service: Brussels, Belgium, 2023. [Google Scholar]
  4. Pham, V.V.; Hoang, A.T.; Do, H.C. Analysis and evaluation of database for the selection of propulsion systems for tankers. AIP Conf. Proc. 2020, 2235, 020034. [Google Scholar]
  5. Tan, J.; Wang, R. Research on evaluation and influencing factors of regional ecological efficiency from the perspective of carbon neutrality. J. Environ. Manag. 2021, 294, 113030. [Google Scholar] [CrossRef]
  6. Zhou, P.; Wang, H. Carbon capture and storage—Solidification and storage of carbon dioxide captured on ships. Ocean Eng. 2014, 91, 172–180. [Google Scholar] [CrossRef]
  7. Chen, X.; Lin, B. Towards carbon neutrality by implementing carbon emissions trading scheme: Policy evaluation in China. Energy Policy 2021, 157, 112510. [Google Scholar] [CrossRef]
  8. Jimenez, V.J.; Kim, H.; Munim, Z.H. A review of ship energy efficiency research and directions towards emission reduction in the maritime industry. J. Clean. Prod. 2022, 366, 132888. [Google Scholar] [CrossRef]
  9. Bouman, E.A.; Lindstad, E.; Rialland, A.I.; Strømman, A.H. State-of-the-art technologies, measures, and potential for reducing GHG emissions from shipping—A review. Transp. Res. Part D Transp. Environ. 2017, 52, 408–421. [Google Scholar] [CrossRef]
  10. Glykas, A.; Papaioannou, G.; Perissakis, S. Application and cost-benefit analysis of solar hybrid power installation on merchant marine vessels. Ocean Eng. 2010, 37, 592–602. [Google Scholar] [CrossRef]
  11. Liu, J.; Song, R.; Nasreen, S.; Hoang, A.T. Analysis of the complementary property of solar energy and thermal power based on coupling model. Nat. Environ. Pollut. Technol. 2019, 18, 1675–1681. [Google Scholar]
  12. Hoang, A.T.; Pham, V.V. A study on a solution to reduce emissions by using hydrogen as an alternative fuel for a diesel engine integrated exhaust gas recirculation. AIP Conf. Proc. 2020, 2235, 020035. [Google Scholar]
  13. Joung, T.H.; Kang, S.G.; Lee, J.K.; Ahn, J. The IMO initial strategy for reducing Greenhouse Gas (GHG) emissions, and its follow-up actions towards 2050. J. Int. Mar. Saf. Environ. Aff. Ship. 2020, 4, 1–7. [Google Scholar] [CrossRef]
  14. Wang, Y.; Cao, Q.; Liu, L.; Wu, Y.; Liu, H.Y.; Gu, Z.Y.; Zhu, C.X. A review of low and zero carbon fuel technologies: Achieving ship carbon reduction targets. Sustain. Energy Technol. Assess. 2022, 54, 102762. [Google Scholar] [CrossRef]
  15. Brahim, T.; Wiese, F.; Münster, M. Pathways to climate-neutral shipping: A Danish case study. Energy 2019, 188, 116009. [Google Scholar] [CrossRef]
  16. Garcia, B.; Foerster, A.; Lin, J. The Shipping Sector and GHG Emissions: The Initial Strategy for a Zero-Carbon Pathway. Available online: https://law.nus.edu.sg/apcel/wp-content/uploads/sites/3/2020/06/013_2020_Jolene.pdf (accessed on 10 July 2023).
  17. Xing, H.; Stuart, C.; Spence, S.; Chen, H. Alternative fuel options for low carbon maritime transportation: Pathways to 2050. J. Clean. Prod. 2021, 297, 126651. [Google Scholar] [CrossRef]
  18. McKinlay, C.J.; Turnock, S.R.; Hudson, D.A. Route to zero emission shipping: Hydrogen, ammonia or methanol. Int. J. Hydrog. Energy 2021, 46, 28282–28297. [Google Scholar] [CrossRef]
  19. Xia, Z.C.; Guo, Z.J.; Wang, W.Y.; Jiang, Y. Joint optimization of ship scheduling and speed reduction: A new strategy considering high transport efficiency and low carbon of ships in port. Ocean Eng. 2021, 233, 109224. [Google Scholar] [CrossRef]
  20. Zhuge, D.; Wang, S.A.; Wang, D.Z.W. A joint liner ship path, speed, and deployment problem under emission reduction measures. Transp. Res. Part B Methodol. 2021, 144, 155–173. [Google Scholar] [CrossRef]
  21. Chen, K.; Xin, X.; Niu, X.Y.; Zeng, Q.C. Coastal Transportation System Joint Taxation-Subsidy Emission Reduction Policy Optimization Problem. J. Clean. Prod. 2019, 247, 119096. [Google Scholar] [CrossRef]
  22. Sheng, D.; Meng, Q.; Li, Z.C. Optimal vessel speed and fleet size for industrial shipping services under the emission control area regulation. Transp. Res. Part C Emerg. Technol. 2019, 105, 37–53. [Google Scholar] [CrossRef]
  23. Chang, C.C.; Wang, C.M. Evaluating the effects of green port policy: Case study of Kaohsiung harbor in Taiwan. Transp. Res. Part D Transp. Environ. 2012, 17, 185–189. [Google Scholar] [CrossRef]
  24. Wan, Z.; El Makhloufi, A.; Chen, Y.; Tang, J.Y. Decarbonizing the international shipping industry: Solutions and policy recommendations. Mar. Pollut. Bull. 2018, 126, 428–435. [Google Scholar] [CrossRef] [PubMed]
  25. Ding, S.; Zhang, M.; Song, Y. Exploring China’s carbon emissions peak for different carbon tax scenarios. Energy Policy 2019, 129, 1245–1252. [Google Scholar] [CrossRef]
  26. Grzelakowski, A.S.; Herdzik, J.; Skiba, S. Maritime shipping decarbonization: Roadmap to meet zero-emission target in shipping as a link in the global supply chains. Energy 2022, 15, 6150. [Google Scholar] [CrossRef]
  27. Zhu, M.; Yuen, F.K.; Ge, J.W.; Li, K.X. Impact of maritime emissions trading system on fleet deployment and mitigation of CO2 emission. Transp. Res. Part D Transp. Environ. 2018, 62, 474–488. [Google Scholar] [CrossRef]
  28. Ma, N.; Yin, G.W.; Li, H.J.; Sun, W.L.; Wang, Z.; Liu, G.; Xie, D. The optimal industrial carbon tax for China under carbon intensity constraints: A dynamic input–output optimization model. Environ. Sci. Pollut. Res. 2022, 29, 53191–53211. [Google Scholar] [CrossRef] [PubMed]
  29. Song, G.; Wang, Y.; Jiang, Y. Carbon emission control policy design based on the targets of carbon peak and carbon neutrality. Chin. J. Popul. Resour. Environ. 2021, 31, 55–63. [Google Scholar]
  30. Lin, B.; Jia, Z. The energy, environmental and economic impacts of carbon tax rate and taxation industry: A CGE based study in China. Energy 2018, 159, 558–568. [Google Scholar] [CrossRef]
  31. Gao, X.; Zhang, Y. Feasibility study of China’s carbon tax system under the carbon neutrality target-based on the CGE model. Sustainability 2023, 15, 1026. [Google Scholar] [CrossRef]
  32. Lee, T.C.; Chang, Y.T.; Lee, P.T.W. Economy-wide impact analysis of a carbon tax on international container shipping. Transp. Res. Part A Policy Pract. 2013, 58, 87–102. [Google Scholar] [CrossRef]
  33. Liu, J.; Bai, J.; Deng, Y.; Chen, X.H.; Liu, X. Impact of energy structure on carbon emission and economy of China in the scenario of carbon taxation. Sci. Total Environ. 2021, 762, 143093. [Google Scholar] [CrossRef]
  34. Fu, Y.; Huang, G.; Liu, L.R.; Zhai, M.Y. A factorial CGE model for analyzing the impacts of stepped carbon tax on Chinese economy and carbon emission. Sci. Total Environ. 2021, 759, 143512. [Google Scholar] [CrossRef] [PubMed]
  35. Li, Z.; Dai, H.; Sun, L.; Xie, Y.; Liu, Z.; Wang, P.; Yabar, H. Exploring the impacts of regional unbalanced carbon tax on CO2 emissions and industrial competitiveness in Liaoning province of China. Energy Policy 2018, 113, 9–19. [Google Scholar] [CrossRef]
  36. Guo, Z.Q.; Zhang, X.P.; Zheng, Y.H.; Rao, R. Exploring the impacts of a carbon tax on the Chinese economy using a CGE model with a detailed disaggregation of energy sectors. Energy Econ. 2014, 45, 455–462. [Google Scholar] [CrossRef]
  37. Rebs, T.; Brandenburg, M.; Seuring, S. System dynamics modeling for sustainable supply chain management: A literature review and systems thinking approach. J. Clean. Prod. 2019, 208, 1265–1280. [Google Scholar] [CrossRef]
  38. Song, L. Study on endogenous development trend of dry bulk shipping market. In Proceedings of the 5th International Conference on Computer Information Science and Application Technology (CISAT 2022), Chongqing, China, 29–31 July 2022. [Google Scholar]
  39. Bai, X.W.; Xu, M.Q.; Jia, H. A dynamic feedback system analysis on the mechanism of shipping freight. In Proceedings of the IEEE International Conference on Industrial Engineering and Engineering Management (IEEM), Singapore, 14–17 December 2020. [Google Scholar]
  40. Wang, Z.; Qin, C.H.; Liu, C.L.; Zhang, W. System Dynamics Simulation of CO2 Emissions from Typical Route Ships. IOP Conf. Ser. Mater. Sci. Eng. 2020, 740, 012199. [Google Scholar] [CrossRef]
  41. Geng, X.; Wen, Y.; Zhou, C.; Xiao, C. Establishment of the Sustainable Ecosystem for the Regional Shipping Industry Based on System Dynamics. Sustainability 2017, 9, 742. [Google Scholar] [CrossRef]
  42. Kong, Y.; Liu, J.; Chen, J. Exploring the carbon abatement measures in maritime supply chain: A scenario-based system dynamics approach. Int. J. Prod. Res. 2022, 61, 1–22. [Google Scholar] [CrossRef]
  43. Jing, D.Y.; Dai, L.; Hu, H.; Ding, W.Y.; Wang, Y.B.; Zhou, X.X. CO2 emission projection for Arctic shipping: A system dynamics approach. Ocean. Coast. Manag. 2021, 205, 105531. [Google Scholar] [CrossRef]
  44. Zhang, Y.R.; Meng, Q.; Ng, S.H. Shipping efficiency comparison between Northern Sea route and the conventional Asia Europe shipping route via Suez Canal. J. Transp. Geogr. 2016, 57, 241–249. [Google Scholar] [CrossRef]
  45. Winther, M.; Christensen, J.H.; Plejdrup, M.S.; Ravn, E.S.; Eriksson, Ó.F.; Kristensen, H.O. Emission inventories for ships in the arctic based on satellite sampled AIS data. Atmos. Environ. 2014, 91, 1–14. [Google Scholar] [CrossRef]
  46. Zhou, X.X.; Jing, D.Y.; Dai, L.; Wang, Y.B.; Guo, S.Q.; Hu, H. Evaluating the economic impacts of COVID-19 pandemic on shipping and port industry: A case study of the port of Shanghai. Ocean. Coast. Manag. 2022, 230, 106339. [Google Scholar] [CrossRef] [PubMed]
  47. Wen, Y.Q.; Geng, X.Q.; Wen, Y.Q.; Zhou, C.H.; Xiao, C.S. Research on system dynamics modeling for mitigation of regional vessel exhausts emissions. Environ. Sci. Technol. 2017, 40, 193–199. [Google Scholar]
  48. Milaković, A.-S.; Gunnarsson, B.; Balmasov, S.; Hong, S.W.; Kim, K.; Schütz, P.; Ehlers, S. Current status and future operational models for transit shipping along the Northern Sea Route. Mar. Policy 2018, 94, 53–60. [Google Scholar] [CrossRef]
  49. Raj, R.; Ghandeharium, S.; Kumar, A.; Geng, J.; Ma, L.W. A techno-economic study of shipping LNG to the Asia-Pacific from Western Canada by LNG carrier. J. Nat. Gas Sci. Eng. 2016, 34, 979–992. [Google Scholar] [CrossRef]
  50. Chang, C.-C.; Chang, C.-H. Energy conservation for international dry bulk carriers via vessel speed reduction. Energy Policy 2013, 59, 710–715. [Google Scholar] [CrossRef]
  51. Lindstad, E.; Eskeland, G.S.; Rialland, A.; Valland, A. Decarbonizing maritime transport: The importance of engine technology and regulations for LNG to serve as a transition fuel. Sustainability 2020, 12, 8793. [Google Scholar] [CrossRef]
  52. Wu, H.B.; Sun, Y.X.; Su, Y.T.; Chen, M.; Zhao, H.X.; Li, Q. Which is the best supply chain policy: Carbon tax, or a low-carbon subsidy? Sustainability 2022, 14, 6312. [Google Scholar] [CrossRef]
  53. Bian, J.S.; Zhao, X. Tax or subsidy? An analysis of environmental policies in supply chains with retail competition. Tour. Manag. 2020, 283, 901–914. [Google Scholar] [CrossRef]
  54. Wang, H.; Li, Y.; Bu, G. How carbon trading policy should be integrated with carbon tax policy—Laboratory evidence from a model of the current state of carbon pricing policy in China. Environ. Sci. Pollut. Res. 2023, 30, 23851–23869. [Google Scholar] [CrossRef]
  55. Zhao, X.; Wu, L.; Li, A. Research on the efficiency of carbon trading market in China. Renew. Sustain. Energy Rev. 2017, 79, 1–8. [Google Scholar] [CrossRef]
Figure 1. Diagram of shipping carbon emission reduction system.
Sustainability 15 13907 g001
Figure 2. Diagram of causal relationship.
Sustainability 15 13907 g002
Figure 3. Diagram of stock and flow.
Sustainability 15 13907 g003
Figure 4. Distribution of ships along the China-US Pacific route in 2020 (from Lloyd’s List Intelligence).
Sustainability 15 13907 g004
Figure 5. Sensitivity analysis of fuel composition (a) CO2 emissions over time for different fuel compositions (b) CO2 emissions decrease over time for different fuel compositions.
Sustainability 15 13907 g005
Figure 6. Simulation results at different carbon tax rates (a) Total revenue of the shipping company (b) Total carbon dioxide emissions.
Sustainability 15 13907 g006
Figure 7. Impact of ship speed reduction.
Sustainability 15 13907 g007
Figure 8. Combination impact of carbon tax and speed reduction.
Sustainability 15 13907 g008
Figure 9. Combination impact of carbon tax and subsidy polices.
Sustainability 15 13907 g009
Figure 10. Combination impact of carbon tax and fuel composition. (a) CO2 emissions over time for different fuel compositions (b) CO2 emissions over time for different carbon taxes and fuel compositions.
Sustainability 15 13907 g010
Table 1. Factors Classification.
SubsystemFactorReference
ShippingNumber of vessels, speed, sailing time, sailing distance, shipping income, number of ships, operational power.Jing et al. (2021) [43]
Geng et al. (2017) [41]
Zhang et al. (2016) [44]
Winther et al. (2014) [45]
EnergyTotal energy consumption, consumption of different fuels, utilization rate of different fuelsKong et al. (2022) [42]
Zhou et al. (2022) [46]
EconomicTotal revenue of shipping companies, pollution loss, ship energy consumptionWen et al. (2017) [47]
Milakovic et al. (2018) [48]
Geng et al. (2017) [41]
PolicyCarbon tax, shipping subsidyRaj et al. (2016) [49]
EnvironmentTotal carbon dioxide emissions, fuel consumption, carbon dioxide emission factorKong et al. (2022) [42]
Jing et al. (2021) [43]
Geng et al. (2017) [41]
Zhang et al. (2016) [44]
Table 2. Main feedback loop.
NotationFeedback Loop
R1Total revenue→Number of vessel voyages→Total energy consumption→Fuel emissions→Carbon dioxide emission→Pollution losses
R2Number of vessel voyages→Total energy consumption→Shipping cost→Total revenue→voyage growth rate
R3Carbon dioxide emission→Pollution losses→Total revenue→Number of vessel voyages
R4Carbon dioxide emission→Vessel speed→Sailing time→Total energy consumption
R5Carbon dioxide emission→Carbon tax→Fuel cost→Shipping cost→Profit margin→Number of vessel voyages→Total energy consumption
R6Carbon tax→Vessel speed→Vessel operating power→Total energy consumption→Carbon dioxide emission
R7Total revenue→voyage growth rate→Total energy consumption→Carbon dioxide emission→Carbon tax
Table 3. Simulation scheme design.
SchemeCarbon Tax Rate (Yuan/Ton)Subsidy CoefficientFuel CompositionAverage Speed (kn)
BAU00HFO 80%
MDO 20%
LNG 0
14
A1400HFO 80%
MDO 20%
LNG 0
14
A2500HFO 80%
MDO 20%
LNG 0
14
A3600HFO 80%
MDO 20%
LNG 0
14
B14020%HFO 80%
MDO 20%
LNG 0
14
B24030%HFO 80%
MDO 20%
LNG 0
14
C1400HFO 40%
MDO 20%
LNG 40%
14
C2400HFO 0%
MDO 20%
LNG 80%
14
C3400HFO 40%
MDO 60%
LNG 0
14
C4400HFO 0
MDO100%
LNG 0
14
C5400HFO 0
MDO 60%
LNG 40%
14
D1400HFO 80%
MDO 20%
LNG 0
13
D2400HFO 80%
MDO 20%
LNG 0
15
Disclaimer/Publisher’s Note: The statements, opinions and data contained in all publications are solely those of the individual author(s) and contributor(s) and not of MDPI and/or the editor(s). MDPI and/or the editor(s) disclaim responsibility for any injury to people or property resulting from any ideas, methods, instructions or products referred to in the content.

