Article

Evaluation of Geological Hazard Risk in Yiliang County, Yunnan Province, Using Combined Assignment Method

1
Institute of International Rivers and Eco-Security, Yunnan University, Kunming 650500, China
2
International Joint Laboratory of Critical Mineral Resource, Yunnan University, Kunming 650500, China
3
Laboratory of Critical Mineral Resource, Yunnan International Joint, School of Earth Science, Yunnan University, Kunming 650500, China
4
Yunnan Architectural Engineering Design Company Limited, Kunming 650501, China
*
Author to whom correspondence should be addressed.
Sustainability 2023, 15(18), 13978; https://doi.org/10.3390/su151813978
Submission received: 13 August 2023 / Revised: 15 September 2023 / Accepted: 18 September 2023 / Published: 20 September 2023

Abstract

:
Geological disasters are prevalent during urbanization in the mountainous areas of southwest China due to the complex geographic and fragile geologic conditions. This paper relies on the ArcGIS platform as the model operation carrier and takes Yiliang County of Yunnan Province as the research area. Nine evaluation factors such as slope and elevation were selected, and the risk assessment of geological disasters in Yiliang County is carried out by using the combination weighting method. The results show that: (1) the extremely high-risk areas and high-risk areas are distributed in the central, western, and northeastern parts of Yiliang County, of which 164 disaster points are distributed in the area, accounting for 72.56% of the total disaster points; (2) the elevation, human engineering activities, vegetation coverage, and distance from the river are the four main factors affecting the development of geological disasters in the area; (3) the proportions of extremely high-risk areas, high-risk areas, medium-risk areas, and low-risk areas in the total area of the county were 8.08%, 19.61%, 30.59%, and 41.72%, respectively; (4) the verification of the evaluation results by the receiver operating characteristic (ROC) curve shows that the evaluation accuracy is 80%, and the zoning results are consistent with the spatial and temporal distribution of historical disaster points. The combined weighting method can effectively evaluate the risk of geological disasters in Yiliang County, and the results can be used as a scientific reference for local government departments to carry out relevant work.

1. Introduction

Geological disasters are multi-factor destructive geological phenomena, with gradual or abnormal sudden changes in the geological environment due to geological or anthropogenic impacts. Consequently, the living environment may be damaged, resulting in the loss of lives and property. The geological environment, human factors, and other variables vary spatially and temporally. Each geological hazard has a unique set of disaster mechanisms, inoculated disaster conditions, development characteristics, and extent of the injury. The occurrence of a geological hazard is a complicated random process, causing powerful destruction and unexpected geological disasters resulting in incalculable damage to human society. Geological hazard evaluation studies in such areas are indispensable for improving the efficiency of disaster prevention and control and improving people’s sense of well-being and security. The identification of regions susceptible to geological hazards can be achieved by evaluating geological hazard risks and analyzing external dynamic effects. This involves overlaying the outcomes of the susceptibility evaluation with external triggering factors. In the current research, an analysis was carried out to examine the impact of various factors that contribute to geological disasters during the formation process. This was achieved through the use of qualitative or quantitative methods or a combination of both, which were used to infer the likelihood of geological disasters and their corresponding hazards in other areas within the study region. Natural and human factors were considered for geological hazard risk assessment to understand the hazard level of hazard bodies [1]. The selection of the evaluation measure and the determination of the evaluation method are two of the most crucial components due to their impacts on the objectivity, accuracy, and feasibility of the evaluation results [2]. The evaluation units previously applied by researchers include the grid unit [3,4,5], slope unit [6], watershed unit [7], and geographical unit [8]. The grid unit is suitable for areas with little topographic relief and relatively simple geological structure and is used in the data calculations and facilitation of data management, while slope units significantly impact the development of collapses, landslides, and other geological hazards, and influence the development stages of slopes and gullies [9].
On the other hand, watershed units are often used for debris flow hazard evaluation and are unsuitable for landslide hazard evaluation. The geographical units are commonly applied evaluation units due to the requirement of detailed information on the original geological data and the technical level of RS (remote sensing) interpreters [10]. Historically, geological hazard assessments have predominantly utilized qualitative evaluation methods due to the limited advancement of science and technology. These methods have demonstrated less reliability, highlighting the need for improved accuracy. However, with the advent of the 21st century, there has been a significant breakthrough in the field of geological hazard evaluations. This has been facilitated by the rapid development of various technologies, including geographic information systems (GIS) and remote sensing imagery (RS). Additionally, the introduction of information quantity theory and fuzzy mathematical theory has enhanced the qualitative and quantitative evaluation techniques utilized in geological hazard assessments. This study refers to various evaluation methods used by national and international researchers, and the more mature among them include the information method [11], the logistic regression (LR) method [12], and the neural network method [13]. Scholars increasingly favor the combination of qualitative and quantitative assignment methods. Tan et al. [14] successfully evaluated the vulnerability of a proposed highway to geological hazards by combining the information quantity method with the hierarchical analysis method. The results were corroborated by the locations of known hazards, giving them a high degree of confidence. Similarly, Ye et al. [15] conducted a geohazard evaluation of the China–Pakistan Highway section from Oitak to Bulunkou based on the total weights of the evaluation factors determined by the linear weighted combination assignment method (AHP (analytic hierarchy process)–entropy weight method). Fan et al. [16]’s evaluation coupled the geological hazards in Wenchuan County by coupling the accuracy of the information quantity calculation method with the logistic regression evaluation results of the probabilistic model. They verified the accuracy of the evaluation results obtained by the coupled model using ROC curves. Li et al. [17] applied the information quantity–logistic regression model to study the vulnerability of geological hazards in the central part of Hainan Island. The evaluation outcomes demonstrated a notable improvement in terms of minimizing subjective interference in the assignment of evaluation factors. This enhancement led to the development of more reasonable weights for the evaluation criteria. These findings, in turn, serve as a scientific reference basis for future geological hazard risk assessments in the central region of Hainan Island. Qin et al. [18] combined the deterministic coefficient–logistic regression coupled model for the evaluation of geohazard susceptibility in Kaiyang County, Guizhou Province. The results showed that the evaluation accuracy of the coupled model was higher than that of the single model, and the problems of determining the weights of the evaluation factors and discarding the covariance indices were also solved. Devkota et al. [19] employed GIS-based certainty factors, an entropy index, and logistic regression models to evaluate landslide susceptibility, focusing on the Mugling–Narayanghat road section in the Nepal Himalaya; their results indicated that the model demonstrated high performance. Riegel et al. [20] utilized a geographic information system (GIS) and logistic regression model to investigate landslide susceptibility in Novo Hamburgo, with the model effectively determining the landslide occurrence probability and exhibiting strong predictive capabilities. Merghadi et al. [21] conducted research in the Mira Basin in North Africa, focusing on the prediction accuracy of five machine-learning models, including random forest, boosting gradient machines, and neural networks, for assessing the susceptibility to landslide geological hazards. The results demonstrated that the random forest model exhibited superior prediction accuracy.
This study evaluated the geological hazards in Yiliang County in the context of the geological and disaster-prone environment of the area by a coupled weighting method using a raster cell as the evaluation unit. The geological hazard zonation was also carried out to provide a theoretical basis for the research work on the prevention and control of disasters and the rational organization of the land space in the county.

2. Study Area Overview and Data Sources

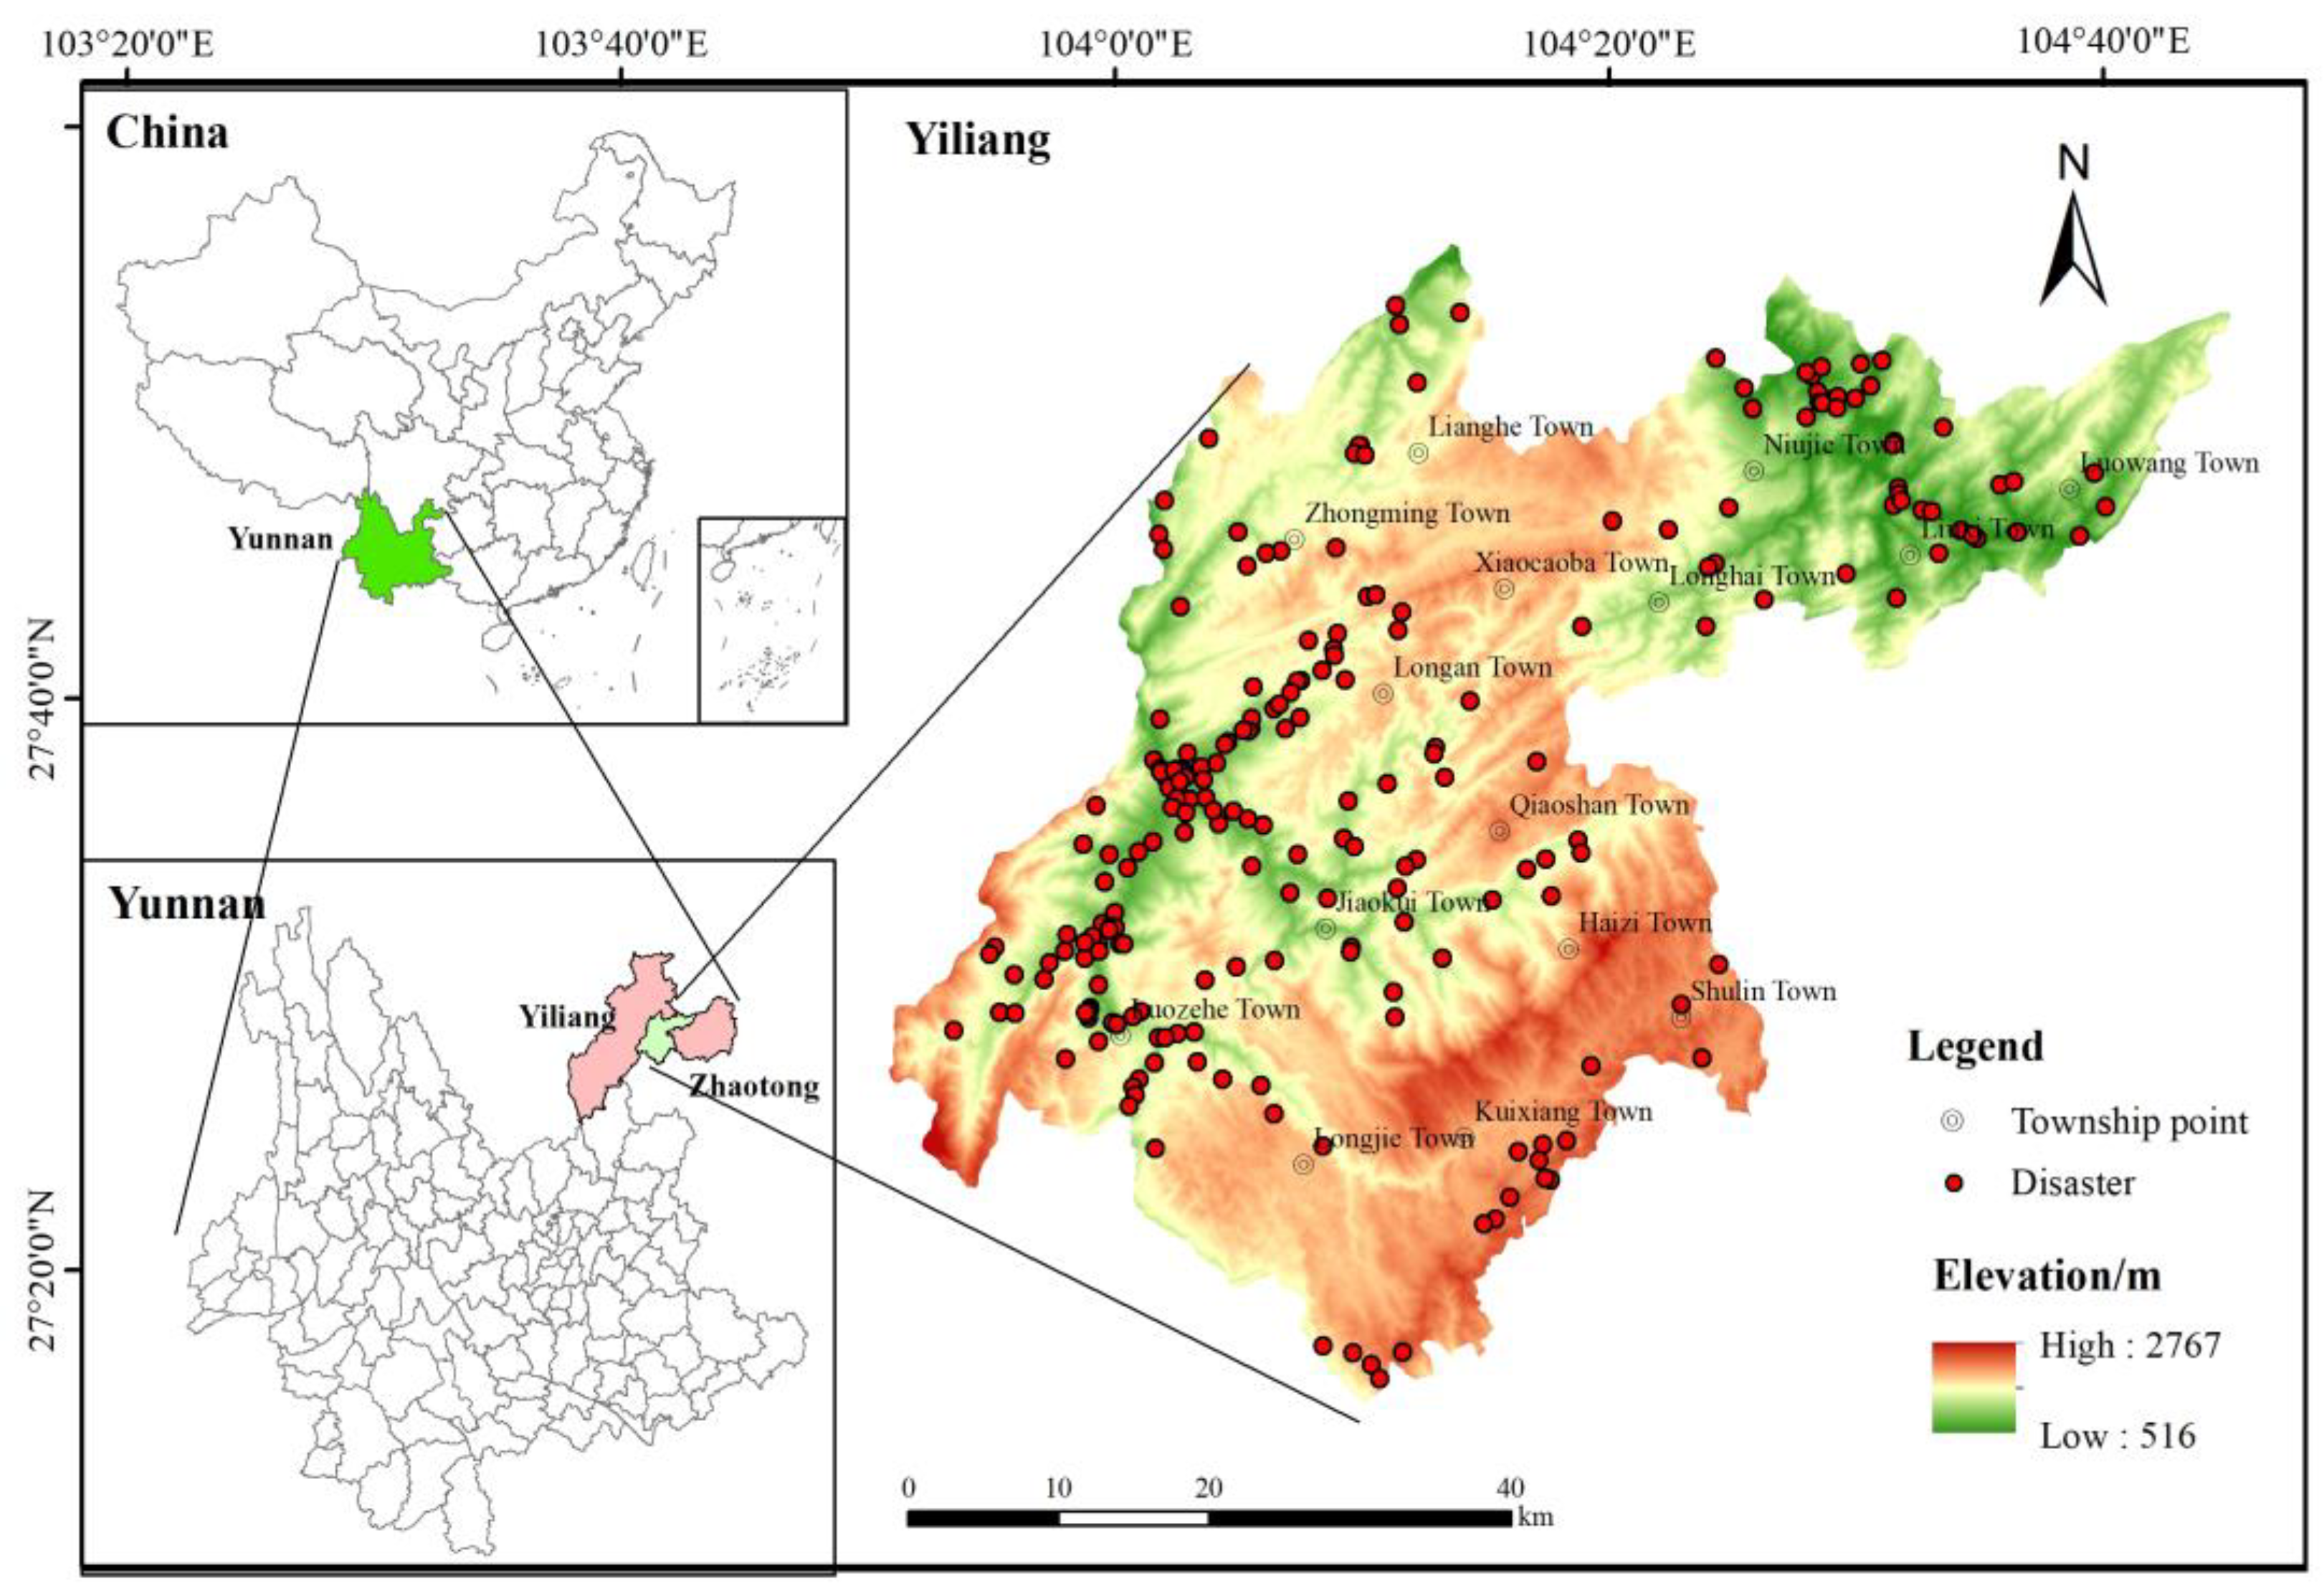
2.1. Study Area Overview

Yiliang County is a part of the Zhaotong City of Yunnan Province. It is located in the Wumeng Mountains in the northeastern part of Yunnan Province, at the convergence of Yunnan, Guizhou, and Sichuan Provinces. The area is geographically within the co-ordinates 103°51′ E and 104°45′ E, 27°16′ N. The region has a total area of 2884 square kilometers extending for 40 km from east to west and about 70 km from north to south (Figure 1). The study area encompasses fifteen towns, with its jurisdiction extending east of Zhenxiong and Weixin County, south of Weining and Hezhang County, west of Zhaoyang District and Daguan County, and north of Yanjin County and Yunlian County. The region is characterized by high and steep mountains, a deep-cutting mid-mountain canyon landform, and a treacherous landscape, with higher terrains in the southwest and lower in the northeast. The highest elevation is observed in Shirenpingzi, Luoze Town, at 2780 m, while the lowest elevation is noted in Baishuijiangxin, Niujie Town, at 2260 m. Earthquakes have resulted in the loosening of several mountains, the complexity of the mechanical nature of the rocks, the fragile geological environment, and adequate conditions for disaster breeding. The climate shows significant vertical variations due to the steep topography with an overall subtropical monsoon climate. The average annual rainfall is 774.6 mm, with a maximum daily rainfall of 151 mm. The rainy season extends from May to October, with maximum rainfall in July. The soil layer is invaded by the heavy rains, substantially weakening and softening it from its initial state and resulting in developing a water system in the territory. The Luoze River, Baishui River, and Jiaoqui River form the three major river basins in the area, and the rivers Luoze and Baishui are part of the upper Yangtze River system. The region’s geological composition comprises Cretaceous and Jurassic sand, shale, and mudstone. These rock types are highly unstable in terms of their engineering mechanical properties due to their poor weathering resistance, low water content, significant variations in consolidation degree, and susceptibility to softening underwater erosion. Furthermore, Permian limestone, basalt, and dolomite demonstrate a high vulnerability to slope-type geological hazards as a result of their certification, formation of soft structural surfaces, and varying weathering resistance and fissure development. Until 2020, nearly 226 geological disasters have been reported within the county’s jurisdiction, posing a significant threat to the lives and properties of over 600,000 individuals. The most serious types of disasters are collapse, landslide, and debris flow, often spatially distributed unevenly. Most landslides and collapses occurred in areas with significant human engineering activities and developed water systems, which include Luoze Town and Jiaoqui Street. As in the Kui Xiang Township, the mudflow disasters are mainly distributed in areas with higher altitudes, apparent undulations, and gully crisscross with solid rainfall (Table 1).

2.2. Data Source

The stratigraphic lithology and fracture structure were extracted from historic data of geological hazard points, and the 1:200,000 geological map of the study area was procured from the Geographic Remote Sensing Ecological network platform. Data on rainfall and DEM (digital elevation model) data were obtained from the China Meteorological Data Network and the Geospatial Data Cloud. These datasets were used to extract relevant information, including rainfall, slope, elevation, and relief intensity. Water system and road data can be obtained from the National Catalogue Service for Geographic Information. The data used to calculate the normalized difference vegetation index (NDVI) were obtained from Landsat 8 satellite imagery from the Geospatial Data Cloud platform.

3. Establishment of an Evaluation Index System

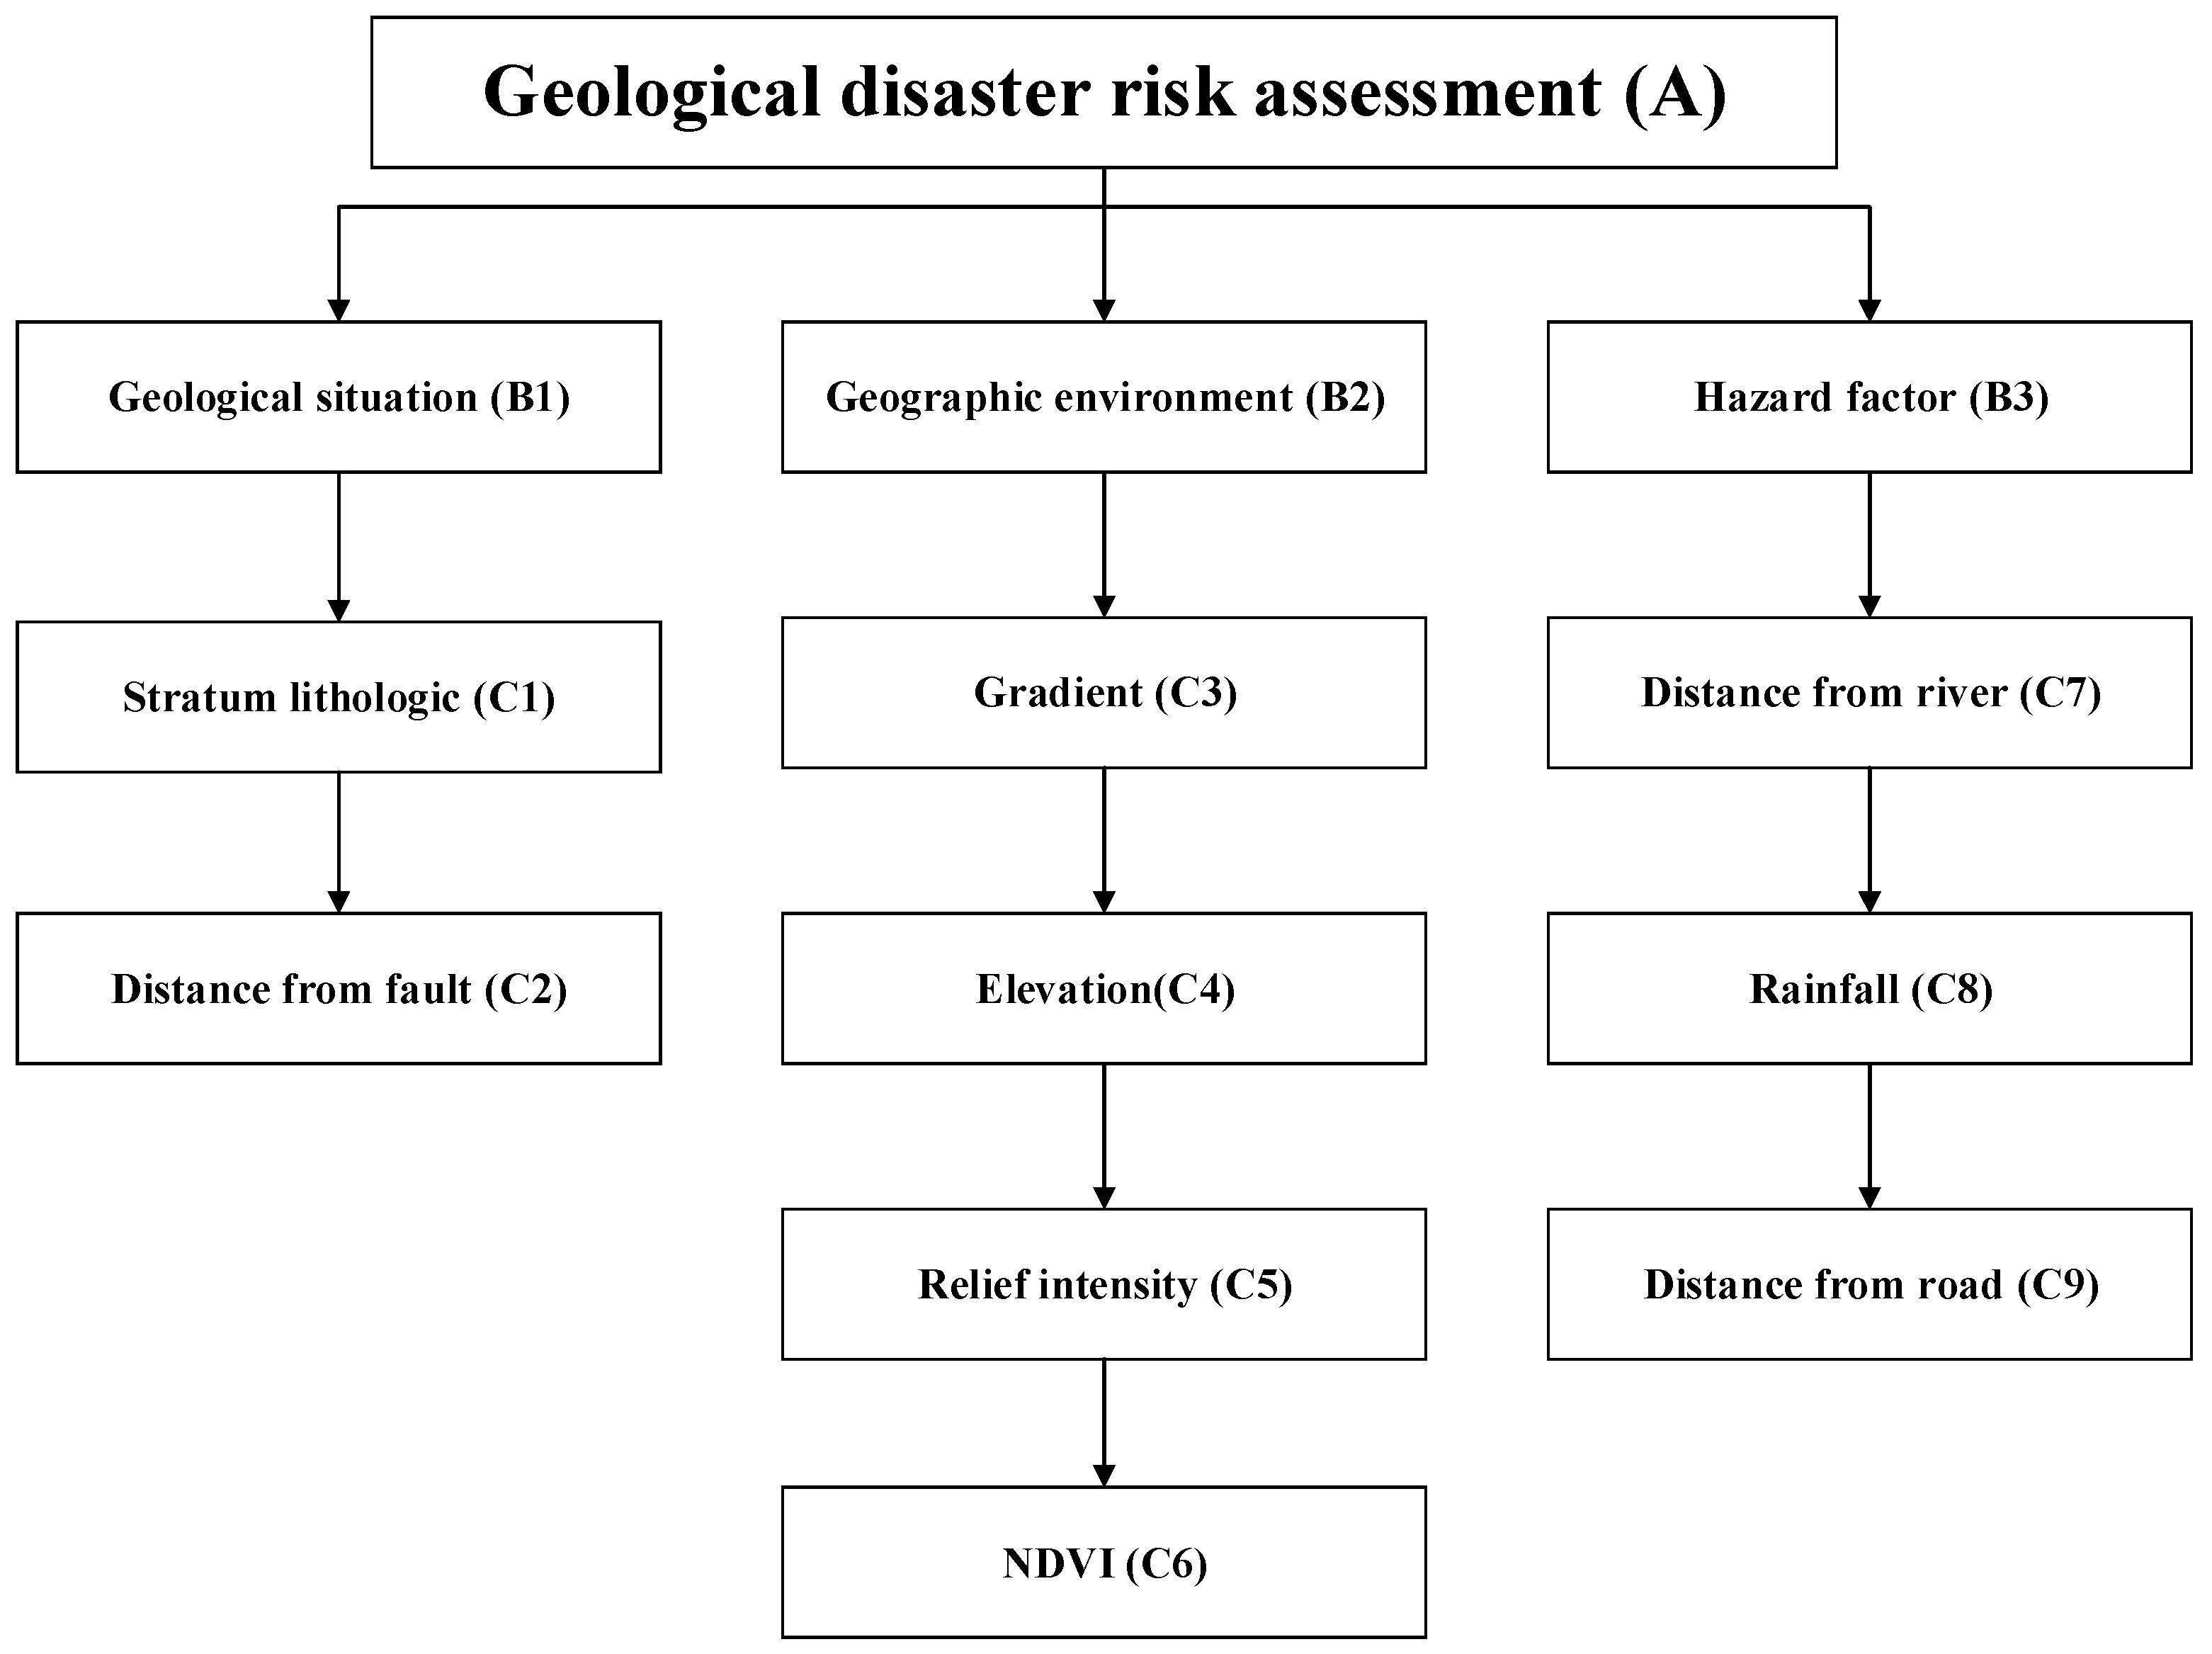
3.1. Selection of Evaluation Factors

The environments and triggering factors for geological hazards in the study area vary spatially. An in-depth analysis of the disaster-causing factors in conjunction with the study area’s geographical environment, geological conditions, and external inducing factors is necessary for an accurate geological hazard evaluation. The causative factors can be classified into intrinsic factors and external triggering factors. The former include topography, stratum lithologic, fracture structure, and vegetated surface, and the latter include human engineering activities, stream erosion, and precipitation. The spatial distribution relationship between existing geohazards and hazard factors in the region was analyzed to determine the evaluation indices. This involved identifying the factors that exert a significant driving effect on the occurrence of geohazards during the evaluation process, followed by grading the indices. Additionally, this study incorporates information and data gathered from the field survey of geological hazards in Yiliang County. Commonly utilized evaluation indices were employed to assess the geological hazards present in the region. The nine factors contributing significantly to the occurrence of geological hazards include gradient, elevation, relief intensity, NDVI, stratum lithologic, distance from faults, distance from roads, distance from rivers, and average annual rainfall, which were chosen as the indices for this geological hazard evaluation and are detailed in the subheads.
(1)
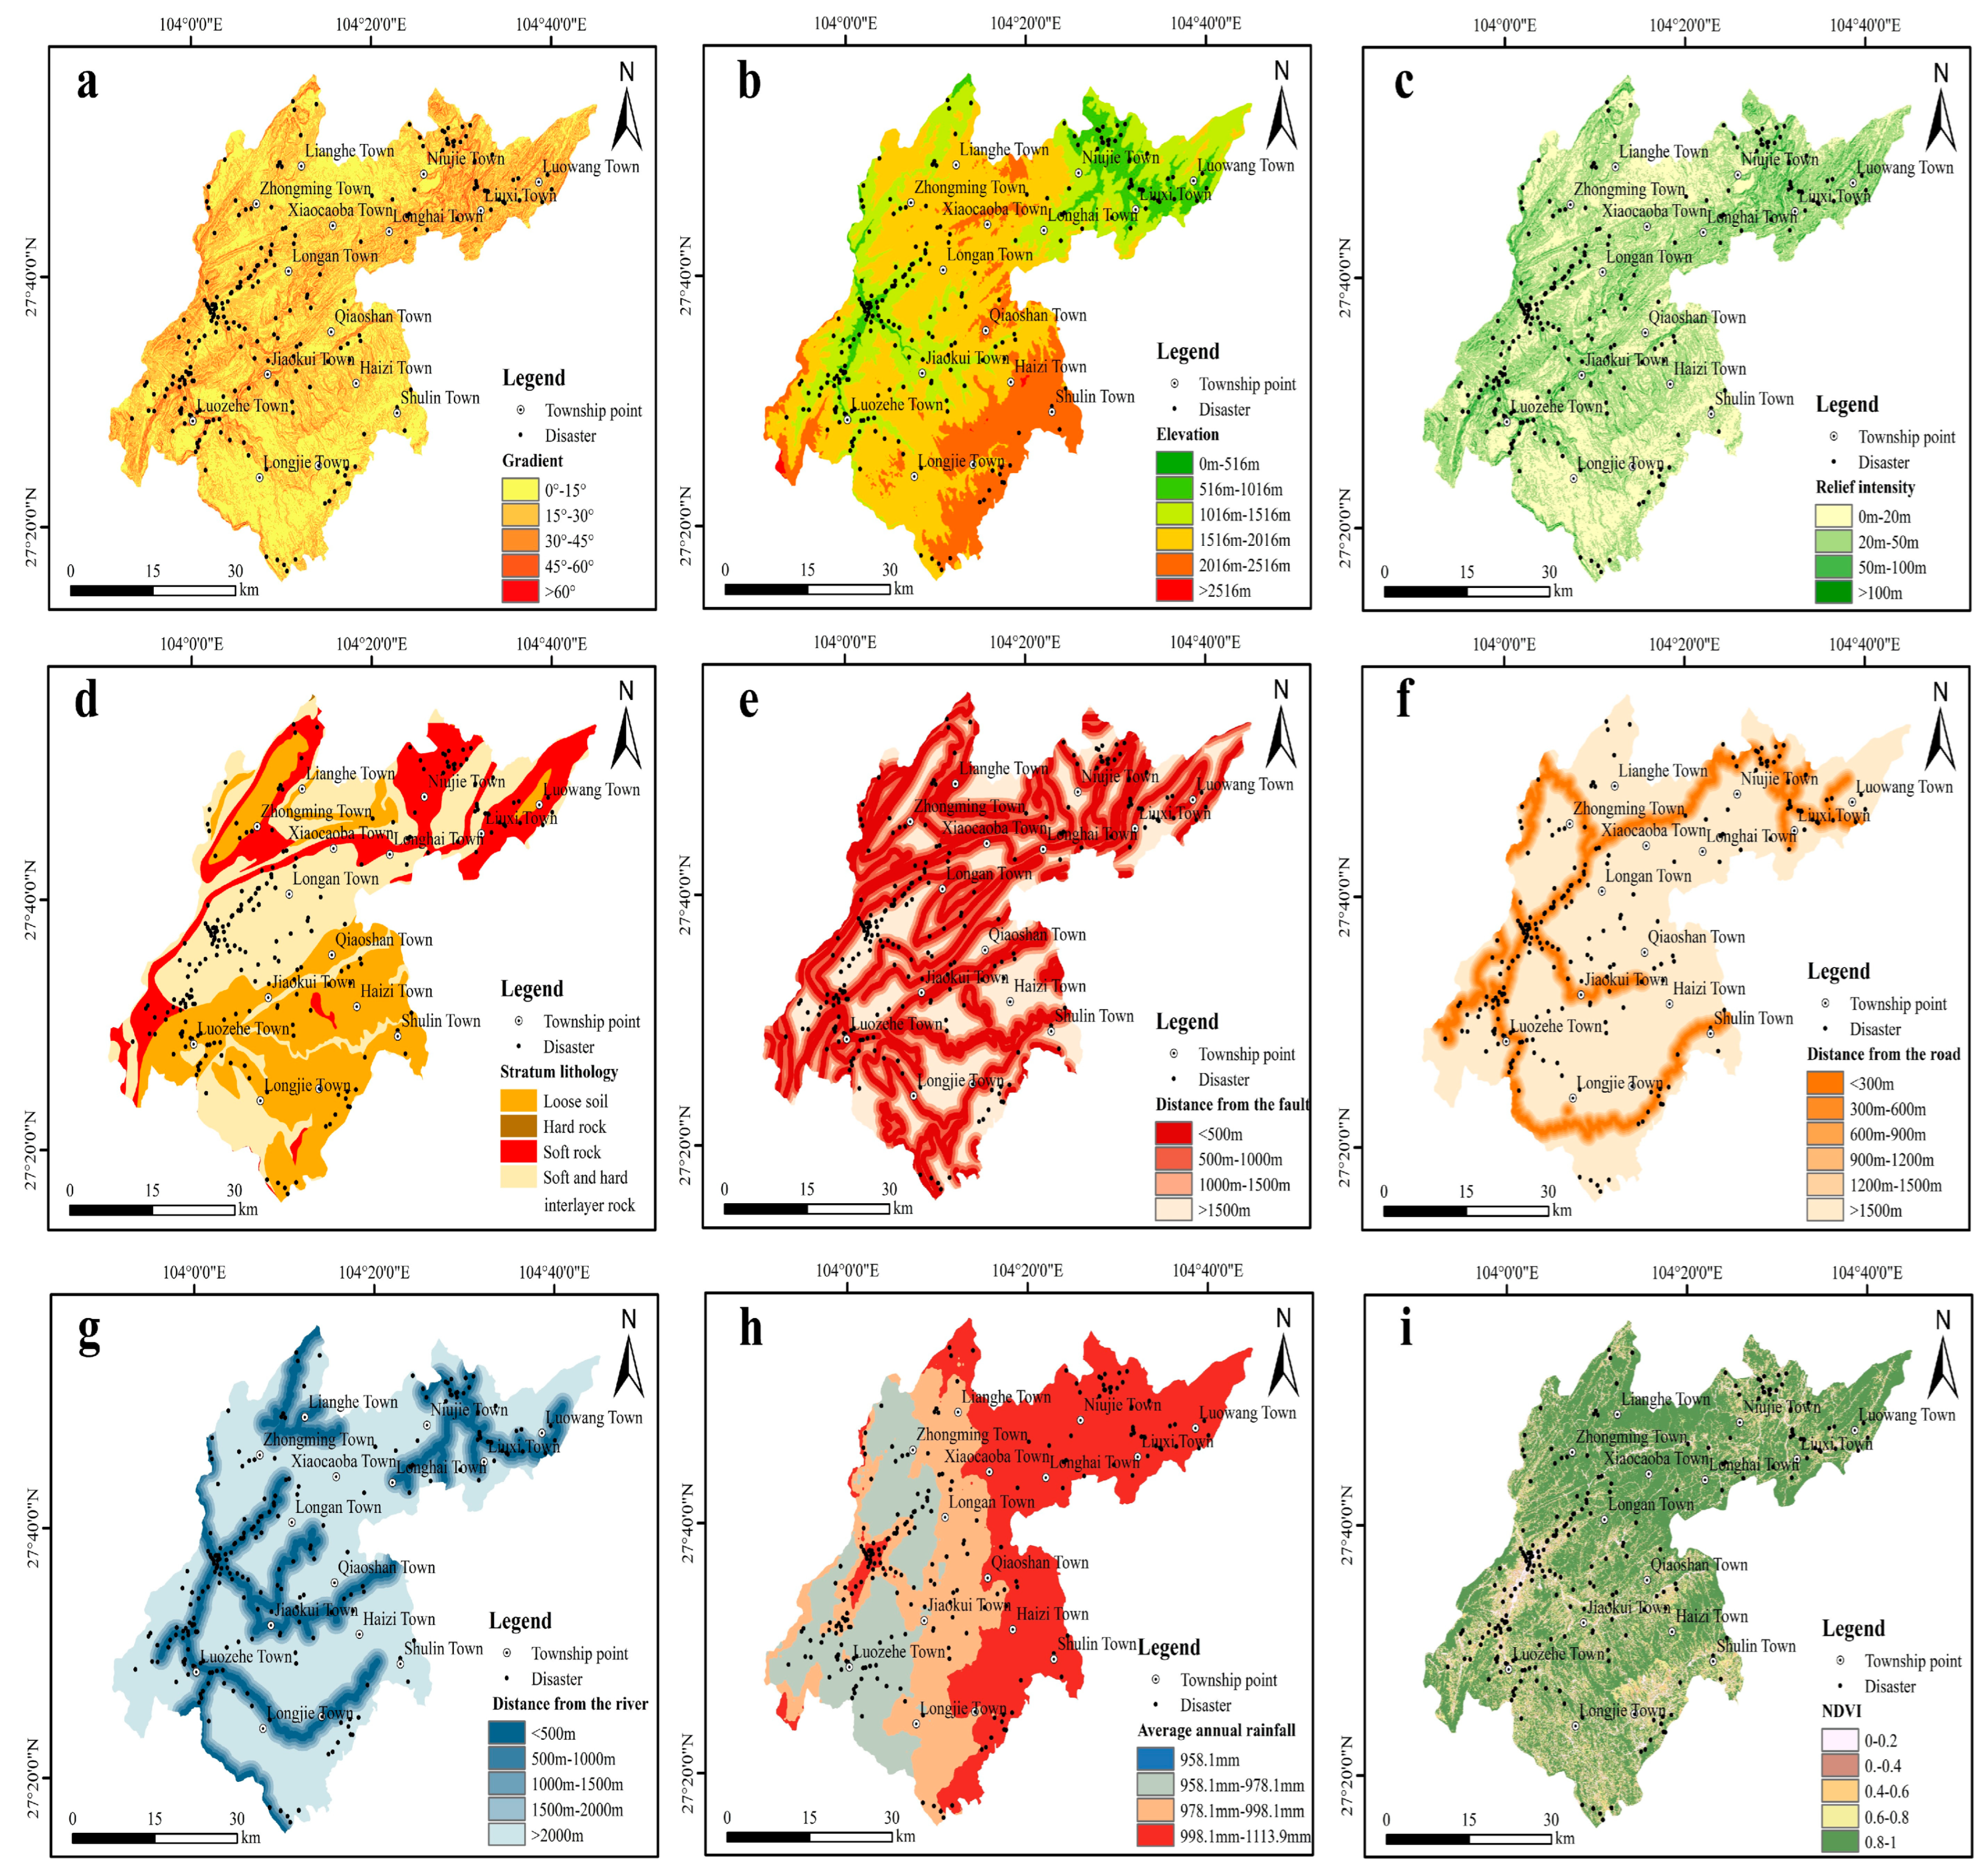
Gradient: The gradient of a region exhibits a strong correlation with the incidence of geological hazards. This is due to its impact on the magnitude of gravity-driven sliding forces, which, in turn, affects the scale and velocity of the collapse, landslide, and mudslide movements. The greater the slope, the greater the probability of a disaster. To more clearly see the relationship between the slope and disaster points, with the help of the spatial analysis function of the ArcGIS software, the DEM data are processed to generate the slope layer of Yiliang County, and then, through the reclassification function, the slope of the study area is divided into five categories, 0°–15°, 15°–30°, 30°–45°, 45°–60°, and >60°, by manually adding 15° as the interval (Figure 2a).
(2)
Elevation: Several studies have shown that elevation is a major factor affecting the occurrence of geological hazards. Environmental factors such as climatic conditions, vegetation cover, and human activities show significant variations with changes in altitude [22]. Based on the comprehensive analysis of the number of disaster points within a certain elevation range in the study area, using the ArcGIS reclassification function, the elevation is divided into six categories: 0 m–516 m, 516 m–1016 m, 1016 m–1516 m, 1516 m–2016 m, 2016 m–2516 m, and >2516 m (Figure 2b).
(3)
Relief intensity: Relief intensity refers to the difference between the highest and lowest heights in a given area. If the total energy is similar, landslides with greater motility are more likely to form over slower terrain [23]. After processing the DEM data by the ArcGIS focus statistical function, the maximum and minimum values of DEM are obtained. Then, the terrain undulation of Yiliang County can be calculated by using the grid calculator. According to the statistics of geological disaster development in Yiliang County, the topographic relief of the study area is divided into four categories, 0 m–20 m, 20 m–50 m, 50 m–100 m, and >100 m, by the ArcGIS reclassification function (Figure 2c).
(4)
Stratum lithology: The number and scale of the collapse, landslide, and debris flow are closely related to the lithology in the area. Regions with weak stratum lithology are more prone to slip zones due to the influence of external camp forces such as water, and are, therefore, highly susceptible to landslide disasters. In the ArcGIS software, the attribute table of formation lithology vector data is added fields. Based on the geological map of Zhaotong City, combined with the knowledge of engineering geology, the attribute table is improved according to the hardness of the rock and soil, and the formation lithology vector data are divided into four categories, loose soil, soft rock, soft and hard interbedded rock, and hard rock, by the reclassification function (Figure 2d).
(5)
Distance from the fault: Distance from the fault refers to the development of a fault structure, in which case the rock is less stable and more prone to destruction, eventually leading to geological disasters [24]. The geological process may rise due to the significant quantity of source materials generated by the dynamic geological processes close to the fault, the geotechnical body’s rapidly changeable condition, and the loose accumulation formed by tectonic movement. This paper establishes buffer zones centered on faults based on the distribution of spots in the study area using the analysis tool of ArcGIS, and are divided into four buffer zones with the following ranges of the distance from faults: <500 m, 500 m–1000 m, 1000 m–1500 m, and >1500 m (Figure 2e).
(6)
Distance from the road: Unreasonable human engineering endeavors such as the construction of highways and tunnels, the artificial excavation of slopes, or the loading of the upper part of the slope significantly alter the geological environment. The alteration in the initial state of stress and slope shape leads to an elevation in the down-sliding force of the sliding body and a reduction in the slope’s holding power. Consequently, the likelihood of disasters is heightened. In this paper, based on the road vector data of Yiliang County, buffer zones are established at 300 m intervals and divided into six categories: <300 m, 300 m–600 m, 600 m–900 m, 900 m–1200 m, 1200 m–1500 m, and >1500 m (Figure 2f).
(7)
Distance from the river: Rivers have significant external dynamic impacts that modify the surface morphology, and the continuous erosion of rivers on the toe of the slope will lead to the overall instability of the hill, causing geological disasters. The water system in the study region is notably advanced and includes the Luoze River, Baishui River, and Jiaoqui River. According to the distribution of disaster sites in the proximity of the rivers, the study area is divided into five categories, which are the distances from the rivers in the ranges of <500 m, 500 m–1000 m, 1000 m–1500 m, 1500 m–2000 m, and >2000 m (Figure 2g).
(8)
Average annual rainfall: Natural precipitation is a major triggering factor of collapse, landslides, and mudslides, and the average annual rainfall in the study area strongly correlates with the occurrence of collapse, landslides, and mudslides [25]. Rainfall-generated surface water tends to flow into the landslide mass, thereby increasing its weight. This, in turn, reduces the soil’s shear strength due to water infiltration, thereby causing geological disasters. In this paper, the rainfall data of Yiliang County from 2015 to 2020 are collected, and the collected data are preprocessed by checking outliers and filling missing values to ensure the quality of the data. The selection of the interpolation model and parameter setting needs to carefully analyze the distribution of rainfall stations and understand the spatial variability of data. Through repeated experiments or fitting, the appropriate parameters such as the semi-variation function parameters, search radius, and interpolation method are determined, to achieve the best smoothness and accuracy of the interpolation results. We then view the interpolation map and error map to determine whether the interpolation is reasonable. If the interpolation is unreasonable, a further parameter adjustment is required. Using the ArcGIS software, the interpolation results are loaded into the map in the form of grid layers. By setting color bands and classification methods, the spatial distribution of rainfall is displayed to ensure that the results are consistent with the actual rainfall in Yiliang County. After the results are satisfactory, the data are reclassified into four categories, <958.1 mm, 958.1 mm–978.1 mm, 978.1 mm–998.1 mm, and 998.1 mm–111.4 mm, in ArcGIS software (Figure 2h).
(9)
Normalized difference vegetation index: Vegetation provides slope protection from soil erosion, and the deeply rooted vegetation has an anchoring effect. Regions with high vegetation coverage are less susceptible to geological hazards, as they play a crucial role in the evolution and stability of slope bodies. Based on the Landsat8 remote sensing image, this paper obtains remote sensing image data including the infrared band and visible band, and preprocesses the obtained remote sensing image with ENVI software, including radiometric calibration, atmospheric correction, etc., to ensure the quality and consistency of the image data. The NDVI of Yiliang County was calculated by extracting the reflectance data of the infrared band and visible band from the preprocessed image data. The larger the NDVI value, the higher the vegetation coverage in this area. Through the ArcGIS reclassification function, the normalized vegetation index of the study area is manually divided into five categories: <0.2, 0.2–0.4, 0.4–0.6, 0.6–0.8, and 0.8–1 (Figure 2i).
Figure 2. Classification of evaluation factors. (Figure 2 shows the classification level diagram of each evaluation factor. From (ai), the classification of nine evaluation indexes, such as Gradient, Elevation, Relief intensity, Stratum lithology, Distance from the fault, Distance from the road, Distance from the river, Average annual rainfall, Normalized difference vegetation index, are introduced respectively).
Sustainability 15 13978 g002

3.2. Information Method

The information method was initially applied widely in the field of geological prospecting. The method converts the actual situation and information in the already existing damaged area, translates the actual test results adversely affecting the regional security factors into a volume of information reflecting regional stability, and reflects the close relationship between the influencing factors and the research object by the size of the information in the already damaged area [26]. The primary principle of the information model for geological hazard evaluation involves analyzing the actual situation and information pertaining to geological hazards in the region. This information is subsequently transformed into information quantity values, which serve to represent the occurrence of regional geological hazards. The method considers that the magnitude of the information value of each factor related to the reflected result represents the magnitude of the prediction capacity of the factor. The more effective factors involved in the operation, the more accurate the information value classification results [27]. The specific algorithm is as follows:
I ( x i , H ) = ln N i / N S i / S
where ‘I( x i , H)’ is the amount of information about the occurrence of the ground disaster provided by each influence factor ‘ x i ’; ‘S’ is the total number of cells in the evaluation area; ‘ S i ’ is the number of evaluation units with an influence factor ‘ x i ’ in the study area; ‘N’ is the total number of damaged units in the study area; and ‘ N i ’ is the number of geological hazard units in the study area with each factor ‘ x i ’. The information values of each impact factor, as determined using Equation (1), are presented in Table 2.
According to Table 2, areas with an elevation between 516 m and 1016 m above mean sea level and terrain undulation between 50 m and 100 m are more prone to geological hazards. Moreover, soft and hard intercalated rocks and soft rocks have distinct effects on generating ground hazards. The possibility of geological hazards is higher in areas closer to the faults and roads. In addition, slopes with a gradient between 45° and 60° facilitate the generation of geological hazards. Proximity to rivers is another external dynamic factor that significantly contributes to the occurrence of disasters, particularly when the proximity is closer. Furthermore, the possibility of disasters occurring between 978.1 mm and 998.1 mm of rainfall is relatively higher. However, areas with more developed vegetation growth are less prone to geological disasters.

3.3. AHP (Analytic Hierarchy Process)

The analytical hierarchy process is the reconstitution of complex multi-level, multi-criteria issues into component factors organized by dominant relationships to form an ordered hierarchical structure. To prioritize and organize the complex geohazard issues in the study region, we conducted a preliminary analysis of the geological disasters that have occurred in the study area. The risk factors were subdivided into various components based on the objectives to be achieved. These elements are combined at various levels to form a multi-level structural model based on their interrelation and interconnection [28]. This involved building the top layer, middle layer, and bottom layer affiliation model, quantification of the relative importance of the impact factors at each level by experts according to the scale of 1–9 [29] to obtain the corresponding judgment matrix, and calculation of the weights of each factor and consistency evaluation. The hierarchical structure model is established (Figure 3), using the calculation formula which is given below:
(1)
Operation on the product of real numbers in the same row of the decision matrix M i :
M i = j = 1 n a i j ( i = 1 , 2 , 3 , , n )
(2)
Calculation of “ W i ”:
W i = M i n
(3)
Regularize W i to process:
W i = W i / i = 1 n W i
(4)
Calculate the maximum eigenvalue “ λ m a x ”:
λ m a x = 1 n i = 1 n ( A W ) i W i
(5)
Consistency test of the judgment matrix:
CR = CIRI
C I = 1 n 1 ( λ m a x n )
In Equation (6), ‘CR’ ‘RI’, ‘CI’, and ‘n’ represent the consistency ratio, random consistency index, consistency index, and matrix order. The judgment matrix is considered to satisfy the consistency test when CR < 0.1, and when this condition is changed, the judgment matrix is adjusted to pass the consistency test.
Finally, the total ranking weights of the highest layer to the bottom layer (A–C) are obtained by repeating the normalization of weights ‘ W i ’ of the middle layer to the lower layer (B–C) under the highest layer (A), as shown in Table 3.
Figure 3. The AHP model.
Sustainability 15 13978 g003

3.4. Binary Logistic Regression Model

The binary logistic regression model is a statistical learning method used to deal with the binary classification problem; that is, the input data are divided into two mutually exclusive categories. In the binary logistic regression model, the probability that the sample belongs to a certain category is obtained by linearly combining the input features and mapping the linear output to the [0,1] interval through a logical function (usually a Sigmoid function). If the probability is greater than a preset threshold, the sample is predicted to be one of the categories; otherwise, the prediction is another type. In the study of geological disaster risk assessment, the binary logistic regression model has many advantages. By collecting a variety of factors and characteristics related to geological disasters, such as geological conditions, climatic factors, topography, human activities, etc., a dataset containing these characteristics is constructed. Then, the binary logistic regression model is used to classify and predict the occurrence of geological disasters. By analyzing the β -value parameters (feature weights) of the binary logistic regression model, the degree of influence of various factors on the occurrence of geological disasters can be obtained. These parameters can be used to assess the risk of geological disasters in the region so that, in the case of limited resources, priority is given to high-risk areas for disaster prevention and mitigation measures. The functional expression of the model is:
P Y = 1 X = 1 1 + e Z Z = β 0 + β 1 x 1 + β 2 x 2 + β 3 x 3 + . . . + β n x n
Formula (8) describes the logistic model: ‘P’ represents the probability of geohazard occurrence, ranging from 0 to 1, where 0 indicates that a geohazard cannot occur, while 1 indicates that it will occur; ‘n’ represents the number of evaluation factors; ‘ β i ’ is the logistic regression coefficient; and ‘ x i ’ represents the information value for each evaluation factor.

3.5. Combination Weighting Method

The weight of the evaluation factor calculated by the analytic hierarchy process is coupled with the hierarchical information value of the evaluation factor calculated by the information method and the feature weight calculated by the binary logistic regression model (Table 4). It can avoid the errors and shortcomings of a single evaluation method and enhance the credibility of the evaluation results. This study employs three methods to determine the weights of evaluation factors, and, subsequently, utilizes Equation (9) to multiply these weights with graded information quantity values. The resulting output represents the combined information quantity values for each evaluation index factor:
I A = i = 1 n W i × I i j × R i
where ‘ I A ’, ‘ W i ’ and ‘ I i j ’ are the integrated information value of the evaluation unit, the weight of the ith evaluation factor obtained by hierarchical analysis, and the information quantity value of the jth grading of the ith evaluation factor. ‘ R i ’ is the weight of the ith evaluation factor obtained by the binary logistic regression model.
The evaluation model was executed using the raster calculation function of ArcGIS. By multiplying the information value of each evaluation element layer by the weight of the corresponding evaluation element layer determined by the analytic hierarchy process and the binary logistic regression model, the comprehensive information value results of the geological hazard risk evaluation elements can be obtained. The integrated information values ranged from −1.28325 to 2.13087 and were classified into the four intervals of the danger zone—the extreme high-risk area (0.66052 to 2.13087), high-hazard area (−0.12391 to 0.66052), middle-danger zone (−0.70879 to −0.12391), and low-danger zone (−1.28325 to −0.70879)—using the natural breakpoint method in ArcGIS. Further, the geological hazard risk of the study area was classified using the reclassification function in the ArcGIS spatial analysis tool, and the spatial map is shown in Figure 4.

4. Hazard Evaluation Results and Analysis

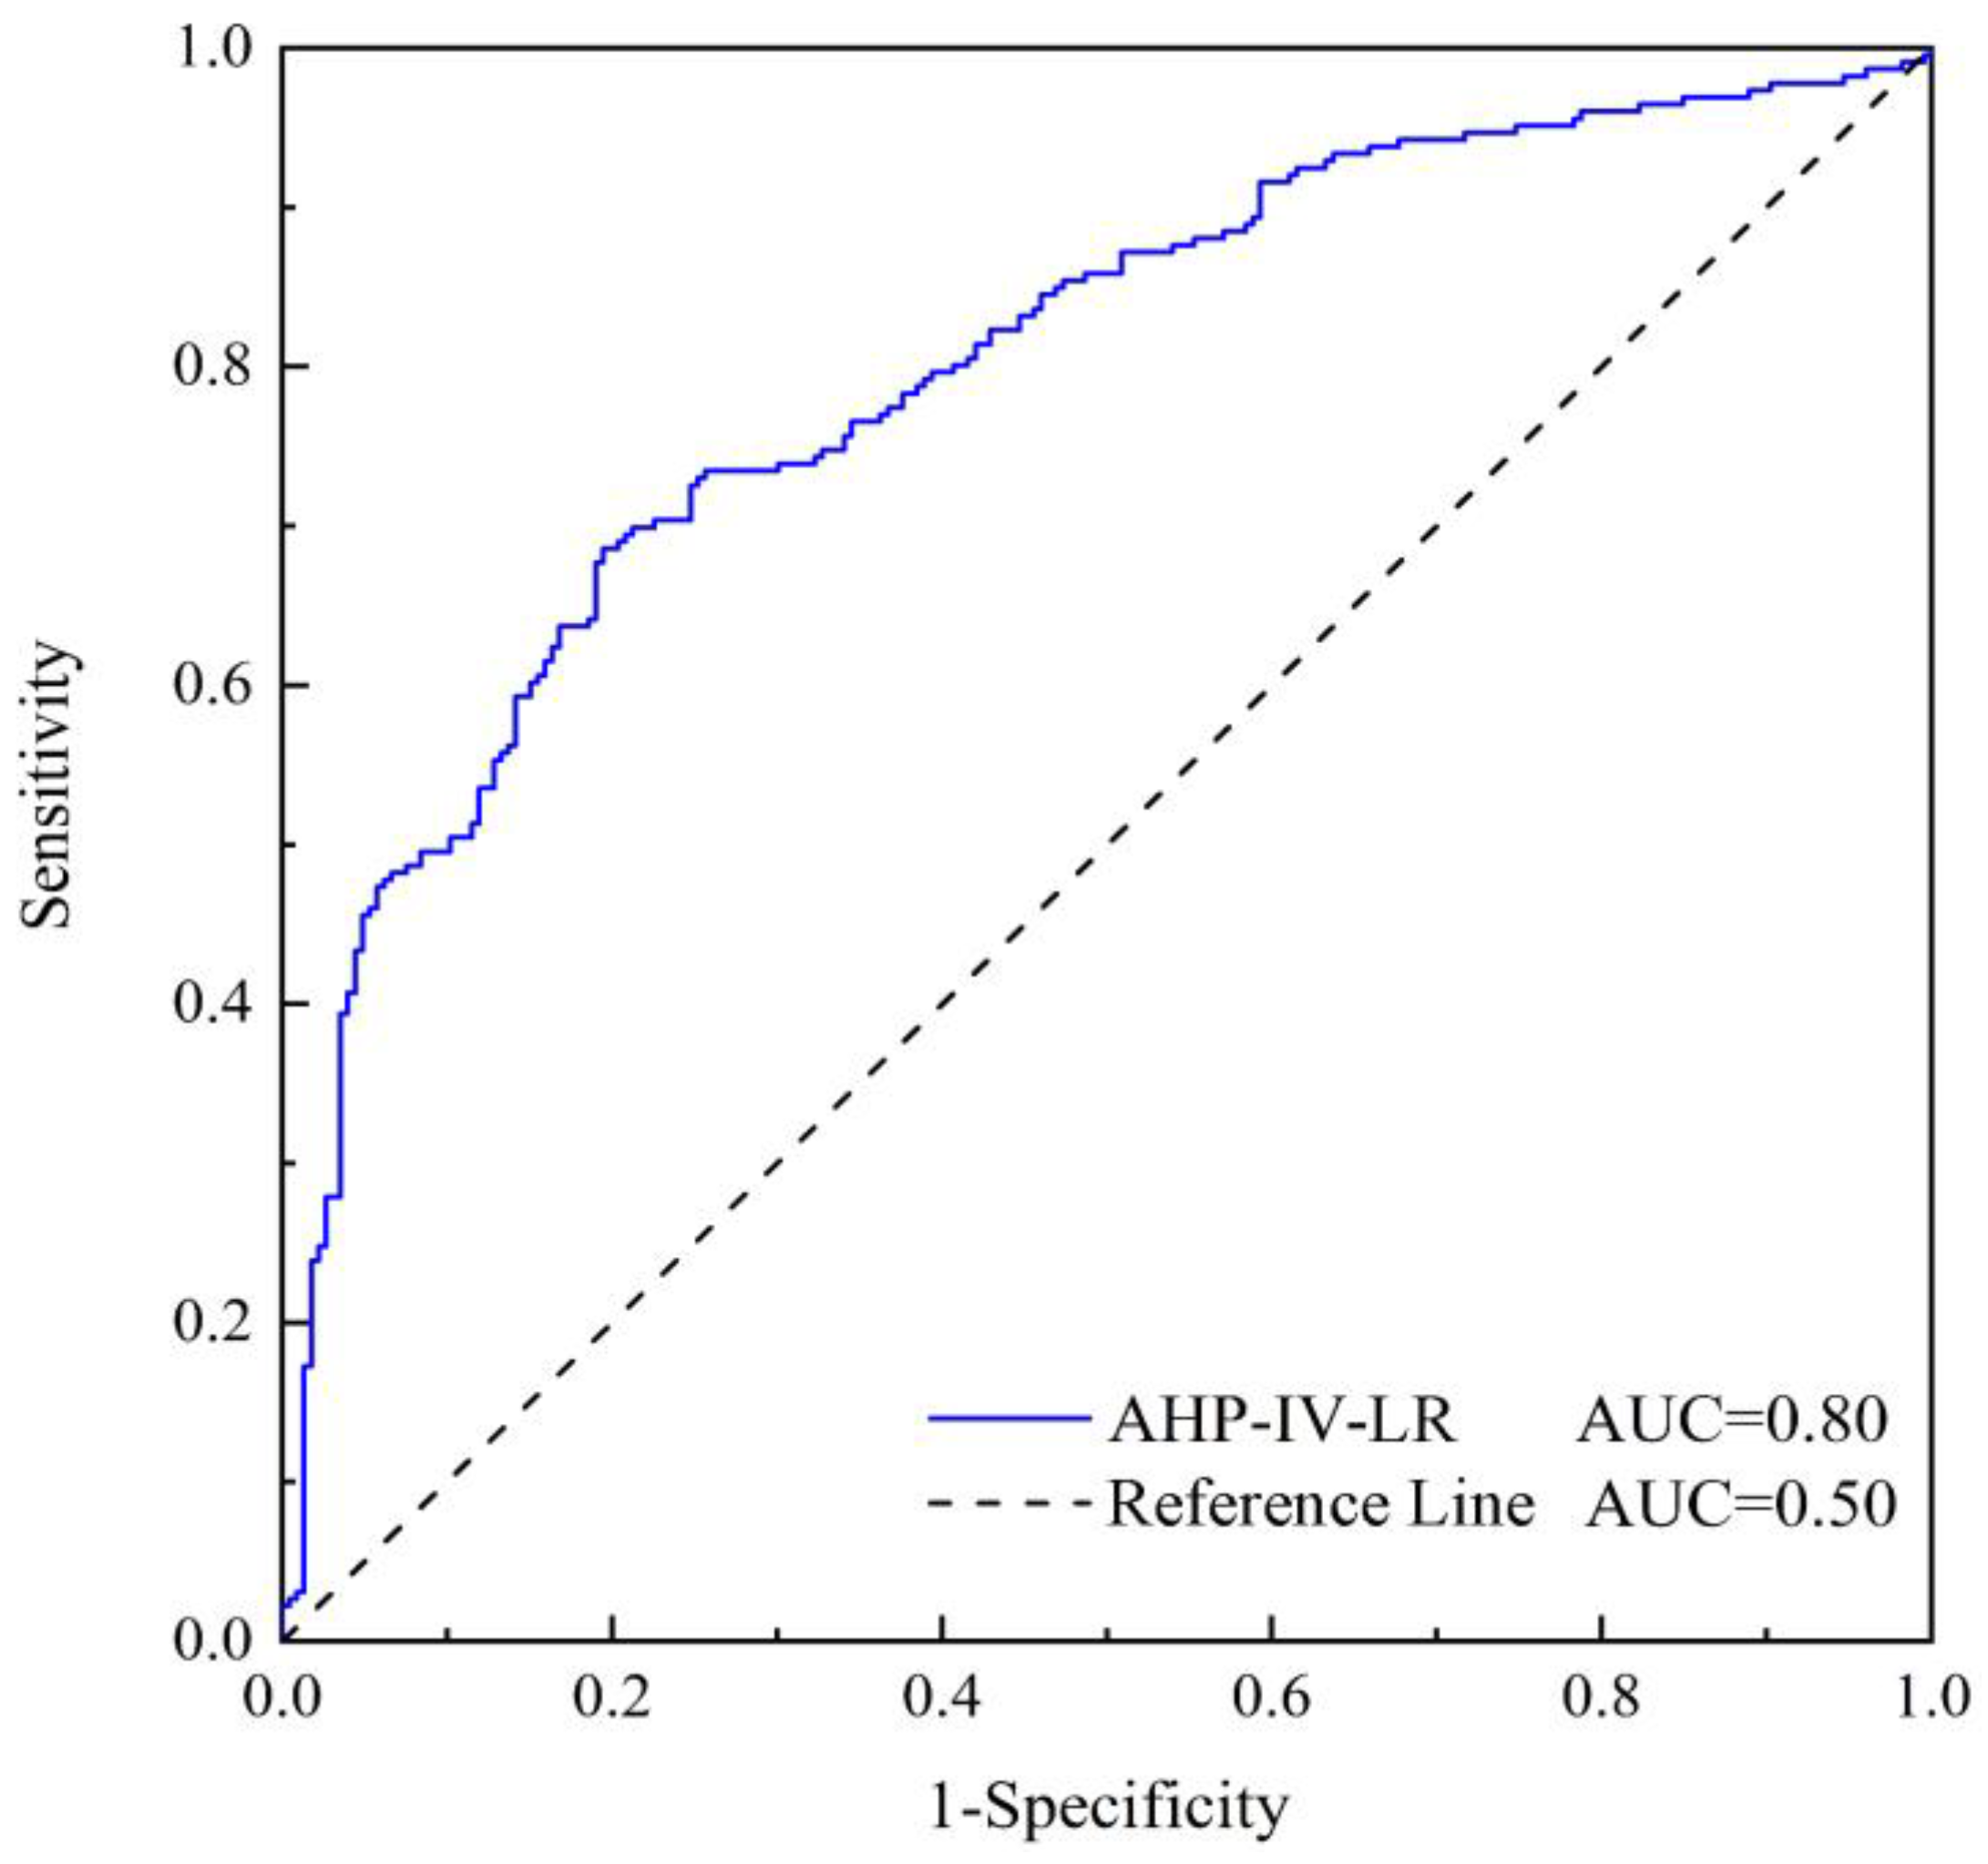
4.1. Accuracy of Hazard Evaluation Results

The receiver operating characteristics (ROCs) are an effective method for validating prediction models [30]. This paper investigates the accuracy of the geological hazard evaluation model using the ROC curve method. The values of the anticipated outcomes are all potential judgment threshold objects for this approach. The vertical co-ordinate is the true positive rate (sensitivity), while the horizontal co-ordinate is the false positive rate (specificity). The accuracy of the assessment outcomes is correlated with the area under the curve (AUC) of ROC, and its value is between [0.5–1]. The assessment outcomes become more accurate when the AUC value approaches 1. The 45° diagonal line at the center of the ROC curve serves as a reference, with an area of 0.5. The accuracy of the prediction model is positively correlated with the distance between the ROC curve and the top left chamber in the illustration.
A total of 226 disaster points in the study area were selected as disaster point samples, and 226 non-hazard sample points were randomly generated in the study area to support the assessment model’s correctness further. The probability values provided by these disaster point samples and non-hazard point samples were imported and displayed in the SPSS software ROC curve using the ArcGIS platform based on the results of the geological hazard evaluation in Yiliang County. An AUC value of 0.80 is observed in Figure 5.

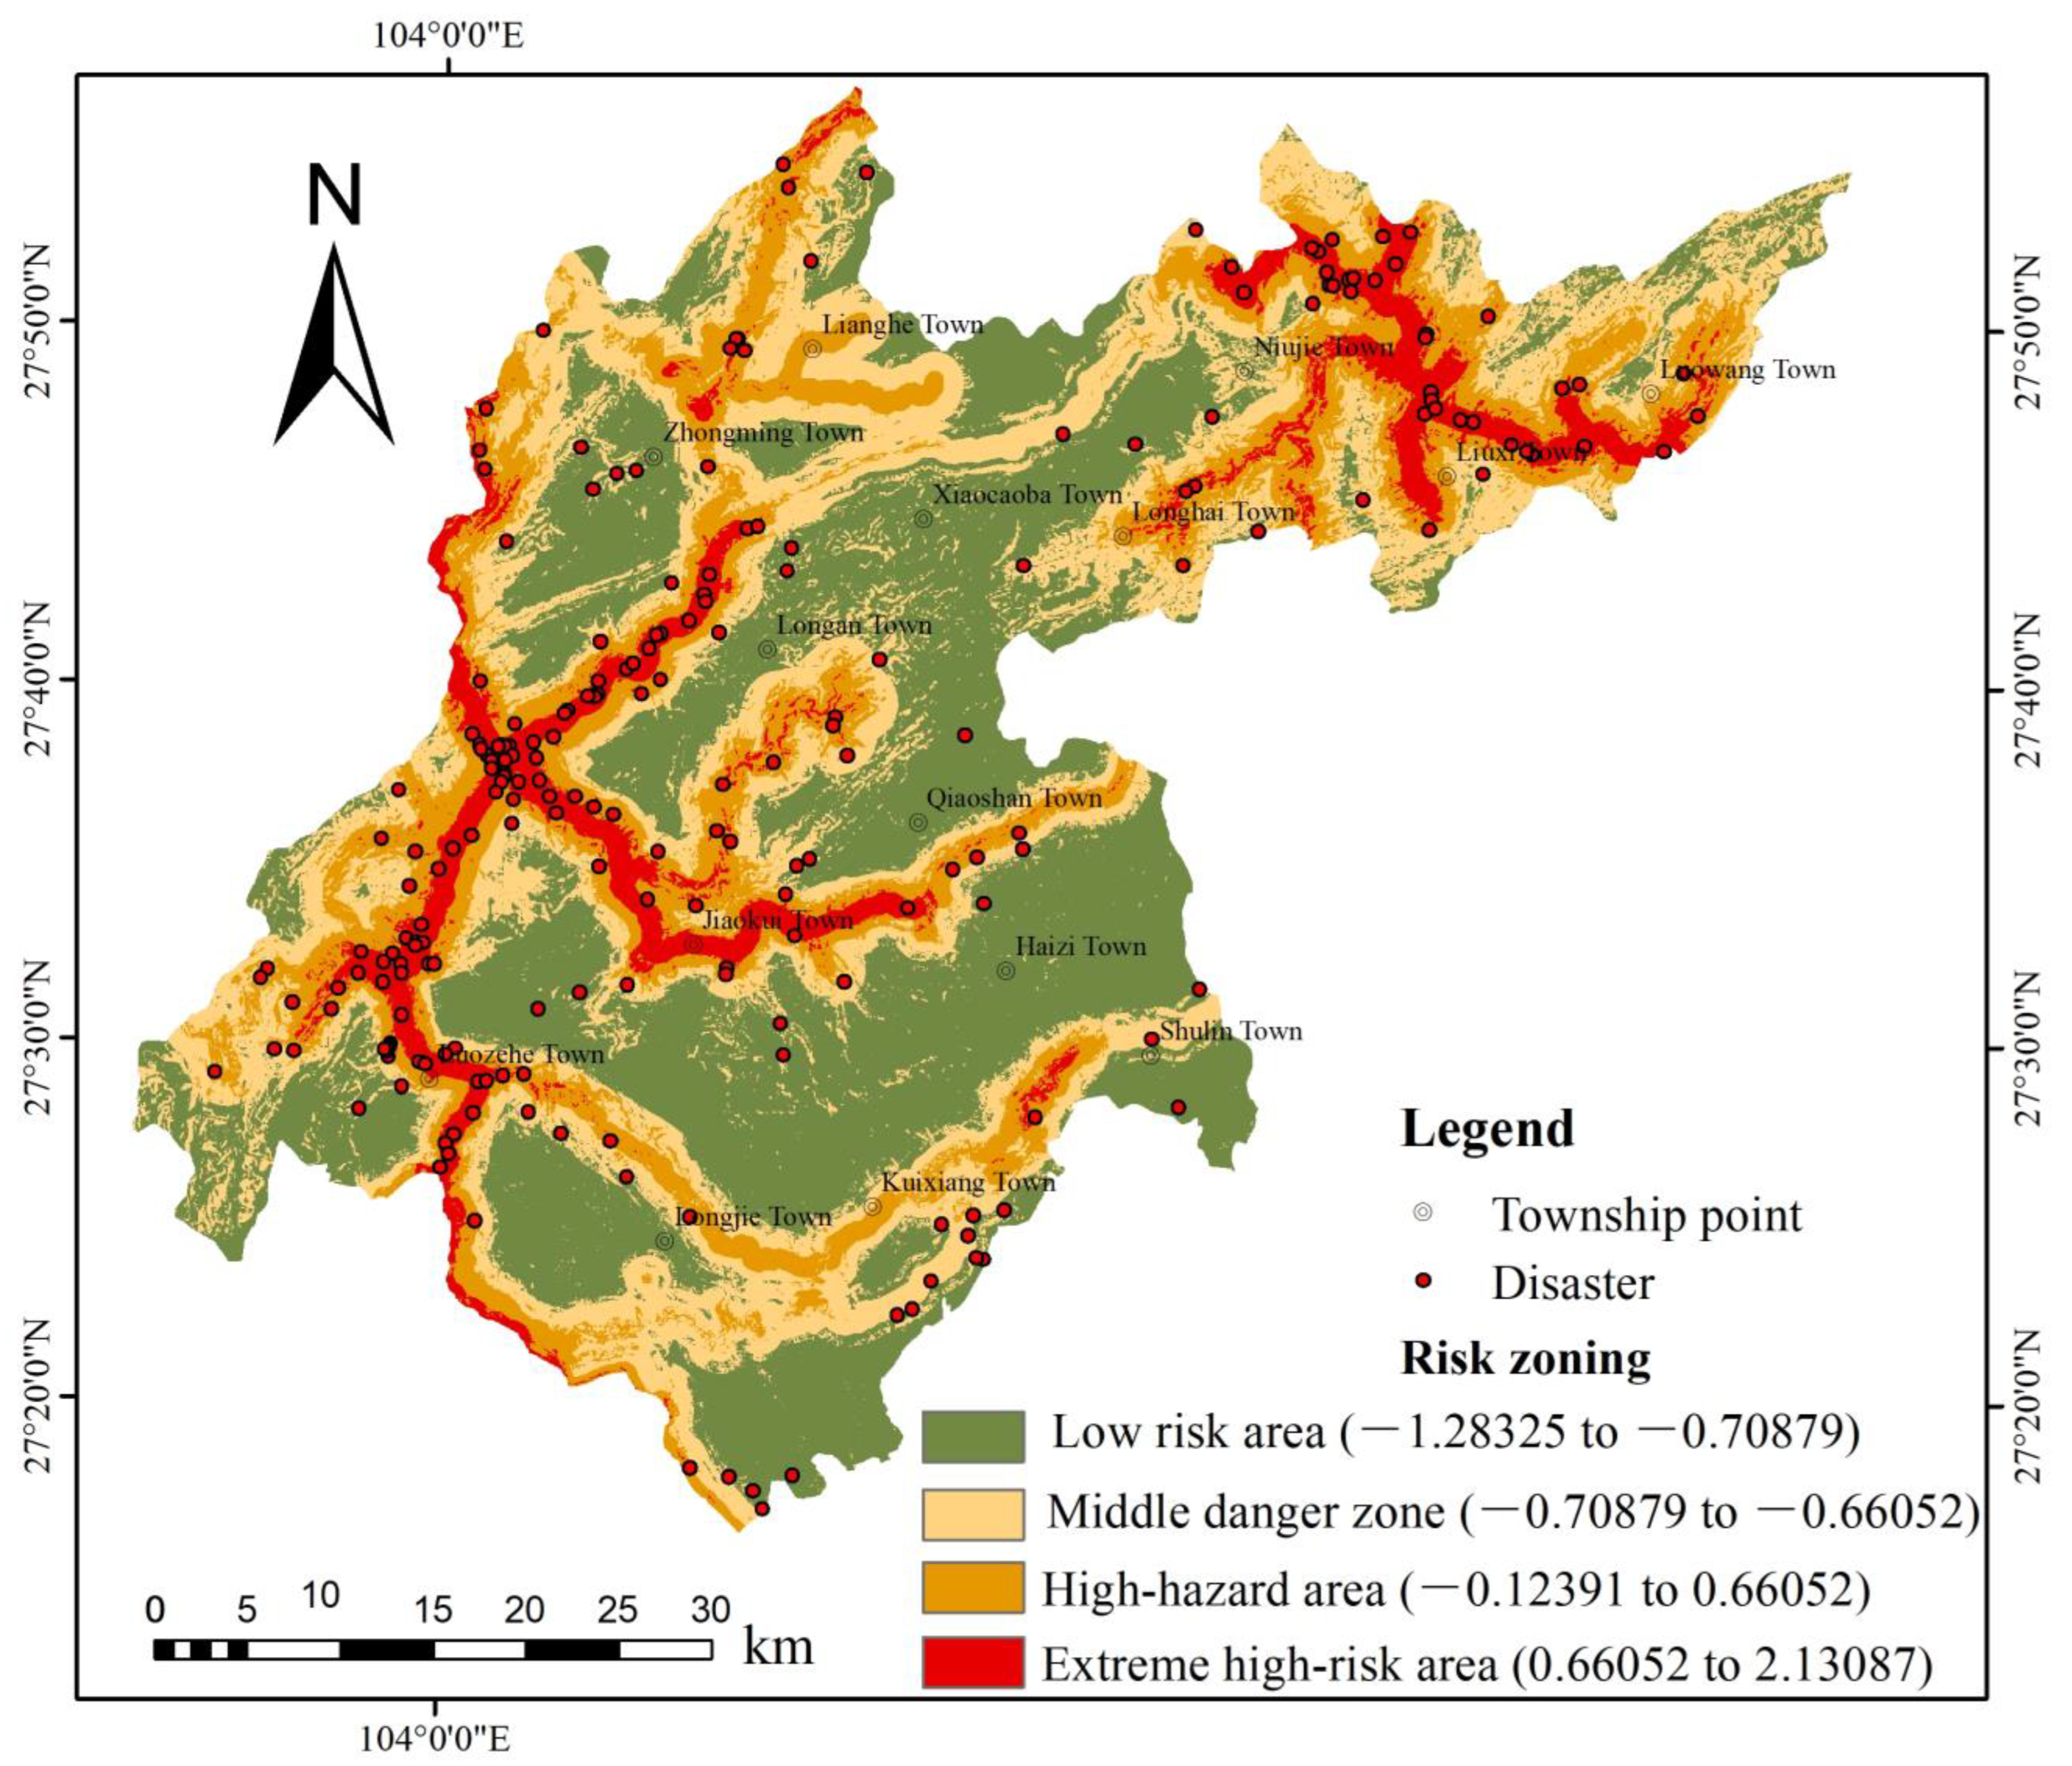
4.2. Analysis of Geological Hazard Evaluation Zoning

The geological hazard zoning map of the study area and the distribution map of geological hazard points that had undergone raster calculation and reclassification were spatially linked and statistically analyzed using GIS to obtain the results of the geological hazard evaluation grading with Yiliang County (Table 5).
(1)
Extreme-high-risk area: The extreme-high-risk area extends over 220.55 km2, which accounts for 8.08% of the study area, and nearly 46.98% of the hazard points are distributed in the very high-risk area, mainly along the basin of the Luoze, Baishui, and Jiaoqui Rivers, covering Jiaoqui Town, Luoze Town, and the nearby regions. The geological environment within the area of high risk is characterized by intricate topography, severe river erosion, and copious rainfall. The Luoze and Jiaoqui Rivers are the economic centers of Yiliang County, where the population is dense and frequent human engineering activities and substantial modification of the geological environment are dominant.
(2)
High-risk area: The high-risk area extends over 535.88 km2, accounting for 25.66% of the disasters, mainly distributed near the water system, covering Lianghe Town, KuiXiang Township, and the nearby regions. Anthropogenic engineering activities are prominent in the region, with geological hazard sites distributed linearly along the rivers and roads. The area features relatively low vegetation coverage and a complex geological environment.
(3)
Medium-risk area: This category extends across an area of 835.84 km2, accounting for 30.59% of the study area. The district has 35 geological hazard sites, mainly in the northeastern part of Luowang Township and the southern part of Longjie Township and nearby areas. This area has low river erosion, average rainfall, medium population density, and relatively few human engineering activities. The main threats in the area include the safety of scattered residents along village committees and county roads.
(4)
Low-hazard zone: The low-hazard zones primarily lie in the peripheral regions of the extremely high-risk areas, high-risk zones, and medium-risk zones, covering an area of 1139.73 km2, which corresponds to 41.72% of the study area. Nearly 27 geological hazard sites are covered in this category, which includes the northwestern part of Kui Xiang Township, the southwestern part of Longhai Township, and part of each township. The population in the area is relatively sparse, with fewer human engineering activities and higher vegetation coverage. The disaster sites are sporadically distributed on a smaller scale.

5. Discussion

As a major ongoing project in the field of natural resources in China, the geological hazard risk census and hazard evaluation serve as the foundation for risk assessment approaches. Historically, most of the approaches employed for geological hazard evaluation were qualitative in nature, with evaluation factors’ weights being influenced by subjective factors. This resulted in a degree of subjectivity in the assessment outcomes. The results of geological hazard evaluation need to be reliable, objective, and scientific. In this paper, hazard evaluation using the combination assignment method can overcome the direct interference of subjective factors on the evaluation results. It can quantify the weights of evaluation indices, thus making the evaluation results closer to reality. Yang et al. [31] used the entropy combination model of AHP-LR to obtain the weight value of each evaluation factor, multiplied by the information value in the corresponding factor layer to obtain the comprehensive information value, thus drawing the geological disaster risk zoning map of Zichang City. The research results can provide some reference for the disaster prevention and mitigation work in this area and also have certain reference significance for the risk assessment of geological disasters in similar areas. Bi et al. [32] used the Manas River basin in Xinjiang as the research area and selected the coupling model of information–logistic regression as the evaluation model to assess the susceptibility of geological disasters. The results show that the area under the curve AUC is 0.913, indicating that the evaluation accuracy reaches 91.3%, suggesting that the model is more suitable for the Manas River basin. The evaluation results can provide a reference for the prevention and control of geological disasters in the region. Taking Lantian County as the research area, Li et al. [33] analyzed the multicollinearity between the evaluation factors using three indices and evaluated the susceptibility of geological disasters in the study area using the entropy index model and the logistic regression model. At the same time, the prediction accuracy of the single evaluation model and coupling model was compared, respectively. The results show that the prediction accuracy of the single evaluation model meets the requirements, and the prediction accuracy of the coupled model is higher than that of the single evaluation model. Zhang et al. [34] used the CF model and the I model to couple with the logistic regression model, respectively, to evaluate the susceptibility of geological disasters in Xuanwei City. At the same time, they compared the prediction accuracy of the two coupling models and found that the CF-LR model is more suitable for the susceptibility evaluation of geological disasters in Xuanwei City. The results can be used as a reference for disaster prevention and control and land space planning in Xuanwei City. The studies mentioned above utilize the combination weighting method for assessing geological disasters in the region. The outcomes indicate that this weighting model performs well. When evaluating regional geological disasters, it exhibits higher prediction accuracy compared to a single evaluation model. These assessment findings can serve as a scientific foundation for the activities of relevant government agencies. In contrast to the findings of the aforementioned researchers, the combination weighting method introduced in this paper demonstrates outstanding predictive performance in the risk assessment of geological disasters in Yiliang County. The assessment outcomes can offer valuable scientific guidance to the local government. Furthermore, the coupling model applied in this study exhibits strong adaptability, particularly in situations where data in the study area are limited. We combine the semi-quantitative method with other models, effectively bridging the data scarcity gap. In cases of data scarcity, the expertise and knowledge of experts become increasingly significant. AHP enables experts to assess the relative importance of factors based on their experience, thereby compensating for insufficient data.
AHP divides the complex geological disaster risk assessment problem into a series of levels by decomposing the decision-making problem into a hierarchical structure, making the decision-making problem more structured and easier to understand and analyze. The AHP enables decision-makers to establish the relative importance of different factors through pairwise comparisons. This facilitates the quantification of the contributions of various factors to the geological disaster risk, integrating the expertise of geological disaster experts into the study [35]. The results of AHP can be readily interpreted through weight and hierarchical structure diagrams. Decision-makers gain insights into the influence of each factor on the final evaluation, aiding the development of sound decision-making and risk management strategies.
The information quantity model represents geological disaster risk as a measure of information quantity, offering an intuitive and comprehensible approach. This is convenient for decision-makers and professionals to use to interpret and understand the results. The greater the information quantity, the larger the impact of the factor on the geological disaster risk [36]. The information quantity model comprehensively considers multiple factors influencing geological disasters, quantifying them into information quantity. This fosters a comprehensive analysis of the contribution of various factors, resulting in comprehensive geological disaster risk assessment outcomes. It is worth noting that the information quantity model entails the subjective evaluation and classification of the information quantity for each factor, which relies on subjective judgment and expert experience. Different experts may yield varying evaluation results, potentially affecting the model’s reliability and consistency.
The binary logistic regression model, a data-driven machine learning approach, utilizes existing geological disaster data for training and prediction. The quantitative method, founded on models and theories, incorporates the physical mechanisms and influencing factors of geological disasters. Combining binary logistic regression with quantitative methods harnesses the strengths of both data and models, enhancing the accuracy and reliability of the geological disaster susceptibility assessment [37]. The outcomes of the binary logistic regression model can be translated into probabilities, offering an intuitive understanding of geological disaster susceptibility. Quantitative methods provide rich physical explanations and mechanistic models. The combined approach delivers comprehensive and interpretable evaluation results, aiding decision-makers in understanding potential geological disaster risks.
The combination weighting method merges qualitative information with quantitative data, allowing for a comprehensive consideration of various types of information, even in data-scarce scenarios. In this study, we combine the AHP, the information method, and the binary logistic regression method to create a new set of weighting techniques for studying the geological disaster risk assessment in Yiliang County. AHP proves valuable in handling data scarcity by breaking down complex evaluation problems into multiple levels and factors. This structured approach aids in organizing and processing diverse information, mitigating the challenges posed by data scarcity. AHP accommodates both quantitative and qualitative factors in the evaluation. In cases of data scarcity, the expertise and knowledge of experts become crucial. AHP permits experts to assess the relative importance of evaluation factors based on their experience, thus addressing data gaps. Additionally, AHP includes a consistency test to evaluate the degree of the experts’ agreement in determining relative weights, enhancing the credibility and stability of decision making.
In situations where data are limited, semi-quantitative models offer effective solutions. Aside from the analytic hierarchy process used in this study, the fuzzy comprehensive evaluation (FCE) model also excels in managing data scarcity. The FCE model integrates the opinions of different experts, considering a wide range of perspectives and judgments. This proves highly valuable when dealing with scarce data and information from various sources. It is important to note that employing the FCE model for geological disaster risk assessment necessitates expertise in selecting fuzzy sets and membership functions. Model parameters should be judiciously chosen to align with the specific circumstances, ensuring the model’s applicability.
The selection of evaluation factor variables plays a pivotal role in determining whether the model comprehensively covers the critical factors influencing geological disasters, directly impacting the accuracy and reliability of geological disaster risk assessment. Omitting key variables may hinder the model’s ability to accurately predict potential geological disaster risks. Therefore, the selection of evaluation factors pertinent to geological disasters in specific regions is of the utmost importance. These factors should be aligned with the occurrence mechanisms and influencing factors of geological disasters in the study area. Geological environments, meteorological conditions, and hydrological conditions may vary across different regions, necessitating adjustments in the selection of evaluation factors based on regional characteristics. The evaluation model should strive to incorporate as many relevant factors as possible to yield comprehensive insights. Different types of geological disasters may be influenced by distinct factors, emphasizing the importance of selecting a diverse set of evaluation factors to enhance the model’s comprehensiveness.
Future research should explore the development of geological disaster risk assessment models tailored to regions prone to disasters in China, considering their specific characteristics. Analyzing the changes in function values of independent and dependent variables across various models can further our understanding of the mechanisms behind disasters in different regions. This, in turn, can facilitate the root-cause prevention and control of geological disasters.

6. Conclusions

This paper provides a thorough analysis of the distribution characteristics and hazard-prone environment of geological disaster sites in Yiliang County, based on data from previous geological surveys, meteorological data, and disaster site data, combined with field trip reports. In conclusion, this study selected nine evaluation indices, namely, slope, elevation, relief intensity, and stratigraphic lithology. The comprehensive weight of the evaluation factors was determined using the combination weighting method, coupled with the analytic hierarchy process, the information method, and the binary logistic regression model. The ArcGIS platform was utilized to evaluate geological hazards in Yiliang County. The ROC curve tested the model’s accuracy, resulting in an AUC value of 0.80, indicating the high reliability and accuracy of the prediction results. The study concluded the following:
(1)
The Luoze River, Jiaoqui River, and Baishui River basins are the primary locations of extreme-high-risk and high-risk geological hazards in Yiliang County. The threat of geological hazards is higher in these areas due to their proximity to more people, human-made engineering activities, dense traffic patterns, and the flood season. Medium-risk areas are mainly distributed in Xiaocaoba Town, Longjie Town, the Longhai Town line, and around small rivers and roads. The major threats are the residents, village committees, county roads, and rural roads scattered along the highway. Human engineering activities are absent in the low-risk area, where the geological structure is less intense, vegetation coverage is relatively higher, and the probability of geological disasters is lower.
(2)
Geological disasters in Yiliang County are significantly affected by four factors: elevation, human engineering activities, vegetation coverage, and distance from rivers. Especially in the elevation range of 516 m–1016 m, this location is suitable for building houses and planting crops, leading to strong human engineering activities and significant disturbance to the geological environment. The closer the slope is to the river, the more prone it is to geological disasters. The continuous scouring effect of the river on both sides creates a free surface, making the rock and soil in the riverbank and nearby areas unstable and increasing the risk of geological disasters such as landslides and collapses. The high-risk area of geological disasters in Yiliang County has low vegetation coverage, and sparse vegetation promotes frequent geological disasters. Vegetation roots firmly bind the soil to the surface, reducing soil erosion. When the vegetation coverage rate is low, the lack of root fixation makes the surface soil susceptible to being washed away by rain and wind, increasing the risk of collapse, landslide, and debris flow geological disasters.
(3)
Human engineering activities largely control geological hazards in Yiliang County. Most of the houses and roads built by humans in the region are located in fragile geological environments, and mining is the pillar industry of Yiliang County. Blasting engineering influences the lithology in the area as economic construction grows and human development activities in mines expand, and geological catastrophes are much more likely when the ground surface is disturbed during engineering construction.
(4)
Managing geological hazards is critical since human and property safety are at risk. Geological hazard prevention and control should receive top-priority attention from the appropriate government agencies. Government departments should provide professional guidance and employ scientific methods to manage existing slopes in the area during artificial and irrational engineering activities, such as building houses on high and steep slopes, constructing roads without reasonable design and geological hazard assessment, and undertaking engineering blasting without a strict plan. Targeted prevention and control measures need to be adopted based on the level of risk zoning, considering the principle of focused prevention for schools, scenes, road sections, watersheds, towns, and other key prevention and protection objects. This should be combined with prevention and control measures for medium- and low-risk areas to improve the future mass-monitoring and prevention system.

Author Contributions

All authors contributed to the study conception and design. Material preparation, data collection, and analysis were performed by S.T., H.G., R.L., Y.S. and J.L. The first draft of the manuscript was written by S.Z., and all authors commented on previous versions of the manuscript. All authors have read and agreed to the published version of the manuscript.

Funding

This work was supported by the Science and Technology Innovation Team Program of the Yunnan Province Education Department (Grant NO. CY22624109); the Graduate Tutor Team Program of the Yunnan Province Education Department (Grant NO. CY22622205); the Yunnan Fundamental Research Projects (Grant NO. 202301BF070001-020); the Yunnan Key research and development plan program (Grant NO. 202303AP140020); and the Xing Dian Talent Teacher’s Program of Yunnan Province (Grant NO. XDTT202206).

Institutional Review Board Statement

Not applicable.

Informed Consent Statement

Not applicable.

Data Availability Statement

The DEM and NDVI data are openly available in [the geospatial data cloud platform] at [https://www.gscloud.cn/] (accessed on 12 July 2023). Geological hazard point data and 1:200,000 geological maps are openly available from [the Geographic Remote Sensing Ecology Network platform] at [http://www.gisrs.cn/] (accessed on 2 August 2023). Water system and road data can be obtained from [the National Catalogue Service for Geographic Information] at [https://www.webmap.cn/] (accessed on 6 August 2023).

Conflicts of Interest

The authors declare no conflict of interest.

References

  1. Tan, S.C.; Zhao, X.Y. Risk assessment on the geological disasters based on GIS and information content model: Taking Qiubei County, Yunnan Province as an example. J. Northwest Norm. Univ. Nat. Sci. 2018, 54, 67–76. [Google Scholar] [CrossRef]
  2. Zhao, X.; Tan, S.; Li, Y. Dongchuan district based on slope unit and combined empowerment method geological hazard risk evaluation. J. Yunnan Univ. Nat. Sci. Ed. 2021, 43, 299–305. [Google Scholar] [CrossRef]
  3. Li, G.; Tie, Y. Comparative study on modeling methods of comprehensive geological hazard susceptibility based on information model. J. Catastrophol. 2023, 38, 212–221. [Google Scholar] [CrossRef]
  4. Zhang, X.D.; Liu, X.; Zhao, Z.P.; Wu, D.; Wu, W.Z.; Chu, X.D. Geological disaster hazard assessment in Yanchi County based on AHP. Remote Sens. Nat. Resour. 2019, 31, 183–192. [Google Scholar] [CrossRef]
  5. Tang, C.; Ma, G.C. Small regional geohazards susceptibility mapping based on geomorphic unit. Sci. Geogr. Sin. 2015, 35, 91–98. [Google Scholar] [CrossRef]
  6. Du, J.; Ying, K.L.; Chen, L.X. GIS-based landslide hazard zonation of new seat of Badong County. J. Nat. Disasters 2011, 20, 149–155. [Google Scholar] [CrossRef]
  7. Liu, L.; Meng, X.; Guo, P. Assessment of debris flow hazards in the Bailongjiang river based on the watershed unit and information value method. J. Lanzhou Univ. Nat. Sci. 2017, 53, 292–298. [Google Scholar] [CrossRef]
  8. Zhang, Y.S.; Guo, C.B.; Yao, X.; Yang, Z.H.; Wu, R.A.; Du, G. Research on the geohazard effect of active fault on the eastern margin of the Tibetan Plateau. Acta Geosci. Sin. 2016, 37, 277–286. [Google Scholar] [CrossRef]
  9. Shang, H.; Ni, W.K.; Cheng, H. Application of slope unit division to risk zoning of geological hazards of Pengyang county. Soil Water Conserv. China 2011, 69, 48–50. [Google Scholar] [CrossRef]
  10. Qu, F.; Zhang, J.; Tang, M. Assessment process and key issues of regional geological disaster hazard based on GIS. J. China Norm. Univ. Nat. Sci. 2018, 39, 420–421. [Google Scholar] [CrossRef]
  11. Deng, H.; He, Z.W.; Chen, Y.; Cai, H.; Li, X. Application of information quantity model to hazard evaluation of geological disaster in mountainous region environment: A case study of Luding County, Sichuan Province. J. Nat. Disasters 2014, 23, 67–76. [Google Scholar]
  12. Fu, S.; Liang, L.; Liu, Y. Assessment on geohazard susceptibility in Xinlong section of Yalong River based on CF-logistic model. Res. Soil Water Conserv. 2021, 28, 404–410. [Google Scholar] [CrossRef]
  13. Guo, Z.Z.; Yin, K.L.; Fu, S.; Huang, F.; Gui, L.; Xia, H. Evaluation of landslide susceptibility based on GIS and WOE-BP model. Earth Sci. 2019, 44, 4299–4312. [Google Scholar]
  14. Tan, S.; Liu, X.; Xie, Y.; Yang, L.; Zhao, Z.F. Assessment on susceptibility of geohazard for a proposed expressway. Res. Soil Water Conserv. 2019, 26, 373–380. [Google Scholar] [CrossRef]
  15. Ye, X.; Qian, D.; Zhu, Z. Hazard assessment of debris flow at Aoyitake-Bulunkou section of China-Pakistan highway based on combined weight method. Bull. Soil Water Conserv. 2018, 38, 247–248. [Google Scholar] [CrossRef]
  16. Fan, Z.Y.; Gou, X.F.; Qin, M.Y.; Fan, Q.; Yu, J.L.; Zhao, J.J. Information and logistic regression models based Coupling analysis for susceptibility of geological hazards. J. Eng. Geol. 2018, 26, 340–347. [Google Scholar] [CrossRef]
  17. Li, X.; Xue, G.C.; Liu, C.Z.; Xia, N.; Yang, Y.P.; Yang, F.; Wang, X.; Chang, Z. Evaluation of geohazard susceptibility based on information value model and information value-logistic regression model: A case study of the central mountainous area of Hainan Island. J. Geomech. 2022, 28, 294–305. [Google Scholar] [CrossRef]
  18. Qin, Y.G.; Yang, G.L.; Jiang, X.Y. Geohazard susceptibility assessment based on integrated certainty factor model and logistic regression model for Kaiyang, China. Sci. Technol. Eng. 2020, 20, 96–103. [Google Scholar]
  19. Devkota, K.C.; Regmi, A.D.; Pourghasemi, H.R.; Yoshida, K.; Pradhan, B.; Ryu, I.C.; Dhital, M.R.; Althuwaynee, O.F. Landslide susceptibility mapping using certainty factor, index of entropy and logistic regression models in GIS and their comparison at Mugling–Narayanghat road section in Nepal Himalaya. Nat. Hazards 2013, 65, 135–165. [Google Scholar] [CrossRef]
  20. Riegel, R.P.; Alves, D.D.; Schmidt, B.C.; de Oliveira, G.G.; Haetinger, C.; Osório, D.M.M.; Rodrigues, M.A.S.; de Quevedo, D.M. Assessment of susceptibility to landslides through geographic information systems and the logistic regression model. Nat. Hazards 2020, 103, 497–511. [Google Scholar] [CrossRef]
  21. Merghadi, A.; Abderrahmane, B.; Tien Bui, D. Landslide susceptibility assessment at Mila Basin (Algeria): A comparative assessment of prediction capability of advanced machine learning methods. ISPRS Int. J. Geo-Inform. 2018, 7, 268. [Google Scholar] [CrossRef]
  22. Feng, X.; Li, Y.; Deng, X. Evaluation of the susceptibility of geological disasters in the alpine and canyon areas: Taking Nujiang Prefecture as an example. J. Henan Polytech. Univ. Nat. Sci. 2022, 41, 3–5. [Google Scholar]
  23. Li, X.; Fu, H.; Zhang, Y. Study on the influences of topography on landslide mobility. J. Disaster Prev. Mitig. Eng. 2020, 40, 867–877. [Google Scholar] [CrossRef]
  24. Jiang, D.M.; Li, Y.M.; Bao, H.S. Study on sensitivity in disaster-pregnant environmental factors of landslide in Lushui County. J. Nat. Disasters 2016, 25, 109–119. [Google Scholar] [CrossRef]
  25. Tian, L.Q. Regional differentiation of the mountain hazard chain in Southwest China. Mt. Res. 1995, 13, 116–120. [Google Scholar]
  26. Gao, K.C.; Cui, P.; Zhao, C.Y.; Wei, F.Q. Landslide hazard evaluation of Wanzhou based on GIS information value method in the Three Gorges Reservoir. Chin. J. Rock Mech. Eng. 2006, 25, 991–996. [Google Scholar] [CrossRef]
  27. Luo, H.D.; Li, R.D.; Zhang, B.; Cao, B. An early warning model system for predicting meteorological risk associated with geological disasters in the Longnan area, Gansu Province based on the information value method. Earth Sci. Front. 2019, 26, 289. [Google Scholar] [CrossRef]
  28. Wang, Z.; Yi, F.C. AHP-based evaluation of occurrence easiness of geological disasters in Mianyang City. J. Nat. Disasters 2009, 18, 14–23. [Google Scholar] [CrossRef]
  29. Wang, X.J.; Sun, S.Q.; Lu, P.F. Application of AHP to geological hazards risk assessment in a County, Chongqing. Earth Environ. 2014, 42, 419–423. [Google Scholar] [CrossRef]
  30. Fan, Q.; Ju, N.; Xiang, X. Landslides hazards assessment with weights of evidence—A case study in Guizhou, China. J. Eng. Geol. 2014, 22, 474–481. [Google Scholar] [CrossRef]
  31. Yang, K.; Xue, X.C.; Duan, Z.; Yang, Y.P. Risk Assessment of Geological Hazards in Zichang County Based onAHP-LR Entropy Combined Model. Sci. Technol. Eng. 2021, 21, 11551–11560. [Google Scholar]
  32. Bi, J.A.; Xu, P.H.; Song, S.Y.; Ding, R. Assessment of the susceptibility to geological hazards in the Manas River Basin based on the coupled information value-logistic regression model. J. Eng. Geol. 2022, 30, 1549–1560. [Google Scholar] [CrossRef]
  33. Li, L.F.; Zhang, X.H.; Deng, H.L.; Han, L.P. Assessment of Landslide Susceptibility Based on Coupling Model of Indexof Entropy and Logistic Regression: A Case Study of Lantian County. Sci. Technol. Eng. 2020, 20, 5536–5543. [Google Scholar]
  34. Zhang, S.; Tan, S.; Liu, L.; Ding, D.; Sun, Y.; Li, J. Slope Rock and Soil Mass Movement Geological Hazards Susceptibility Evaluation Using Information Quantity, Deterministic Coefficient, and Logistic Regression Models and Their Comparison at Xuanwei, China. Sustainability 2023, 15, 10466. [Google Scholar] [CrossRef]
  35. Li, P.; Ye, H.; Tan, S.C. Evaluation of Geological Hazards in Yongde County Based on Analytic Hierarchy Process. Res. Soil Water Conserv. 2021, 28, 394–406. [Google Scholar]
  36. Wang, X.W.; Zhang, L.L.; Mo, D.K.; Ye, Z.D.; Jiang, F. Hillslope geo-hazard susceptibility assessment in Pingguo City based on coupling of CF information value and MLPC classifier model. Carsologica Sin. 2023, 42, 370–381. [Google Scholar] [CrossRef]
  37. Wang, X.; Shi, Y.; Chen, H. Evaluation of geological hazard susceptibility based on certainty factors coupling logistic regression. Bull. Surv. Mapp. 2022, 11, 112–117. [Google Scholar] [CrossRef]
Figure 1. Overview of the study area.
Sustainability 15 13978 g001
Figure 4. Zoning of risks.
Sustainability 15 13978 g004
Figure 5. The ROC curve of geological disaster hazards.
Sustainability 15 13978 g005
Table 1. Distribution statistics of geological disasters in Yiliang Country.
Type of DisasterCollapseLandslideDebris FlowSurface Subsidence
Jiaokui Town14071
Niujie Town6112
Luozehe Town63172
Haizi Town1124
Qiaoshan Town111
Longan Town210
Lianghe Town9
Zhongming Town321
Xiaocaoba Town11
Longhai Town16
Liuxi Town261
Luowang Town163
Longjie Town463
Kuixiang Town361
Shulin Town1211
Total28156348
Table 2. The calculation result of each evaluation factor information.
Impact FactorsClassificationInformation ContentImpact FactorsClassificationInformation Content
Gradient
(°)
0–15−0.1386492Distance from road
(m)
0–3001.450189108
15–30−0.09654411300–6000.916860104
30–450.363680225600–9000.093243182
45–601.025940375900–12000.356187007
>601200–1500−0.26547261
Elevation
(m)
<516>1500−0.75841116
516–10161.399668951Distance from river
(m)
0–5001.342107872
1016–15160.494289831500–10000.374230655
1516–2016−0.920763521000–1500−0.0478408
2016–2516−0.918663691500–2000−0.41362595
>2516>2000−0.99086611
Relief intensity
(m)
0–20−0.2789657Annual precipitation
(mm)
<958.1
20–500.012930825958.1–978.10.030706887
50–1000.530207629978.1–998.10.192263312
>100−0.00249795998.1–1111.4−0.16739841
Stratum lithologicSoft rock0.063800709NDVI0–0.2
0.2–0.4
0.4–0.6
0.6–0.8
0.8–1.0
1.098326612
0.658416921
0.72502741
−0.11773857
−0.48126463
Soft and hard interlayer rock0.083395084
Loose soil mass−0.1467496
Secure rock
Distance from fault
(m)
0–5000.082351752
500–10000.002748954
1000–1500−0.29100854
>15000.01031463
Table 3. Total order of A–C for AHP.
Intermediate LayerWeightBottom LayerTotal Weight (A–C)
B10.540C1 0.7500.4050
C2 0.2500.1350
B20.163C3 0.3450.0562
C4 0.1850.0302
C5 0.3700.0603
C6 0.1000.0163
B30.297C7 0.4360.1295
C8 0.2180.0647
C9 0.3460.1028
Table 4. The results of logistic regression analysis of each evaluation factor.
ModelFactorβStandard ErrorWaldDegree of FreedomSignificanceExp (B)
ISlope0.1000.6040.02810.8681.106
Elevation0.5770.17710.67110.0011.780
Terrain undulation0.3930.6090.41710.5191.481
Lithology−2.4631.1704.42910.0350.085
Distance from fault−0.6310.9720.42110.5170.532
Distance from road0.6090.14417.86610.0001.838
Distance from river0.3960.1526.74210.0091.485
Average annual rainfall1.6990.7914.61010.0325.467
NDVI0.7800.20614.40010.0002.181
Constant0.0250.1150.04810.8271.025
Table 5. Zoning of geological risks.
Hazard ClassificationNumber of Existing DisastersProportion (%)Area (km2)Proportion (%)
Low-hazard zone2711.951139.7341.72
Medium-risk zone3515.49835.8430.59
High-hazard area5825.66535.8819.61
Extreme-high-risk area10646.90220.558.08
Disclaimer/Publisher’s Note: The statements, opinions and data contained in all publications are solely those of the individual author(s) and contributor(s) and not of MDPI and/or the editor(s). MDPI and/or the editor(s) disclaim responsibility for any injury to people or property resulting from any ideas, methods, instructions or products referred to in the content.

