Article

Explanatory Factors of School Climate and School Identification: An Analysis of Multilevel Latent Profiles

by
José Luis Gálvez-Nieto
1,
Karina Polanco-Levicán
2,3,*,
Braulio Navarro-Aburto
4 and
Juan Carlos Béltran-Véliz
5
1
Departamento de Trabajo Social, Universidad de La Frontera, Temuco 4780000, Chile
2
Programa de Doctorado en Ciencias Sociales, Universidad de La Frontera, Temuco 4780000, Chile
3
Departamento de Psicología, Universidad Católica de Temuco, Temuco 4780000, Chile
4
Instituto Ciencias de la Educación, Universidad Austral de Chile, Valdivia 5110566, Chile
5
Núcleo Científico Tecnológico en Ciencias Sociales y Humanidades, Universidad de La Frontera, Temuco 4811230, Chile
*
Author to whom correspondence should be addressed.
Sustainability 2023, 15(19), 14064; https://doi.org/10.3390/su151914064
Submission received: 28 July 2023 / Revised: 16 September 2023 / Accepted: 19 September 2023 / Published: 22 September 2023
(This article belongs to the Section Sustainable Education and Approaches)

Abstract

:
School climate is a highly relevant variable that is associated with a series of positive results. However, there are still few studies that have statistically modelled the simultaneous influence of structural variables at the school level on the individual perception of the school climate and identification. This study had two objectives: (1) Identify school climate and school identification profiles at the individual and school levels. (2) Relate school climate and school identification profiles to factors located at the individual and school levels. The participants were selected from a probabilistic and stratified sample, n = 2070 adolescents (40.6% men, 59.4% women), aged between 13 and 18 years (M = 14.64, SD = 0.718), from 28 secondary schools in Chile. The results allowed us to identify four clusters at the student level and two classes of school climate at the school level. The explanatory factors at the individual level were Cognitive engagement (p < 0.001), Academic Expectations (p < 0.001), Positive Attitude to Authority (p < 0.001) and Family Conflict (p < 0.001). The explanatory factor at the school level was the school vulnerability index (p = 0.031). Finally, the explanatory effects of factors at individual and school levels on school climate are theoretically discussed.

1. Introduction

School climate is a complex and multidimensional construct that has captured the interest of different researchers who have widely discussed its theoretical-conceptual definition [1,2,3]. In general terms, school climate has been defined as the quality of social relationships and the character of school life [4,5]. Specifically, school climate refers to the social relationships between students, teachers and professional staff, and it also addresses academics, values, approaches and norms shared by the educational community [6].
School climate is a highly relevant construct considering that it relates to adolescents’ mental health, since an adequate relationship between students is negatively associated with depressive symptoms, and an appropriate relationship between students–teacher is negatively linked to hostility [7]. School climate moderates (dampens) the relationship between homophobic victimization and depression [8]. Along the same lines, school climate is associated with school satisfaction and life satisfaction [9], and with greater emotional commitment and fewer burnout symptoms among students [5]. Furthermore, Barbosa et al. [10] pose that the greater the school commitment and positive school climate, the lesser the externalization behaviors. On the contrary, educational establishments that present deteriorated school climates show an increased probability of bullying [11,12,13,14,15], as well as of developing risky behavior, such as substance use [16,17,18].
School climate has also been related to higher academic achievement [19,20,21], and to students’ college projection [22]. In this sense, school climate and high academic expectations of teachers for their students are associated with adolescents’ grades average [23,24], agreeing with Kraft et al. [25] who state that higher school safety and academic expectations are linked to students’ increased academic achievement. Moreover, teachers’ academic expectations are related to lower dropout rates [26], affective engagement, and cognitive engagement [27]. Along the same line, school engagement, which is made up of three subtypes of cognitive, behavioral and affective engagement, is linked to an adequate relationship between students and teachers [28,29,30]; specifically, it is appreciated that the higher the cognitive engagement, the higher the academic performance and class attendance [30].
On the other hand, school climate is related to attitudes towards authority through student values [31]. Del Moral et al. [32] found that Spanish adolescents who showed violent behavior towards their parents also showed a lower positive attitude towards institutional authority, a lower perception of a positive school climate (participation, friendships, and teacher help) and a higher positive attitude towards the transgression of social norms. It should be noted that adolescents with families with a lenient style showed a higher positive attitude towards the transgression of social norms [33]. Thus, positive family relationships are linked to a positive perception of the community environment, positive attitudes toward authority and towards social rules, these being considered protective factors against aggressive behavior toward peers [34]. On the contrary, a defiant attitude towards authority is related to lower academic performance [35]. Coincidentally, Musitu et al. [36] report that the quality of interactions with parents and the teacher’s expectations of the student are linked to attitudes toward authority and violent behavior at school.
Therefore, the family plays a relevant role in the development of their adolescent children in their adaptation to school [10,37,38]. Specifically, a family climate where inter-parental conflict is present influences the violent behavior of schoolchildren [39,40,41]. According to Ding et al. [42], cyberbullying victims experience high inter-parental conflict and poor school climate. In this sense, school climate and family climate contribute to explaining violence among students [43]. In addition, family conflict predicted children’s internalizing and externalizing behavior; conversely, parental warmth negatively predicted this type of problem in cross-sectional and longitudinal cohort studies [44,45,46,47]. Additionally, it is evident that inter-parental conflict increases risky behaviors by favoring affiliation with peers who present deviant behavior. Thus, negative school climate encourages participation in these peer groups with inappropriate behaviors and, therefore, risky behaviors [48]. According to Ye et al. [48], adolescents could learn relational patterns from their parents’ conflictive relationships. In addition, meeting support and belonging needs would be covered by participation in groups with deviant behaviors.
Another element to consider for students to adapt, to a lesser extent [49], is school vulnerability and adequate school climate, since it has been observed that positive school climate and higher family income are associated with lower internalizing and externalizing symptoms, which provides evidence that higher SES could be considered as a protective factor [46,50]. It is important to mention that Latin America is the region with the highest segregation by socio-economic level [51], which hinders students from reaching their potential and negatively influences teachers and families due to low expectations about their children’s performance [51,52,53]. Consequently, a positive school climate is associated with higher achievement attained by students from vulnerable ethnic groups and students from disadvantaged backgrounds (lower SES), and school climate can increase academic opportunities and the mathematics performance of these students [54,55].
According to Lee et al. [6], it is relevant to consider the evaluation of school climate together with school identification, given that the school climate allows access to the student’s perception of the characteristics of the groups that make up the school, while school identification is related to the cognitive and emotional assessment that the student makes of the groups that are part of their educational community and that would be part of the construction of their identity, by influencing their beliefs and behavior [56,57,58]. In this sense, the norms and values of the group are internalized, forming self-concept. Therefore, the above-mentioned factors would allow a deeper understanding of the student and their relationship with the school [6,56,57,58]. It is important to mention that the evaluation of school climate and school identification is an emerging approach that has progressively achieved greater development [59,60,61].
In the same line, it can be noted that school identification and school climate predict academic performance [62,63], as well as bullying victimization and aggression [64]. Meanwhile, Maxwell et al. [65] pose that the perception of school climate by the students explains to a great extent their academic achievements in writing and mathematics, this relationship being mediated by the identification of the students with the school. On the other hand, school identification is negatively related to a positive attitude towards transgression, while it is positively associated with a positive attitude towards authority [61,66], being relevant for establishing adequate relationships with others [66].
In consequence, school climate continues to be of interest because it is related to different constructs at individual, family, community and cultural levels that influence the experience and development of students, as well as other human groups that make up the educational community, which becomes even more relevant considering that children and adolescents are in the process of the full cognitive, socio-affective and moral development that will allow them to adapt and contribute to society [5,6,7,19,48]. In this way, the relationships they establish with the members of their school can provide them with the necessary support in different areas, feeding back into other areas such as family [10]. In this sense, the ecological systems theory of Bronfenbrenner [67] is often used in research [1,3,61,66], allowing analysis of the interrelationships between elements from different contexts in which a student matures and their influence on individual development.
This study sought to integrate the theoretical approach of social identity and school climate. Both constructs are defined differently; however, they have been represented under the same integrating model [6,60,68].

1.1. Study of the Heterogeneity of School Climate Clusters

The study of the heterogeneity of school climate groups is a relevant line of research. This research approach assumes that there may be different clusters of students who could eventually be interacting in the same school. With the inclusion of multilevel models, this assumption can be expanded, by statistically modelling the influence of contextual variables on the individual perception of the school climate.
In this respect, a multilevel study that related school climate (both at individual and school level) with chronic absence was carried out. The results allowed us to conclude an important relationship at both levels, individual and school, between the school climate and chronic absence [69]. Shukla et al. [70] states that perception of school climate may vary among students considering external factors such as race, grade level, parental education level, educational aspirations, and frequency of risky behaviors.
DiStefano et al. [71] when analyzing latent profiles of school climate pose that the profiles of students who belong to schools with a poor school climate have higher poverty rates and smaller school sizes, considering that the poverty rate decreases progressively when the latent profiles of school climate are characterized as being more positive. On the other hand, the psycho-social adjustment of adolescents is important to achieve higher academic performance. In this sense, it is observed that the school climate profiles of students with multiple resources and intra-oriented (intrapersonal) resources are associated with higher average school performance [72].
Capp et al. [73] refer in their research to six types of profiles of seventh, ninth, and eleventh-grade U.S. students. Profile 1, called “Negative Climate” (5.34%), has lower levels of school connectedness, teacher support, meaningful participation, and security. Profile 2, called “Higher Support” (1.46%), manifests low levels of school connectedness and a perception of insecurity at school, combined with a perception of high meaningful participation and teacher support. Profile 3, called “Academically Disconnected” (21.35%), integrates those students moderately high in connectedness and safety, with low scores in teacher support and participation. Profile 4, called “Typical” climate (44.04%), involves students who report higher perceptions of safety in their school, better connectedness, and teacher support. On the other hand, moderate levels of meaningful participation are evident. In Profile 5, called “Moderate” climate (8.66%), students present lower connectedness, teacher support and meaningful participation compared to profile 4. Profile 6, called “Positive Climate” (19.16%), reported high levels in all dimensions of school climate.
Additionally, Gage et al. [74] conducted research to identify students at high risk of bullying victimization and its relationship with school climate, and three profiles were formed (high-risk group, control group and low-risk group), reporting that the school climate factors that are significant predictors are respect for differences, support at home, peer support and perception of safety. It is interesting to note that the latent profiles of teachers about the school environment and the assessment of their students’ behavior show that, if the perception of the school environment was positive, the scores for disruptive behavior and internalizing symptoms were lower, adding higher scores for pro-social behaviors and family involvement [75]. In this sense, Zhao & Jin [76] emphasize that most teachers perceive the school climate as moderate or barely satisfactory.
On the other hand, Sulak [77] carried out a study with secondary data from 2560 schools. From a latent class analysis, six classes of schools were identified; High frequency (6.48%), Low respect (14.61%), Low frequency (21.60%), Extreme bullying (16.25%) and Average schools (41.05%). Similarly, De Pedro et al. [78] conducted research with secondary data on 577,026 students. The latent class analysis identified four classes of students; Some caring, connectedness, and safe (51.1%), Negative climate (11.3%), High caring, participation, and safe (2.4%), Positive climate (3.4%). The findings indicated that Black students were three times more likely to be in the negative school climate class, compared to white students. In addition, students in higher grades were more likely to be in the negative school climate class, while gender did not significantly predict school climate class membership.
School climate evaluated in a sample of 2683 Chilean secondary school students between the ages of 12 and 20 reports a model of six student clusters that integrates the following indicators: school climate, relationships with teachers, positive attitude towards authority and positive attitude towards transgression, these being significant for the segmentation of the clusters. In the same study, it can be noted that age and sex are significantly associated at the individual level; at family level, family structure is identified; at the community level, the type of establishment, the perception of insecurity in the neighborhood, social control and support are identified [68].
It is important to mention that this research uses a person-centred approach called latent profile analysis (LPA), which allows the grouping of students according to their perception of school climate and other variables, i.e., it allows identifying groups of students with similar characteristics in a data set [79,80]. This makes it possible to carry out differentiated interventions that are more relevant and pertinent considering the different student profiles and their assessment with respect to the constructs evaluated, in this case, school engagement, family climate, attitudes towards authority, academic expectations, school climate, and school identification. Therefore, it allows us to focus on those groups and the relevant variables, for example, the profile that perceives a more deteriorated climate, and to intervene in those variables that are linked to these perceptions.

1.2. Current Study

Considering this background and the possibility of simultaneously analyzing the individual and school context of the student, this study had two objectives: (1) Identify school climate and school identification profiles at the individual and school level; (2) Relate school climate and school identification profiles to factors located at the individual and school levels. The relevance of conducting an explanatory study that integrates theoretical frameworks underpinning the school climate and school identification constructs [6,62,64,65], despite still being an emerging field, allows the field of study to obtain a more complete picture of students’ experience of school life and how these patterns of experiences relate to individual and school-level factors. On the other hand, the possibility of implementing a person-centered study allows capturing the heterogeneity of perceptions of school climate through a multidimensional perspective that integrates the features of this construct, and allows also the identification of the various subgroups present in the sample [79,80].
Bearing in mind the theoretical and conceptual background, which supports the diversity of experiences and perceptions of school climate and school identification, this study was guided by the following hypotheses: (h1) it is expected that there will be heterogeneity of school climate and school identification profiles within this sample both at the student and school levels. (h2) It is expected that school climate and school identification profiles will be influenced by personal factors, such as respect for authority, academic expectations, family climate and school engagement, and at the school level by school achievement, school vulnerability and school size.

2. Materials and Methods

2.1. Participants

The population was composed of (N) 47,714 students from municipal, subsidized-private, and paid-private educational establishments. The students belonged to five regions, which represent the macro-zones of Chile [81]. Participants were selected using a probabilistic and stratified sample, with a confidence interval of 99.7%, a variance of p = q = 0.50, and a margin of error of 3.8% [82]. The sample was made up of (n) 2070 adolescent students, from 28 secondary schools, both sexes (40.6% men, 59.4% women), age range 13 to 18 years (M = 14.64, SD = 0.718). The selected establishments included students from different socio-economic strata, mainly from medium and low levels (Table 1).

2.2. Instruments

To reach the research objectives, various instruments were applied. A sociodemographic questionnaire was created to characterize students. The questionnaire consisted of closed-answer questions related to these variables: age, sex, region, geographical area, administrative unit of the educational establishment, family structure, and school vulnerability index [83].
The School Climate and School Identification Measure-Student (SCASIM-St) was applied. This self-report scale measures school climate and school identification (SCASIM-St [6,61,68], based on 38 items that are answered using a five-point ordinal response scale (1 = totally disagree, 5 = totally agree). The SCASIM-St has the following factorial structure: four first-order factors, i.e., Student–Student Relations (seven items, e.g., “Students are friendly to each other”), Student-Staff Relations (nine items, e.g., “Staff care about students”), Academic Emphasis (eight items, e.g., “Teachers challenge students to do better”), Shared Values and Approach (eight items, e.g., “The school values and goals are well understood”); these four factors are grouped into a second-order factor called School Climate. The SCASIM-St also presents a fifth factor related to the second order factor, called School Identification (six items, e.g., “I feel a strong connection with this school”).
Subsequently, the Attitudes to Institutional Authority in Adolescence Scale (AIA-A) was applied. This is a nine-item self-report scale, which evaluates adolescents’ attitudes towards authority figures (AIA-A) [66]. The AIA-A is answered using a five-point ordinal scale (1 = never, 5 = Always). The factorial structure of the AIA-A is composed of two factors: positive attitude to authority (five items, e.g., “The police are there to make a better society for everyone”), referring to the degree of respect towards teachers and the police; and positive attitude to transgression (four items, e.g., “It is normal to break the law if no one is harmed”), referring to positive attitudes towards transgressing school rules.
Additionally, the Academic Expectations Scale (AES) was applied, a 5-item instrument that assesses students’ perception of their teachers’ academic expectations (AES) [27,84]. The AES is answered using a five-point ordinal response scale (1 = Strongly disagree, 5 = Strongly agree). The academic expectations scale has a one-dimensional structure (five items, e.g., “My teachers expect me to work hard”).
In addition, the adapted version of the Family Climate Scale (FES) was applied. This scale measures the social climate and interpersonal relationships within the family [85]. This scale has nine items that are measured on a dichotomous scale with two response alternatives (True or False). The scale evaluates three factors: cohesion (three items, e.g., “In my family there is a strong feeling of togetherness”), referring to the degree of affection among family members; expressiveness (three items, e.g., “At home we talk openly about what we feel or want”), referring to the expressiveness of feelings and opinions among family members; and conflict (three items, e.g., “In my house we sometimes have fights”), referring to the presence of conflicts among family members.
Finally, the School Engagement Scale (SES) was applied. The SES measure is a self-report instrument that has 29 items, which are part of the school engagement scale (SES) [28]. The SES is answered using a five-point ordinal scale (1 = never or almost never, 5 = Always or almost always). For the purposes of this study, the cognitive engagement dimension was used (12 items, e.g., “When I am doing an activity, I try to understand as much as possible”).

2.3. Procedures

For the application of the instruments, the directors of the educational establishments were contacted and they were asked to sign an agreement to access the sample. Informed consents were then sent to the parents or guardians of the students, and once the authorizations were obtained, the students responded with an informed assent. Ethical safeguards were evaluated and approved by the ethics committee of the Universidad de La Frontera, Chile.

2.4. Data Analysis

The psychometric properties of the scales applied were preliminarily evaluated. First, a confirmatory factor analysis (CFA) was implemented, using a poly-choric correlations matrix and the Weighted Least Square with mean and variance adjusted (WLSMV) estimation method. To evaluate the quality of the model [86], three goodness-of-fit indices were used: comparative fit index (CFI ≥ 0.90), Tucker–Lewis index (TLI ≥ 0.90) and the indexes’ root mean square error of approximation and standardized root mean square residual (RMSEA, SRMR ≤ 0.08) [87,88]. Reliability estimation was performed on JASP 012.2 software, using the following coefficients: McDonald’s ω and Cronbach’s α [89,90].
Multi-level latent profile analysis (MLPA) was implemented using the maximum likelihood estimation with robust standard errors method, via the Latent Gold 5.1 software [91]. The MLPA made it possible to identify school climate patterns, considering the hierarchical structure of the data, since students (level 1) are nested in schools (level 2). The use of the multilevel approach made it possible to integrate both the individual perception of school climate and the general effect of school climate perceptions at the school level. The terminology used in MLPA models names level 1 groupings as clusters (students) and level 2 groupings (schools) as classes.
For the implementation of the MLPA, a non-parametric approach was followed [92], based on the assumption that some model parameters may vary due to the influence of level 2 clusters. Multilevel analyses allow evaluation of the variability across Level-2 units for the intercept of each indicator and makes it possible to examine how level-2 units influence the level-1 indicators that define latent profile membership. Random intercepts between level 2 units were the default estimation method [92].
To identify the best fit of the model, a series of latent profile analysis (LPA) was performed at the individual level (level 1). Once the best solution was selected at the individual level, the models that included the profiles at the school level (level 2) were estimated. Finally, the best MLPA solution was selected and finally covariates at both levels were added to examine associations with the identified profiles.
The models estimated to identify the heterogeneity of school climate patterns, both at student and school level, correspond to the standardized scores of the five SCASIM-St indicators, i.e., Student–Student Relations, Student–Staff Relations, Academic Emphasis, Shared Values and Approach and School Identification. Then, in order to reach the objective of characterizing the identified clusters, the associations between school climate profiles and the six covariates were analyzed using the Bolck, Croons and Hagenaars method (BCH) [93].
The selection of the optimal number of clusters was based on the goodness-of-fit Bayesian Information Criterion (BIC) [94] and the Akaike Information Criteria (AIC) [95]. Both criteria are more conservative than the Akaike Information Criterion (AIC) and tend to favor the choice of more parsimonious models [96]. Full details on the parameter estimation method with Latent Gold 5.1 are available in the work of Vermunt and Magidson [91].

3. Results

3.1. Preliminary Results: Measurement Models for Latent Variables

The validity and reliability indices of the scales applied in this study, SCASIM-St, AIA-A, AES, SES and FES, are presented below. First, the factor structure of the instruments was evaluated, fitting five confirmatory models according to previous psychometric precedents. The scales presented satisfactory goodness-of-fit indices (Table 2), ratifying the factor structures reported by the initial psychometric articles.
After identifying the factorial structures, the reliability of the scale scores was evaluated using Cronbach’s alpha and McDonald’s omega coefficients, revealing satisfactory indicators for all the dimensions evaluated (Table 3).
Preliminary to the implementation of the LPA, an analysis of the bivariate correlations between the school climate and school identification indicators was conducted, finding positive and statistically significant correlations, and demonstrating their association and relevance for inclusion in subsequent analyses (Table 4).

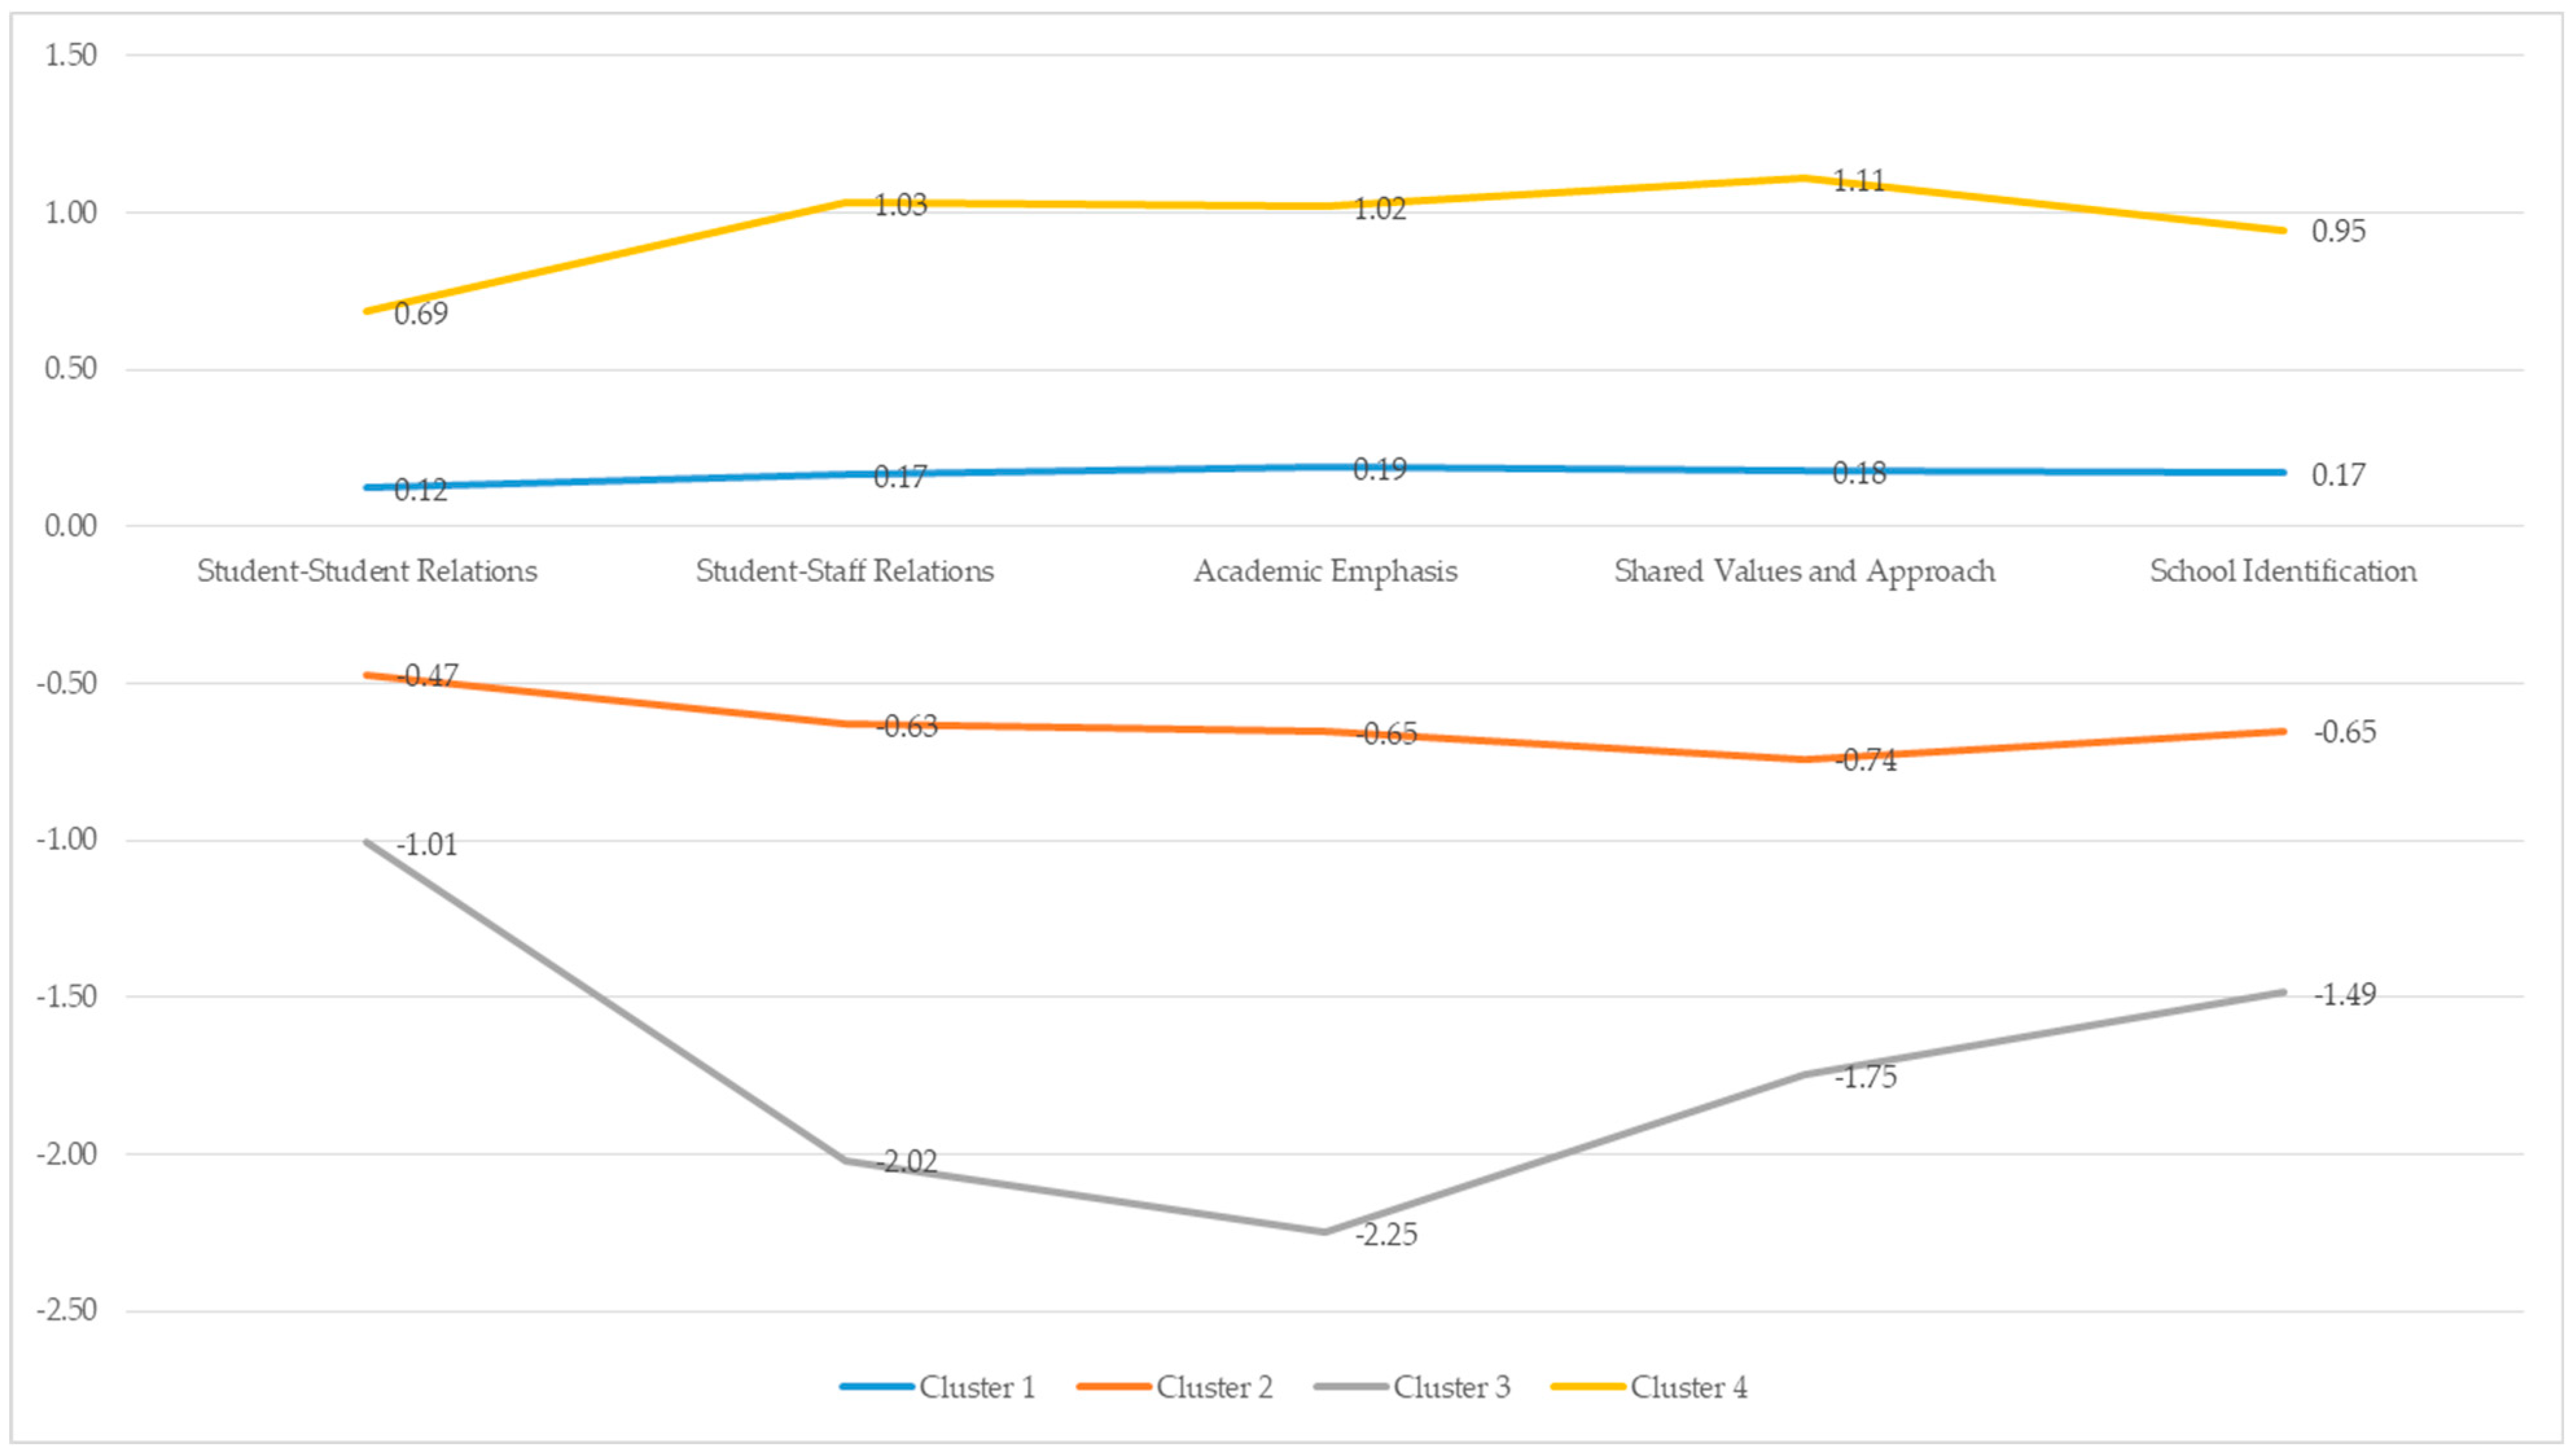
3.2. Identification of the Number of Clusters and Classes of School Climate

To identify the number of clusters at the individual level, five LPA models were estimated, from one cluster (complete homogeneity of the sample) to five clusters. The model of four individual clusters is the one with the lowest BIC and AIC values; both indices began to increase (Table 5) successively. Subsequently, considering the solution of four individual clusters, the number of school climate classes at the school level was estimated using an MLPA. The model of four clusters at the individual level and two classes at the school level is the one that presented the lowest BIC and CAIC, which indicates that it is the most parsimonious model and with the best fit to the data (Table 5).
Subsequently, the significance of the indicators used to determine the cluster and the covariates that allow their characterization was evaluated (Table 6). Regarding the five latent variables used as indicators of school climate and school identification, the robust Wald test presented statistically significant values. These results indicate that the five variables are useful for segmentation of the school climate, both at the individual level and at the school level (p < 0.001). Regarding the covariates at the student level (level-1), statistically significant effects are observed: cognitive engagement, expectation, positive Attitude to Authority and inter-parental conflict. Family cohesion and family expressiveness do not have significant effects at the student level. In relation to the covariates at the school level (level-2), statistically significant effects of the school vulnerability index are observed. The variables academic performance and school size did not present significant effects at the school level.
Figure 1 presents the four clusters at the individual level. Cluster 1 was called “positive school climate”. This profile contained the highest percentage of students (42.7%). This group of students presented slightly above average levels in all dimensions of school climate. Cluster 2 was called “deteriorated school climate”, was the second largest, and represented 29.8% of the students. This profile presented below-average indicators in all dimensions of school climate. Cluster 3 represents the students who perceive a “toxic school climate”. This student profile was the smallest, and concentrated 5.4% of the students. This cluster grouped those students with the lowest levels of school climate, academic emphasis and student-staff relations standing out among the lowest dimensions. Finally, cluster 4, called “nurturing school climate”, grouped 22.1% of the students. This cluster presented the highest levels of school climate, in all its dimensions. The shared values and approach dimension stands out, which obtained the highest average of the school climate indicators.
At school level, two classes of schools represented the predominant distributions of the profiles (Figure 2). Class one schools have been called “schools with positive school climates”, and these schools concentrate a higher proportion of students who reported a positive (43.89%) and nurturing (30.53%) school climate. Class two schools have been called “schools with negative school climates”, and these schools concentrated the highest proportion of students who reported a deteriorated (33.43%) and toxic (6.12%) school climate.

4. Discussion

This study had two objectives: (1) Identify school climate and school identification profiles at the individual and school levels. (2) Relate school climate and school identification profiles to factors located at the individual and school levels. The results made it possible to achieve these objectives, as well as to test the research hypotheses. This study presented findings on individual perceptions of school climate from a person-centered approach [79,80] and aggregated to the school level, considering the nesting of students in schools.
The results allowed identification of four profiles at student level and two classes at school level (h1). In this regard, the results of this study coincide with research that has identified between three and six clusters at the student level [68,69,70,77,97]. Other studies, using the multilevel analysis technique [68,69], have identified the same number of latent classes at school level.
After the identification and definition of the clusters, a series of explanatory covariates were identified, at individual level (level 1) and at school level (level 2). The first explanatory covariate at individual level was cognitive engagement. The findings of this study indicate that a positive school climate promotes secure relationships among students, which favors their identification with the school and, consequently, increases their active commitment to learning, as well as to academic and extracurricular activities. These results coincide with the conclusions of Barbosa et al. [10], who also establish a positive association between school climate and school engagement.
The academic expectations of teachers towards students showed positive relationships with the clusters “nurturing school climate” and “positive school climate”. These findings suggest that those clusters of students with high levels of school climate encourage teachers to have positive expectations towards them. This mutual interaction creates a favorable environment for academic and personal development of students. In this context, positive school climate and positive expectations of teachers are mutually reinforcing, thus promoting an environment conducive to students’ growth and educational success [62,65].
Another of the variables associated with the school climate cluster was the positive attitude towards authority. In this sense, the findings of this study indicate that this was significantly and negatively associated with the cluster “Toxic climate”. In relation to these results, Del Moral et al. [32] detected that students who show low levels of acceptance of the norms presented high levels of violence towards their parents and low levels of school climate, an aspect that would directly impact their social relationships in educational establishments. It is pertinent to point out that a positive attitude towards the rules, school, or the police not only favors school climate, but also academic success [63] and psychosocial adjustment in other social contexts [98].
The findings of this study reveal a relationship between individual school climate variables and perceived family conflict. The results suggest that those students who perceive high levels of family conflict are more likely to be placed in the clusters of “Toxic climate” and “Deteriorated climate” in the school environment. When a student experiences a deteriorated family climate, marked by communication problems, arguments or fights between family members, it can generate an accumulation of stress that affects their general well-being and their ability to relate in the educational environment. This tension is manifested through behavioral problems at the student level, such as aggressiveness, social withdrawal or lack of interest in participating in school activities, which makes it even more difficult for them to integrate into the school environment. These results are in line with what was stated by Ye et al. [48], who showed that inter-parental conflict increases risky behaviors by favoring affiliation with peers who present deviant behaviors, so that negative school climate encourages participation in these groups.
In relation to latent classes at school level (h2), the only variable that was statistically significant was the school vulnerability index. This index corresponds to a composite score for each educational establishment, obtained by measuring social and economic variables of each family, such as the composition of the household, the employment and educational situation of parents or guardians, housing, access to basic services and other socioeconomic factors.
The findings of this study indicate that as vulnerability index increases, there is an impact on students’ behaviour, which in turn influences school climate. Additionally, when schools have a higher proportion of students with higher levels of vulnerability, greater academic or emotional difficulties are likely to be experienced. These results coincide with the findings of Sulak [77], who also carried out a study in schools and detected a series of social context factors associated with educational establishments, which have a negative impact on school climate.
Regarding the implications of this research, it is noteworthy that the findings obtained allow us to evidence the profiles of Chilean adolescent students and their perception of school climate considering different covariates that impact both at the individual and school level [79,80]. These results will contribute to decision-making at the level of educational institutions, public policies, and Chilean society [81]. It is important to mention that the negative school climate of a school can be intervened and transformed to a greater or lesser extent bearing in mind that it is relatively more susceptible to change than other variables [1,77]. Another notable novelty of this study is the identification of multiple profiles at both the student and school level. By identifying four student-level clusters and two school-level school climate classes, the study provides a more detailed and nuanced understanding of the variability in student experiences and school climate across different schools. This goes beyond a simple average description and allows for the identification of specific patterns that can guide more precise and effective educational interventions.
Regarding the limitations of this study, it is important to highlight that the findings must be interpreted with caution due to the design used, which corresponds to a cross-sectional study. In this type of design, the data is collected at a single point in time and longitudinal monitoring is not carried out, which prevents establishing causal relationships between the variables studied. In this sense, it is necessary to take this limitation into account when analyzing the results and consider the possibility of carrying out future research with more robust designs, such as longitudinal or experimental studies, to deepen the understanding of the relationships between the variables.
Future lines of research should consider more robust research designs, such as longitudinal designs, to evaluate more rigorously the relationships between school climate and school commitment, attitude towards authority and family climate. Likewise, future studies should consider larger samples at the school level to account for greater variability among schools.

5. Conclusions

This study has provided valuable insight into school climate profiles at individual and school levels, highlighting the importance of positive school climate for students’ academic engagement and attitude towards authority. The results highlight how a favourable school environment and positive expectations from teachers reinforce each other, fostering an environment conducive to students’ personal and academic development.
Furthermore, a significant relationship between the variables school climate at individual level and perceived family conflict was found. Students who experienced high levels of family conflict were more likely to be placed in clusters with a toxic or deteriorated school climate, which affected their general well-being and made it difficult for them to integrate into the educational environment.
At school level, the study highlighted the relevance of the school vulnerability index as a significant variable that affects student behaviour and, therefore, school climate. As this rate increases, there is an impact on the educational environment, and academic or emotional difficulties among students become more pronounced.

Author Contributions

Conceptualization, J.L.G.-N., K.P.-L., B.N.-A. and J.C.B.-V.; methodology, J.L.G.-N. and B.N.-A.; software, J.L.G.-N. and K.P.-L.; validation, J.L.G.-N., K.P.-L., B.N.-A. and J.C.B.-V.; formal analysis, J.L.G.-N. and K.P.-L.; investigation, J.L.G.-N., K.P.-L., B.N.-A. and J.C.B.-V.; resources, J.L.G.-N., K.P.-L. and J.C.B.-V.; data curation, J.L.G.-N., K.P.-L. and J.C.B.-V.; writing—original draft preparation, J.L.G.-N., K.P.-L., B.N.-A. and J.C.B.-V.; writing—review and editing, J.L.G.-N., K.P.-L., B.N.-A. and J.C.B.-V.; visualization, J.L.G.-N., K.P.-L. and J.C.B.-V.; supervision, J.L.G.-N., K.P.-L., B.N.-A. and J.C.B.-V.; project administration, J.L.G.-N., K.P.-L., B.N.-A. and J.C.B.-V.; funding acquisition, J.L.G.-N. All authors have read and agreed to the published version of the manuscript.

Funding

This research was funded by FONDECYT project number 1190844.

Institutional Review Board Statement

The study was conducted according to the guidelines of the Declaration of Helsinki, and approved by Comité de ética de la Universidad de La Frontera, (protocolcode 034_19 and Approved on 27 May 2019).

Informed Consent Statement

Informed consent was obtained from all the participants.

Data Availability Statement

No applicable.

Conflicts of Interest

The authors declare no conflict of interest.

References

  1. Wang, M.T.; Degol, J.L. School Climate: A Review of the Construct, Measurement, and Impact on Student Outcomes. Educ. Psychol. Rev. 2016, 28, 315–352. [Google Scholar] [CrossRef]
  2. Thapa, A.; Cohen, J.; Guffey, S.; Higgins-D’Alessandro, A. A Review of School Climate Research. Rev. Educ. Res. 2013, 83, 357–385. [Google Scholar] [CrossRef]
  3. Rudasill, K.M.; Snyder, K.E.; Levinson, H.; Adelson, J.L. Systems View of School Climate: A Theoretical Framework for Research. Educ. Psychol. Rev. 2018, 30, 35–60. [Google Scholar] [CrossRef]
  4. Cohen, J.; Mccabe, E.M.; Michelli, N.M.; Pickeral, T. School Climate: Research, Policy, Practice, and Teacher Education. Teach. Coll. Rec. 2009, 111, 180–213. [Google Scholar] [CrossRef]
  5. Grazia, V. A Longitudinal Study of School Climate: Reciprocal Effects with Student Engagement and Burnout. Psychol. Sch. 2022, 59, 1521–1537. [Google Scholar] [CrossRef]
  6. Lee, E.; Reynolds, K.J.; Subasic, E.; Bromhead, D.; Lin, H.; Marinov, V.; Smithson, M. Development of a Dual School Climate and School Identification Measure–Student (SCASIM-St). Contemp. Educ. Psychol. 2017, 49, 91–106. [Google Scholar] [CrossRef]
  7. Franco, K.; Baumler, E.; Torres, E.D.; Lu, Y.; Wood, L.; Temple, J.R. The Link between School Climate and Mental Health among an Ethnically Diverse Sample of Middle School Youth. Curr. Psychol. 2022, 42, 18488–18498. [Google Scholar] [CrossRef]
  8. Clark, K.N.; Strissel, D.; Demaray, M.K.; Ogg, J.; Eldridge, M.A.; Malecki, C.K. Victimization and Depressive Symptoms in Early Adolescence: The Role of Perceived School Climate. Sch. Psychol. 2022, 37, 355–366. [Google Scholar] [CrossRef]
  9. Zullig, K.J.; Ward, R.M.; Huebner, E.S.; Daily, S.M. Association between Adolescent School Climate and Perceived Quality of Life. Child. Indic. Res. 2018, 11, 1737–1753. [Google Scholar] [CrossRef]
  10. Da Fonseca, I.B.; Santos, G.; Santos, M.A. School Engagement, School Climate and Youth Externalizing Behaviors: Direct and Indirect Effects of Parenting Practices. Curr. Psychol. 2023, 1–18. [Google Scholar] [CrossRef]
  11. Cui, K.; To, S. School Climate, Bystanders’ Responses, and Bullying Perpetration in the Context of Rural-to-Urban Migration in China. Deviant Behav. 2021, 42, 1416–1435. [Google Scholar] [CrossRef]
  12. Nishimura, T.; Wakuta, M.; Tsuchiya, K.J.; Osuka, Y.; Tamai, H.; Takei, N.; Katayama, T. Measuring School Climate among Japanese Students—Development of the Japan School Climate Inventory (JASC). Int. J. Environ. Res. Public Health 2020, 17, 4426. [Google Scholar] [CrossRef] [PubMed]
  13. Pampati, S.; Andrzejewski, J.; Sheremenko, G.; Johns, M.; Lesesne, C.A.; Rasberry, C.N. School Climate Among Transgender High School Students: An Exploration of School Connectedness, Perceived Safety, Bullying, and Absenteeism. J. Sch. Nurs. 2020, 36, 293–303. [Google Scholar] [CrossRef] [PubMed]
  14. Varela, J.J.; Guzmán, J.; Alfaro, J.; Reyes, F. Bullying, Cyberbullying, Student Life Satisfaction and the Community of Chilean Adolescents. Appl. Res. Qual. Life 2019, 14, 705–720. [Google Scholar] [CrossRef]
  15. Xu, S.; Ren, J.; Li, F.; Wang, L.; Wang, S. School Bullying Among Vocational School Students in China: Prevalence and Associations with Personal, Relational, and School Factors. J. Interpers. Violence 2022, 37, NP104–NP124. [Google Scholar] [CrossRef]
  16. Daily, S.M.; Mann, M.J.; Lilly, C.L.; Bias, T.K.; Smith, M.L.; Kristjansson, A.L. School Climate as a Universal Intervention to Prevent Substance Use Initiation in Early Adolescence: A Longitudinal Study. Health Educ. Behav. 2020, 47, 402–411. [Google Scholar] [CrossRef]
  17. Doumas, D.M.; Midgett, A.; Johnston, A.D. Substance Use and Bullying Victimization Among Middle and High School Students: Is Positive School Climate a Protective Factor? J. Addict. Offender Couns. 2017, 38, 2–15. [Google Scholar] [CrossRef]
  18. Michael, S.L.; Merlo, C.L.; Basch, C.E.; Wentzel, K.R.; Wechsler, H. Critical Connections: Health and Academics. J. Sch. Health 2015, 85, 740–758. [Google Scholar] [CrossRef]
  19. Izaguirre, L.A.; Rodríguez-Fernández, A.; Fernández-Zabala, A. Perceived Academic Performance Explained by School Climate, Positive Psychological Variables and Life Satisfaction. Br. J. Educ. Psychol. 2023, 93, 318–332. [Google Scholar] [CrossRef]
  20. Lunetti, C.; Di Giunta, L.; Fiasconaro, I.; Arbel, R.; Basili, E.; Thartori, E.; Favini, A.; Gliozzo, G.; Pastorelli, C.; Lansford, J.E. Perception of School Climate, Academic Performance and Risk Behaviors in Adolescence. Ric. Psicol. 2022, 45, 1–15. [Google Scholar] [CrossRef]
  21. Tomaszewski, W.; Xiang, N.; Huang, Y. School Climate, Student Engagement and Academic Achievement across School Sectors in Australia. Aust. Educ. Res. 2023, 1–29. [Google Scholar] [CrossRef]
  22. Almroth, M.; Laszlo, K.D.; Kosidou, K.; Galanti, M.R. Teacher: But Not Student Rating of the Pedagogic and Social Climate in School Predicts Adolescents’ Academic Aspirations. Child. Youth Care Forum 2021, 50, 885–899. [Google Scholar] [CrossRef]
  23. Davis, J.R.; Warner, N. Schools Matter: The Positive Relationship Between New York City High’ Student Academic Progress and School Climate. Urban Educ. 2018, 53, 959–980. [Google Scholar] [CrossRef]
  24. Huang, F.L.; Eklund, K.; Cornell, D.G. Authoritative School Climate, Number of Parents at Home, and Academic. Sch. Psychol. Q. 2017, 32, 480–496. [Google Scholar] [CrossRef]
  25. Kraft, M.A.; Marinell, W.H.; Yee, D.S.-W. School Organizational Contexts, Teacher Turnover, and Student: Evidence from Panel Data. Am. Educ. Res. J. 2016, 53, 1411–1449. [Google Scholar] [CrossRef]
  26. Jia, Y.; Konold, T.R.; Cornell, D. Authoritative School Climate and High School Dropout Rates. Sch. Psychol. Q. 2016, 31, 289–303. [Google Scholar] [CrossRef]
  27. Konold, T.R.; Cornell, D. Measurement and Structural Relations of an Authoritative School Climate: A Multi-Level Latent Variable Investigation. J. Sch. Psychol. 2015, 53, 447–461. [Google Scholar] [CrossRef]
  28. Lara, L.; Saracostti, M.; Navarro, J.-J.; De Toro, X. Compromiso Escolar: Desarrollo y Validación de Un Instrumento. Rev. Mex. Psicol. 2018, 35, 52–62. [Google Scholar]
  29. Miranda-Zapata, E.; Lara, L.; Saracostti, M. Modeling the School Engagement Effect on School Performance in Five Iberoamerican Countries. Rev. Iberoam. Diagn. Eval. Psicol. 2021, 2, 151–161. [Google Scholar] [CrossRef]
  30. Miranda-Zapata, E.; Lara, L.; Navarro, J.J.; Saracostti, M.; de-Toro, X. Modeling the Effect of School Engagement on Attendance to Classes and School Performance. Rev. Psicodidact. 2018, 23, 102–109. [Google Scholar] [CrossRef]
  31. Gálvez-Nieto, J.L.; Polanco-Levicán, K.; Trizano-Hermosilla, Í.; Beltrán-Véliz, J.C. Relationships between School Climate and Values: The Mediating Role of Attitudes towards Authority in Adolescents. Int. J. Environ. Res. Public Health 2022, 19, 2726. [Google Scholar] [CrossRef] [PubMed]
  32. Del Moral, G.; Suárez-Relinque, C.; Callejas, J.E.; Musitu, G. Child-to-Parent Violence: Attitude towards Authority, Social Reputation and School Climate. Int. J. Environ. Res. Public Health 2019, 16, 2384. [Google Scholar] [CrossRef] [PubMed]
  33. Martinez-Ferrer, B.; Romero-Abrio, A.; Moreno-Ruiz, D.; Musitu, G. Child-to-Parent Violence and Parenting Styles: Its Relations to Problematic Use of Social Networking Sites, Alexithymia, and Attitude towards Institutional Authority in Adolescence. Psychol. Sch. Interv. 2018, 27, 163–171. [Google Scholar] [CrossRef]
  34. Jimenez, T.I.; Estevez, E.; Murgui, S. Community Environment and Attitude toward Authority: Relations with quality of Family Relationships and Aggression toward Peers in adolescents. Ann. Psychol. 2014, 30, 1086–1095. [Google Scholar] [CrossRef]
  35. Contreras, D.; Elacqua, G.; Martinez, M.; Miranda, Á. Bullying, Identity and School Performance: Evidence from Chile. Int. J. Educ. Dev. 2016, 51, 147–162. [Google Scholar] [CrossRef]
  36. Ochoa, G.M.; Lopez, E.E.; Emler, N.P. Adjustment Problems in the Family and School Contexts, Attitude towards authority, and Violent Behavior at School in Adolescence. Adolescence 2007, 42, 779–794. [Google Scholar]
  37. Moreno, A.G.; Jurado, M. The Moderating Role of Family Functionality in Prosocial Behaviour and School Climate in Adolescence. Int. J. Environ. Res. Public Health 2023, 20, 590. [Google Scholar] [CrossRef]
  38. Zhao, J.; Guo, Z.; Shi, H.; Yu, M.; Jiao, L.; Xu, Y. The Relationship Between Parental Phubbing and Interpersonal Aggression in Adolescents: The Role of Rejection Sensitivity and School Climate. J. Interpers. Violence 2023, 38, 7630–7655. [Google Scholar] [CrossRef]
  39. Bhau, S.; Tung, S. A Factor Analytical Study of Bullying among Adolescents in Context of Family and School Environment. IAHRW Int. J. Social. Sci. Rev. 2019, 7, 625–628. [Google Scholar]
  40. Ortega-Baron, J.; Buelga, S.; Cava, M.-J. The Influence of School Climate and Family Climate among Adolescents of Cyberbullying. Comunicar 2016, 24, 57–65. [Google Scholar] [CrossRef]
  41. Zambrano-Villalba, C.; Almeida-Monge, E. Clima Social Familiar y Su Influencia En La Conducta Violenta En Los Escolares. Rev. Cienc. Unemi. 2017, 10, 97–102. [Google Scholar] [CrossRef]
  42. Ding, Y.; Li, D.; Li, X.; Xiao, J.; Zhang, H.; Wang, Y. Profiles of Adolescent Traditional and Cyber Bullying and Victimization: The Role of Demographic, Individual, Family, School, and Peer Factors. Comput. Hum. Behav. 2020, 111, 106439. [Google Scholar] [CrossRef]
  43. Valdés Cuervo, Á.; Martínez, A. Relación Entre El Autoconcepto Social, El Clima Familiar y El Clima Escolar Con El Bullying En Estudiantes de Secundaria. Av. Psicol. Latinoam. 2014, 32, 447–457. [Google Scholar] [CrossRef]
  44. Ucus, S.; Garcia, A.; Esteraich, J.; Raikes, H. Predictors and Behavioural Outcomes of Parental Involvement among Low-Income Families in Elementary Schools, United States. Early Child. Dev. Care 2019, 189, 1425–1443. [Google Scholar] [CrossRef]
  45. Bayer, J.K.; Ukoumunne, O.C.; Lucas, N.; Wake, M.; Scalzo, K.; Nicholson, J.M. Risk Factors for Childhood Mental Health Symptoms: National Longitudinal Study of Australian Children. Pediatrics 2011, 128, e865–e879. [Google Scholar] [CrossRef]
  46. Katsantonis, I.; Symonds, J.E. Population Heterogeneity in Developmental Trajectories of Internalising and Externalising Mental Health Symptoms in Childhood: Differential Effects of Parenting Styles. Epidemiol. Psychiatr. Sci. 2023, 32, e16. [Google Scholar] [CrossRef]
  47. Parkes, A.; Sweeting, H.; Wight, D. Early Childhood Precursors and School Age Correlates of Different Internalising Problem Trajectories Among Young Children. J. Abnorm. Child. Psychol. 2016, 44, 1333–1346. [Google Scholar] [CrossRef]
  48. Ye, W.Y.; Dou, K.; Wang, L.X.; Lin, X.Q.; Zhang, M.C. Longitudinal Association between Interparental Conflict and Risk-Taking Behavior among Chinese Adolescents: Testing a Moderated Mediation Model. Child. Adolesc. Psychiatry Ment. Health 2023, 17, 5. [Google Scholar] [CrossRef]
  49. Mala, J.; Corral, M.D.; McGarry, J.E.; Macauley, C.D.T.; Arinze, N.A.; Ebron, K. Positive Impacts of a Sport Intervention on Male Students of Color and School Climate. Res. Q. Exerc. Sport 2022, 93, 36–52. [Google Scholar] [CrossRef]
  50. Hackman, D.A.; Duan, L.; McConnell, E.E.; Lee, W.J.; Beak, A.S.; Kraemer, D.J.M. School Climate, Cortical Structure, and Socioemotional Functioning: Associations across Family Income Levels. J. Cogn. Neurosci. 2022, 34, 1842–1865. [Google Scholar] [CrossRef]
  51. Murillo, F.J.; Martínez-Garrido, C.; Graña, R. School Segregation by Socioeconomic Level in Primary Education in Latin America and the Caribbean. REICE Rev. Iberoam. Sobre Calid. Efic. Cambio Educ. 2023, 21, 87–117. [Google Scholar] [CrossRef]
  52. Murillo, F.J.; Garrido, C.M. La Ségrégation Sociale Dans Les Écoles Publiques et Privées En Amérique Latine. Educ. Soc. 2017, 38, 727–750. [Google Scholar] [CrossRef]
  53. Murillo, F.J.; Duk, C.; Garrido, C.M. Evolución de La Segregación Socioeconómica de Las Escuelas de América Latina. Estud. Pedagógicos 2018, 44, 157–179. [Google Scholar] [CrossRef]
  54. Berkowitz, R. School Matters: The Contribution of Positive School Climate to Equal Opportunities among Ethnocultural Minority Students. Youth Soc. 2022, 54, 372–396. [Google Scholar] [CrossRef]
  55. Lopez, V.; Salgado, M.; Berkowitz, R. The Contributions of School and Classroom Climate to Mathematics Test: A Three-Level Analysis. Sch. Eff. Sch. Improv. 2023, 34, 43–64. [Google Scholar] [CrossRef]
  56. Brown, R.P.S.; Pehrson, S. Group Processes: Dynamics within and between Groups; John Wiley & Sons.: Hoboken, NJ, USA, 2019. [Google Scholar]
  57. Tajfel, H. Social Categorization, Social Identity and Social Comparisons. In Differentiation between Social Groups; Tajfel, H., Ed.; Academic Press: Cambridge, MA, USA, 1978; pp. 61–76. [Google Scholar]
  58. Tajfel, H.; Turner, J. Social Categorization and Intergroup Discrimination. In Organizational Identity; Hatch, M.J., Schultz, M., Eds.; Oxford Management: Oxford, UK, 1979. [Google Scholar]
  59. Yu, Y.; Ng, J.H.Y.; Wu, A.M.S.; Chen, J.H.; Wang, D.B.; Zhang, G.; Du, M.; Du, D.; Du, M.; Lau, J.T.F. Psychometric Properties of the Abbreviated Version of the Dual School Climate and School Identification Measure–Student (SCASIM-St15) among Adolescents in China. Int. J. Environ. Res. Public Health 2022, 19, 16535. [Google Scholar] [CrossRef] [PubMed]
  60. Demirtas-Zorbaz, S.; Hoard, P.R. Adaptation and Preliminary Validation for the Turkish Context of the School Climate and School Identification Measure-Student (TSCASIM-St). Int. J. Res. Educ. Sci. 2019, 5, 323–330. [Google Scholar]
  61. Gálvez-Nieto, J.L.; Polanco-Levican, K.; Beltrán-Véliz, J.C. Psychometric Examination of the Abbreviated Version of the Dual School Climate and School Identification Measure-Student (SCASIM-St15) in a Sample of Chilean Adolescents. Front. Psychol. 2021, 12, 576051. [Google Scholar] [CrossRef]
  62. Reynolds, K.J.; Lee, E.; Turner, I.; Bromhead, D.; Subasic, E. How Does School Climate Impact Academic Achievement? An Examination of Social Identity Processes. Sch. Psychol. Int. 2017, 38, 78–97. [Google Scholar] [CrossRef]
  63. Trinidad, J.E. Material Resources, School Climate, and Achievement Variations in the Philippines: Insights from PISA 2018. Int. J. Educ. Dev. 2020, 75, 102174. [Google Scholar] [CrossRef]
  64. Turner, I.; Reynolds, K.J.; Lee, E.; Bromhead, D. Well-Being, School Climate, and the Social Identity Process: A Latent Growth Model Study of Bullying Perpetration and Peer Victimization. Sch. Psychol. Q. 2014, 29, 320–335. [Google Scholar] [CrossRef] [PubMed]
  65. Maxwell, S.; Reynolds, K.J.; Lee, E.; Subasic, E.; Bromhead, D. The Impact of School Climate and School Identification on Academic Achievement: Multilevel Modeling with Student and Teacher Data. Front. Psychol. 2017, 8, 2069. [Google Scholar] [CrossRef] [PubMed]
  66. Gálvez-Nieto, J.L.; Salvo, S.; Trizano-Hermosila, Í.; Hederich, C.; Polanco, K. Equivalencia Factorial de La Escala de Actitudes Hacia La Autoridad Institucional En Adolescentes (AAI-A) Chilenos y Colombianos. Rev. Iberoam. Diagn. Eval. Psicol. 2018, 1, 109–119. [Google Scholar] [CrossRef]
  67. Bronfenbrenner, U. La Ecología Del Desarrollo Humano. 2002. Available online: https://bibliotecadigital.mineduc.cl/handle/20.500.12365/18032 (accessed on 27 July 2023).
  68. Gálvez-Nieto, J.L.; García, J.A.; Vera-Bachmann, D.; Trizano-Hermosilla, I.; Polanco, K. Multilevel Latent Class Cluster Analysis of School Climate: Individual, Family and Community Factors. Rev. Psicodidact. 2020, 25, 85–92. [Google Scholar] [CrossRef]
  69. Van Eck, K.; Johnson, S.R.; Bettencourt, A.; Johnson, S.L. How School Climate Relates to Chronic Absence: A Multi–Level Latent Profile Analysis. J. Sch. Psychol. 2017, 61, 89–102. [Google Scholar] [CrossRef]
  70. Shukla, K.; Konold, T.; Cornell, D. Profiles of Student Perceptions of School Climate: Relations with Risk Behaviors and Academic Outcomes. Am. J. Community Psychol. 2016, 57, 291–307. [Google Scholar] [CrossRef]
  71. DiStefano, C.; Leighton, E.; Ene, M.; Monrad, D.M. An Examination of Predictors and Outcomes Related to School Climate Using Latent Class Analysis. In Structural Equation Modeling (SEM); Rivera, L., Ed.; Nova Science Pub Inc.: New York, NY, USA, 2016. [Google Scholar]
  72. Burns, E.C.; Collie, R.J.; Van Bergen, P.; Martin, A.J. Intrapersonal and Interpersonal Psychosocial Adjustment Resources and Achievement: A Multilevel Latent Profile Analysis of Students and Schools. J. Educ. Psychol. 2022, 114, 1912–1930. [Google Scholar] [CrossRef]
  73. Capp, G.P.; Sullivan, K.S.; Park, Y. School Climate and Resilience Promoting Characteristics: Exploring Latent Patterns of Student Perceptions in California. Oxf. Rev. Educ. 2023, 49, 664–680. [Google Scholar] [CrossRef]
  74. Gage, N.A.; Prykanowski, D.A.; Larson, A. School Climate and Bullying Victimization: A Latent Class Growth Model Analysis. Sch. Psychol. Q. 2014, 29, 256–271. [Google Scholar] [CrossRef]
  75. Pas, E.T.; Bradshaw, C.P. What Affects Teacher Ratings of Student Behaviors? The Potential Influence of Teachers’ Perceptions of the School Environment and Experiences. Prev. Sci. 2014, 15, 940–950. [Google Scholar] [CrossRef]
  76. Zhao, M.; Jin, R. Advancing a Cross-Cultural Understanding of Teacher Perceptions of School Climate: A Latent Class Analysis Using 2018 TALIS Data. Front. Psychol. 2023, 14, 1129306. [Google Scholar] [CrossRef] [PubMed]
  77. Sulak, T.N. School Climate: The Controllable and the Uncontrollable. Educ. Stud. 2018, 44, 279–294. [Google Scholar] [CrossRef]
  78. De Pedro, K.T.; Gilreath, T.; Berkowitz, R. A Latent Class Analysis of School Climate among Middle and High School Students in California Public Schools. Child. Youth Serv. Rev. 2016, 63, 10–15. [Google Scholar] [CrossRef]
  79. Mayworm, A.M.; Sharkey, J.D.; Nylund-Gibson, K. An Exploration of the Authoritative School Climate Construct Using Multilevel Latent Class Analysis. Contemp. Sch. Psychol. 2023, 27, 283–302. [Google Scholar] [CrossRef]
  80. Rohatgi, A.; Scherer, R. Identifying Profiles of Students’ School Climate Perceptions Using PISA 2015 Data. Large Scale Assess. Educ. 2020, 8, 4. [Google Scholar] [CrossRef]
  81. Ministerio de Educación de Chile (MINEDUC). Bases de Datos de Matrícula por Estudiante. Available online: https://datosabiertos.mineduc.cl/ (accessed on 3 March 2023).
  82. Scheaffer, R.; Mendenhall, W.; Ott, R.L. Elementos de Muestreo; Grupo Editorial Iberoamérica: Mexico City, México, 1987. [Google Scholar]
  83. Junta Nacional de Auxilio Escolar y Becas (JUNAEB). Prioridades 2017 Con IVE Sinae Basica Media Y Comunal. IVE—JUNAEB. 2017. Available online: https://www.junaeb.cl/ive/ (accessed on 13 January 2023).
  84. Konold, T.; Cornell, D.; Shukla, K.; Huang, F. Racial/Ethnic Differences in Perceptions of School Climate and Its Association with Student Engagement and Peer Aggression. J. Youth Adolesc. 2017, 46, 1289–1303. [Google Scholar] [CrossRef] [PubMed]
  85. Estévez, E.; Murgui, S.; Musitu, G.; Moreno, D. Clima Familiar, Clima Escolar y Satisfacción Con La Vida En Adolescentes. Rev. Mex. Psicol. 2008, 25, 119–128. [Google Scholar]
  86. Schumacher, R.; Lomax, R. A Beginner’s Guide to Structural Equation Modeling; Lawrence Erlbaum Associates: Mahwah, NJ, USA, 1996. [Google Scholar]
  87. Kline, R.B. Principles and Practice of Structural Equation Modeling, 2nd ed.; Guilford: New York, NY, USA, 2005. [Google Scholar]
  88. Byrne, B.M. Structural Equation Modeling with AMOS, EQS, and LISREL: Comparative Approaches to Testing for the Factorial Validity of a Measuring Instrument. Int. J. Test. 2001, 1, 55–86. [Google Scholar] [CrossRef]
  89. Green, S.B.; Yang, Y. Evaluation of Dimensionality in the Assessment of Internal Consistency Reliability: Coefficient Alpha and Omega Coefficients. Educ. Meas. Issues Pract. 2015, 34, 14–20. [Google Scholar] [CrossRef]
  90. Trizano-Hermosilla, I.; Gálvez-Nieto, J.L.; Alvarado, J.M.; Saiz, J.L.; Salvo-Garrido, S. Reliability Estimation in Multidimensional Scales: Comparing the Bias of Six Estimators in Measures with a Bifactor Structure. Front. Psychol. 2021, 12, 508287. [Google Scholar] [CrossRef]
  91. Vermunt, J.K.; Magidson, J. Technical Guide for Latent GOLD 5.1: Basic, Advanced, and Syntax 1; Statistical Innovations Inc.: Belmont, MA, USA, 2016. [Google Scholar]
  92. Vermunt, J.K. Multilevel Latent Class Models. Sociol. Methodol. 2003, 33, 213–239. [Google Scholar] [CrossRef]
  93. Bolck, A.; Croon, M.; Hagenaars, J. Estimating Latent Structure Models with Categorical Variables: One-Step Versus Three-Step Estimators. Political Anal. 2004, 12, 3–27. [Google Scholar] [CrossRef]
  94. Schwarz, G. Estimating the Dimension of a Model. Ann. Stat. 1978, 6, 461–464. [Google Scholar] [CrossRef]
  95. Akaike, H. Factor Analysis and AIC. In Selected Papers of Hirotugu Akaike; Parzen, E., Tanabe, K., Kitagawa, G., Eds.; Springer: New York, NY, USA, 1998; pp. 371–386. ISBN 978-1-4612-1694-0. [Google Scholar]
  96. Wedel, M.; Kamakura, W.A. Market Segmentation: Conceptual and Methodological Foundations, 2nd ed.; Kluwer Academic: Boston, MA, USA, 2000. [Google Scholar]
  97. Gage, N.A.; Larson, A.; Sugai, G.; Chafouleas, S.M. Student Perceptions of School Climate as Predictors of Office Discipline Referrals. Am. Educ. Res. J. 2016, 53, 492–515. [Google Scholar] [CrossRef]
  98. Castillón, C.E.B.; Fadda, S.M.N.; Mora, R.D.; Jerónimo, J.E.C. Las Relaciones Intrafamiliares de Apoyo Como Mecanismo Explicativo de La Conducta Violenta En Adolescentes Escolarizados. Univ. Psychol. 2017, 16, 42–53. [Google Scholar] [CrossRef]
Figure 1. Student level school climate profiles. Note: The school climate and school identification indicators were standardized (M = 0 and SD = 1).
Sustainability 15 14064 g001
Figure 2. Distribution of the school climate clusters at student level according to school climate classes according to school.
Sustainability 15 14064 g002
Table 1. Sample demographics.
VariableN%
Type of school
Public44921.7
Subsidized-Private158776.7
Paid-private341.6
Region
Antofagasta Region1758.5
Coquimbo Region22811.0
Metropolitan Region99748.2
La Araucanía Region54226.2
Magallanes and Chilean Antarctica Region1286.2
Geográfic Area
Urban176486.1
Rural28513.9
Table 2. Goodness-of-fit indices for the scales.
ScaleWLSMV-χ2RMSEASRMRCFITLIλ Max.λ Min.
SCASIM-ST3982.211 (df = 660)0.0490.0370.9660.9630.9130.618
AIA-A497.160 (df = 26)0.0550.0500.9570.9400.9370.521
AES16.175 (df = 5)0.0330.0120.9980.9970.9190.851
FES389.478 (df = 101)0.0390.0560.9700.9640.8940.578
SES886.524 (df = 54)0.0720.0310.9640.9560.7900.644
Note: SCASIM-ST: School Climate and School Identification Measure-Student; AIA-A: Attitudes to Institutional Authority in Adolescence Scale; AES: Academic Expectations Scale; FES: Family Climate Scale; SES: School Engagement Scale; WLSMV-χ2: weighted least squares means and variance adjusted; RMSEA: root mean square error of approximation; SRMR: Standardized Root Mean Square Residual; CFI: comparative fit index; TLI: Tucker–Lewis index; λ = Factor loadings.
Table 3. Reliability evidence.
Scales/FactorsCronbach’s AlphaMcDonald’s Omega
SCASIM-St
Student–Student Relations0.8660.868
Student–Staff Relations0.9110.913
Academic Emphasis0.8900.892
Shared Values and Approach0.8600.861
School Identification0.9150.918
AIA-A
Positive attitude to authority0.7460.761
Actitud positiva hacia la autoridad0.7760.789
AES
Academic expectations0.8940.896
FES
Family cohesion0.7180.721
Family expressiveness0.7080.713
Family conflict0.6060.605
SES
School Engagement Scale0.9080.910
Note: SCASIM-ST: School Climate and School Identification Measure-Student; AIA-A: Attitudes to Institutional Authority in Adolescence Scale; AES: Academic Expectations Scale; FES: Family Climate Scale; SES: School Engagement Scale.
Table 4. Pearson’s r correlation matrix, SCASIM-St indicators.
Student–Student RelationsStudent–Staff RelationsAcademic EmphasisShared Values and ApproachSchool Identification
Student–Student Relations1
Student–Staff Relations0.394 **1
Academic Emphasis0.351 **0.675 **1
Shared Values and Approach0.506 **0.645 **0.649 **1
School Identification0.382 **0.532 **0.509 **0.626 **1
** = p < 0.001. Correlation is significant at the 0.001 level (bilateral).
Table 5. Model fit statistics for multilevel latent profile analysis.
N° of Cluster/ClassLog-Likelihood (LL)BIC (LL)CAIC (LL)Classification Error
Model with level-1 profiles
1 Cluster−9590.936819,254.113919,264.11390.0000
2 Cluster−8127.523316,645.143916,699.14390.0403
3 Cluster−7511.201515,730.357415,828.35740.0679
4 Cluster−7252.472915,530.757415,672.75740.0940
5 Cluster−7126.35515,596.378715,782.37870.1131
Model with level-2 profiles
2 Class−11,262.669622,975.822223,034.82220.1036
3 Class−11,232.101723,013.945223,085.94520.1020
BIC: Bayesian information criterion, CAIC: Akaike’s consistent information criterion.
Table 6. Significance of MLPA indicators/covariates.
Indicators for ProfilesRobust Wald Test (df)p
Model with level-1 profiles
Student–Student Relations489.074 (3)<0.001
Student–Staff Relations1191.1083 (3)<0.001
Academic Emphasis965.8571 (3)<0.001
Shared Values and Approach1874.012 (3)<0.001
School Identification1129.5871 (3)<0.001
Covariables (level-1)
Student cluster343.9784 (3)<0.001
Cognitive Engagement36.6904 (3)<0.001
Expectation276.0543 (3)<0.001
Positive Attitude to authority193.1855 (3)<0.001
Family cohesion3.9829 (3)0.26
Family expressiveness5.967 (3)0.11
Family conflict8.549 (3)0.036
Model with level-2 profiles
Student–Student Relations14,346.436 (1)<0.001
Student–Staff Relations13,093.8854 (1)<0.001
Academic Emphasis9257.9968 (1)<0.001
Shared Values and Approach14,766.6718 (1)<0.001
School Identification7251.0074(1)<0.001
Covariables (level-2)
School class4.1176 (1)0.042
School achievement1.8415 (1)0.17
School vulnerability4.6579 (1)0.031
School size2.1483 (1)0.14
Disclaimer/Publisher’s Note: The statements, opinions and data contained in all publications are solely those of the individual author(s) and contributor(s) and not of MDPI and/or the editor(s). MDPI and/or the editor(s) disclaim responsibility for any injury to people or property resulting from any ideas, methods, instructions or products referred to in the content.

