Article

Increased Humidity Improved Desert Riparian Ecosystems in the Tarim River Basin, Northwest China, from 1990 to 2020

Key Laboratory of Protection and Utilization of Biological Resources in Tarim Basin, Xinjiang Production and Construction Crops, College of Life Science, Tarim University, Alaer 843300, China
*
Author to whom correspondence should be addressed.
Sustainability 2023, 15(19), 14092; https://doi.org/10.3390/su151914092
Submission received: 2 August 2023 / Revised: 8 September 2023 / Accepted: 21 September 2023 / Published: 22 September 2023

Abstract

:
Land use and land cover change (LULCC), along with the conversion of natural ecosystem cover into farmland, poses significant ecological challenges for desert riparian ecosystems. The Tarim River Basin (TRB), home to the world’s largest and most densely distributed and well-preserved desert riparian ecosystem, remains exceptionally susceptible to climate change. However, our understanding of the role of climatic factors (mean annual temperature (MAT); mean temperature during the warmest month (MWMT); relative humidity in September, October, and November (RH_SON); and the annual heat–moisture index (AHM)) in driving pattern changes in these ecosystems remains limited. To address this gap, we employed a transfer matrix approach coupled with geographically weighted regression models to conduct an extensive analysis of LULCC trends and their driving factors within the TRB from 1990 to 2020. The 30-year dataset on LULCC provided invaluable insights, revealing that the proliferation of farmland and shrubberies has precipitated the decline of arbor forests and grassland expanses. Furthermore, this expansion of farmland and shrubberies has resulted in heightened ecosystem fragmentation, particularly notable between 2005 and 2010. Our assessment indicates that artificial ecosystems are gradually transitioning back into natural states, encompassing 8.24% of the total area, chiefly attributed to the expanding shrubbery regions. Additionally, in-depth scrutiny of the impacts of climatic factors on ecosystem structure unveiled that moisture exerts the most pronounced influence on ecosystem patterns, followed by air moisture content during the growing season, while temperature exerts a relatively lesser impact. Overall, this study contributes to the realization of SDG 13 (Climate Action) and SDG 15 (Life on Land) by informing conservation efforts and sustainable land management practices in dryland desert riparian ecosystems.

1. Introduction

The desert riparian ecosystem, primarily situated along the floodplains of Central Asian rivers, plays a pivotal role in biodiversity conservation and serves as a protective bulwark against desertification, serving as an ecological refuge (Cole et al., 2020; Sun et al., 2022) [1,2]. The land use and land cover (LULC) type of a desert riparian ecosystem typically encompasses arboreal forests, shrubberies, and grassland, which regularly undergo dynamic rotations and changes (Wang et al., 2022) [3]. Advancements in land research techniques and the establishment of related disciplines, as influenced by the International Geosphere and Biosphere Program (IGBP) and the Human Impacts and Responses to Global Change Program (HDP), have progressively allowed experts and scholars to focus on dynamic shifts in land utilization (Wang et al., 2023) [4]. The existing research on land use/land cover change (LULCC) within desert riparian areas primarily centers on the evaluation of dynamic land processes and predictive patterns, focusing primarily on the forces influencing these dynamic land changes, to determine the interaction between land use and the ecological environment (Gomes et al., 2021; Feng et al., 2023a; Feng et al., 2023b) [5,6,7]. The Markov transfer matrix is a typical methodology for characterizing dynamic land processes (Yang et al., 2022) [8]. This model can not only elucidate the transitions between different land types but also describe their intrinsic patterns (Yang et al., 2022) [8]. Zhu et al. (2022) [9] utilized the Markov transfer matrix model to identify the changes in land dynamics in semiarid regions. They found that the changes typically are the augmentation of farmlands, but farmland expansion reduced grassland areas. In another study (Jiao et al., 2019) [10], gray correlation and systems dynamics models were used to uncover the laws governing land dynamics. Thus, research on desert riparian land use dynamics is profoundly significant for the sustainable management of land resources encompassing the aforementioned ecosystems.
With the advent of remote sensing technology, many experts and scholars have harnessed this innovation to investigate land use change. Landscape indices have emerged as potent tools to comprehensively study spatial transformations within landscape patterns. These indices can illuminate landscape structure and spatial attributes while simultaneously appraising habitat quality, ecological configurations, and ecological risks (Yang et al., 2022) [8]. Zhu et al. (2022) [9] used information on LULCC to compute four representative landscape indices, with the research period set between 1980 and 2020. The calculated number of patches (NP) increased from 4646 to 4669, underscoring the fragmentation and homogenization of landscape patterns in a semiarid area in Northwestern China, which was attributed to a rapid rise in population expansion. Previously, Zhao et al. (2019) [11] employed eight landscape indices to illustrate the rise in the cumulative NP in a watershed in China’s arid/semiarid region. Between 1990 and 2015, patch shapes were found to entail complex augmentations accompanied by decreasing ecological water demand. Liu et al. (2021) [12] used four landscape indices to investigate the arid northwestern region of China, which is characterized by decreasing farmland biodiversity and increasing aggregated woodland fragmentation. The indices could illustrate landscape fragmentation, connectivity, and diversity in the study area (Liu et al., 2018; Mengist et al., 2021; Zhang et al., 2022) [13,14,15]. However, the aforementioned studies mainly focused on the extent of landscape fragmentation and connectivity alterations within arid and semiarid regions, and a holistic assessment of transformations within desert riparian ecosystem patterns within these realms was lacking (Wang and Pan 2019; Pan et al., 2021) [16,17]. The collection of data on LULCC and landscape pattern changes via landscape indices can provide an accurate and scientifically encompassing evaluation of ecosystem pattern dynamics.
LULCC is primarily affected by anthropogenic activities and climate change (Feng et al., 2023b) [7]. Li et al. (2022) [18], who integrated data on desert riparian areas between 1980 and 2018, found that the contraction of grasslands and the expansion of arboreal forest areas were attributable to increasing shrubbery acreage. Du et al. (2021) [19] introduced indigenous shrub species into overgrazed zones as part of ecological revegetation endeavors. Enhanced atmospheric CO2 concentrations and shifts in precipitation patterns helped to reshape LULCC within desert areas, further leading to shrub proliferation in much wider areas (Venter et al., 2018) [20]. Moreover, global regression models, including the factor geodetector and stepwise regression, were employed to discern the impact of different factors (Lv et al., 2019; Guo et al., 2020) [21,22]. For instance, elevated temperatures were correlated with augmented vegetation greenness (Yang et al., 2023) [23]. Nevertheless, investigations on the influence of temperature on LULCC remain limited. An in-depth understanding of the impact of climatic factors on ecosystem structure, especially precipitation and temperature, contributing to the realization of Sustainable Development Goal (SDG) 13 (Climate Action) and SDG 15 (Life on Land) is essential for the development of effective strategies for mitigating and adapting to climate change.
The Tarim River Basin (TRB) is the world’s most expansive, densely distributed, and well-preserved desert riparian ecosystem; it includes the Taklamakan Desert, which is the largest expanse of sand in China and the second-largest continuous sand desert on Earth. Given the distinctive ecological fragility of the TRB, it is also considered an emblematic ecologically susceptible region in China and highly susceptible to climate change impacts (Zhang et al., 2023a) [24]. Preliminary investigations have attempted to delineate the primary composition of the TRB, which encompasses unused land, woodland, grassland, water bodies, wetlands, and farmland (Wang et al., 2019) [25]. Between 2000 and 2013, the Chinese government, through its Ecological Water Diversion Project (EWDP), determined that the natural vegetative cover of the lower section of the Tarim River increased by 4.7%. The augmentation was mainly driven by increasing arboreal forests, shrubberies, and grasslands (Bao et al., 2017) [26]. It signifies an upward trend in the basin’s ecological status (Wang et al., 2020; Jiang et al., 2022) [27,28]. In addition to the gains from the EWDP, temperature and precipitation have exerted a pivotal role in shifting ecosystem patterns. In particular, warm and humid climatic conditions induce precipitation over riparian vegetation zones and facilitate an increase in grassland areas (Hoppenreijs et al., 2022) [29]. Regardless of the positive impacts, the shifts in desert riparian ecosystem patterns and the primary drivers of transformation should still be studied to comprehensively comprehend the overarching trend of desert riparian ecosystem patterns, further allowing researchers to lay the groundwork for strategic frameworks and policy recommendations for ameliorating such patterns.
In this study, 30 m resolution LULCC data spanning the research period of 1990 to 2020 were utilized as the primary data source. By calculating the landscape pattern index and employing geostatistical methods, the change characteristics of desert riparian ecosystems in the TRB could be thoroughly analyzed. Furthermore, an indicator system for assessing the ecosystem pattern was developed, and the geographically weighted regression (GWR) model was employed to investigate the underlying driving mechanisms behind these changes. The aim of this study is to address the following key research questions: (1) What was the spatiotemporal distribution of LULCCs in the TRB between 1990 and 2020? (2) How can the restoration of desert riparian ecosystems in the TRB be evaluated given the same timeframe? (3) To what extent do various climatic measures contribute to the changes observed in the LULCCs in the TRB? This study can provide recommended measures for preventing and coping with the adverse effects of drought on ecosystems. It can also guide scholars to focus on water balance and availability when conducting research on maintaining ecosystems. It can also contribute to the realization of Sustainable Development Goal (SDG) 13 (Climate Action) and SDG 15 (Life on Land).

2. Materials and Methods
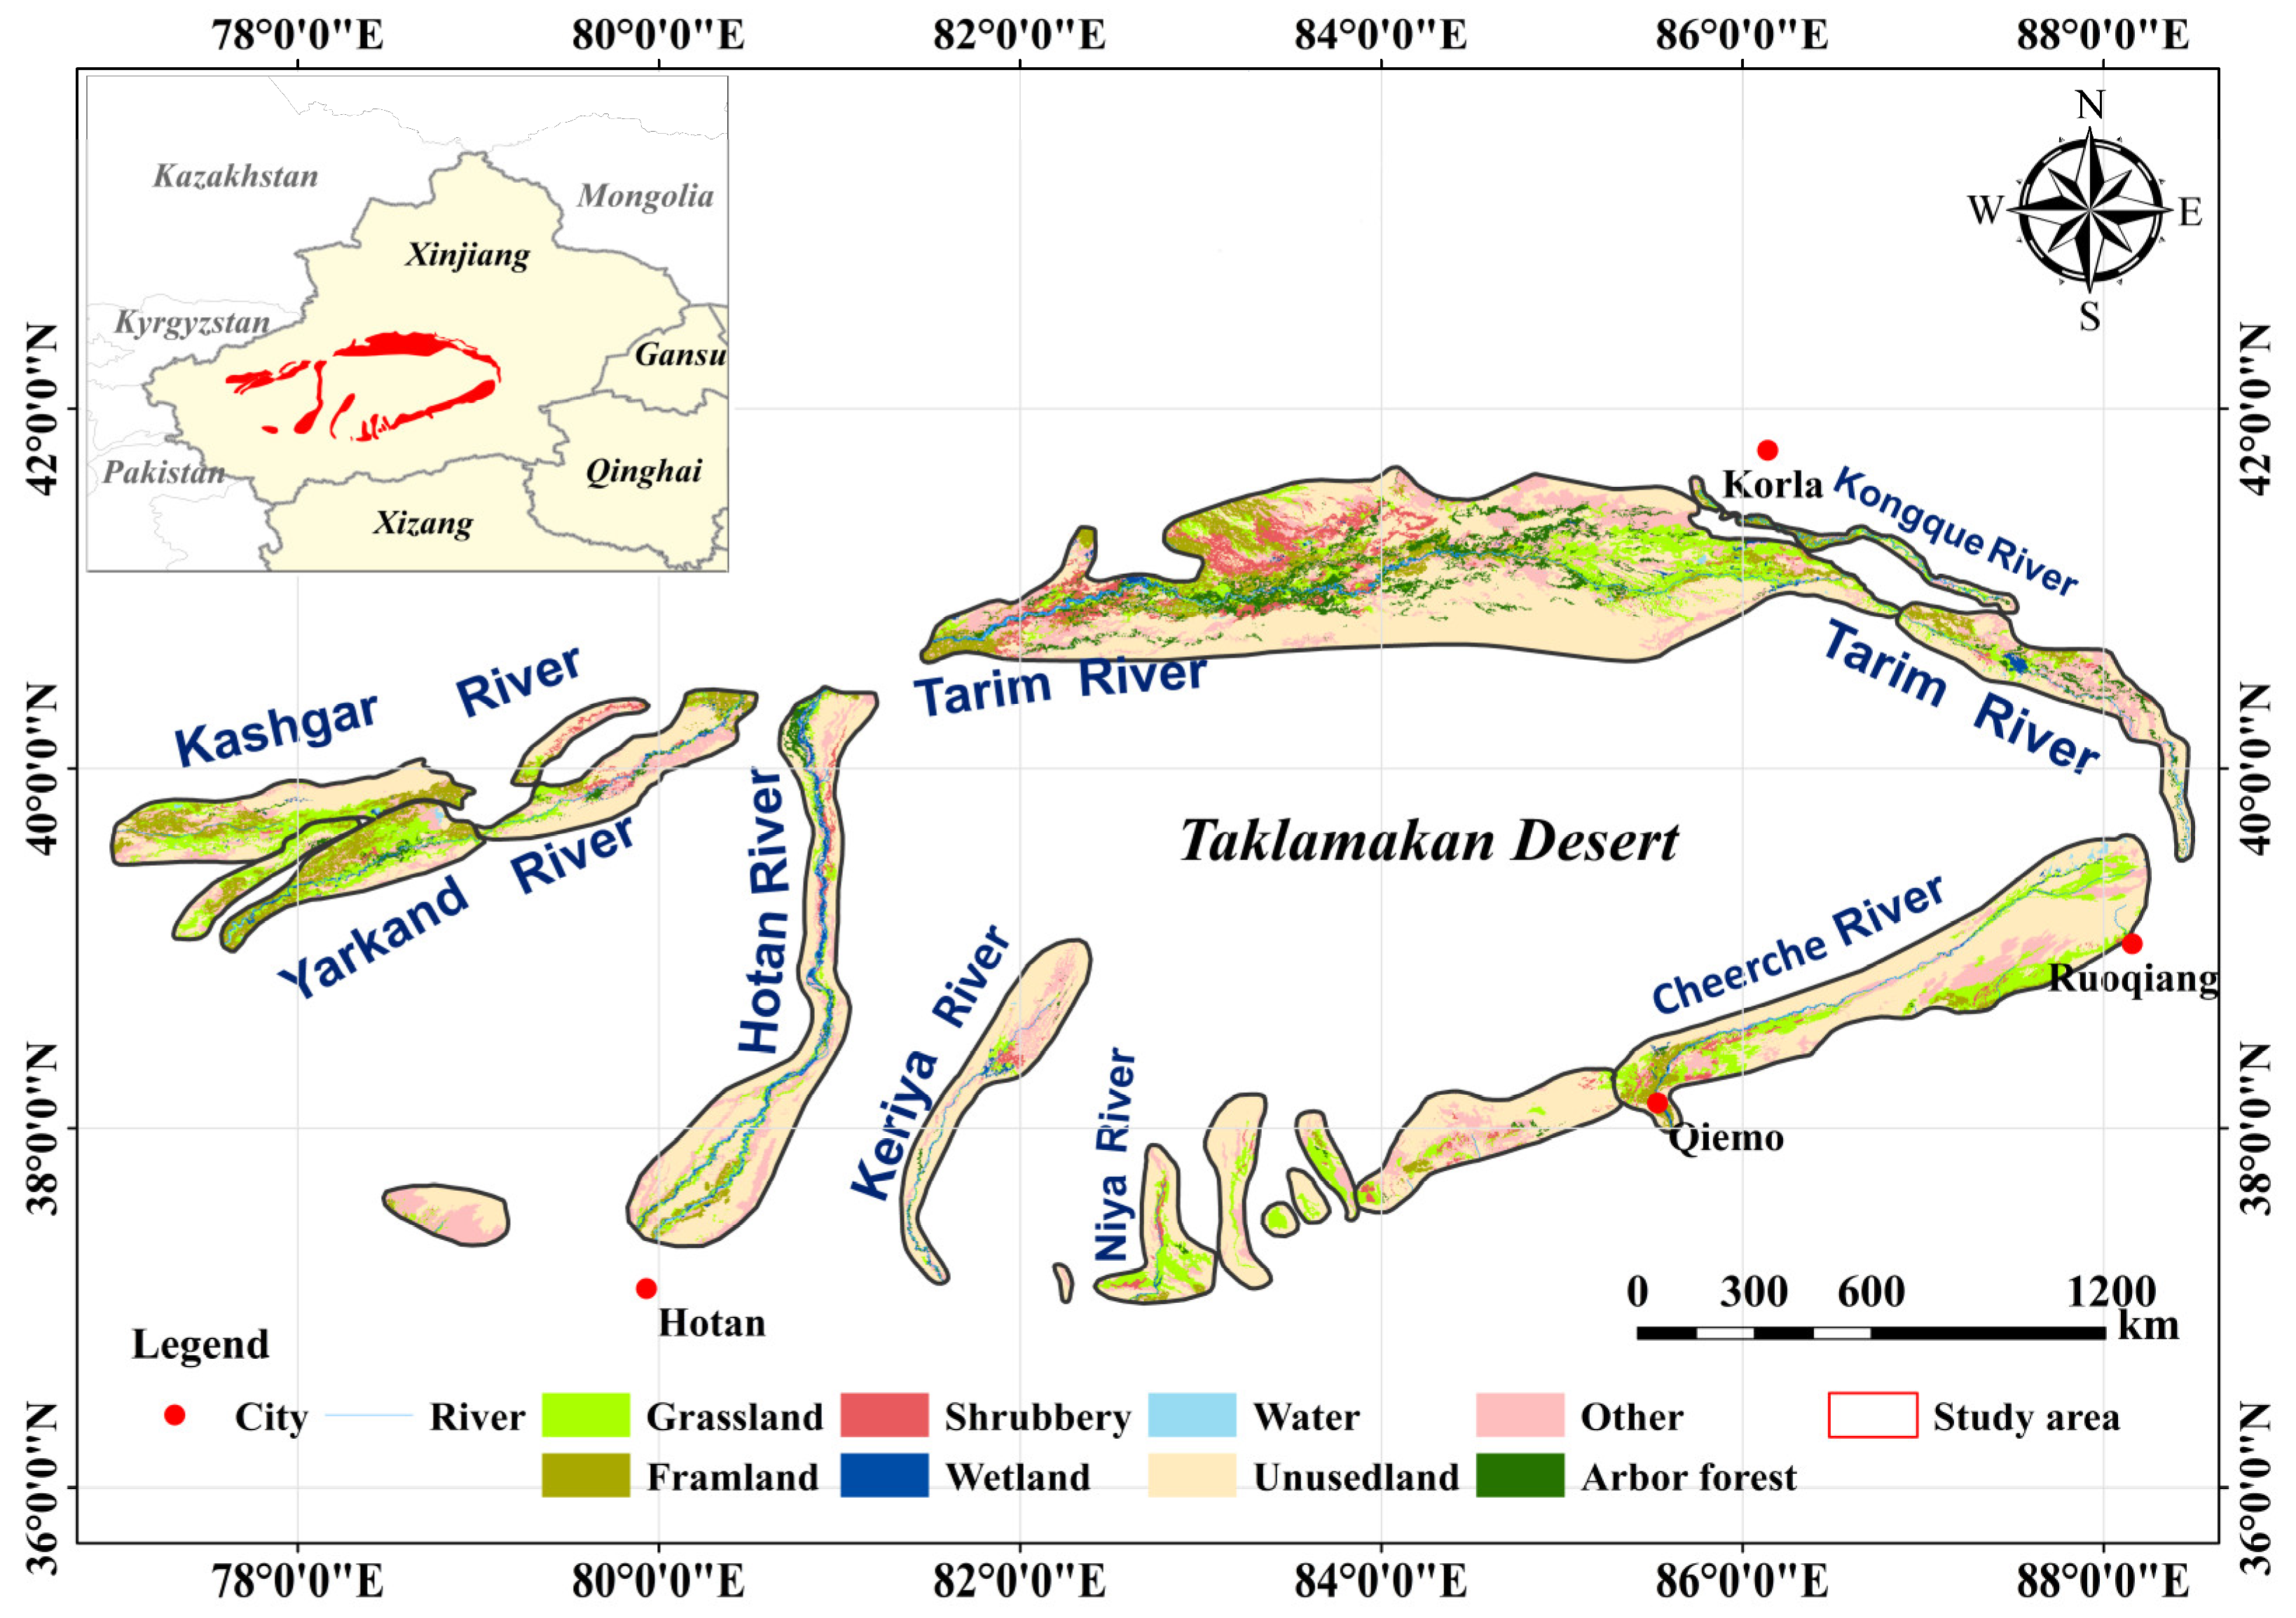
The overall methodological workflow of this study is divided into seven steps, from defining the research scope to examining the effects of climate change on variations in ecosystem patterns. Then, the temporal and spatial distribution of the desert riparian ecosystem pattern in the TRB is analyzed and the measures applied to restore the TRB’s desert riparian ecosystem within the research period are evaluated. Finally, the driving factors for the change in the TRB’s desert riparian ecosystem pattern are explained (Figure 1).

2.1. Study Area

The TRB is situated in Xinjiang Province of Western China (34°55′–43°08′ N, 73°10′–94°05′ E). This region has a warm, temperate, continental, extreme arid climate, with an annual average precipitation of <50 mm coupled with a fluctuating annual mean temperature from 10.6 °C to 11.5 °C [30].
The TRB is renowned for its desert riparian forest distribution (Ling et al., 2017) [31], encompassing ten river basins, namely, the Tarim River, the Kongque River, the Kashgar River, the Yarkand River, the Hotan River, the Keriya River, the Niya River, the Cheerchen River, the Pishan River, and the small rivers traversing the northern foothills of the Kunlun Mountains (Table 1, Figure 2). The study area is located in the desert riparian zone along the TRB and is characterized by relatively simple riparian communities, with the forestland and grassland functioning as crucial components of the desert riparian vegetation (Wang et al., 2019) [25]. Throughout the region, trees, shrubs, and woody plants are the primary distributed species (Guo et al., 2017) [32]. From 2000 to 2019, ecological water conveyance occurred 20 times in the Tarim River. As a result of the increased groundwater and river water, the vegetation cover also increased, and species diversity improved (Ling et al., 2020) [33]. Large arbor, shrub, and herb vegetation zones formed on the floodplain and along low terraces on both sides of the river channel (Mamat et al., 2019) [34].

2.2. Data Sources

The LULCC data for 1990, 2000, 2005, 2010, 2015, and 2020 were visually interpreted by the China National Land Use/Cover Change Monitoring Program (CNLUCC) (Xu et al., 2018) [35]. The main landscape types include farmland, forestland, grassland, construction land, water bodies, and unused land. Remote sensing image data from Landsat-MSS, Landsat-TM/ETM, and Landsat 8 were used to construct the database. The dataset was obtained via image fusion, geometric correction, image enhancement, and mosaicking using a combination of manual interpretation and human–computer interaction. The data accuracy was maintained at a resolution of 30 m. The national land use classification methodology was applied to reclassify the original 25 types into 8 types, namely, water, arboreal forest, shrubbery, grassland, wetland, farmland, other, and unused land, by using ArcGIS 10.8.2.
Climate data were acquired from the WorldClim database. Collinearity was minimized by performing a Spearman correlation analysis of 34 annual and seasonal climatic variables. When the correlation coefficient between two variables was >|0.7|, one of them was removed, and the variable that was more relevant to the LULCC and easier to interpret was retained. Four climatic variables were considered: mean annual temperature (MAT); mean warmest month temperature (MWMT); relative humidity in September, October, and November (RH_SON); and the annual heat–moisture (AHM) index. Relative humidity (RH) refers to the amount of water vapor in the air, which plays a significant role in influencing the distribution of species in the ecosystem. The AHM serves as an indicator of drought suitability for different types of plants. A high AHM indicates a favorable environment for moisture-loving plants, whereas a low AHM indicates a more suitable condition for the growth of drought-tolerant plants.

2.3. The Spatial Distribution and Change of Desert Riparian Ecosystems in the TRB

The transfer matrix and the area proportion and change rates of ecosystem area variations were determined to comprehensively investigate the spatiotemporal progression of LUCC (Q1). This method allows for a comprehensive depiction of the spatial and temporal dynamics associated with LULCC in the TRB. By performing land cover classification, experts can fully utilize the spatial analytic functions offered by geographic information systems and subsequently determine the spatial transformation tendencies of principal ecosystems [36].
(1)
Area proportion (P)
This metric seeks to gauge the allocation of diverse ecosystem categories across a delineated assessment zone, allowing the prevailing composition of a distinct ecosystem type to be identified. This metric can also help identify the growth of specific ecosystem types. The computation of P is given by Equation (1):
P i j = S i j T S
where Pij is the proportion of ecosystem type i during year j, Sij is the area covered by ecosystem type i during year j, and TS is the total area of the study region. The procedural intricacies underpinning the evaluation of Ev can be accessed in HJ 1171-2021 [37].
(2)
Change rates of ecosystem area variation
This parameter can gauge the alterations of a specific ecosystem type within a defined temporal period, elucidating the extent of the transformation of assorted ecosystem types within the evaluation domain over a stipulated duration. A high value for this indicator means a pronounced change magnitude in the area occupied by the designated ecosystem type over the assessment interval. The computation adheres to Equation (2):
E V = E U b E U a E U a × 100 %
where EV is the change rate for a specific ecosystem type during the assessment period, EUa is the area of a certain ecosystem type at the initiation of the research period, and EUb is the area covered by a specific ecosystem type at the conclusion of the research period. The procedural intricacies underpinning the estimation of Ev can be accessed in HJ 1171-2021 [37].
(3)
Transition matrix
The use of the transition matrix can effectively determine the spatiotemporal shifts in a variety of land cover categories. Land cover maps are inputted into image analysis software for computation. Then, the transition matrix is used to generate a visual format showing quantitative details. Calculations are executed in accordance with Equations (3) and (4):
P i j = P 11 P 1 n P n 1 P n n
A i = j = 1 n P i j ; B j = i = 1 n P i j
where P i j is the magnitude of transition from ecosystem type i to j, A i is the area of ecosystem type I during time period t1 (km2), and B j is the area of ecosystem type j during time period t2 (km2). The procedural intricacies underpinning the computation of DC can be accessed in HJ 1171-2021 [37].

2.4. Evaluation of the Landscape Patterns in Desert Riparian Ecosystems in the TRB

Here, landscape pattern indices for each ecosystem type were computed to assess the LUCC patterns in the TRB from 1990 to 2020 (Q2). Fragstats 4.2 software was used for computation, in which the “Technical Specification for Investigation and Assessment of National Ecological Status—Ecosystem Pattern Assessment” (HJ 1171-2021) was used as a guide [37]. In this framework, the following metrics were considered to determine the ecosystem structure (ES): ecosystem area proportion (P), number of patches (NP), average patch size (A), edge density (ED), and connectivity (C). Then, the comprehensive ecosystem changes (ECs) were calculated to determine the attributes of ecosystem transformation (Sijing et al., 2023) [38]. Finally, the ES, EC, and DC indicators were integrated to compute the composite indicator ESI, which could gauge and evaluate the ecosystem patterns.
(4)
Ecosystem structure (ES)
According to Pan et al. [39], ES indicators can characterize the spatial features of ecosystem fragmentation and aggregation and their evolving trends. Here, the entropy weighting methodology was employed to assign weights to each indicator (Table 2). The indicators were evaluated as follows, using Equation (5):
E S = ω P P + ω N P N P + ω A A + ω E D E D + ω C C
where ω is the weight of each indicator.
The calculation of indicator weights via the entropy weight method can be summarized as follows: standardize each indicator in either the positive or negative direction based on its influence on the dependent variable; compute the weight, information entropy, and redundancy; and generate the weighted scores. The process of estimating ES has been elaborated by Pan et al. [39].
(5)
Comprehensive ecosystem changes (ECs)
The dynamics and processes of structural transformations across diverse ecosystems take a quantitative form when using the EC index. Consequently, this metric can evaluate the shifts between ecosystem types for any given assessment duration, allowing the magnitude of alterations of a specific ecosystem type to be determined. This parameter can also help identify focal regions based on the changes in ecosystem types. A high value signifies a high extent of transformation across various ecosystem types within a geographical domain. The computation adheres to Equation (6):
E C = i = 1 n Δ E C O i j i = 1 n E C O i × 100 %
where EC is the comprehensive ecosystem change, ECOi is the area covered by ecosystem type i at the beginning of the period, and ΔECOij is the absolute measure of the area covered by ecosystem type i that transitions to a non-i ecosystem type. Details of the estimation of EC can be found in HJ 1171-2021 [37].
(6)
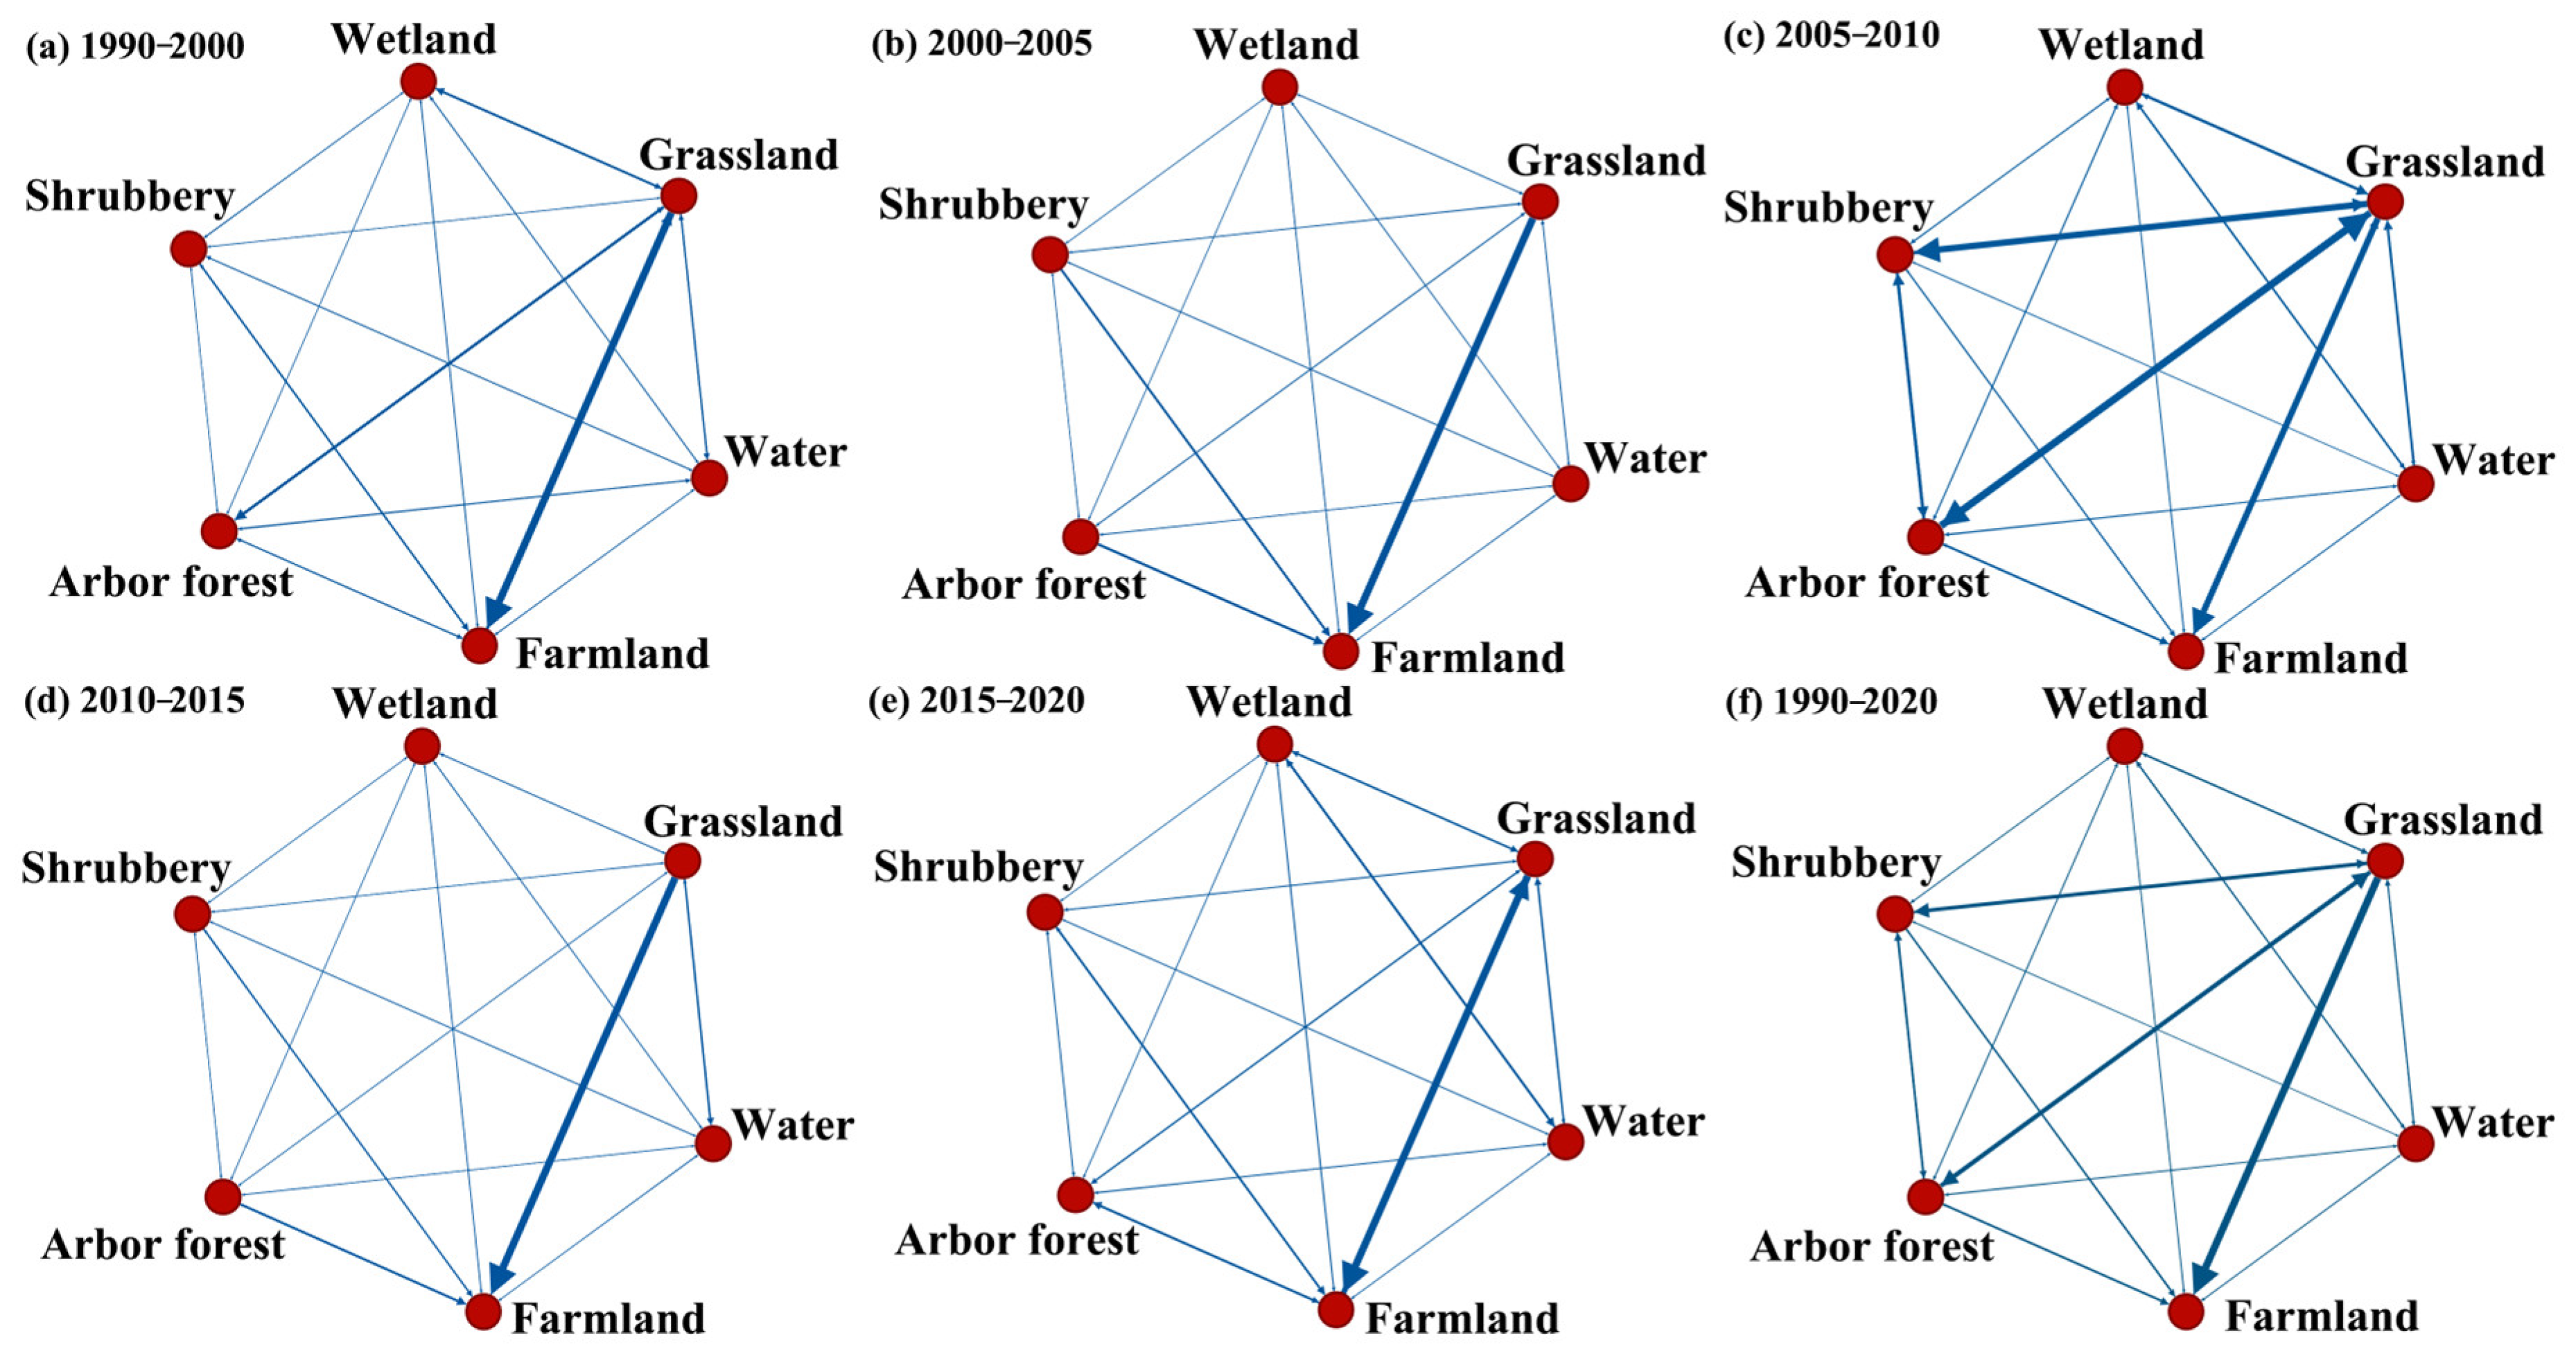
Direction of change (DC) in different ecosystem types
The course of change of a specific ecosystem type can be classified into several categories: transition of artificial ecosystems to natural ecosystems, transition of natural ecosystems to artificial ecosystems, transition of natural ecosystems to other natural ecosystems, and transition of artificial ecosystems to other artificial ecosystems. An artificial ecosystem includes farmland, unused land, and other similar categories. A natural ecosystem includes arboreal forests, shrubberies, grasslands, wetlands, and aquatic bodies. The estimation of DC is shown in HJ 1171-2021 [37].
(7)
Ecosystem structure index (ESI)
The ESI is calculated to comprehensively assess the systematic and stable states of various constituents of an ecosystem. This index includes both spatial and temporal dimensions (Baguette et al., 2013) [40]. The expression of the ecosystem structure index (ESI) is as follows:
E S I = 0.5 D C + 0.3 E C + 0.2 E S
Here, natural breaks (the Jenks methodology) were employed to partition the temporal data (i.e., 1990–2000, 2000–2005, 2005–2010, 2010–2015, 2015–2020, and 1990–2020) and levels (i.e., 1, 2, or 3 categories) for both EC and ES variables. Subsequently, the demarcated levels were juxtaposed with the various ecosystem types for systematic analysis. The obtained regional delineations were improvement areas, stability areas, and degradation areas (Table 3). The estimation of ESI has been discussed by Pan et al. [39].

2.5. Effects of Desert Riparian Climatic Factors on Changes in Ecosystem Structure in the TRB

GWR, which considers spatial heterogeneity, was used to examine the effects of climate change on the variations in the ESI and explain LUCC changes in the TRB from 1990 to 2020 (Q3). Prior to GWR modeling, the ordinary least-square model was used to determine whether the independent and dependent variables were significantly correlated (Talpur et al., 2023) [41]. As a tool, the GWR model can identify the spatially varying connections between independent and dependent variables (Brunsdon et al., 1996) [42]. It also takes into account the spatial relationships between sample points, including their distances, in accordance with Tobler’s first law of geography (Tobler 1970) [43], which can recognize the correlation between variable changes based on their spatial location, emphasizing the significance of local spatial impacts that might have been disregarded in the past. The GWR model is expressed as follows:
y l = β 0 u l , v l + k = 1 q β k u l , v l x l k + ε l .
where yl and xlk are the dependent variable and the k-th independent variables at location l, respectively. The geographic coordinates of position l are denoted by ul and vl. The parameter q represents the number of independent variables. The local regression coefficient for the j-th explanatory variable at location l is represented by βk(ul,vl), which indicates the degree of influence of the independent variable on the dependent variable. A larger absolute value of the coefficient denotes a greater influence. The intercept at location l is denoted by β0(ul,vl), and εl represents the error term. βk(ul,vl) is estimated on the basis of a distance-decay function (i.e., weighted least-square method) (Hezaveh et al., 2019) [44]. The estimation of GWR has been reported by Pan et al. [39].

3. Results

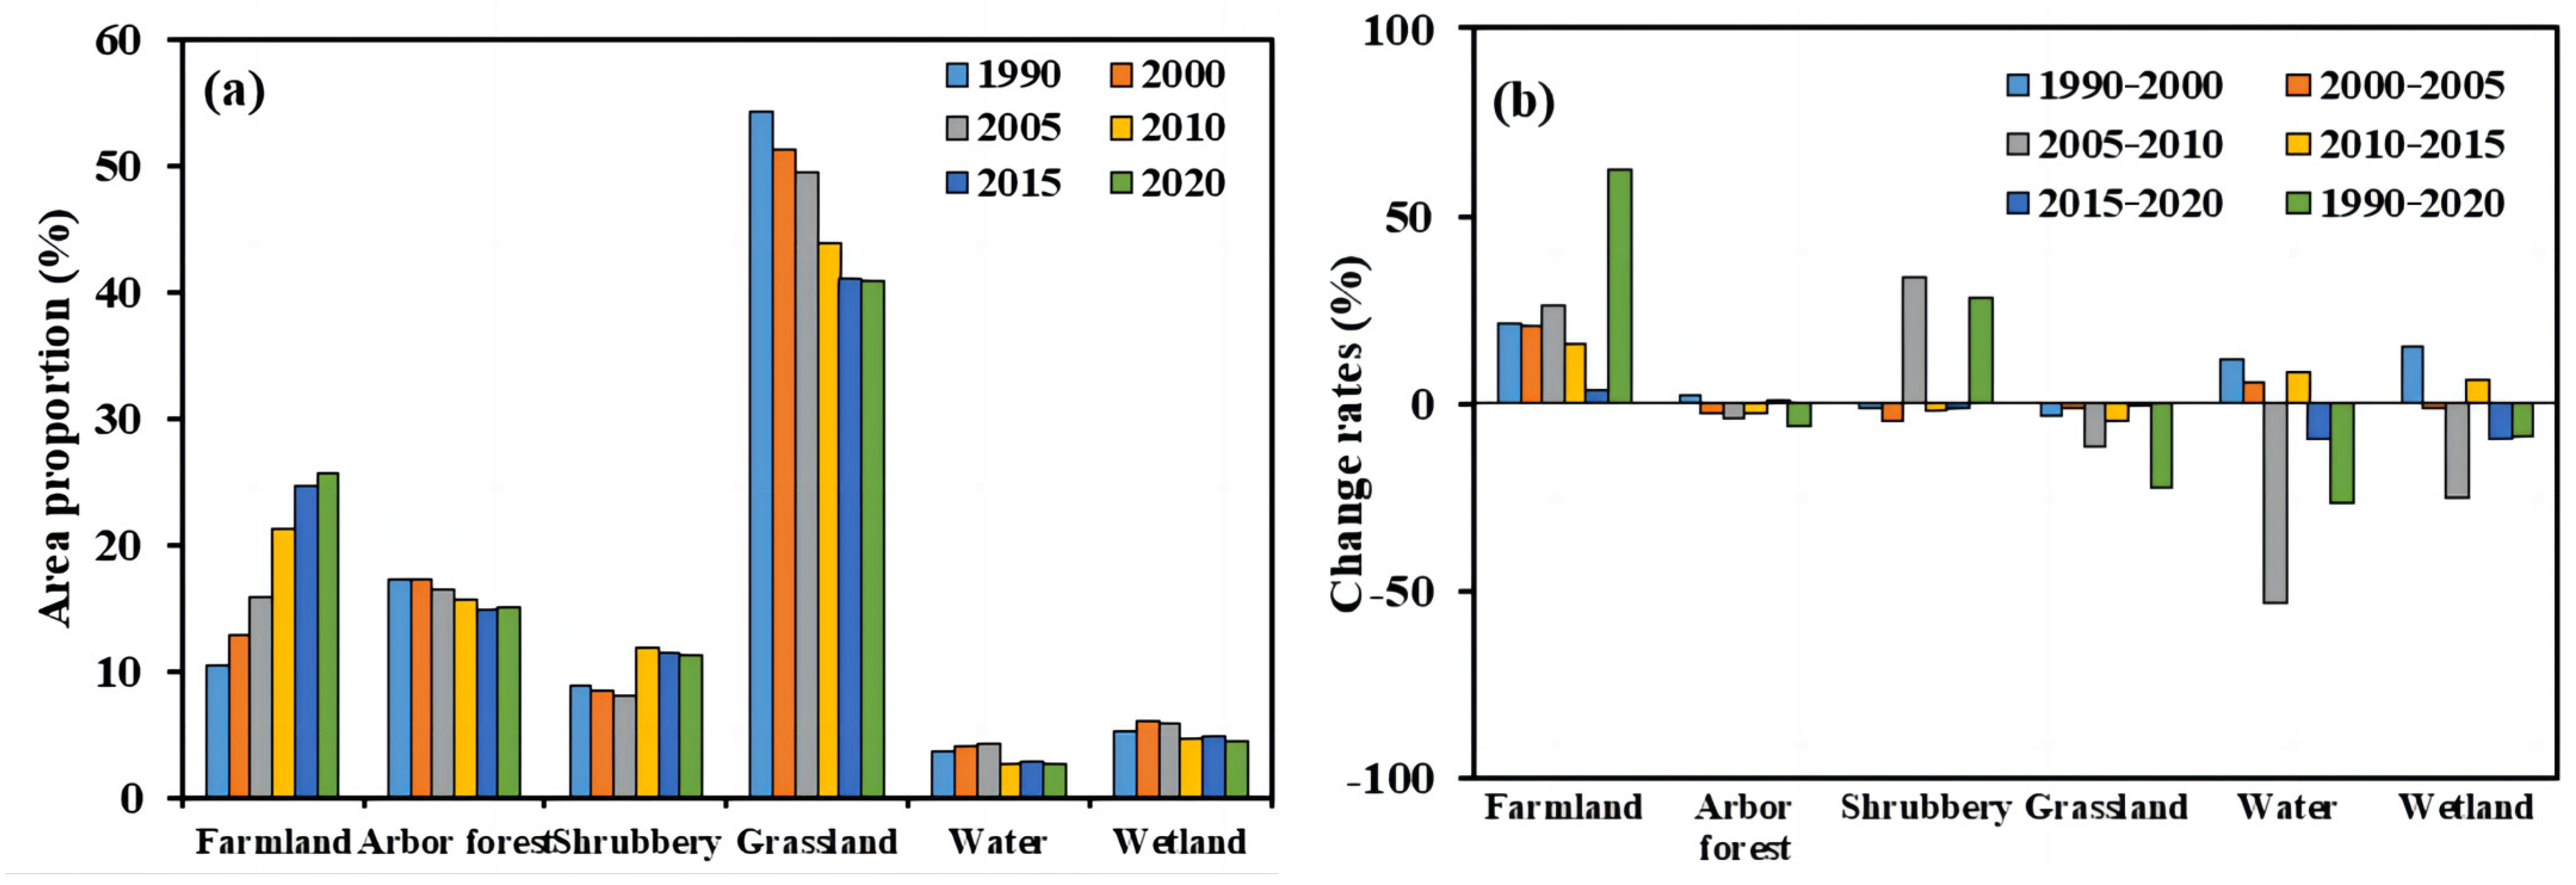
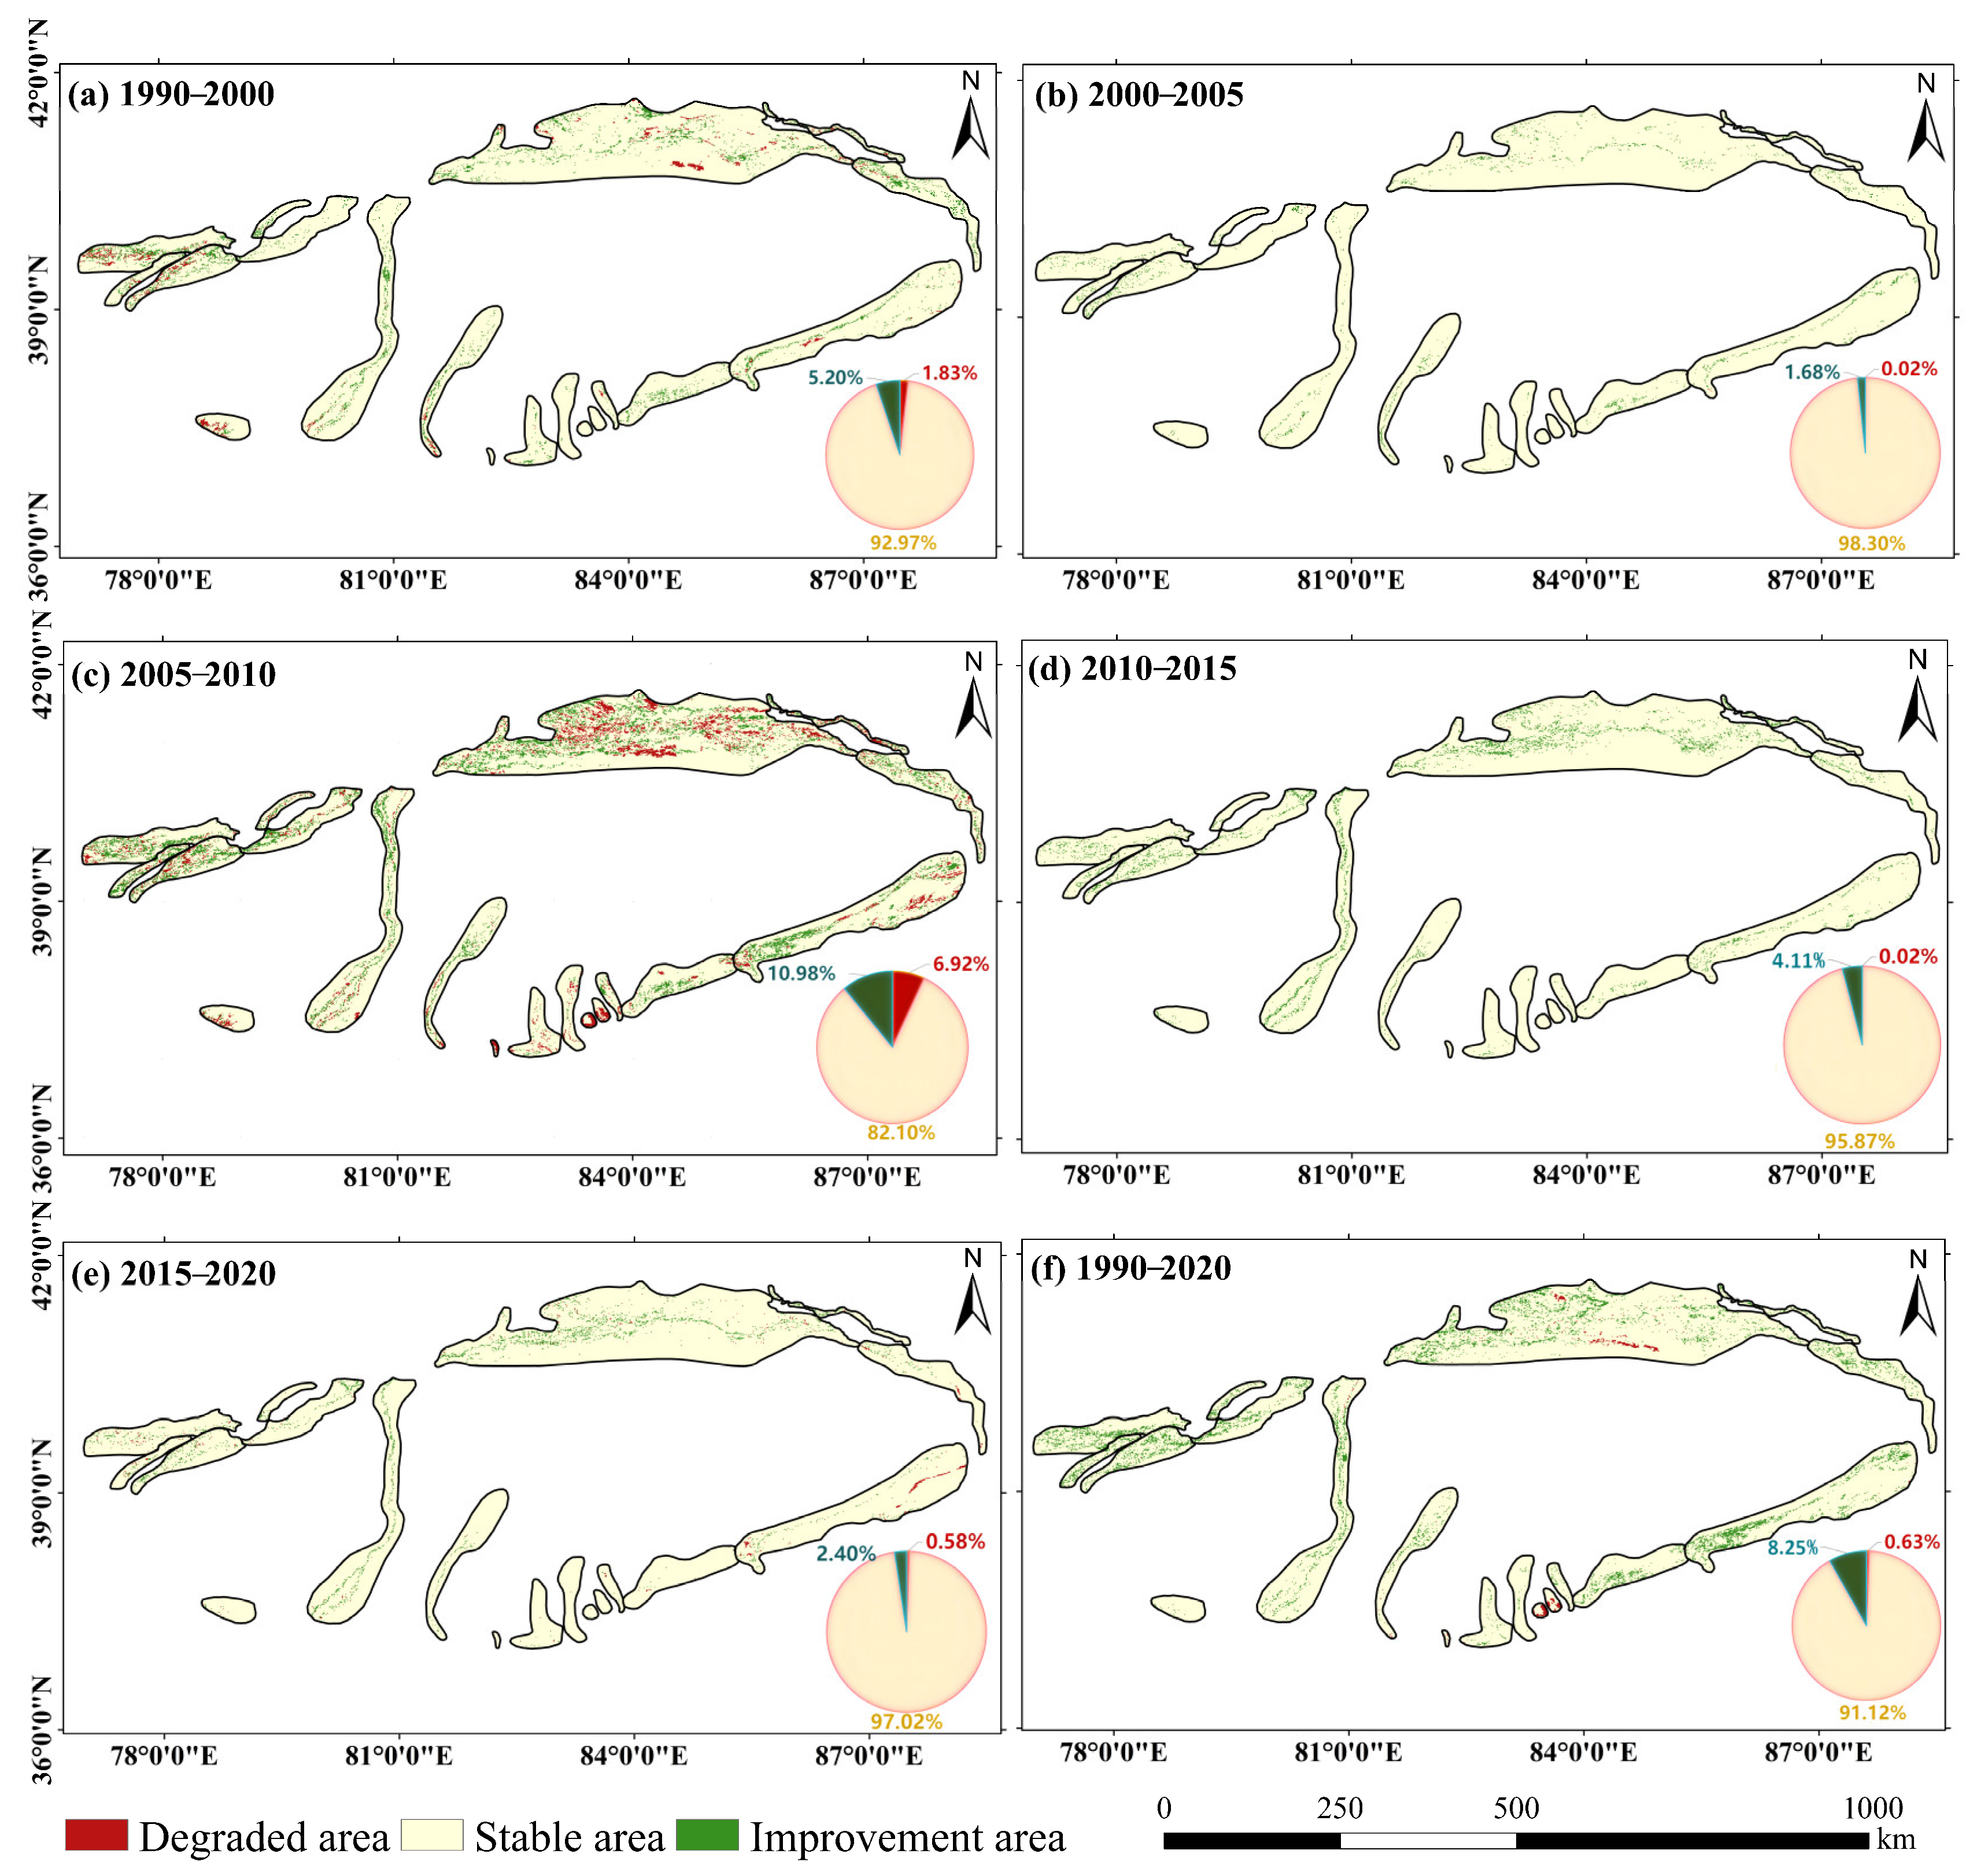
3.1. Spatial–Temporal Variation of Desert Riparian Ecosystem Structure

Between 1990 and 2020, the grassland ecosystem dominated the desert riparian ecosystem of the TRB, followed by farmland and arboreal forest ecosystems (Table S1; Figure 3a and Figure S1). The areas for grassland, wetland, water, and arboreal forest ecosystems exhibited a downtrend across the six time periods, whereas the areas for farmland and shrubbery ecosystems showed an uptrend (Tables S1–S7, Figure 3b and Figure 4a–f). Farmland expansion was mainly observed in the upper and middle sections of the Tarim River, the upper section of the Kashgar River, the Kongque River, the Hotan River, the Yarkand River, and the Cheerchen River (Figure S2). Figure 4 shows the transformation direction and the transformation area of each ecosystem type across the six periods from 1990 to 2020. Most of the areas for water ecosystems were converted to areas for grassland ecosystems. The widening areas for farmland ecosystems (an increase of 6.28%) led to a decrease in areas for grassland ecosystems to 639.91 km2 between 1990 and 2005 and between 2015 and 2020 (Figure 3b, Figure 4 and Figure S2). Between 2005 and 2010, the augmentation of areas for farmland and shrubbery ecosystems by 5.58% and 4.92%, respectively, led to a reduction in areas for arboreal and grassland ecosystems by 190.57 and 1410.80 km2, respectively. The decrease in areas of grassland and arboreal forest ecosystems was mainly due to the increase in areas of farmland and shrubbery. This phenomenon was mainly observed in the middle and upper reaches of the Tarim River, the upper reaches of the Hotan River, and the upper reaches of the Keriya River between 2005 and 2010. Therefore, controlling the increase in farmland and shrubbery areas can restore grassland and arboreal forest in the desert riparian ecosystem of the TRB.

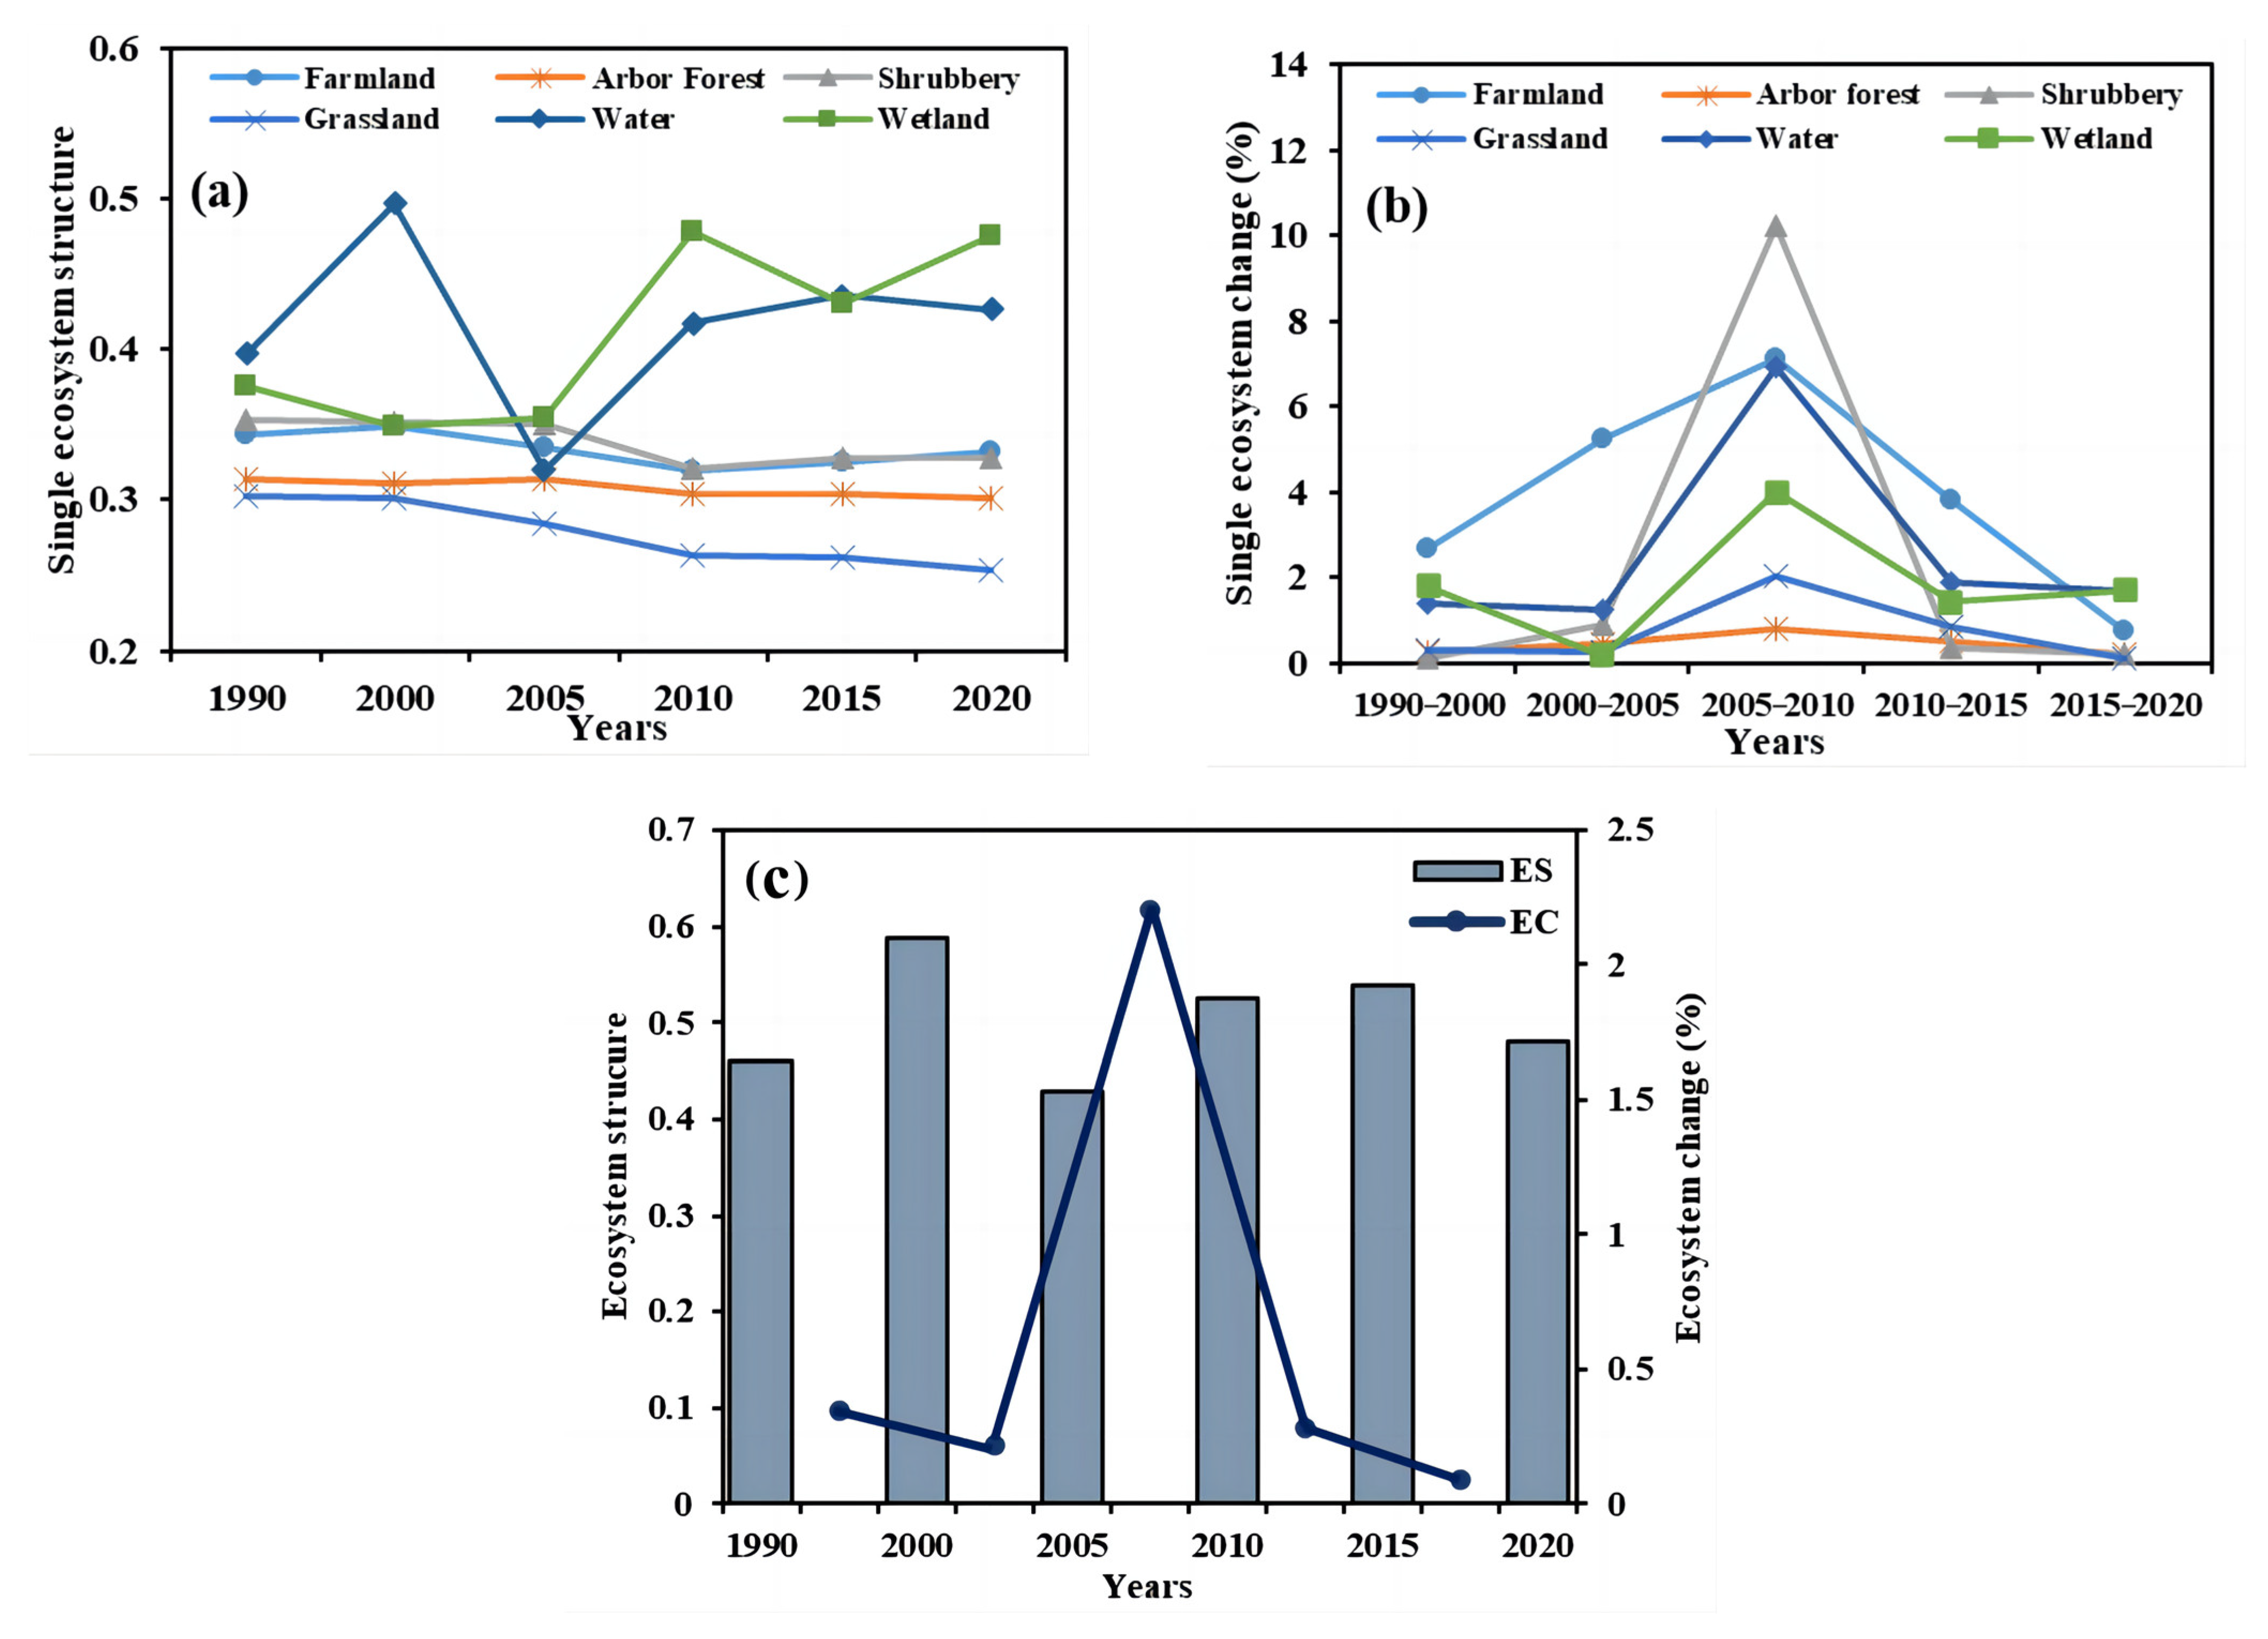
3.2. Evaluation of the Landscape Patterns in Desert Riparian Ecosystems in the TRB

Between 1990 and 2020, the ES and EC values of desert riparian ecosystems in the TRB exhibited varying fluctuations across the years (Figure 5c). The EC values reached their peak in 2005–2010, followed by a declining trajectory (Figure 5c). As shown in Figure 5a, from 1990 to 2020, the ES of water and wetland ecosystems showed an uptrend, whereas the ES of arboreal forest, shrubbery, farmland, and grassland ecosystems showed a downtrend. This indicates that water and wetland ecosystems had good connectivity, whereas shrubbery, farmland, arboreal forest, and grassland ecosystems were fragmented. The aforementioned findings and the trends shown in Figure S3 indicate that the regions with poor ecosystem connectivity and high fragmentation were mainly distributed in areas far from the rivers in the TRB. Conversely, in areas that are much closer to rivers, the connectivity of the ES improved. Between 2005 and 2010, shrubberies had the highest EC (10.23%), followed by farmland (7.12%), whereas arboreal forests had the lowest EC (0.82%) (Figure 5b, Figure S3). Therefore, over the course of 30 years in the TRB, particularly between 2005 and 2010, the encroachment of shrubberies and farmland on arboreal forests and grasslands was the main cause of the fragmented ecosystem patterns in areas located far from rivers.
Figure 6 shows an improved pattern in the TRB in successive years. These improvements were mainly concentrated in the middle and upper reaches of the Tarim River, the Yarkand River, the Kashgar River, and the Cheerchen River. However, degradation occurred in areas located far away from the main stream of the Tarim River and the small rivers in the northern foothills of the Kunlun Mountains (Hotan Region). Overall, the condition of the TRB ecosystem showed significant improvements, superseding degradation over the course of 30 years. The increase in shrubbery ecosystems between 1990 and 2020 improved the overall condition of desert riparian ecosystems in the TRB, and artificial ecosystems were transformed into natural ecosystems. However, the encroachment of shrubberies and farmland on arboreal forests and grasslands primarily caused the degradation of ecosystem patterns in areas far from rivers. Therefore, without changing the overall trend of ecosystem improvement, efforts to restore arboreal forests and grasslands need to be increased as a means of improving the connectivity of the desert riparian ecosystem in the TRB.

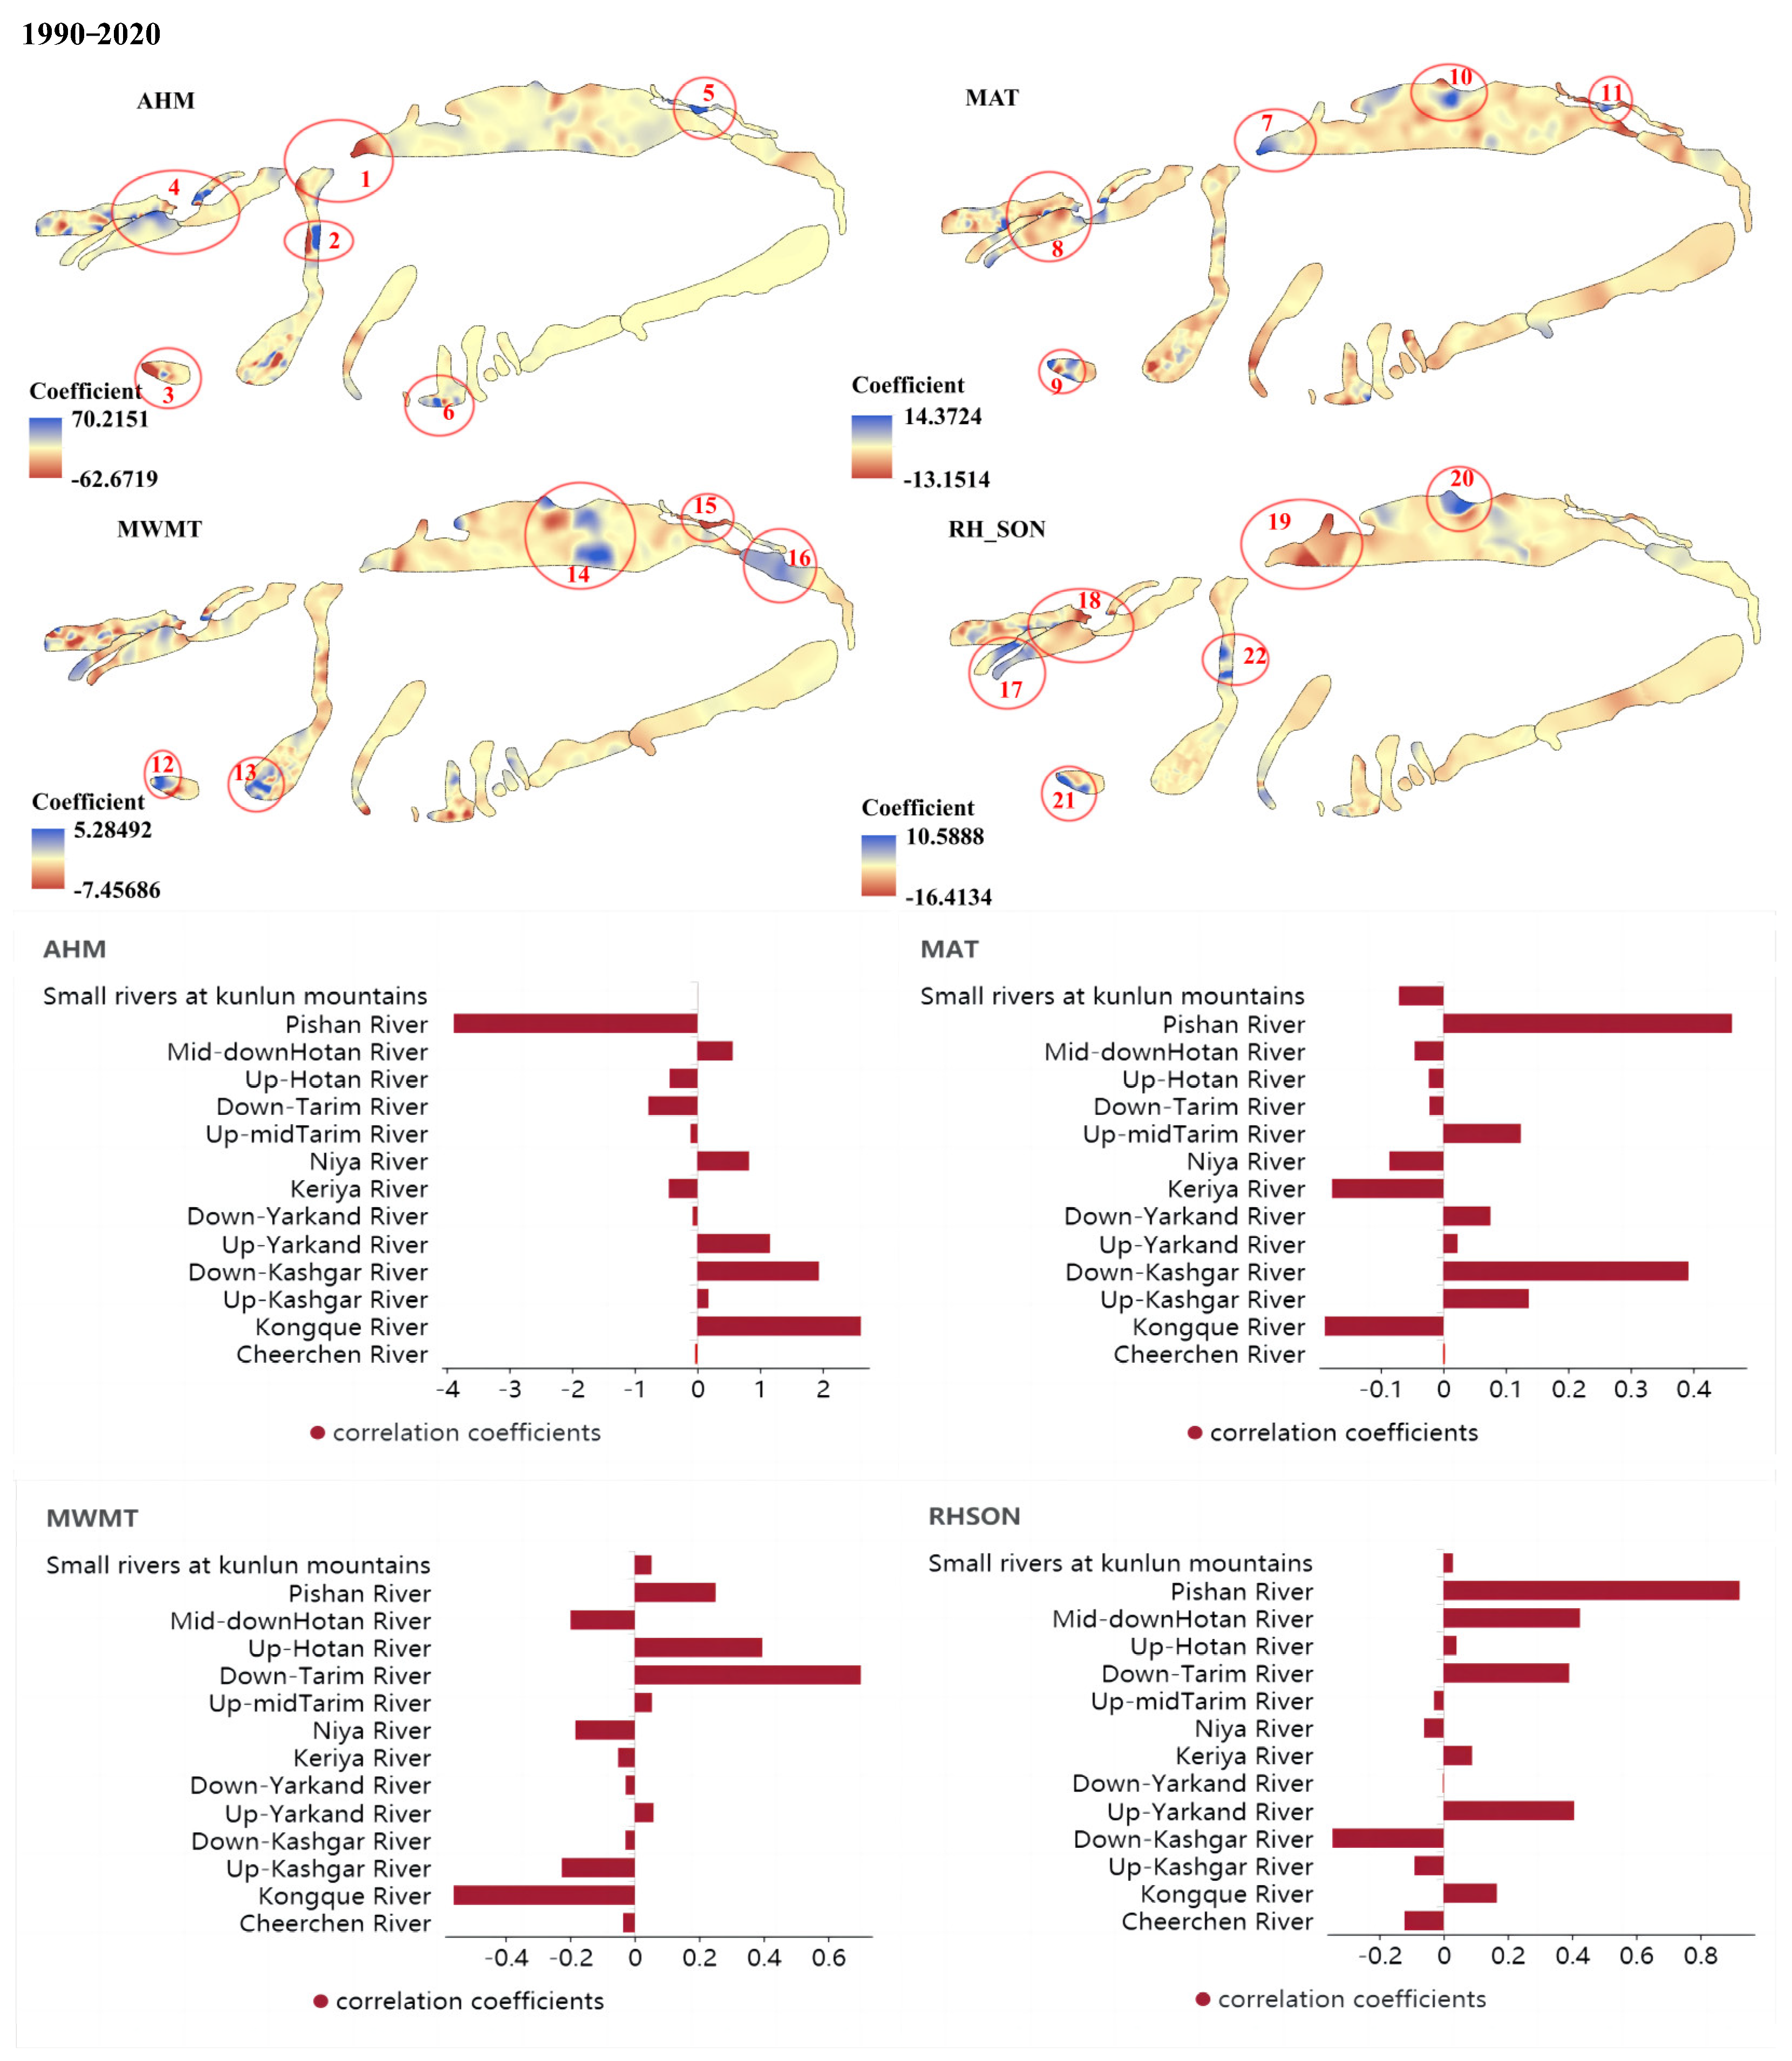
3.3. Effects of Desert Riparian Climatic Factors on Changes in Ecosystem Structure in the TRB

Figure 7 shows the significant spatial impact of climate factors on changes in ecosystem patterns from 1990 to 2020. The impacts were both positive and negative. The AHM index showed the strongest influence on the ESI, followed by RH_SON. The most affected areas were the middle reaches of the Tarim River, the Kongque River, the confluence of three rivers in the middle and lower reaches of the Hotan River, the Niya River, the Pishan River, and the upper reaches of the Kashgar River. The ESI decreased with increasing AHM for the middle and lower reaches of the Hotan River (i.e., the confluence of the three rivers), the left side of the middle reaches of the Hotan River, and the Pishan River (circles 1 to 3). By contrast, the ESI increased with increasing AHM for the right side of the middle reaches of the Hotan River, the Kongque River, the upper reaches of the Kashgar River and Yarkand River, and the Niya River (circles 2, 4, 5, and 6). The MWMT presented the lowest impact on the ESI.
As shown in Figure S4a, from 1990 to 2000, with the increase in RH_SON and the increase in ESI, the desert riparian ecosystem pattern improved (circles 16, 18, 20, 21, and 22). However, in the middle reaches of the Tarim River and the Pishan River (circles 4 and 6), the increasing AHM resulted in a decrease in the ESI, which implies degradation. From 2000 to 2005, the ESI of the upper reaches of the Kashgar River and the Yarkand River increased with increasing AHM (circle 1 in Figure S4b), whereas the ESI of the upper reaches of the Hotan River and the Cheerchen River decreased with increasing RH_SON (circles 11 and 14 in Figure S4b). From 2005 to 2020, AHM presented the strongest impact on the ESI, followed by RH_SON. With increasing AHM, the ESI values for the middle reaches of the Tarim River and the Niya River, the Kongque River, the Kashgar River, and the Yarkand River increased (circle 3 in Figure S4c; circles 1, 4, and 5 in Figure S4d; circle 5 in Figure S4e). The areas corresponding to decreasing ESI and increasing AHM included the upper and middle reaches of the Hotan River. The ESI was highly influenced by RH_SON in the lower reaches of the Kashgar River, the Yarkand River, the Cheerche River, and the Tarim River. The influences of MAT and MWMT were relatively low, mainly for the upper and middle reaches of the Tarim River (circles 8, 13, 14, and 15 in Figure S4a; circles 4 and 7 in Figure S4b; circles 6 and 12 in Figure S4c; circles 7 and 10 in Figure S4d; circles 10 and 12 in Figure S4e; circles 7, 10, 11, 14, and 16 in Figure 6). This scenario indicates the greater effect of humidity on the change in ecosystem pattern compared with temperature. Starting in 2005, the MAT and MWMT gradually affected the ESI of the Hotan River. The findings further imply that the rational allocation of water resources promotes sustainable resource management in the desert riparian ecosystems of the TRB and the maintenance of ecosystem balance.

4. Discussion

4.1. Spatial–Temporal LUCC Variation of Desert Riparian Ecosystems

The grassland ecosystem dominated the desert riparian ecosystem of the TRB, followed by farmland and arboreal forest ecosystems. Between 1990 and 2020, the areas of grassland, wetland, water, and arboreal forest ecosystems decreased, whereas the areas of farmland and shrubbery ecosystems increased. Between 2005 and 2010, the decreasing area of arboreal forest ecosystems was primarily due to the expansion of shrubbery ecosystems, particularly in the upper and middle reaches of the Tarim River, the upper reaches of the Hotan River, and the upper reaches of the Keriya River. Previous studies (Jiang et al., 2015; Wang et al., 2023a, 2023b) [4,45,46] also reported grasslands as the dominant ecosystem in other desert riparian ecosystems, and the decline in grassland area is linked to increasing farmland; the previous findings align with the findings of the present research. Population growth and the expansion of arable lands contribute to the decrease in grasslands to varying degrees (Chang et al., 2022) [47]. The present work further differentiates between arboreal forest and shrubbery, revealing that the increase in forestland is predominantly in the form of shrubberies. An increase in shrubbery areas leads to fragmentation of the arboreal forest and grassland landscapes, leading to negative effects on soil moisture, reduced herbaceous species, and alterations in soil nutrient cycling or availability (Schooley et al., 2021) [48]. Therefore, the unbalanced distribution of ecosystem patterns can have adverse effects on vegetation restoration.
In this study, the expansion of farmland and shrubbery areas not only led to a reduction in grassland and arboreal forest areas but also increased the fragmentation of these ecosystems, as shown by the 2005–2010 data pertaining to areas far from rivers in the TRB. Similar findings have been reported by Ma et al. (2023) [49] and Pompeu et al. (2023) [50]. Thus, agricultural expansion can result in extensive forest loss and landscape fragmentation, disrupting the natural habitats of specific species or populations. The findings may be related to the implementation of the policy of returning farmland to forests in Xinjiang, which commenced in 2012, and the area’s rapid population growth from 2005 to 2010. Meanwhile, these observations emphasize that human activities are the primary driving forces of change in desert riparian ecosystems (Urbanič et al., 2022) [51].

4.2. Evaluation of the Landscape Patterns in Desert Riparian Ecosystems

The evaluation conducted in this study further revealed a significant overall improvement in the ecosystems of the TRB region, surpassing the deterioration trend. Although many scholars have studied the restoration of arboreal forests, such as Salicaceae (González et al., 2018) [52], they collectively treated arboreal forests and shrub forests as woodlands in desert riparian ecosystems (Dufour et al., 2019) [53]. By contrast, the present study distinguished between tree forests and shrub forests at the landscape level. Combining this distinction with the finding that only shrub forest ecosystems experienced an increase in natural ecosystems between 1990 and 2020, the significant improvement in the ES of the TRB is primarily attributed to the increase in shrub forests. Shrub forests play a pivotal role in the desert riparian ecosystems of the TRB, and their influence should not be underestimated when studying ecosystem patterns (Zhang et al., 2023b) [54]. At the landscape level, the rise in shrubberies signifies an increase in forestland, and this vegetation restoration has improved to some extent. But increasing shrubbery affected soil moisture, inhibited the growth of herbaceous plants (Liu et al., 2023a) [55], and lowered the risk of soil erosion (Liu et al., 2023b) [56].

4.3. Effects of Climate Factors on Desert Riparian Ecosystems

Climate factors play a crucial role in shaping changes in ecosystem patterns. This study identified relative humidity as the most significant influencing factor of ecosystem patterns, followed by moisture content in the air during the growing season, whereas temperature had the weakest impact. These findings are consistent with those determined by Liu et al. (2017) and Luo et al. (2017) [57,58], who highlighted the dominant influence of solar radiation on river flow changes, with temperature acting as the second most influential factor. An increase in river runoff is beneficial for improving the desert riparian ecosystem pattern. Moreover, over the last 50 years, temperature and precipitation in the TRB have exhibited a significant increase (Tian et al., 2022) [59]. This climate warming and wetting trend has contributed to the overall improvement of the ecosystem pattern in most parts of the TRB (Peng et al., 2021) [60]. In particular, increases in the AHM index and RH_SON were conducive to the enhancement of the ecosystem patterns, particularly in the Hotan River, the Kongque River, the Kashgar River, the Yarkand River, and the Niya River. However, in areas such as the confluence of the Pishan River and the Three Rivers, an increase in the AHM index and RH_SON has led to a degradation of the ecosystem pattern. This degradation can be attributed to limited water resources, high ecosystem fragmentation, high vulnerability to climate change and human disturbance, and a limited capacity for recovery from damage (Ding and Xingming 2021) [61]. The degree of degradation even surpassed the positive impact of ecological protection measures (Gao et al., 2019) [62]. Several studies have indicated that the climate sensitivity of the TRB’s desert riparian ecosystem is dependent on groundwater conditions. A decline in groundwater levels can lead to a reduction in arboreal forestland (Zeng et al., 2019; Thomas and Lang 2020; Zhou et al., 2020; Wei et al., 2023) [63,64,65,66], while a warmer and more humid climate can cause groundwater levels to rise, which benefits the vegetation restoration of desert riparian ecosystems (Fu et al., 2019) [67]. Therefore, obtaining high-precision groundwater level data is essential for further exploring the primary drivers of vegetation growth in desert riparian zones.

4.4. Policy Implications for Ecosystem Protection

Understanding the attributes that underlie structural shifts in the desert riparian zones and their constituent ecosystems and exploring the spatial dissimilarities caused by climate variations with respect to the structural changes can help develop strategic guidelines for ecological preservation and sustainable progress in the TRB. In the last five decades, intensive exploitation of grasslands and forestlands, coupled with urban expansion, has led to profound consequences. These features encompass the prominent change in grasslands into farmlands, accompanied by the substantial contraction of vegetative areas in the desert riparian expanse of the TRB (Yang et al., 2014) [68]. To address pressing environmental challenges and instigate the revival of ecological initiatives in the TRB, Xinjiang has implemented a series of comprehensive ecological restoration initiatives that specifically target the Populus euphratica forest. These endeavors encompass several pivotal projects: the EWDP that was introduced in the lower segments of the Tarim River in 2000, the Special Action for P. euphratica Forest between 2016 and 2019, the Rescue Action for P. euphratica Forest conducted from 2019 to 2021, and the Flood Irrigation for P. euphratica Forest undertaken in 2022. Each of these initiatives has yielded commendable outcomes, significantly advancing the cause of ecological rejuvenation and conservation in the region (Ma et al., 2022) [69]. Although the middle and lower sections of the Tarim River fall within areas of relatively low ecological vulnerability, the ecosystem framework in the desert riparian zone underwent marked enhancement between 1990 and 2020 (Bao et al., 2017) [26]. This study determined that areas experiencing a more pronounced influence of climate change, which has also led to the deterioration of the ES for the desert riparian zone of the TRB, are predominantly concentrated in localities located far from the primary tributary of the Tarim River and the merging point of the Hotan River, the Yarkand River, and the Tarim River. Strategies suited for local circumstances should be deployed to heighten ecosystem resilience against climate change, with special attention accorded to safeguarding vulnerable regions. On the basis of the findings and results, this study proposes policy recommendations aimed at fostering ecological preservation and sustainable advancement in the desert riparian zone of the TRB. First, drought-resistant herbs and shrubs conducive to the long-term and sustainable restoration of ecosystems need to be incorporated. Climate monitoring should also be improved, and early warning systems must be proactively established to augment preparedness and ensure a swift response to the repercussions of climate change (Shi et al., 2021) [70]. Furthermore, water resource allocation can be optimized by redesigning water delivery zones such that they are more aligned with ecological restoration (Xue et al., 2019) [71]. Finally, a network of urban green spaces should be established to enhance landscape connectivity and amplify the functional capacity of ecosystems (Creamer et al., 2016) [72].

5. Scope and Limitations

This study focused primarily on assessing the changes in the riparian ecosystem of the TRB’s desert region and determined the critical role of climatic factors in shaping these patterns. However, this study focused mainly on the landscape level. Landscape-level studies suffer from the problem of overlooking some details, including the competition and symbiotic relationships between species in arboreal forests and between shrubberies and grasslands. The water requirements of different communities and the sources of water that provide the variations in the structure of different communities may have also been overlooked. In future research, structural changes at the community and species levels may be explored in depth, with a focus on selecting representative areas to obtain more complex and precise results. This study focused primarily on assessing changes in riparian ecosystem configurations in the TRB desert region and emphasized the critical role of climatic factors in shaping these patterns.

6. Conclusions

This study investigated the spatiotemporal distribution of land use and land cover changes (LULCCs) in the Tarim River Basin (TRB) spanning from 1990 to 2020. Our research reveals a noteworthy decline in grassland, wetland, water, and arboreal forest ecosystems, coupled with an expansion of farmland and shrubbery ecosystems. Notably, the expansion of shrubbery areas has had a transformative effect on the overall ecosystem structure, greatly enhancing connectivity and effectively reducing fragmentation. Moisture emerges as a pivotal factor in influencing ecosystem pattern changes, exerting a more substantial impact than temperature. This influence manifests positively in some regions, particularly benefiting the TRB’s desert riparian ecosystems, but it also leads to degradation in other areas. The rising moisture levels play a crucial role in the transformation of artificial desert riparian ecosystems into natural ones and actively promote vegetation restoration. However, it is important to note that the proliferation of shrubberies, while contributing positively to certain aspects of ecosystem health, does impede the expansion of grasslands and elevates susceptibility to land erosion. By conducting a thorough analysis of climate factors and their effects on the TRB’s ecosystem structure, our study makes a substantial contribution to Sustainable Development Goal (SDG) 13 (Climate Action). Our findings provide valuable knowledge that can be leveraged to support climate change mitigation and adaptation initiatives. Furthermore, our research aligns with SDG 15 (Life on Land) by underscoring the importance of understanding climate influences on ecosystem patterns and advocating for sustainable land management practices. We believe that by heeding the recommendations derived from our study, policymakers, researchers, and practitioners can make well-informed decisions that will foster environmental sustainability and, in turn, make meaningful contributions to the overarching sustainable development agenda set forth in the SDGs.

Supplementary Materials

The following supporting information can be downloaded at: https://www.mdpi.com/article/10.3390/su151914092/s1, Figure S1: The ecological system types in the desert riparian zone of the Tarim River Basin in 1990, 2000, 2005, 2010, 2015, and 2020; Figure S2: Spatial distributions of ecosystem transitions in the desert riparian zone of the Tarim River Basin during different periods. The ecological system types in the desert riparian zone of the Tarim River Basin in 1990, 2000, 2005, 2010, 2015, and 2020; Figure S3: Spatial pattern of Ecosystem Structure (ES) and Ecosystem Change (EC) in the Tarim River Basin; Figure S4: Regression coefficients of mean annual temperature (°C) (MAT), mean warmest month temperature (°C) (MWMT), relative humidity in September, October and November (%) (RH_SON) and annual heat:moisture index (MAT+10)/(MAP/1000)) (AHM) with ecosystem structure index (ESI) based on the GWR model during (a) 1990–2000, (b) 2000–2005, (c) 2005–2010, (d) 2010–2015, (e) 2015–2020. Numbers and circles denote areas where the ESI is more affected by climate factors; Table S1: Statistical analysis of land cover area in the study area (units: km2); Table S2: Transition matrix of ecosystem types during 1990–2000 in the desert riparian ecosystem of the Tarim River Basin (units: km2); Table S3: Transition matrix of ecosystem types during 2000–2005 in the desert riparian ecosystem of the Tarim River Basin (units: km2); Table S4: Transition matrix of ecosystem types during 2005–2010 in the desert riparian ecosystem of the Tarim River Basin (units: km2); Table S5: Transition matrix of ecosystem types during 2010–2015 in the desert riparian ecosystem of the Tarim River Basin (units: km2); Table S6: Transition matrix of ecosystem types during 2015–2020 in the desert riparian ecosystem of the Tarim River Basin (units: km2); Table S7: Transition matrix of ecosystem types during 1990–2020 in the desert riparian ecosystem of the Tarim River Basin (units: km2).

Author Contributions

X.G. had the main responsibility for data collection, analysis, and writing; L.Z. and Y.T. had the main responsibility for data collection; Z.L. had the overall responsibility for experimental design and project management. All authors have read and agreed to the published version of the manuscript.

Funding

This work was financially supported by the Bintuan Science and Technology Program (2021BB010), the Graduate Research and Innovation Projects in the Autonomous Region (XJ2022G237), the Third Xinjiang Integrated Scientific Investigation Project (2022xjkk020401).

Institutional Review Board Statement

This study did not require ethical approval because it is not involving humans or animals studies.

Informed Consent Statement

This study is not involving humans or animals studies.

Data Availability Statement

Data openly available in a public repository. China National Land Use/Cover Change Monitoring Program (CNLUCC)—A dataset of multi-temporal land use remote sensing monitoring in China (http://www.resdc.cn/DOI). Climate data were acquired from the WorldClim database (https://www.worldclim.org/).

Conflicts of Interest

The authors declare no conflict of interest.

References

  1. Cole, L.J.; Stockan, J.; Helliwell, R. Managing riparian buffer strips to optimise ecosystem services: A review. Agric. Ecosyst. Environ. 2020, 296, 106891. [Google Scholar] [CrossRef]
  2. Sun, H.; Wang, P.; Chen, Q.; Zhang, D.; Xing, Y. Coupling the water use of Populus euphratica and Tamarix ramosissima and evapotranspiration partitioning in a desert riparian forest ecosystem. Agric. For. Meteorol. 2022, 323, 109064. [Google Scholar] [CrossRef]
  3. Wang, X.; Geng, X.; Liu, B.; Cai, D.; Li, D.; Xiao, F.; Zhu, B.; Hua, T.; Lu, R.; Liu, F. Desert ecosystems in China: Past, present, and future. Earth-Sci. Rev. 2022, 234, 104206. [Google Scholar] [CrossRef]
  4. Wang, Q.; Guan, Q.; Sun, Y.; Du, Q.; Xiao, X.; Luo, H.; Zhang, J.; Mi, J. Simulation of future land use/cover change (LUCC) in typical watersheds of arid regions under multiple scenarios. J. Environ. Manag. 2023, 335, 117543. [Google Scholar] [CrossRef]
  5. Gomes, E.; Inácio, M.; Bogdzevič, K.; Kalinauskas, M.; Karnauskaitė, D.; Pereira, P. Future land-use changes and its impacts on terrestrial ecosystem services: A review. Sci. Total Environ. 2021, 781, 146716. [Google Scholar] [CrossRef]
  6. Feng, H.; Wang, S.; Zou, B.; Yang, Z.; Wang, S.; Wang, W. Contribution of land use and cover change (LUCC) to the global terrestrial carbon uptake. Sci. Total Environ. 2023, 901, 165932. [Google Scholar] [CrossRef]
  7. Feng, H.; Wang, S.; Zou, B.; Nie, Y.; Ye, S.; Ding, Y.; Zhu, S. Land use and cover change (LUCC) impacts on Earth’s eco-environments: Research progress and prospects. Adv. Space Res. 2023, 71, 1418–1435. [Google Scholar] [CrossRef]
  8. Yang, H.; Zhong, X.; Deng, S.; Nie, S. Impact of LUCC on landscape pattern in the Yangtze River Basin during 2001–2019. Ecol. Inform. 2022, 69, 101631. [Google Scholar] [CrossRef]
  9. Zhu, Y.; Yan, L.; Wang, Y.; Zhang, J.; Liang Le Xu, Z.; Guo, J.; Yang, R. Landscape pattern change and its correlation with influencing factors in semiarid areas, northwestern China. Chemosphere 2022, 307, 135837. [Google Scholar] [CrossRef]
  10. Jiao, M.; Hu, M.; Xia, B. Spatiotemporal dynamic simulation of land-use and landscape-pattern in the Pearl River Delta, China. Sustain. Cities Soc. 2019, 49, 101581. [Google Scholar] [CrossRef]
  11. Zhao, F.; Li, H.; Li, C.; Cai, Y.; Wang, X.; Liu, Q. Analyzing the influence of landscape pattern change on ecological water requirements in an arid/semiarid region of China. J. Hydrol. 2019, 578, 124098. [Google Scholar] [CrossRef]
  12. Liu, C.; Zhang, F.; Carl Johnson, V.; Duan, P.; Kung, H.-t. Spatio-temporal variation of oasis landscape pattern in arid area: Human or natural driving? Ecol. Indic. 2021, 125, 107495. [Google Scholar] [CrossRef]
  13. Liu, J.; Wilson, M.; Hu, G.; Liu, J.; Wu, J.; Yu, M. How does habitat fragmentation affect the biodiversity and ecosystem functioning relationship? Landsc. Ecol. 2018, 33, 341–352. [Google Scholar] [CrossRef]
  14. Mengist, W.; Soromessa, T.; Feyisa, G.L. Landscape change effects on habitat quality in a forest biosphere reserve: Implications for the conservation of native habitats. J. Clean. Prod. 2021, 329, 129778. [Google Scholar] [CrossRef]
  15. Zhang, T.; Zhang, S.; Cao, Q.; Wang, H.; Li, Y. The spatiotemporal dynamics of ecosystem services bundles and the social-economic-ecological drivers in the Yellow River Delta region. Ecol. Indic. 2022, 135, 108573. [Google Scholar] [CrossRef]
  16. Wang, Y.; Pan, J. Building ecological security patterns based on ecosystem services value reconstruction in an arid inland basin: A case study in Ganzhou District, NW China. J. Clean. Prod. 2019, 241, 118337. [Google Scholar] [CrossRef]
  17. Pan, N.; Guan, Q.; Wang, Q.; Sun, Y.; Li, H.; Ma, Y. Spatial Differentiation and Driving Mechanisms in Ecosystem Service Value of Arid Region: A case study in the middle and lower reaches of Shule River Basin, NW China. J. Clean. Prod. 2021, 319, 128718. [Google Scholar] [CrossRef]
  18. Li, Y.; Liu, W.; Feng, Q.; Zhu, M.; Yang, L.; Zhang, J. Effects of land use and land cover change on soil organic carbon storage in the Hexi regions, Northwest China. J. Environ. Manag. 2022, 312, 114911. [Google Scholar] [CrossRef]
  19. Du, L.; Zeng, Y.; Ma, L.; Qiao, C.; Wu, H.; Su, Z.; Bao, G. Effects of anthropogenic revegetation on the water and carbon cycles of a desert steppe ecosystem. Agric. For. Meteorol. 2021, 300, 108339. [Google Scholar] [CrossRef]
  20. Venter, Z.S.; Cramer, M.D.; Hawkins, H.J. Drivers of woody plant encroachment over Africa. Nat. Commun. 2018, 9, 2272. [Google Scholar] [CrossRef]
  21. Lv, X.; Xiao, W.; Zhao, Y.; Zhang, W.; Li, S.; Sun, H. Drivers of spatio-temporal ecological vulnerability in an arid, coal mining region in Western China. Ecol. Indic. 2019, 106, 105475. [Google Scholar] [CrossRef]
  22. Guo, B.; Zang, W.; Luo, W. Spatial-temporal shifts of ecological vulnerability of Karst Mountain ecosystem-impacts of global change and anthropogenic interference. Sci. Total Environ. 2020, 741, 140256. [Google Scholar] [CrossRef] [PubMed]
  23. Yang, Y.; Roderick, M.L.; Guo, H.; Miralles, D.G.; Zhang, L.; Fatichi, S.; Luo, X.; Zhang, Y.; McVicar, T.R.; Tu, Z.; et al. Evapotranspiration on a greening Earth. Nat. Rev. Earth Environ. 2023, 4, 626–641. [Google Scholar] [CrossRef]
  24. Zhang, S.; Wang, Y.; Wang, Y.; Li, Z.; Hou, Y. Spatiotemporal Evolution and Influencing Mechanisms of Ecosystem Service Value in the Tarim River Basin, Northwest China. Remote Sens. 2023, 15, 591. [Google Scholar] [CrossRef]
  25. Wang, X.; Ling, H.; Xu, H.; Cunde, P.; Yuan, K. Relationships between Plant Communities and Environmental Factors in an Extremely Arid Area: A Case Study in China. Pol. J. Environ. Stud. 2019, 28, 359–370. [Google Scholar] [CrossRef]
  26. Bao, A.; Huang, Y.; Ma, Y.; Guo, H.; Wang, Y. Assessing the effect of EWDP on vegetation restoration by remote sensing in the lower reaches of Tarim River. Ecol. Indic. 2017, 74, 261–275. [Google Scholar] [CrossRef]
  27. Wang, X.; Ma, T.; Ling, H.; Peng, S. Effects of Ecological Water Conveyance Project on the Structure, Species Diversity and Stability of Desert Riparian Forest in the Lower Reaches of Tarim River, Northwest China. Res. Sq. 2020, 1–22. [Google Scholar] [CrossRef]
  28. Jiang, N.; Zhang, Q.; Zhang, S.; Zhao, X.; Cheng, H. Spatial and temporal evolutions of vegetation coverage in the Tarim River Basin and their responses to phenology. Catena 2022, 217, 106489. [Google Scholar] [CrossRef]
  29. Hoppenreijs, J.H.T.; Eckstein, R.L.; Lind, L. Pressures on Boreal Riparian Vegetation: A Literature Review. Front. Ecol. Evol. 2022, 9, 806130. [Google Scholar] [CrossRef]
  30. Keram, A.; Halik, Ü.; Keyimu, M.; Aishan, T.; Mamat, Z.; Rouzi, A. Gap dynamics of natural Populus euphratica floodplain forests affected by hydrological alteration along the Tarim River: Implications for restoration of the riparian forests. Ecol. Manag. 2019, 438, 103–113. [Google Scholar] [CrossRef]
  31. Ling, H.; Zhang, P.; Guo, B.; Xu, H.; Ye, M.; Deng, X. Negative feedback adjustment challenges reconstruction study from tree rings: A study case of response of Populus euphratica to river discontinuous flow and ecological water conveyance. Sci. Total Environ. 2017, 574, 109–119. [Google Scholar] [CrossRef] [PubMed]
  32. Guo, H.; Jiapaer, G.; Bao, A.; Li, X.; Huang, Y.; Ndayisaba, F.; Meng, F. Effects of the Tarim River’s middle stream water transport dike on the fractional cover of desert riparian vegetation. Ecol. Eng. 2017, 99, 333–342. [Google Scholar] [CrossRef]
  33. Ling, H.; Guo, B.; Yan, J.; Deng, X.; Xu, H.; Zhang, G. Enhancing the positive effects of ecological water conservancy engineering on desert riparian forest growth in an arid basin. Ecol. Indic. 2020, 118, 106797. [Google Scholar] [CrossRef]
  34. Mamat, Z.; Halik, U.; Aishan, T.; Aini, A. Ecological effect of the riparian ecosystem in the lower reaches of the Tarim River in northwest China. PLoS ONE 2019, 14, e0208462. [Google Scholar] [CrossRef] [PubMed]
  35. Xu, X.; Liu, J.; Zhang, S.; Li, R.; Yan, C.; Wu, S. China National Land Use/Cover Change Monitoring Program (CNLUCC)—A dataset of multi-temporal land use remote sensing monitoring in China. Resour. Environ. Sci. Data Cent. 2018. [Google Scholar] [CrossRef]
  36. Khahro, S.H.; Talpur, M.A.H.; Bhellar, M.G.; Das, G.; Shaikh, H.; Sultan, B. GIS-Based Sustainable Accessibility Mapping of Urban Parks: Evidence from the Second Largest Settlement of Sindh, Pakistan. Sustainability 2023, 15, 6228. [Google Scholar] [CrossRef]
  37. HJ 1171—2021; Technical Specification for Investigation and Assessment of National Ecological Status—Ecosystem Patterns Assessment. The People’s Republic of China Ecological Environment Department: Beijing, China, 2021; pp. 1–5.
  38. Sijing, X.; Gang, L.; Biao, M. Vulnerability analysis of land ecosystem considering ecological cost and value: A complex network approach. Ecol. Indic. 2023, 147, 109941. [Google Scholar] [CrossRef]
  39. Pan, Z.; Gao, G.; Fu, B. Spatiotemporal changes and driving forces of ecosystem vulnerability in the Yangtze River Basin, China: Quantification using habitat-structure-function framework. Sci. Total Environ. 2022, 835, 155494. [Google Scholar] [CrossRef]
  40. Baguette, M.; Blanchet, S.; Legrand, D.; Stevens, V.M.; Turlure, C. Individual dispersal, landscape connectivity and ecological networks. Biol. Rev. Camb. Philos. Soc. 2013, 88, 310–326. [Google Scholar] [CrossRef]
  41. Talpur, M.A.H.; Khahro, S.H.; Ali, T.H.; Waseem, H.B.; Napiah, M. Computing travel impendences using trip generation regression model: A phenomenon of travel decision-making process of rural households. Environ. Dev. Sustain. 2023, 25, 5973–5996. [Google Scholar] [CrossRef]
  42. Brunsdon, C.; Fotheringham, A.S.; Charlton, M.E. Geographically Weighted Regression: A Method for Exploring Spatial Nonstationarity. Geogr. Anal. 1996, 28, 281–298. [Google Scholar] [CrossRef]
  43. Tobler, W. A computer movie simulating urban growth in the Detroit region. Econ. Geogr. 1970, 46, 234–240. [Google Scholar] [CrossRef]
  44. Hezaveh, A.M.; Arvin, R.; Cherry, C.R. A geographically weighted regression to estimate the comprehensive cost of traffic crashes at a zonal level. Accid. Anal. Prev. 2019, 131, 15–24. [Google Scholar] [CrossRef] [PubMed]
  45. Wang, S.; Zuo, Q.; Zhou, K.; Wang, J.; Wang, W. Predictions of Land Use/Land Cover Change and Landscape Pattern Analysis in the Lower Reaches of the Tarim River, China. Land 2023, 12, 1093. [Google Scholar] [CrossRef]
  46. Jiang, P.; Cheng, L.; Li, M.; Zhao, R.; Duan, Y. Impacts of LUCC on soil properties in the riparian zones of desert oasis with remote sensing data: A case study of the middle Heihe River basin, China. Sci. Total Environ. 2015, 506–507, 259–271. [Google Scholar] [CrossRef]
  47. Chang, X.; Xing, Y.; Wang, J.; Yang, H.; Gong, W. Effects of land use and cover change (LUCC) on terrestrial carbon stocks in China between 2000 and 2018. Resour. Conserv. Recycl. 2022, 182, 106333. [Google Scholar] [CrossRef]
  48. Schooley, R.L.; Bestelmeyer, B.T.; Wagnon, C.J.; Coffman, J.M. Shrub encroachment, landscape restoration, and intraguild predation. J. Arid Environ. 2021, 193, 104588. [Google Scholar] [CrossRef]
  49. Ma, S.; Wang, L.-J.; Jiang, J.; Zhao, Y.-G. Direct and indirect effects of agricultural expansion and landscape fragmentation processes on natural habitats. Agric. Ecosyst. Environ. 2023, 353, 108555. [Google Scholar] [CrossRef]
  50. Pompeu, J.; de Oliveira Portella, R. Genetic viability and habitat suitability of the critically endangered southern muriqui (Brachyteles arachnoides) in the Atlantic Forest’s fragmented landscapes under land use and climate change scenarios. Clim. Change Ecol. 2023, 5, 100065. [Google Scholar] [CrossRef]
  51. Urbanič, G.; Politti, E.; Rodríguez-González, P.M.; Payne, R.; Schook, D.; Alves, M.H.; Anđelković, A.; Bruno, D.; Chilikova-Lubomirova, M.; Di Lonardo, S.; et al. Riparian Zones—From Policy Neglected to Policy Integrated. Front. Environ. Sci. 2022, 10, 868527. [Google Scholar] [CrossRef]
  52. González, E.; Martínez-Fernández, V.; Shafroth, P.B.; Sher, A.A.; Henry, A.L.; Garófano-Gómez, V.; Corenblit, D. Regeneration of Salicaceae riparian forests in the Northern Hemisphere: A new framework and management tool. J. Environ. Manag. 2018, 218, 374–387. [Google Scholar] [CrossRef] [PubMed]
  53. Dufour, S.; Rodríguez-González, P.M.; Laslier, M. Tracing the scientific trajectory of riparian vegetation studies: Main topics, approaches and needs in a globally changing world. Sci. Total Environ. 2019, 653, 1168–1185. [Google Scholar] [CrossRef] [PubMed]
  54. Zhang, T.; Chen, Y.; Ali, S. Abiotic stress and human activities reduce plant diversity in desert riparian forests. Ecol. Indic. 2023, 152, 110340. [Google Scholar] [CrossRef]
  55. Liu, Y.-F.; Fang, H.; Shi, J.; Leite, P.A.M.; Zhao, J.; Wu, G.-L. Climate change-induced shrub encroachment changes soil hydraulic properties and inhibits herbaceous growth in alpine meadows. Agric. For. Meteorol. 2023, 340, 109629. [Google Scholar] [CrossRef]
  56. Liu, Y.-F.; Fang, H.; Huang, Z.; Leite, P.A.M.; Liu, Y.; López-Vicente, M.; Zhao, J.; Shi, Z.-H.; Wu, G.-L. Shrub encroachment increases soil erosion risk in hillside alpine meadows of the Qinghai-Tibetan Plateau, NW China. Catena 2023, 222, 106842. [Google Scholar] [CrossRef]
  57. Liu, J.; Zhang, Q.; Singh, V.P.; Shi, P. Contribution of multiple climatic variables and human activities to streamflow changes across China. J. Hydrol. 2017, 545, 145–162. [Google Scholar] [CrossRef]
  58. Luo, M.; Guli, J.; Guo, H.; Guo, H.; Zhang, P.; Meng, F.; Liu, T. Spatial-temporal Variation of Growing-season NDVI and Its Responses to Hydrothermal Condition in the Tarim River Basin from 2000 to 2013. J. Nat. Resour. 2017, 32, 50–63. [Google Scholar]
  59. Tian, J.; Zhang, Z.; Zhao, T.; Tao, H.; Zhu, B. Warmer and wetter climate induced by the continual increase in atmospheric temperature and precipitable water vapor over the arid and semi–arid regions of Northwest China. J. Hydrol. Reg. Stud. 2022, 42, 101151. [Google Scholar] [CrossRef]
  60. Peng, Q.; Wang, R.; Jiang, Y.; Li, C. Contributions of climate change and human activities to vegetation dynamics in Qilian Mountain National Park, northwest China. Glob. Ecol. Conserv. 2021, 32, e01947. [Google Scholar] [CrossRef]
  61. Ding, H.; Xingming, H. Spatiotemporal change and drivers analysis of desertification in the arid region of northwest China based on geographic detector. Environ. Chall. 2021, 4, 100082. [Google Scholar] [CrossRef]
  62. Gao, J.; Yu, Z.; Wang, L.; Vejre, H. Suitability of regional development based on ecosystem service benefits and losses: A case study of the Yangtze River Delta urban agglomeration, China. Ecol. Indic. 2019, 107, 105579. [Google Scholar] [CrossRef]
  63. Zeng, Y.; Zhao, C.; Li, J.; Li, Y.; Lv, G.; Liu, T. Effect of groundwater depth on riparian plant diversity along riverside-desert gradients in the Tarim River. J. Plant Ecol. 2019, 12, 564–573. [Google Scholar] [CrossRef]
  64. Thomas, F.M.; Lang, P. Growth and water relations of riparian poplar forests under pressure in Central Asia’s Tarim River Basin. River Res. Appl. 2020, 37, 233–240. [Google Scholar] [CrossRef]
  65. Zhou, H.; Chen, Y.; Zhu, C.; Li, Z.; Fang, G.; Li, Y.; Fu, A. Climate change may accelerate the decline of desert riparian forest in the lower Tarim River, Northwestern China: Evidence from tree-rings of Populus euphratica. Ecol. Indic. 2020, 111, 105997. [Google Scholar] [CrossRef]
  66. Wei, Y.; Wang, F.; Hong, B.; Yang, S. Revealing spatial variability of groundwater level in typical ecosystems of the Tarim Basin through ensemble algorithms and limited observations. J. Hydrol. 2023, 620, 129399. [Google Scholar] [CrossRef]
  67. Fu, G.; Crosbie, R.S.; Barron, O.; Charles, S.P.; Dawes, W.; Shi, X.; Van Niel, T.; Li, C. Attributing variations of temporal and spatial groundwater recharge: A statistical analysis of climatic and non-climatic factors. J. Hydrol. 2019, 568, 816–834. [Google Scholar] [CrossRef]
  68. Yang, H.; Mu, S.; Li, J. Effects of ecological restoration projects on land use and land cover change and its influences on territorial NPP in Xinjiang, China. Catena 2014, 115, 85–95. [Google Scholar] [CrossRef]
  69. Ma, S.; Wang, H.-Y.; Wang, L.-J.; Jiang, J.; Gong, J.-W.; Wu, S.; Luo, G.-Y. Evaluation and simulation of landscape evolution and its ecological effects under vegetation restoration in the northern sand prevention belt, China. Catena 2022, 218, 106555. [Google Scholar] [CrossRef]
  70. Shi, S.; Yu, J.; Wang, F.; Wang, P.; Zhang, Y.; Jin, K. Quantitative contributions of climate change and human activities to vegetation changes over multiple time scales on the Loess Plateau. Sci. Total Environ. 2021, 755, 142419. [Google Scholar] [CrossRef]
  71. Xue, L.; Wang, J.; Zhang, L.; Wei, G.; Zhu, B. Spatiotemporal analysis of ecological vulnerability and management in the Tarim River Basin, China. Sci. Total Environ. 2019, 649, 876–888. [Google Scholar] [CrossRef]
  72. Creamer, R.E.; Hannula, S.E.; Leeuwen, J.P.V.; Stone, D.; Rutgers, M.; Schmelz, R.M.; de Ruiter, P.C.; Hendriksen, N.B.; Bolger, T.; Bouffaud, M.L.; et al. Ecological network analysis reveals the inter-connection between soil biodiversity and ecosystem function as affected by land use across Europe. Appl. Soil Ecol. 2016, 97, 112–124. [Google Scholar] [CrossRef]
Figure 1. Schematic representation of the overall methodological workflow.
Sustainability 15 14092 g001
Figure 2. Geographical position and LULC (2020) within the investigated region.
Sustainability 15 14092 g002
Figure 3. (a) Proportions of area and (b) rates of change for different types of desert riparian ecosystems within the TRB.
Sustainability 15 14092 g003
Figure 4. Direction of changes in different ecosystem types in desert riparian areas of TRB: (a) 1990–2000; (b) 2000–2005; (c) 2005–2010; (d) 2010–2015; (e) 2015–2020; (f) 1990–2020. Thicker arrows indicate more area converted.
Sustainability 15 14092 g004
Figure 5. (a) Single ecosystem structure and (b) single ecosystem change of each desert riparian ecosystem type in the Tarim River Basin in 1990–2020. (c) Comprehensive ecosystem structure and ecosystem change of desert riparian ecosystem in the Tarim River Basin in 1990–2020.
Sustainability 15 14092 g005
Figure 6. Conversion of different ecosystem structure levels during (a) 1990–2000, (b) 2000–2005, (c) 2005–2010, (d) 2010–2015, (e) 2015–2020, and (f) 1990–2020.
Sustainability 15 14092 g006
Figure 7. Regression coefficients of mean annual temperature (°C) (MAT); mean warmest month temperature (°C) (MWMT); relative humidity in September, October, and November (%) (RH_SON); and annual heat–moisture index ((MAT+10)/(MAP/1000)) (AHM) with ecosystem structure index (ESI) based on the GWR model during 1990–2020. Numbers and circles denote areas where the ESI is more affected by climate factors. The size of the circle is not indicative of the value of the regression coefficient.
Sustainability 15 14092 g007
Table 1. Rivers in the Tarim River Basin included in this study.
Tarim River Basin
Tarim RiverKeriya River
Kongque RiverNiya River
Kashgar RiverCheerchen River
Yarkand RiverPishan River
Hotan RiverSmall rivers at the northern foothills of the Kunlun Mountains
Table 2. Indicator system for ecological system structure assessment.
Criterion Layer (Weight)Indicator LayerWeightsProperty
Ecosystem structureEcosystem area proportion0.164Positive
Patch number0.175Positive
Average patch size0.172Positive
Edge density0.296Negative
Connectivity Index0.193Positive
Table 3. Ecological system pattern classification.
IndicatorGrading Standards
EC123
ES123
DCArtificial–naturalArtificial–artificial, natural–naturalNatural–artificial
ESIImprovement areaStability areaDegradation area
Disclaimer/Publisher’s Note: The statements, opinions and data contained in all publications are solely those of the individual author(s) and contributor(s) and not of MDPI and/or the editor(s). MDPI and/or the editor(s) disclaim responsibility for any injury to people or property resulting from any ideas, methods, instructions or products referred to in the content.

