Article

Invisible Frost Stress on Introduced Dalbergia odorifera: A Bioassay on Foliar Parameters in Seedlings from Six Provenances

1
Wenzhou Key Laboratory of Resource Plant Innovation and Utilization, Zhejiang Institute of Subtropical Crops, Zhejiang Academy of Agricultural Sciences, Wenzhou 325005, China
2
Research Institute of Tropical Forestry, Chinese Academy of Forestry, Guangzhou 510520, China
*
Author to whom correspondence should be addressed.
Sustainability 2023, 15(19), 14097; https://doi.org/10.3390/su151914097
Submission received: 13 August 2023 / Revised: 3 September 2023 / Accepted: 11 September 2023 / Published: 23 September 2023
(This article belongs to the Special Issue Forest Operations and Sustainability)

Abstract

:
Valuable trees are frequently taken from their original habitat and introduced to a different location in the pursuit of better economic development. Global climate change imposes a higher probability of warm spells during chilly seasons; these may increase the threat posed by frost to newly introduced, valuable species. In this study, Dalbergia odorifera was cultured as a valuable tree species that was introduced from an original provenance in Sanya (1° N) to the northern mountains in Pingxiang (22° N), Guangzhou (23° N), Zhangpu (24° N), Xianyou (25° N), and up to the northernmost limit in Wenzhou (28° N). Seedlings of these six provenances were tested in a field study conducted in Wenzhou (control) to examine their resistance to local frost stress and to detect the driving forces related to meteorological factors in the winter–spring period of 2015–2016. The leaves sampled over seven days exhibited the typical characteristics of frost impairment. The daily maximum temperature delivered warm spells, increasing by ~7 °C. The daily minimum temperature (−4.3 to −2.0 °C) did not reach freezing point until the early spring of 2016. The controlled seedlings showed lower malondialdehyde content than those from the southern locations, and no mortality occurred. Invisible frost stress was caused by low nitrogen utilization during the earlier stages during warm spells, as well as damage to membrane integrity during the later stage when the minimum temperature suddenly declined. A warm spell was found to impose a negative driving force five days before a sudden chill, which led to frost having an impact on superoxide accumulation and electrical leakage. We conclude that the D. odorifera seedlings that dwell effectively in Wenzhou obtained stronger resistance to local frost stress than those from the southern locations. Low cell membrane integrity and high electrical leakage in leaf cells accounted for the frost damage.

1. Introduction

The results have been contradictory concerning the characterization of the effect of frost risk on forest phenology and sustainability. Certain findings have illustrated that trends with reduced frequency and intensity in frost events can offset some of the negative effects of a sudden chill on forest plants [1,2]. This argument has mainly been supported via modeling with past data and via predictions according to the monitored changes. However, it has also been argued that climate warming has increased frost risks for forest plants due to the advanced phenology and aggravated impairment of organs during dehardening [3,4,5]. This risk has been predicted to exist with continuous warming at an expected probability as high as 20% in a thoroughly projected period that runs up to 2090 [6]. The frost risk mainly threatens the buds of dormant plants by advancing bud burst, and this occurs during warm spells in the early spring or late winter [7,8,9]. These pieces of evidence have mostly been obtained from studies on temperate forests, but particularly rare instances can be referred to in investigations of forests subjected to subtropical and tropical climates.
Forest trees acclimating to a warm climate are not fully dormant in chilly seasons, at least not to the same degree as in the induced dormancy when hardening, as is found in trees subjected to a temperate climate [10]. In neotropical forests, it has been revealed that the incursions of Arctic cold waves may cause mild frost at subtropical latitudes [11]. Frost stresses affecting tropical forests are increasing following the processes induced by the collapsing Arctic cryosphere [12]. However, in lowland tropical forests, cold waves trigger extensive tree mortality because of heavier cold air masses moving downhill in advective frosts [11,13]. Although a general study revealed that woody plants do not always show apparent frost-damaged symptoms in tropical climates [14], in savannas, both trees and shrubs exhibit large-scale diebacks following severe cold waves [15,16]. Therefore, the threat of forest stress may be a provenance-dependent phenomenon for tropical forests, which can be supported by a mosaic forest–grassland pattern (which are dominated by plants of different provenances that follow frost along low tree lines [17]). Theoretically, trees originating from low-latitude locations can dwell in a new habitat with chillier temperatures, but they could still encounter a scenario where there is the possibility of suffering from frost attack due to exposure to a cold-wave invasion. Information is still limited regarding the provenance-specific effects of frost stress on subtropical and tropical forest trees.
Differences that are large enough to activate essential botanical variations in plants of contrasting provenances are mostly shown in two locations over a distance across latitudes [18,19]. The transfer of a planting location changes the corresponding plant’s acclimation and adaption to local frost stress [11,13]. Climate warming increases the risk of exposure to frost due to an advanced phenology in a warm spell and less of a hardening dormancy immediately following a sudden chill. A microclimate near a city can further strengthen the frost risk posed to non-endemic dwellers from other locations due to the heat island effect (HIE) [20,21]. The socioeconomic dimensions of a host city account for the magnitude of the HIE [22], which may also be a promotor of frost risk for local forest plants. Therefore, cities with varied socioeconomic states should be a source of variation in the frost risks for forests that have economically valuable plants introduced from other locations. Furthermore, montane regions near cities that are located in a vast range across latitudes can be an ideal set of regions for testing the provenance-specific responses of introduced plants.
Frost damage in montane plants is mainly quantified through the phenological data collected from field observations [8,23,24,25], near-surface remote sensing [1,7,8,26], digital photograph monitoring [27], radial growth measurements [28,29,30,31,32], and field sampling and chemical analysis [3,33]. These studies provide references across a vast geographical range of the forest stratosphere, but the results are still limited by a failure to explain physiological changes in the process of impairment that is caused by frost damage. More needs to be uncovered about the provenance-dependent responses of specific physiological variables [3,33] that are used to assess plant growth and development in response to the threat of a cold spell [34]. To the best of our knowledge, the well-demonstrated parameters of forest trees subjected to late spring frosts have mainly been reported to be the non-structural carbohydrate metabolism and cell electrolyte leakage [3,33]. More physiological parameters need to be investigated to reveal their responses to cold resistance against a frost threat.
Dalbergia odorifera T. Chen is a leguminous species from the family Fabaceae that is endemic to the tropical montane areas of China. The wood of this species is of high economic value for uses in furniture and folk medicine [35]. In 2012, the average international price of Dalbergia timber ranged from USD 16,575 to USD 49,656 per m3, which was evaluated to be higher in comparison with the temporally local prices of this timber’s use in Indonesia (which ranged from USD 1412 to USD 2500 per m3 [36]). The annual demand for raw D. odorifera heartwood is over 300 tons, and the annual production value exceeds USD 700 million [37]. The high demand for wood resources has rendered its natural reserves vulnerable under criteria A1d [38]. Therefore, this species is frequently introduced northward from its original location to achieve high economic profits through timber trades. Cultural practices have been studied to improve the adaptation of D. odorifera stocks introduced from southern locations to the local freezing that occurs in northern mountains [39,40,41]. However, there are still uncertainties surrounding the mechanism of the physiological responses of trees with southern provenances to the local frost shock that occurs in northern regions. A winter chilly wave may cause severe damage to non-endemic D. odorifera, but the differences in physiological responses across different provenances has rarely been documented.
In this study, D. odorifera stocks from six locations were targeted as the study objects. One provenance was the stock’s original habitat in Hainan, and the other five were introduced to the northern mountains up to the northern location at Wenzhou (which is the most developed region and can enlarge the value of its development to a higher level than that of any of the southern locations). However, Wenzhou is also a place that has experienced several freezing events in recent years, and its local D. odorifera has been reported to show symptoms of frostbite, although its mortality rates were not obvious. An over-year winter–spring episode was investigated in relation to foliar physiology in order to examine responses to combined temperature across provenances. The locations of the provenances tested in this study were adapted from montane fields near cities with highly varied socioeconomic states and HIEs. Our objective was to reveal the invisible mechanism of frost stress on D. odorifera specimens, which were introduced from southern provinces using foliar parameters in Wenzhou. Our study exhibits significant novelty in that it is the first to reveal the meteorological mechanism that accounts for the frost stress on D. odorifera when using foliar parameters. We hypothesized that northern provenances would show better adaptation to subtropical frost shock than southern provenances.

2. Materials and Methods

2.1. Subsection

Seedlings from six D. odorifera provenances were chosen as the study materials in this study. The plantation established in Jianfengling National Forest Park (18°41′ N, 108°46′ E), Sanya city, Hainan province, China, was characterized as having an original provenance. The second plantation was established in Pingxiang city (22°07′ N, 106°53′ E), Guangxi province, China, through introducing seedlings transferred from the first plantation. The third plantation was established by introducing seedlings to Guangzhou city (23°12′ N, 113°23′ E), Guangdong province, China. The fourth and fifth plantations were established by introducing seedlings to Zhangpu city (24°07′ N, 117°37′ E) and Xianyou city (25°22′ N, 118°41′ E), Fujian province, China, respectively. The sixth plantation was our objective control, and it was established by introducing stocks from all the abovementioned provenances to a northern mountain near Wenzhou city (28°00′ N, 120°37′ E), Zhejiang province, China. Seedlings introduced to Wenzhou have established themselves to the local conditions and dwell in a local edaphic environment, but certain individuals still suffer from frost stresses and show degraded symptoms following chilly seasons. The geographical distributions of the six plantations are shown in Figure 1. All plantations were located in montane areas belonging to the municipal lands of host cities, of which the socioeconomic conditions are shown in Table 1. Overall, the provenances in Hainan and Guangxi have tropical monsoon climates, and those in Guangdong, Fujian, and Zhejiang are located in a subtropical maritime monsoon climate. All regional climates were largely controlled by the monsoon, which resulted in a general common temperature fluctuation during a winter–spring cross-year episode.
In March of 2015, a total of 1200 D. odorifera seedlings—where every 200 seedlings collected had a different provenance, meaning that all six provenances were represented (Figure 1)—were transplanted to a forest nursery in Wenzhou. Then, 100 seedlings were chosen from one provenance to frame their initial growing states to an even extent, and a total of 600 seedlings were selected from six provenances. The criteria for screening the chosen seedlings were the growing morphologies of height in a 50–80 cm range and their root-collar diameter (RCD) in a 0.5–0.8 cm range (Figure 2). These screening criteria were established according to the general growth state for most seedlings. Seedlings of all six provenances were mixed together and planted in three plots at a spacing of 1.0 m × 1.5 m. For every provenance, a total of 100 seedlings were randomly distributed to three groups, and each group contained about 33 of them. Three groups of seedlings were planted to three different plots, which were taken as three replicated blocks for the seedlings from a specific provenance. Every individual seedling was labeled using a hanging tag to mark its provenance and to show whether it was used for sampling. Six individual seedlings were randomly selected for one provenance per site and assigned as six sampling objectives, and it was these results that were averaged for the plot.

2.2. Sampling Dates

The experimental duration lasted from 1 September 2015 to 31 January 2016. Sampling dates were determined by synthesizing the data of real-time forecasting meteorological factor changes and summarizing the recent temperature fluctuations. Every date for sampling was chosen as a day on which frost is likely occur in one of immediately following days.
According to previous studies on forest trees that were subjected to a late spring frost in Europe [7,8,23,32], frost damage becomes more harmful when there is an earlier advanced warming spell that is followed by a sudden decline in the daily temperature. We employed the theoretical model put forth by Gu et al. [42] and Augspurger [43] to describe these factors. In their model, they determined that the initial (as early as the occurrence of no budburst during a deep hardening phase) temperature was elevated in advance by a warming spell for about 3–5 days; thereafter, the temperature suddenly declined to a freezing level and persisted for 1–2 days. All fluctuations repeated 2–3 times until frost damage became visible on the newly growing organs and tissues. It is unreasonable to expect temperature decline to be lower than freezing in subtropical and tropical climates as frequently as in a temperate climate. Therefore, we referred to the pattern of dynamic temperature fluctuations that accounted for frost events recorded to most likely happen in temperate forests [7,8,27,43]. Therefore, the leaves were sampled on days that fit with the following rules:
(1)
At least 5 days remained before leaf sampling was to take place, with an expectation of a dual occurrence of advanced warming and a sudden temperature decline.
(2)
The last 1–2 days prior to sampling had to be accompanied by sharp declines in both the lowest and highest daily temperatures, and this had to happen before the occurrence of a frost.
(3)
A sampling day had to immediately follow a decline in the highest daily temperature, which was also the day with the lowest daily temperature in the most recent 5 days.
(4)
Any day that did not have characteristics of temperature fluctuation following any of rules (1)–(3) could not be chosen for foliar sampling.
As a result, seven days were chosen for sampling because they obeyed all of the abovementioned rules (Figure 3). These days were 15 September, 1 November, 11 November, 27 November, and 18 December in 2015, and 9 January and 25 January in 2016. The same-day meteorological conditions are also shown for the sampling days.

2.3. Sampling and Chemical Analysis

In one plot, six labeled seedlings were used for leaf sampling as a bulk per provenance, and three bulked averages were taken as three replicated values from three repeated blocks. At the same time, in the first sampling, all of the seedlings had experienced a growing season of about six months, and this was recognized as a sufficient time for new leaves to grow. Fresh new leaves were sampled since they were especially vulnerable to frost shocks [4,27]. At each sampling, ten fresh leaves were collected from the twigs and branches that were fully exposed to sunlight. This eliminated the possibility that wilted leaves were fully accounted for by a frost shock, but not by a response to low-light stress. The sampled leaves all looked healthy, without any of the symptoms that appear when leaves are attacked by insects. The leaves were excised and transported to the laboratory on ice (0–2 °C).
Photosynthetic pigments were assessed by determining the chlorophyll-a and -b and carotenoid contents using a method adapted from Hiscox and Israelstam [44] with minor modifications. The leaves were approximately 0.05 g in weight, and they were cut to pieces and immersed in a tube with 2.5 mL of dimethyl sulfoxide. The tubes were heated at 65 °C for 1 h in a water bath under dark conditions for 1 h. Chlorophyll-a and -b contents were measured using a spectrophotometer (UV-Visible 8453, gilent Tech. Inc., Santa Clara, CA, USA) at 663 nm and 645 nm, respectively. The carotenoid content was estimated using the equations of Lichenthaler and Wellburn [45].
Soluble sugar content, soluble protein content, peroxidase (POD) activity, and malondialdehyde (MDA) content were measured using methods adapted from Liu et al. [46]. A leaf sample of around 0.1 g in weight was heated in a hot water bath for 30 min, and this was centrifuged at 5000 rpm and measured for soluble sugar content via a spectrophotometer at 490 nm. For the assays of soluble protein content and POD activity, another 0.1 g sample was ground in a mortar with liquid nitrogen as the freezing reagent. This was then moved to a tube, which was placed in an ice bath, and 1 mL of a mixture of ice-cold sodium phosphate buffer solution (50 mmol L−1, pH = 7.0) and 2% polyvinylpyrrolidone was added. The homogenate was kept in ice for 1 min and centrifuged at 5000 rpm (4 °C) for 10 min, after which all of the supernatant was collected. The soluble protein was measured using the Coomassie Brilliant Blue staining method [47]. The POD activity was assayed using a classical method adapted from Ryu and Dordick [48]. To assay the MDA content, a 0.5 g leaf sample was mixed with 5 mL of 10% trichloroacetic acid and centrifuged at 5000 rpm for 10 min. The supernatant was mixed with 2 mL of 0.67% thiobartituric acid, heated in a boiling water bath for 30 min, cooled down to room temperature, centrifuged at 5000 rpm, and detected for absorbances at 450 (A450), 532 (A532), and 600 (A600). Therefore, the MDA content (CMDA) could be calculated using the following equation:
C M D A = 6.452 × A 532 A 600 0.559 × A 450
Freezing-impaired cell leakage was assayed using electrical conductance (EC), which was performed according to a method used by Wang et al. [3]. Fresh leaves were cut into segments approximately 5 mm in length, which were then placed in a capped tube (10 mL volume) with 5 mL of distilled water. This treatment was assigned as C1. Another 10 mL tube was filled with 5 mL of distilled water and assigned as the control of B1. All C1 and B1 tubes were placed in the dark for 24 h to enable a full electrolyte leakage at a natural rate for water; they were then measured for their levels of EC. Thereafter, C1- and B1-labeled tubes were heated in an oven at 90 °C for 2 h, cooled down to room temperature, and then kept in the dark for 24 h; following this, they were measured for EC and labeled as post-stress treatments C2 and B2, respectively. Finally, the EC gauge for freezing injury can be calculated as follows [49,50]:
E C = L C C 1 L C B 1 L C C 2 L C B 2 × 100 %
where LCC1, LCB1, LCC2, and LCB2 are the leakage conductance values for the labeled samples C1, B1, C2, and B2, respectively.

2.4. Statistical Analysis

All data passed tests of normality and variance homogeneity; hence, no transformation was needed. SAS software (ver. 9.4, SAS Inst. Inc., Cary, NY, USA) was used for the data analysis. Analysis of variance (ANOVA) was used with a mixed model to detect the differences for every leaf parameter among the provenances on seven repeated measuring days [51]. When a significant difference was detected (p < 0.05) in a specific sampling day, the results were arranged and compared between the provenances with a Tukey test. Meteorological variables were extracted for every sampling day as the daily maximum temperature five days prior to the sampling day and the daily minimum temperature three days prior to the sampling day, as well as according to the rainfall, wind velocity, and RH on the sampling day. These meteorological factors were pooled as independent variables and used to test the contributions to every leaf parameter via multivariable linear regression models.

3. Results

3.1. Photosynthetic Pigments

Repeated variations in the different provenances had significant effects on the contents of chlorophyll-a, chlorophyll-b, and carotenoids (Table 2). The chlorophyll-a content in the Wenzhou sample was no different from that in Sanya for most sampling days except for 72 (Figure 4(A3)) and 109 days after the experiment began (Figure 4(A5)). On both days, the seedlings from Wenzhou had higher chlorophyll-a content than those from the Sanya sample. The chlorophyll-a content in the seedlings from Wenzhou was not different from that in the two samples of Zhangpu and Xianyou in Fujian for most sampling days. The chlorophyll-a content in the Guangzhou sample was lower than that for the northern provenances for the initial two sampling days (Figure 4(A1,A2)), but this increased to be higher than that in the Sanya and Pingxiang samples on the last sampling day (Figure 4(A7)).
The chlorophyll-b content was no different between the Wenzhou and Sanya provenances for all sampling days (Figure 4(B1–B7)). Compared to the chlorophyll-b content in the Wenzhou sample, the content in the Guangzhou sample was lower 15 d (Figure 4(B1)) and 62 d post-experiment commencement (Figure 4(B3)), and those in the Pingxiang sample were lower 62 d (Figure 4(B3)), 109 d (Figure 4(B5)), and 131 d (Figure 4(B6)) post-experiment commencement.
Carotenoid content in the Sanya sample was lower than that in the Wenzhou sample 72 d (Figure 4(C3)) and 109 d (Figure 4(C5)) after the experiment began. Carotenoid content in the Guangzhou samples was lower than that in the Wenzhou samples for the early sampling days at 15 d (Figure 4(C1)) and 62 d (Figure 4(C3)) after the experiment began.

3.2. Antioxidant Activity

The foliar MDA content was different among the provenances for most sampling days except for the two days of 27 November 2015 and 9 January 2016 (Table 2). The foliar MDA content was lower in the Sanya sample than in Wenzhou on the sampling day 72 d after the experiment began (Figure 5(A3)), but contrary results occurred 147 d (Figure 5(A7)) after experiment commencement. The foliar MDA content was higher for the Wenzhou provenance than that in the two provenances (Zhangpu and Xianyou) in Fujian on the early sampling days of 15 d (Figure 5(A1)), 62d (Figure 5(A2)) and 72 d (Figure 5(A3)) after experiment commencement. The foliar MDA content in Guangzhou was higher than that in Wenzhou on 109 d (Figure 5(A5)) and 147 d (Figure 5(A7)) after the experiment began.
The foliar POD activity did not differ between the provenances on 1 November and 27 November 2015, with all of the rest being significant on the rest of the sampling days (Table 2). The foliar POD activity did not show significant a difference between the Sanya and Wenzhou provenances (Figure 5(B1–B7)). On the 72nd day after the experiment began, the POD activity in Xianyou was higher than that in Wenzhou (Figure 5(B3)); however, 131 days after commencement, the results were reversed (Figure 5(B6)).

3.3. Soluble Sugar, Protein, and EC

The foliar soluble sugar content was different among the provenances for most sampling days except for 11 and 27 November 2015 (Table 2). On 15 September 2015, the soluble sugar content was higher for the Guangzhou and Zhangpu provenances than for the Wenzhou, Sanya, and Xianyou provenances (Figure 6(A1)). Soluble sugar was higher in all southern provenances, expect for Xianyou, than in Wenzhou on 1 November 2015 (Figure 6(A2)). The degree of soluble sugar did not show any differences among the provenances on 11 (Figure 6(A3)) and 27 November 2015 (Figure 6(A4)). On 18 December 2015, the soluble sugar was higher in the samples from Pingxiang, Zhangpu, and Xianyou than Wenzhou (Figure 6(A5)). On 19 January 2016, the soluble sugar was higher for the Sanya and Pingxiang provenances than for the Wenzhou provenance (Figure 6(A6)). On 25 January 2016, the soluble sugar was lower for Pingxiang and Guangzhou than Wenzhou.
The soluble protein content was significantly different among the provenances for most sampling days except for 27 November 2015 (Table 2). On 15 September 2015, the soluble protein in the Wenzhou provenance samples did not differ from that in the other provenances (Figure 6(B1)). Compared to the samples with a Wenzhou provenance, the Sanya provenance samples had a lower soluble protein content on the 62nd day of the experiment (Figure 6(B2)). Again, the soluble protein did not differ between Wenzhou and the other provenances, but that in the Xianyou samples was higher than in the Sanya and Guangzhou samples (Figure 6(B3)). On 27 November 2015, no difference in the degree of soluble protein was detected among the provenances (Figure 6(B4)). On 18 December 2015, the soluble protein in the Wenzhou samples was lower than that in the Xianyou samples, but it was higher than in the Sanya, Pingxiang, and Zhangpu samples (Figure 6(B5)). The soluble protein in the Wenzhou provenance samples was lower than that in the Guangzhou and Xianyou samples on 9 January 2016 (Figure 6(B6)). On 25 January 2016, the soluble protein in the Wenzhou samples was only higher that in the Guangzhou samples (Figure 6(B7)).
The EC was only different among the provenances on 15 September 2015 (Figure 6C1). The EC was lower in the Wenzhou samples than in most of the other provenances except for Sanya (Figure 6(C2)). On 11 November 2015, the EC in the Wenzhou provenance samples was lower than that in the Sanya, Guangzhou, and Zhangpu provenance samples (Figure 6(C3)). The Guangzhou provenance was unique in exhibiting higher EC than the Wenzhou provenance (Figure 6(C4)). The EC in the Wenzhou samples was lower than that in the Guangzhou, Zhangpu, and Xianyou samples (Figure 6(C5)). The samples with a provenance in Sanya were unique in having a higher EC than the Wenzhou provenance samples on 9 January 2016 (Figure 6(C6)). The EC in the Wenzhou provenance samples was no different from that for the other provenances, except for the samples with provenances in Pingxiang and Guangzhou (Figure 6(C7)).

3.4. Regression of Foliar Parameters against Meteorological Factors

The maximum and minimum daily temperatures on the sampling days (MaxT0 and MinT0, respectively) showed contrasting contributions to the chlorophyll-a and -b contents (Figure 7(A1,A2)). MaxT0 generated positive contributions to two chlorophyll contents, while MinT0 generated a negative. MinT0 also showed a negative contribution to the carotenoid content with a positive contribution from the maximum daily temperature five days prior to sampling (MaxT5) (Figure 7(A3)).
Again, MaxT0 generated a positive contribution to soluble sugar content, while the minimum daily temperature one day prior to sampling (MinT1) generated a negative contribution (Figure 7(B1)). MinT1 also made a negative contribution to soluble protein content with a positive contribution from RH (Figure 7(B2)). The minimum daily temperature two days prior to sampling (MintT2) made a negative contribution to the EC, while the maximum daily temperature three days prior to sampling (MaxT3) made a positive contribution (Figure 7(B3)).
MaxT2 and MaxT5 made negative and positive contributions to MDA, respectively (Figure 7(C1)). In contrast, MaxT2 made a positive contribution to POD with another positive contribution from MinT0, and there were also two negative contributions from the maximum daily temperature four days prior to sampling (MaxT4) and MinT1 (Figure 7(C2)).

3.5. Analyses of the Meteorological Driving Forces Generating Frost

In a synthesis of all the abovementioned results, the highest and lowest daily temperatures were the most significant meteorological factors that affected frost resistance five days prior to sampling (Figure 8). The highest daily temperature resulted in up-regulations of MDA content and electronical conductance five and three days prior to sampling, respectively, both of which were characterized to be symptoms of the negative effects of temperature fluctuation on frost resistance. However, four days prior to sampling, the highest daily temperature induced a decline in POD activity, and this was characterized as having a positive effect on frost resistance. In contrast, two days prior to sampling, POD activity increased by the daily highest temperature in synchronization with a decline in the MDA content, and these were together characterized as a positive effect on frost resistance. On the same day, the daily lowest temperature also induced a positive effect due to the decline of EC. One day before sampling, the daily highest temperature lost its effect on frost resistance, but the daily lowest temperature resulted in a strong negative effect because of a collection of decreases in soluble sugar content, protein content, and POD activity. On the sampling day, the contents of chlorophyll-a, chlorophyll-b, and soluble sugars were all increased in response to the highest daily temperature, which together suggested a positive effect on frost resistance. In contrast, the daily lowest temperature on the sampling days resulted in a negative effect due to triple decreases in chlorophyll-a, chlorophyll-b, and carotenoid contents, as well as an increase in POD activity (Figure 8).

4. Discussion

4.1. Characterization of Frost Impairment

The plant physiological symptoms of newly growing organs that were employed in the trees of temperate forests were determined [26,42] and screened for the frost-responsive period in order to determine the seven days for sampling (as they were expected to cause frost impairments). The late spring frost used to be reported as a failure of spring due to it generating large-scale greening hiatuses [26,52]. This was expected to be linked with an episode of frequent frost events in the latter stages of the days in our study in spring 2016. This period included days with a minimum temperature that was lower than the freezing point, which can cause frost impairment, i.e., this was the last sampling day on 25 January 2016, which is when the MDA was the only parameter that responded to the provenance variation. Seedlings of southern provenances in Sanya and Guangzhou showed higher MDA levels than those in the local location in Wenzhou. When facing freezing stress, the MDA can be up-regulated as a response to the interruption of cell membrane integrity [53,54]. However, the responsive change in MDA did not synchronize with any of the symptoms of visible frost injuries that were reported in birch (Betula pendula) [55] and Norwegian spruce (Picea abies) trees [56]. Therefore, it can be surmised that, when exposed to a freezing event in a sub-tropical latitude, seedlings of southern tropical provenances may suffer frost stress that damages their cell membranes. The null responses of the EC suggested that no frost-induced cell damage was so severe as to cause leakage. The null responses for the POD activity also suggested no scavenging mechanism was activated. Overall, we can attribute the abovementioned changes of a natural decline of cell membrane integrity in the leaves of the southern seedlings to a local freezing event in Wenzhou, specifically, one that was not destructive enough to cause any physiological damage following frost stress.

4.2. Invisible Effect of Frost on the Leaves of the Southern Seedlings

Again, we do not challenge the idea that the effect of frost on trees at subtropical and tropical latitudes can be invisible. This realization partially resulted from the awareness of the side-effect of elevation on the magnitude of frost-induced mortality in neotropical forests [11,13]. We also referred to an observation made regarding landscape tree species in a temperate urban forest where frost occurred, but the damage was invisible [3]. In the period before 147 post-transplant days had passed, none of the records of the daily minimum temperature reached freezing point, but some of the leaf parameters still showed significant responses to provenance variation. The EC is a widely measured physiological parameter that changes in conjunction with the magnitudes of visible injuries of frost on tree plants [49]. Although reactive oxygen species (ROS) are also a widely used parameter for assessing stressed plants that have been subjected to frost, it has also been reported to generate rare effects on D. odorifera [57]. However, it was found that the chilled D. odorifera seedlings showed significant responses in terms of MDA content [58,59] and POD activity [59].
Compared to the EC in Wenzhou, the EC in the Pingxiang, Guangzhou, Zhangpu, and Xianyou samples were all higher on the 62nd post-transplant day. The soluble sugar content was mostly higher, but the soluble protein was mostly lower in these four provenances on the same day. This means that the starch was hydrolyzed by the frost stress to the sugars, which can fuel enzyme activity to counter chilly stress [60]. However, the amount of N used as the protein was insufficient. On that day, the higher contents of chlorophyll-a, chlorophyll-b, and carotenoids in the Zhangpu and Xianyou samples suggested that N made a greater contribution to the syntheses of the photosynthetic pigments. Accordingly, the POD activity did not differ between the provenances, and the MDA was lower or unchanged in the four southern provenances. Together, these findings support the idea that the N used for enzymes was not affected at this time because the membrane integrity was not also affected. On the 72nd post-transplant day, the EC was higher in the samples from Sanya, Guangzhou, and Zhangpu than in those from Wenzhou. The seedlings from these three southern provenances were also found to fall in a state with lower MDA, chlorophyll-a, and carotenoid contents, which together suggest a negative effect of frost on photosynthetic pigment synthesis, but better cell membrane integrity. The EC in the Guangzhou provenance samples was higher than in Wenzhou on both day 88 and day 109 after the transplant, which was in accordance with the membrane damage on the 109th day after transplant. Overall, we consider the samples from Guangzhou to have resulted in the most fragile invisible response to frost stress, and this resulted from low N utilization in the earlier stages, which was replaced by damage to membrane integrity in the latter stages.

4.3. Invisible Frost Effect on Leaves of Southern Seedlings

Although we monitored the changes not only in temperature, but also in other meteorological factors, the regression models indicated that it was only extreme daily temperature fluctuations that accounted for the major frost effect. The invisible frost effect was determined to be significant from the fifth day before sampling. Although the daily highest temperature can promote the synthesis and accumulation of carotenoids five days before sampling, it can also cause cell membrane damage throughout wintertime, which is followed by electrical leakage two days thereafter. Five of the days were also reported to be a critical time for late spring frost, before which the first instance of the highest daily temperature broke the record in the temperate forests [42,43]. Thus, trees experiencing acclimation to chilly temperatures are deeply dormant, and they need a warm spell to trigger the physiological responses that are needed for the process of dehardening. However, high temperatures on the second day before sampling can have a positive effect, which originates from the scavenging of superoxides. This effect continues to the next day, and the acclimation to chills increases. In contrast, the decline in the daily minimum temperature on the sampling day exhausts the continuous accumulation of positive effects, thus generating the frost effect. Overall, the effect of frost on subtropical and tropical trees also depends on warming in advance, which is followed by a sudden decline in the daily temperature. Local trees can acclimate to an earlier warming five to two days before the occurrence of frost injury, but this acclimation will be interrupted by the accumulation of superoxides on cell membranes if a sudden chill arrives.

4.4. Limits of This Study

Our study has three limits that have not been overcome. First, the meteorological models of the threat caused by late spring frosts in temperate forests were used in this study to investigate the possible effects of wintertime frosts on tropical and subtropical trees. Frost events were established by comparing the temperature fluctuations between the current monitoring year and those in the past 30–80 years [8,23,31,43]. These models were regressed depending on long historical meteorological records. However, in this study, we did not document and use the chronicles of the meteorological records for the past few years. A long-term series of data should be used in future works for tree species dwellings in southern habitats. Second, we focused on an introduced species, D. odorifera, which have obtained the ability to acclimate to wintertime frost. Certain other species that are sensitive to local temperature fluctuations, and which experience rare records of introduction, would be a better choice, at least as the reference. Finally, the provenance of Wenzhou is not a place with harsh winter temperatures for subtropical plants. Some of the more northern regions should be tested in future works to examine a chillier environment in relation to the frost effect.

5. Conclusions

Based on the findings of this study, we conclude that the Dalbergia odorifera introduced from southern provenances can acclimate to frost stress in northern areas such as Wenzhou. However, the seedlings from the Wenzhou area exhibit higher resistance to frost than those with tropical provenances. A period of frost imposed freezing stress a total of five times, and these frosts started with an abnormal increase in the highest daily temperature. These frost events damaged cell membrane integrity and imposed frost damage on the plants’ cytoplasm and photosynthetic capacity through a sudden decline in the lowest daily temperature. We recommend that further work makes use of our design and the layout of the experiment, but with deeper explanations that use data from the gene expressions of key enzymes.

Author Contributions

Conceptualization, X.L. (Xiaowen Li) and Q.C.; methodology, Q.C.; software, X.L. (Xiaowen Li); validation, X.L. (Xiaowen Li); formal analysis, S.Y. and X.L. (Xiaowen Li); investigation, S.Y., X.L. (Xiaowen Li), and J.W. and X.L. (Xiaojin Liu); resources, X.L. (Xiaowen Li) and Y.L.; data curation, Y.L. and H.X.; writing—original draft preparation, X.L. (Xiaowen Li); writing—review and editing, Q.C.; visualization, X.L. (Xiaowen Li) and H.X.; supervision, Q.C.; project administration, X.L. (Xiaojin Liu) and Q.C.; funding acquisition, Q.C. All authors have read and agreed to the published version of the manuscript.

Funding

This study was financially supported by the Department of Science and Technology of Zhejiang (Key Scientific and Technological Grant for Breeding New Agricultural Varieties, grant number: 2021C02070-9) and the Guangdong Forestry Bureau (Innovation Project of Forestry Science and Technology, grant number: 2020KJCX007).

Institutional Review Board Statement

Not applicable.

Informed Consent Statement

Not applicable.

Data Availability Statement

Not applicable.

Acknowledgments

The authors thank the editors and reviewers for their contributions to the current form of this manuscript.

Conflicts of Interest

The authors declare no conflict of interest.

References

  1. Tao, Z.X.; Xu, Y.J.; Ge, Q.S.; Dai, J.H.; Wang, H.J. Reduced frost hardiness in temperate woody species due to climate warming: A model-based analysis. Clim. Chang. 2021, 165, 35. [Google Scholar] [CrossRef]
  2. He, Z.; Du, J.; Chen, L.; Zhu, X.; Lin, P.; Zhao, M.; Fang, S. Impacts of recent climate extremes on spring phenology in arid-mountain ecosystems in China. Agric. For. Meteorol. 2018, 260, 31–40. [Google Scholar] [CrossRef]
  3. Wang, X.; Meng, L.; Wei, H. Biomass, carbohydrate, and leakage conductance in buds of six ornamental tree species subjected to a “false spring” in Northeast China. Ann. For. Res. 2022, 65, 15–30. [Google Scholar] [CrossRef]
  4. Vitasse, Y.; Schneider, L.; Rixen, C.; Christen, D.; Rebetez, M. Increase in the risk of exposure of forest and fruit trees to spring frosts at higher elevations in Switzerland over the last four decades. Agric. For. Meteorol. 2018, 248, 60–69. [Google Scholar] [CrossRef]
  5. Vitra, A.; Lenz, A.; Vitasse, Y. Frost hardening and dehardening potential in temperate trees from winter to budburst. New Phytol. 2017, 216, 113–123. [Google Scholar] [CrossRef] [PubMed]
  6. Marquis, B.; Bergeron, Y.; Houle, D.; Leduc, M.; Rossi, S. Variability in frost occurrence under climate change and consequent risk of damage to trees of western Quebec, Canada. Sci. Rep. 2022, 12, 7220. [Google Scholar] [CrossRef] [PubMed]
  7. Nole, A.; Rita, A.; Ferrara, A.M.S.; Borghetti, M. Effects of a large-scale late spring frost on a beech (Fagus sylvatica L.) dominated Mediterranean mountain forest derived from the spatio-temporal variations of NDVI. Ann. For. Sci. 2018, 75, 83. [Google Scholar] [CrossRef]
  8. Hufkens, K.; Friedl, M.A.; Keenan, T.F.; Sonnentag, O.; Bailey, A.; O’Keefe, J.; Richardson, A.D. Ecological impacts of a widespread frost event following early spring leaf-out. Glob. Chang. Biol. 2012, 18, 2365–2377. [Google Scholar] [CrossRef]
  9. Eysteinsson, T.; Karlman, L.; Fries, A.; Martinsson, O.; Skulason, B. Variation in spring and autumn frost tolerance among provenances of Russian larches (Larix Mill.). Scand. J. For. Res. 2009, 24, 100–110. [Google Scholar] [CrossRef]
  10. Sklenar, P.; Jaramillo, R.; Wojtasiak, S.S.; Meneses, R.I.; Muriel, P.; Klimes, A. Thermal tolerance of tropical and temperate alpine plants suggests that ‘mountain passes are not higher in the tropics’. Glob. Ecol. Biogeogr. 2023. [Google Scholar] [CrossRef]
  11. Bojórquez, A.; Álvarez-Yépiz, J.C.; Búrquez, A.; Martínez-Yrízar, A. Understanding and predicting frost-induced tropical tree mortality patterns. Glob. Chang. Biol. 2019, 25, 3817–3828. [Google Scholar] [CrossRef] [PubMed]
  12. Miner, K.R.; D’Andrilli, J.; Mackelprang, R.; Edwards, A.; Malaska, M.J.; Waldrop, M.P.; Miller, C.E. Emergent biogeochemical risks from Arctic permafrost degradation. Nat. Clim. Chang. 2021, 11, 809–819. [Google Scholar] [CrossRef]
  13. Bojórquez, A.; Martínez-Yrízar, A.; Álvarez-Yépiz, J.C. A landscape assessment of frost damage in the northmost Neotropical dry forest. Agric. For. Meteorol. 2021, 308–309, 108562. [Google Scholar] [CrossRef]
  14. Das, A.A.; Ratnam, J. The thermal niche and phylogenetic assembly of evergreen tree metacommunities in a mid-to-upper tropical montane zone. Proc. R. Soc. B-Biol. Sci. 2022, 289, 20220038. [Google Scholar] [CrossRef] [PubMed]
  15. Hoffmann, W.A.; Flake, S.W.; Abreu, R.C.R.; Pilon, N.A.L.; Rossatto, D.R.; Durigan, G. Rare frost events reinforce tropical savanna-forest boundaries. J. Ecol. 2019, 107, 468–477. [Google Scholar] [CrossRef]
  16. Pilon, N.A.L.; Cava, M.G.B.; Hoffmann, W.A.; Abreu, R.C.R.; Rossatto, D.R.; Durigan, G. Effects and response of the Cerrado ground-layer to frost along the canopy cover gradient. Oecologia 2022, 200, 199–207. [Google Scholar] [CrossRef]
  17. Finckh, M.; Wendefeuer, J.; Meller, P. Frost-driven lower treelines in Angola and their implications for tropical forest-grassland mosaics. J. Veg. Sci. 2021, 32, e13084. [Google Scholar] [CrossRef]
  18. Duan, Y.D.; Guo, B.T.; Zhang, L.; Li, J.X.; Li, S.; Zhao, W.B.; Yang, G.; Zhou, S.; Zhou, C.W.; Song, P.H.; et al. Interactive climate-soil forces shape the spatial distribution of foliar N:P stoichiometry in Vaccinium uliginosum planted in agroforests of Northeast China. Front. Ecol. Evol. 2022, 10, 1065680. [Google Scholar] [CrossRef]
  19. Mashizi, A.K.; Sharafatmandrad, M.; Naghavi, S. Ecosystems multiple-use management: An approach based on change in economic, social, and ecological values of plant communities. Int. J. Environ. Sci. Technol. 2022, 19, 3845–3858. [Google Scholar] [CrossRef]
  20. Liao, S.B.; Cai, H.; Tian, P.J.; Zhang, B.B.; Li, Y.P. Combined impacts of the abnormal and urban heat island effect in Guiyang, a typical Karst Mountain City in China. Urban Clim. 2022, 41, 101014. [Google Scholar] [CrossRef]
  21. Xue, J.S.; Zong, L.; Yang, Y.J.; Bi, X.Y.; Zhang, Y.H.; Zhao, M.H. Diurnal and interannual variations of canopy urban heat island (CUHI) effects over a mountain-valley city with a semi-arid climate. Urban Clim. 2023, 48, 101425. [Google Scholar] [CrossRef]
  22. Li, Y.; Sun, Y.W.; Li, J.L.; Gao, C. Socioeconomic drivers of urban heat island effect: Empirical evidence from major Chinese cities. Sustain. Cites Soc. 2020, 63, 102425. [Google Scholar] [CrossRef]
  23. Zohner, C.M.; Mo, L.D.; Renner, S.S.; Svenning, J.C.; Vitasse, Y.; Benito, B.M.; Ordonez, A.; Baumgarten, F.; Bastin, J.F.; Sebald, V.; et al. Late-spring frost risk between 1959 and 2017 decreased in North America but increased in Europe and Asia. Proc. Natl. Acad. Sci. USA 2020, 117, 12192–12200. [Google Scholar] [CrossRef]
  24. Tessier, J.T. Early spring warming may hasten leaf emergence in Erythronium americanum. Am. J. Bot. 2019, 106, 1392–1396. [Google Scholar] [CrossRef] [PubMed]
  25. Wang, Y.F.; Case, B.; Rossi, S.; Dawadi, B.; Liang, E.Y.; Ellison, A.M. Frost controls spring phenology of juvenile Smith fir along elevational gradients on the southeastern Tibetan Plateau. Int. J. Biometeorol. 2019, 63, 963–972. [Google Scholar] [CrossRef] [PubMed]
  26. Bascietto, M.; Bajocco, S.; Mazzenga, F.; Matteucci, G. Assessing spring frost effects on beech forests in Central Apennines from remotely-sensed data. Agric. For. Meteorol. 2018, 248, 240–250. [Google Scholar] [CrossRef]
  27. Menzel, A.; Helm, R.; Zang, C. Patterns of late spring frost leaf damage and recovery in a European beech (Fagus sylvatica L.) stand in south-eastern Germany based on repeated digital photographs. Front. Plant Sci. 2015, 6, 110. [Google Scholar] [CrossRef]
  28. Meiners, S.J.; Presley, G.N. Differential damage of a late frost to Ozark tree species. J. Torrey Bot. Soc. 2015, 142, 12–17. [Google Scholar] [CrossRef]
  29. Principe, A.; van der Maaten, E.; van der Maaten-Theunissen, M.; Struwe, T.; Wilmking, M.; Kreyling, J. Low resistance but high resilience in growth of a major deciduous forest tree (Fagus sylvatica L.) in response to late spring frost in southern Germany. Tree Struct. Func. 2017, 31, 743–751. [Google Scholar] [CrossRef]
  30. Hadad, M.; Tardif, J.C.; Conciatori, F.; Waito, J.; Westwood, A. Climate and atmospheric circulation related to frost-ring formation in Picea mariana trees from the Boreal Plains, interior North America. Weather Clim. Extremes 2020, 29, 100264. [Google Scholar] [CrossRef]
  31. Puchalka, R.; Koprowski, M.; Przybylak, J.; Przybylak, R.; Dabrowski, H.P. Did the late spring frost in 2007 and 2011 affect tree-ring width and earlywood vessel size in Pedunculate oak (Quercus robur) in northern Poland? Int. J. Biometeorol. 2016, 60, 1143–1150. [Google Scholar] [CrossRef] [PubMed]
  32. Vitasse, Y.; Bottero, A.; Cailleret, M.; Bigler, C.; Fonti, P.; Gessler, A.; Levesque, M.; Rohner, B.; Weber, P.; Rigling, A.; et al. Contrasting resistance and resilience to extreme drought and late spring frost in five major European tree species. Glob. Chang. Biol. 2019, 25, 3781–3792. [Google Scholar] [CrossRef] [PubMed]
  33. D’Andrea, E.; Scartazza, A.; Battistelli, A.; Collalti, A.; Proiett, S.; Rezaie, N.; Matteucci, G.; Moscatello, S. Unravelling resilience mechanisms in forests: Role of non-structural carbohydrates in responding to extreme weather events. Tree Physiol. 2021, 41, 1808–1818. [Google Scholar] [CrossRef] [PubMed]
  34. Hauer, R.J.; Wei, H.X.; Koeser, A.K.; Dawson, J.O. Gas Exchange, Water Use Efficiency, and Biomass Partitioning among Geographic Sources of Acer saccharum Subsp. saccharum and Subsp. nigrum Seedlings in Response to Water Stress. Plants 2021, 10, 742. [Google Scholar] [CrossRef]
  35. USDA. “Dalbergia odorifera”. Germplasm Resources Information Network (GRIN). Available online: https://encyclopedia.thefreedictionary.com/Dalbergia+odorifera#cite_note-Furniture-5 (accessed on 11 April 2017).
  36. Atikah, T.D.; Wardani, W.; Surya, D. Population, economic value and the trade of Dalbergia latifolia in Lombok, West Nusa Tenggara, Indonesia. IOP Conf. Ser. Earth Environ. Sci. 2021, 762, 012015. [Google Scholar] [CrossRef]
  37. Cui, Z.; Li, X.; Xu, D.; Yang, Z. Changes in Non-Structural Carbohydrates, Wood Properties and Essential Oil During Chemically-Induced Heartwood Formation in Dalbergia odorifera. Front. Plant Sci. 2020, 11, 1161. [Google Scholar] [CrossRef]
  38. WCMC. Dalbergia odorifera. The IUCN Red List of Threatened Species 1998: e.T32398A9698077. Available online: https://www.iucnredlist.org/species/32398/9698077 (accessed on 21 April 2017).
  39. Li, X.W.; Chen, Q.X.; Lei, H.Q.; Wang, J.W.; Yang, S.; Wei, H.X. Nutrient Uptake and Utilization by Fragrant Rosewood (Dalbergia odorifera) Seedlings Cultured with Oligosaccharide Addition under Different Lighting Spectra. Forests 2018, 9, 29. [Google Scholar] [CrossRef]
  40. Li, X.W.; Gao, Y.; Wei, H.X.; Xia, H.T.; Chen, Q.X. Growth, biomass accumulation and foliar nutrient status in fragrant rosewood (Dalbergia odorifera TC Chen) seedlings cultured with conventional and exponential fertilizations under different photoperiod regimes. Soil Sci. Plant Nutr. 2017, 63, 153–162. [Google Scholar] [CrossRef]
  41. Li, X.W.; Xia, H.T.; Wang, J.W.; Chen, Q.X. Nutrient uptake and assimilation in fragrant rosewood (Dalbergia odorifera TC Chen) seedlings in growing media with un-composted spent mushroom residue. PLoS ONE 2021, 16, e0249534. [Google Scholar]
  42. Gu, L.; Hanson, P.J.; Mac Post, W.; Kaiser, D.P.; Yang, B.; Nemani, R.; Pallardy, S.G.; Meyers, T. The 2007 eastern US spring freezes: Increased cold damage in a warming world? Bioscience 2008, 58, 253–262. [Google Scholar] [CrossRef]
  43. Augspurger, C.K. Spring 2007 warmth and frost: Phenology, damage and refoliation in a temperate deciduous forest. Funct. Ecol. 2009, 23, 1031–1039. [Google Scholar] [CrossRef]
  44. Hiscox, J.D.; Israelstam, G.F. A method for the extraction of chlorophyll from leaf tissue without maceration. Can. J. Bot. 1979, 57, 1332–1334. [Google Scholar] [CrossRef]
  45. Lichenthaler, H.K.; Wellburn, A.R. Determinations of total carotenoids and chlorophylls a and b of leaf extracts in different solvents. Biochem. Soc. Trans. 1983, 11, 591–592. [Google Scholar] [CrossRef]
  46. Liu, X.; Lu, X.; Yang, S.; Liu, Y.; Wang, W.Q.; Wei, X.; Ji, H.J.; Zhang, B.; Xin, W.Z.; Wen, J.X.; et al. Role of exogenous abscisic acid in freezing tolerance of mangrove Kandelia obovata under natural frost condition at near 32 degrees N. BMC Plant Biol. 2022, 22, 593. [Google Scholar] [CrossRef] [PubMed]
  47. Bradford, M.M. Rapid and sensitive method for quantitation of microgram quantitles of protein utilizing principle of protein-dye binding. Anal. Biochem. 1976, 72, 248–254. [Google Scholar] [CrossRef] [PubMed]
  48. Ryu, K.; Dordick, J.S. How do organic solvents affect peroxidase structure and function? Biochemistry 1992, 31, 2588–2598. [Google Scholar] [CrossRef]
  49. L’Hirondelle, S.J.; Simpson, D.G.; Binder, W.D. Overwinter storability of conifer planting stock: Operational testing of fall frost hardiness. New For. 2006, 32, 307–321. [Google Scholar] [CrossRef]
  50. Burr, K.E.; Tinus, R.W.; Wallner, S.J.; King, R.M. Comparison of three cold hardiness tests for conifer seedlings. Tree Physiol. 1990, 6, 351–369. [Google Scholar] [CrossRef]
  51. Wei, H.; Ma, B.; Hauer, R.J.; Liu, C.; Chen, X.; He, X. Relationship between environmental factors and facial expressions of visitors during the urban forest experience. Urban For. Urban Green. 2020, 53, 126699. [Google Scholar] [CrossRef]
  52. Liu, Y.; Meng, G.Y.; Suo, S.F.; Li, D.; Wang, A.M.; Cheng, X.H.; Yang, J. Spring Failure Analysis of Mining Vibrating Screens: Numerical and Experimental Studies. Appl. Sci. 2019, 9, 3224. [Google Scholar] [CrossRef]
  53. Jalili, I.; Ebadi, A.; Askari, M.A.; KalatehJari, S.; Aazami, M.A. Foliar application of putrescine, salicylic acid, and ascorbic acid mitigates frost stress damage in Vitis vinifera cv.’Giziluzum’. BMC Plant Biol. 2023, 23, 135. [Google Scholar] [CrossRef] [PubMed]
  54. Norozi, M.; ValizadehKaji, B.; Karimi, R.; Solgi, M. Potassium and zinc-induced frost tolerance in pistachio flowers is associated with physiological and biochemical changes. Tree Struct. Funct. 2020, 34, 1021–1032. [Google Scholar] [CrossRef]
  55. Prozherina, N.; Freiwald, V.; Rousi, M.; Oksanen, E. Interactive effect of springtime frost and elevated ozone on early growth, foliar injuries and leaf structure of birch (Betula pendula). New Phytol. 2003, 159, 623–636. [Google Scholar] [CrossRef]
  56. Polle, A.; Kroniger, W.; Rennenberg, H. Seasonal fluctuations of ascorbate-related enzymes: Acute and delayed effects of late frost in spring on antioxidative systems in needles of Norway spruce (Picea abies L). Plant Cell Physiol. 1996, 37, 717–725. [Google Scholar] [CrossRef]
  57. Yang, Y.J.; Liu, T.; Zhang, S.B.; Huang, W. Photoinhibition of oxygen-evolving complex and photosystem II at chilling stress in the tropical tree species Dalbergia odorifera. Photosynthetica 2020, 58, 245–252. [Google Scholar] [CrossRef]
  58. Li, Y. Cold-Resistance Analysis and Suitability of Cultivation Areas for Dalbergia Odorifera Seedlings in Southern Zhejiang; Zhejiang A&F University: Lin’an, China, 2021; (In Chinese with English Abstract and Legends). [Google Scholar]
  59. Li, J. Study on Cold Resistance of Different Geographical Provenance of Dalbergia Odorifera Seedlings; Guangxi University: Nanning, China, 2018; (In Chinese with English Abstract and Legends). [Google Scholar]
  60. Wei, H.X.; Guo, P. Carbohydrate metabolism during new root growth in transplanted Larix olgensis seedlings: Post-transplant response to nursery-applied inorganic fertilizer and organic amendment. iFor. Biogeosci. For. 2017, 10, 15–22. [Google Scholar] [CrossRef]
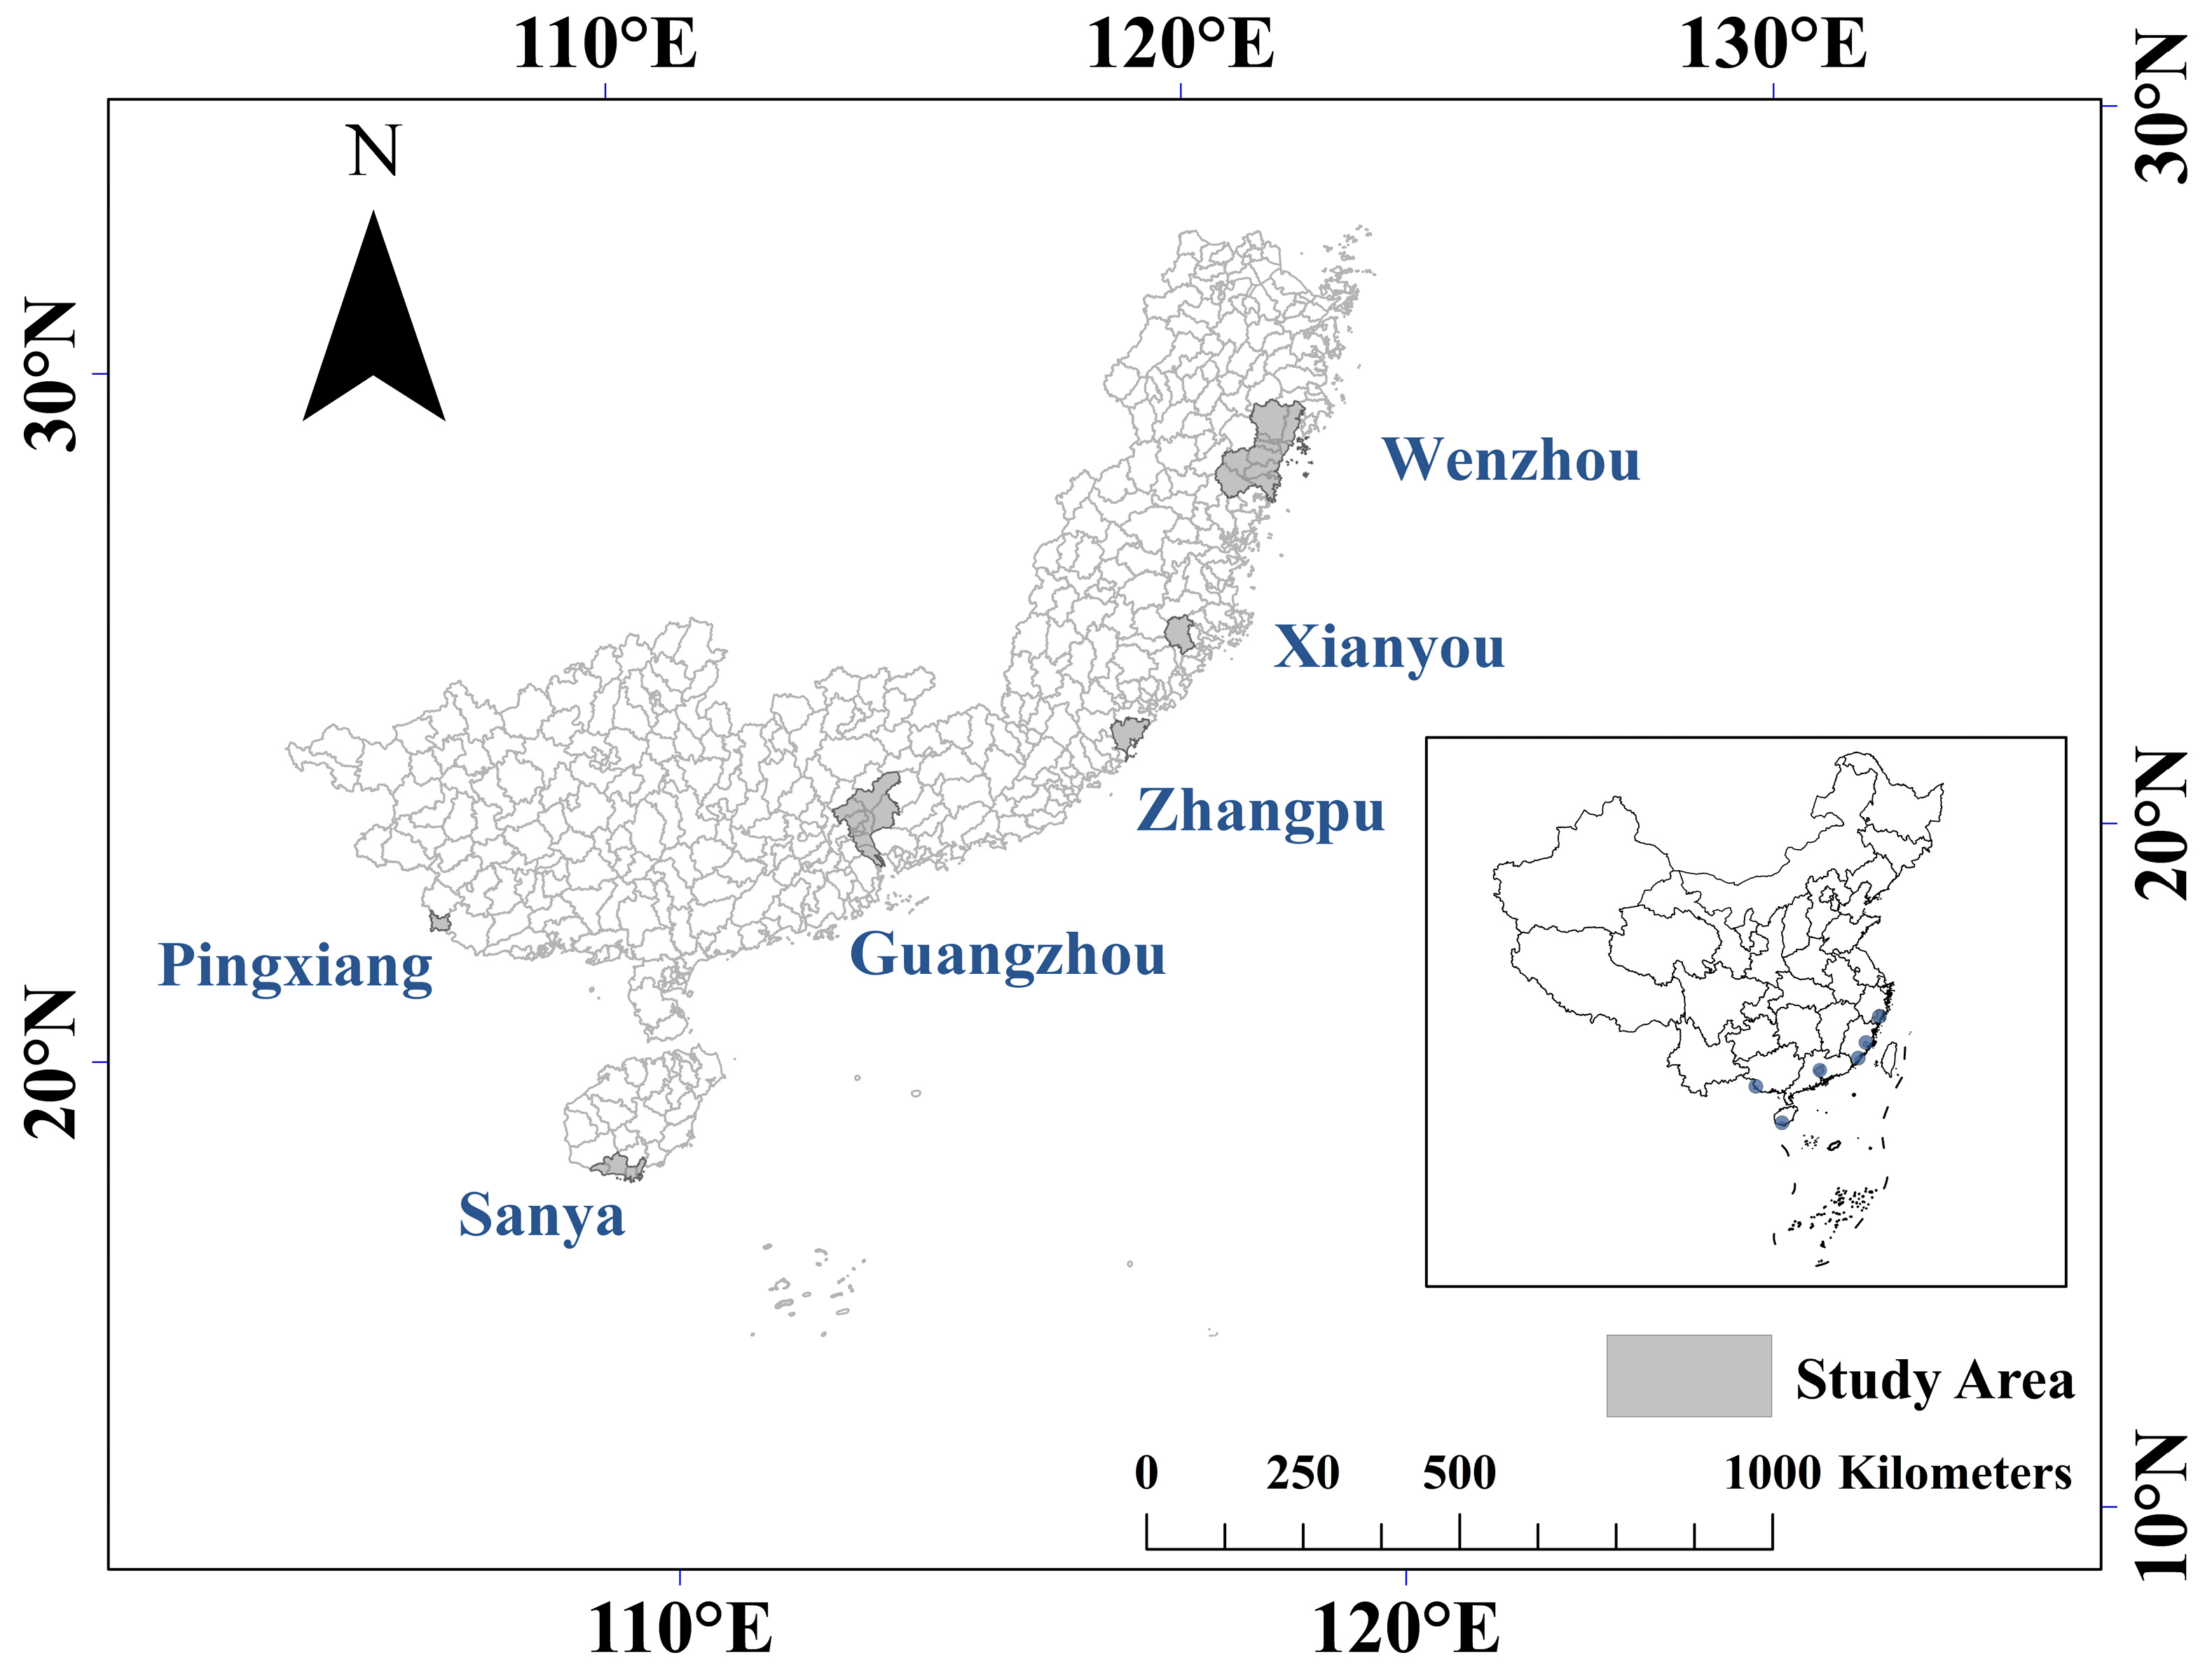
Figure 1. Spatial distribution of the municipal areas of Dalbergia odorifera provenances along latitudes, as well as across subtropical and tropical climates in South China.
Sustainability 15 14097 g001
Figure 2. A typical view of the D. odorifera stocks from the provenances transplanted to Wenzhou in one site, where stocks from all the six provenances were mixed together.
Sustainability 15 14097 g002
Figure 3. Dynamic changes in the meteorological factors (temperature, (A); rainfall, (B); wind velocity, (C); and relative humidity, (D)) in Wenzhou, where the D. odorifera stocks were transplanted from five other locations during the period from 1 September 2015 to 31 January 2016. Specific sampling days are marked in cell A: 15 September (15 d after experimental commencement); 1 November (62 d); 11 November (72 d); 27 November (88 d); and 18 December (109 d) in 2015. In addition, we include 9 January (131 d) and 25 January in 2016 (147 d).
Sustainability 15 14097 g003
Figure 4. Foliar contents of the chlorophyll-a (A1A7), chlorophyll-b (B1B7), and carotenoid (C1C7) contents in the D. odorifera provenances that were subjected to different sampling days across 2015 and 2016. Provenance names: SY, Sanya; PX, Pingxiang; GZ, Guangzhou; ZP, Zhangpu; XY, Xianyou; and WZ, Wenzhou. Different lower-case letters indicate a significant difference between the provenances according to Tukey’s test at the 0.05 level.
Sustainability 15 14097 g004
Figure 5. Foliar malondialdehyde (MDA) content (A1 to A7) and peroxidase (POD) activity (B1 to B7) in the D. odorifera provenances that were subjected to different sampling days across 2015 and 2016. Provenance name: SY, Sanya; PX, Pingxiang; GZ, Guangzhou; ZP, Zhangpu; XY, Xianyou; and WZ, Wenzhou. Different lower-case letters indicate significant differences among the provenances according to Tukey’s test at the 0.05 level.
Sustainability 15 14097 g005
Figure 6. Foliar soluble sugar content (A1 to A7), soluble protein content (B1 to B7), and EC (C1 to C7) in the D. odorifera provenances that were subjected to different sampling days across 2015 and 2016. Provenance name: SY, Sanya; PX, Pingxiang; GZ, Guangzhou; ZP, Zhangpu; XY, Xianyou; and WZ, Wenzhou. Different lower-case letters indicate significant differences among the provenances according to Tukey’s test at the 0.05 level.
Sustainability 15 14097 g006
Figure 7. Multivariate linear regressions of the foliar chlorophyll-a content (A1), chlorophyll-b content (A2), carotenoid content (A3), soluble sugar content (B1), soluble protein content (B2), EC (B3), malondialdehyde (MDA) content (C1), and peroxidase activity (POD) (C2) activity in D. odorifera from the six provenances that were assessed on different sampling days across 2015 and 2016. Investigation days: MaxT0, maximum daily temperature on the sampling day; MaxT1, maximum daily temperature one day prior to sampling; MaxT2, maximum daily temperature two days prior to sampling; MaxT3, maximum daily temperature three days prior to sampling; MaxT4, maximum daily temperature four days prior to sampling; MaxT5, maximum daily temperature five days prior to sampling; MinT0, minimum daily temperature on the sampling day; MinT1, minimum daily temperature one day prior to sampling; MinT2, minimum daily temperature two days prior to sampling; Rain, average daily rainfall on the sampling day; Wind, average daily wind velocity on the sampling day; and RH, relative humidity on the sampling day. Colored dots indicate a parameter that was estimated by the regression model for specific dependent leaf parameters. Error bars mark the standard errors for the dependent variables.
Sustainability 15 14097 g007
Figure 8. A summary of the driving forces from the meteorological factors and their changes in the five days prior to sampling on the responses of leaf parameters in D. odorifera from the six provenances that were assessed on different investigation days across 2015 and 2016. Each cell arranged in a vertical column indicates a day 1–5 days prior to the sampling day. Cells along the supernatant line are colored in claybank and contain the mean effects caused by the following highest daily temperatures; those along the line at the bottom are colored in dark blue and contain the mean effects caused by the following lowest daily temperatures. Upward arrows in thick lines indicate the positive responses that were characterized by changes in leaf parameters. The downward arrows in thick lines indicate the negative responses. Arrows in thin lines indicate the responses of changes in the leaf parameters that were assessed by parameter estimates in the regressed models (Figure 7). An upward thin arrow indicates a positive response in frost-resistant performance; a downward thin arrow indicates a negative response to frost stress. The number of thin arrows indicates the absolute value in magnitude of the regressed parameter estimate: one arrow, the absolute value of the parameter estimate ranging 0–1; two arrows, from 1–10; and three arrows, over 10.
Sustainability 15 14097 g008
Table 1. Socioeconomic conditions of the host prefecture regions where sampling plots of Dalbergia odorifera were placed in regions of South China.
Plot OrderProvinceMunicipalGDP 1 (USD Billion)Industrial Proportion (%)Resident Population (Million)
1st2nd3rd
1HainanSanya43.5813.73 20.54 65.73 0.75
2GuangxiPingxiang5.698.77 28.84 62.39 0.12
3GuangdongGuangzhou1810.041.25 31.64 67.11 13.50
4FujianZhangpu276.7413.40 48.50 38.10 5.00
5FujianXianyou30.979.87 51.34 38.79 1.15
6ZhejiangWenzhou461.812.80 43.80 53.40 8.11
1 GDP, gross domestic product.
Table 2. Parameters (F and p values) from the analysis of variance (ANOVA) of the repeated effects of provenance variation on the foliar parameters in D. odorifera individuals that were subjected to different sampling days across 2015 and 2016.
Source of VariationANOVA 120152016
15 Sep.01 Nov.11 Nov.27 Nov.18 Dec.09 Jan.25 Jan.
  Chla 2F 311.89 421.4917.286.9133.459.995.98
P0.0003<0.0001<0.00010.0030<0.00010.00060.0053
  Chlb 5F11.3319.4113.206.8231.159.005.73
P0.0003<0.00010.00020.0031<0.00010.00090.0063
  CarotenoidF10.2423.3023.407.1537.2312.534.01
P0.0005<0.0001<0.00010.0026<0.00010.00020.0227
  MDA 6F18.813.464.641.663.481.016.89
P<0.00010.03620.01380.21900.03550.45090.0030
  POD 7F3.962.766.821.937.338.294.82
P0.02350.06940.00310.16200.00230.00140.0119
  Sugar F3.7518.482.680.1527.9110.8512.72
P0.0283<0.00010.07490.9762<0.00010.00040.0002
  ProteinF4.3412.545.341.2637.234.626.89
P0.01730.00020.00820.3423<0.00010.01400.0030
  EC 8F1.5224.4650.128.3427.953.563.93
P0.2548<0.0001<0.00010.0013<0.00010.03310.0289
1 ANOVA, analysis of variance; 2 Chla, chlorophyll-a content; 3 F and P values represent ANOVA significance; 4 bold values indicate significant results; 5 Chlb, chlorophyll-b content; 6 MDA, level of malondialdehyde; 7 POD, peroxidase activity; 8 EC, electrical conductance.
Disclaimer/Publisher’s Note: The statements, opinions and data contained in all publications are solely those of the individual author(s) and contributor(s) and not of MDPI and/or the editor(s). MDPI and/or the editor(s) disclaim responsibility for any injury to people or property resulting from any ideas, methods, instructions or products referred to in the content.

