Article

Current and Future Spatial Distribution of the Genus Cinchona in Peru: Opportunities for Conservation in the Face of Climate Change

by
Alex J. Vergara
1,2,
Dennis Cieza-Tarrillo
2,3,
Candy Ocaña
2,
Lenin Quiñonez
2,
Guillermo Idrogo-Vasquez
1,
Lucas D. Muñoz-Astecker
1,
Erick A. Auquiñivin-Silva
1,
Robert J. Cruzalegui
1 and
Carlos I. Arbizu
4,*
1
Instituto de Investigación, Innovación y Desarrollo para el Sector Agrario y Agroindustrial de la Región Amazonas (IIDAA), Universidad Nacional Toribio Rodríguez de Mendoza de Amazonas (UNTRM), Cl. Higos Urco 342, Amazonas 01001, Peru
2
Instituto de Investigación en Ciencia de Datos (INSCID), Universidad Nacional de Jaén (UNJ), Carretera Jaén—San Ignacio KM 24, Cajamarca 06801, Peru
3
Superintendencia Nacional de Servicios de Saneamiento (SUNASS), Av. Bernardo Monteagudo 210–216, Lima 07016, Peru
4
Facultad de Ingeniería y Ciencias Agrarias, Universidad Nacional Toribio Rodríguez de Mendoza de Amazonas (UNTRM), Cl. Higos Urco 342, Amazonas 01001, Peru
*
Author to whom correspondence should be addressed.
Sustainability 2023, 15(19), 14109; https://doi.org/10.3390/su151914109
Submission received: 31 August 2023 / Revised: 19 September 2023 / Accepted: 19 September 2023 / Published: 23 September 2023
(This article belongs to the Section Sustainability, Biodiversity and Conservation)

Abstract

:
The genus Cinchona belongs to the Rubiaceae family and comprises native Peruvian tree species distributed in tropical areas. It is currently endangered due to human disturbance and overexploitation for medicinal, forestry and food uses. To date, the current and future distribution of Cinchona spp. under the climate change scenario is unknown. Here, we modeled the present and future spatial distribution of the genus Cinchona using bioclimatic, edaphic and topographic variables using the maximum entropy algorithm (MaxEnt). The results indicate that 8.08% (103,547.89 km2) and 6.02% (77,163.81 km2) of the surface of Peru possesses areas with high and moderate distribution probabilities, respectively, to host the genus Cinchona, distributed mainly in the departments of Cusco, Amazonas, San Martín and Cajamarca. Furthermore, according to future climate scenarios, the areas of high suitability will increase their extension for the years 2050 and 2070 by 3.65% and 3.9%, respectively. Since Peru seeks to promote the forest sector to be the other force for its development, this study can be considered as a basis for the establishment of priority zones for the conservation, restoration, reforestation and sustainable management of Cinchona spp. species in Peru.

1. Introduction

The genus Cinchona (Rubiaceae) is naturally distributed throughout the tropical Andes. Southern Ecuador and northern Peru possess the greatest species diversity and endemism of Cinchona spp. [1]. Most studies on this genus are mainly focused on biogeography and taxonomy [2] and no studies have been carried out to explore historical changes in Cinchona distribution [3].
“Quina” or “Cascarilla” are the most common names for Cinchona plants whose bark has medicinal properties. Each species has different concentrations of alkaloids [4] and may vary according to locality, altitude, soil type, age of the tree and time of harvest [1,5]. Therefore, the species of the Cinchona genus have been used as an effective medicine against malaria in the 17th century [6] since they possess a component called “quinine” [6]. In Peru, 18 of the 24 species are recorded for this genus [7] and are currently strongly threatened by various anthropogenic activities. Overexploitation for medicinal, constructive and food uses has led to them being considered at risk of extinction, causing concern due to their forestry and civic importance as they represent the richness of the country’s plant resources [7,8].
Although the species of the genus Cinchona are important, there are few studies on its genetic diversity, habitat and potential distribution, as most of the work was focused on the study of the species of this genus at the molecular level for medicinal purposes [9]. Therefore, knowing the distribution of this species, its population trend and the suitability of the environment for the development of its populations are of great importance as it will be possible to propose and develop management plans for its conservation and sustainability. For this it is necessary to have a fundamental understanding of various theories, such as population, and understand the interacting variables [10]. Therefore, it is of great importance to acquire up-to-date tools and methods to help achieve this goal, such as special species distribution models. These are based on the analysis of occurrence records. They are efficient and innovative tools for predicting occurrence and understanding ecological processes that determine habitat preferences [11,12,13].
Models that are employed for species distribution are widely used for many purposes in ecology, conservation biology and biogeography. They are useful tools to address and optimize species management [14] as they rely heavily on bioclimatic variables to predict habitat suitability [15] and use records of the presence of the individuals of the species being modeled. These models are often represented as a process of a spatial point whose intensity is a function of environmental covariates [16,17]. The reliability of these models is obtained by performing the validation stage which consists of contrasting the presence and absence of individuals, based on records. In previous studies where the differential presence of a specific species is compared, “preferred” habitats are determined and favorable areas are predicted [18]. The results of the model provide a useful benchmark of the location and extent of current favorable climatic situations. These correlative relationships can be applied to forecasted climatic conditions to evaluate possible changes in the distribution of species caused by changes in the extent of climatically suitable areas and locations [19,20].
There is enough evidence to indicate that habitat suitability is limited by global warming [21,22,23,24]. Uncertainty about the impact of climate change will inevitably lead to changes in the suitable range of species [14]. Temporally and spatially based models can establish procedures to monitor actions as early warning signals during climate change [25]. Species distribution models such as ENFA (Ecological Niche Factor Analysis), BIOCLIM (Bioclimatic Envelope Algorithm), CART (Classification and Regression Tree), GLM (Generalized Linear Model), GAM (Generalized Additive Models) and MaxEnt (Maximum Entropy) are available and have been widely employed in the fields of biogeography, conservation biology and ecology [2].
The maximum entropy model popularly known as MaxEnt is one of the most widely used models for spatial species distribution modeling. This is a species density estimation and distribution prediction model based on machine learning algorithms using environmental data and species occurrence records. This model is commonly used to analyze species suitability zones, restocking, vulnerable zones and endemic species [8,26,27]. MaxEnt uses climate change scenarios to map future distribution efficiently, achieving a superior performance in model prediction accuracy, especially in many datasets that lack information on species distributions [28,29,30,31]. MaxEnt provides a likely distribution of species subject to certain limitations that represent missing information regarding the distribution of target species. Similarly, it can estimate the distribution of species under changing environmental factors as a function of the training relationship under actual conditions. Therefore, this model evaluates if the species will change its geography as a response to global environmental change by fragmenting ranges, expanding or contracting [14,19,32].
In Peru, several studies have been conducted on the distribution of flora and fauna species using the MaxEnt model. Cotrina Sánchez et al. [33] evaluated the biogeographic distribution of the Cedrela spp. in Peru using MaxEnt modeling with a focus on conservation and restoration. They modeled the distribution of that genus using 947 occurrence records that included 10 species and used 9 edaphic factors, solar radiation, 19 bioclimatic variables, relative humidity, and three topographic factors. They reported that 6.7% of the Peruvian territory presents a high distribution probability of the occurrence of Cedrela spp. They also indicated that 11.65% of distribution covers areas highly prone to degradation, requiring immediate attention for their protection and restoration. In a more recent study, Cárdenas et al. [2] used the MaxEnt model to evaluate the current and future distribution of the Dipteryx spp.(shihuahuaco) under climate change scenarios in the central-eastern Amazon of Peru. They employed 36 bioclimatic, topographic and edaphic variables and predicted how Dipteryx spp. distribution will be affected until 2100, according to climate conditions. The authors depicted that in 2061–2080, for the climate scenario SPP1-2.6, suitable and very suitable habitats represented 30.69% of the Ucayali region and these increased by 1.75% under actual climate conditions. They also reported that the suitable and unsuitable habitats represented about 70% of the total area.
Despite the importance of the genus Cinchona in Peru, there are few scientific studies that focus on elucidating the suitable areas for the species of this genus using high-precision computational models. We are interested in determining if future climate scenarios will affect the spatial distribution of Cinchona spp. in Peru. For this reason, this research was developed with the aim of evaluating the conditions, spaces and temporal spaces and generating the distribution of the genus Cinchona, as well as the current and future potential distribution of its habitat, using data compiled from records of occurrences of the species of the genus previously georeferenced and special information from bioclimatic data (WorldClim 2.1).

2. Materials and Methods
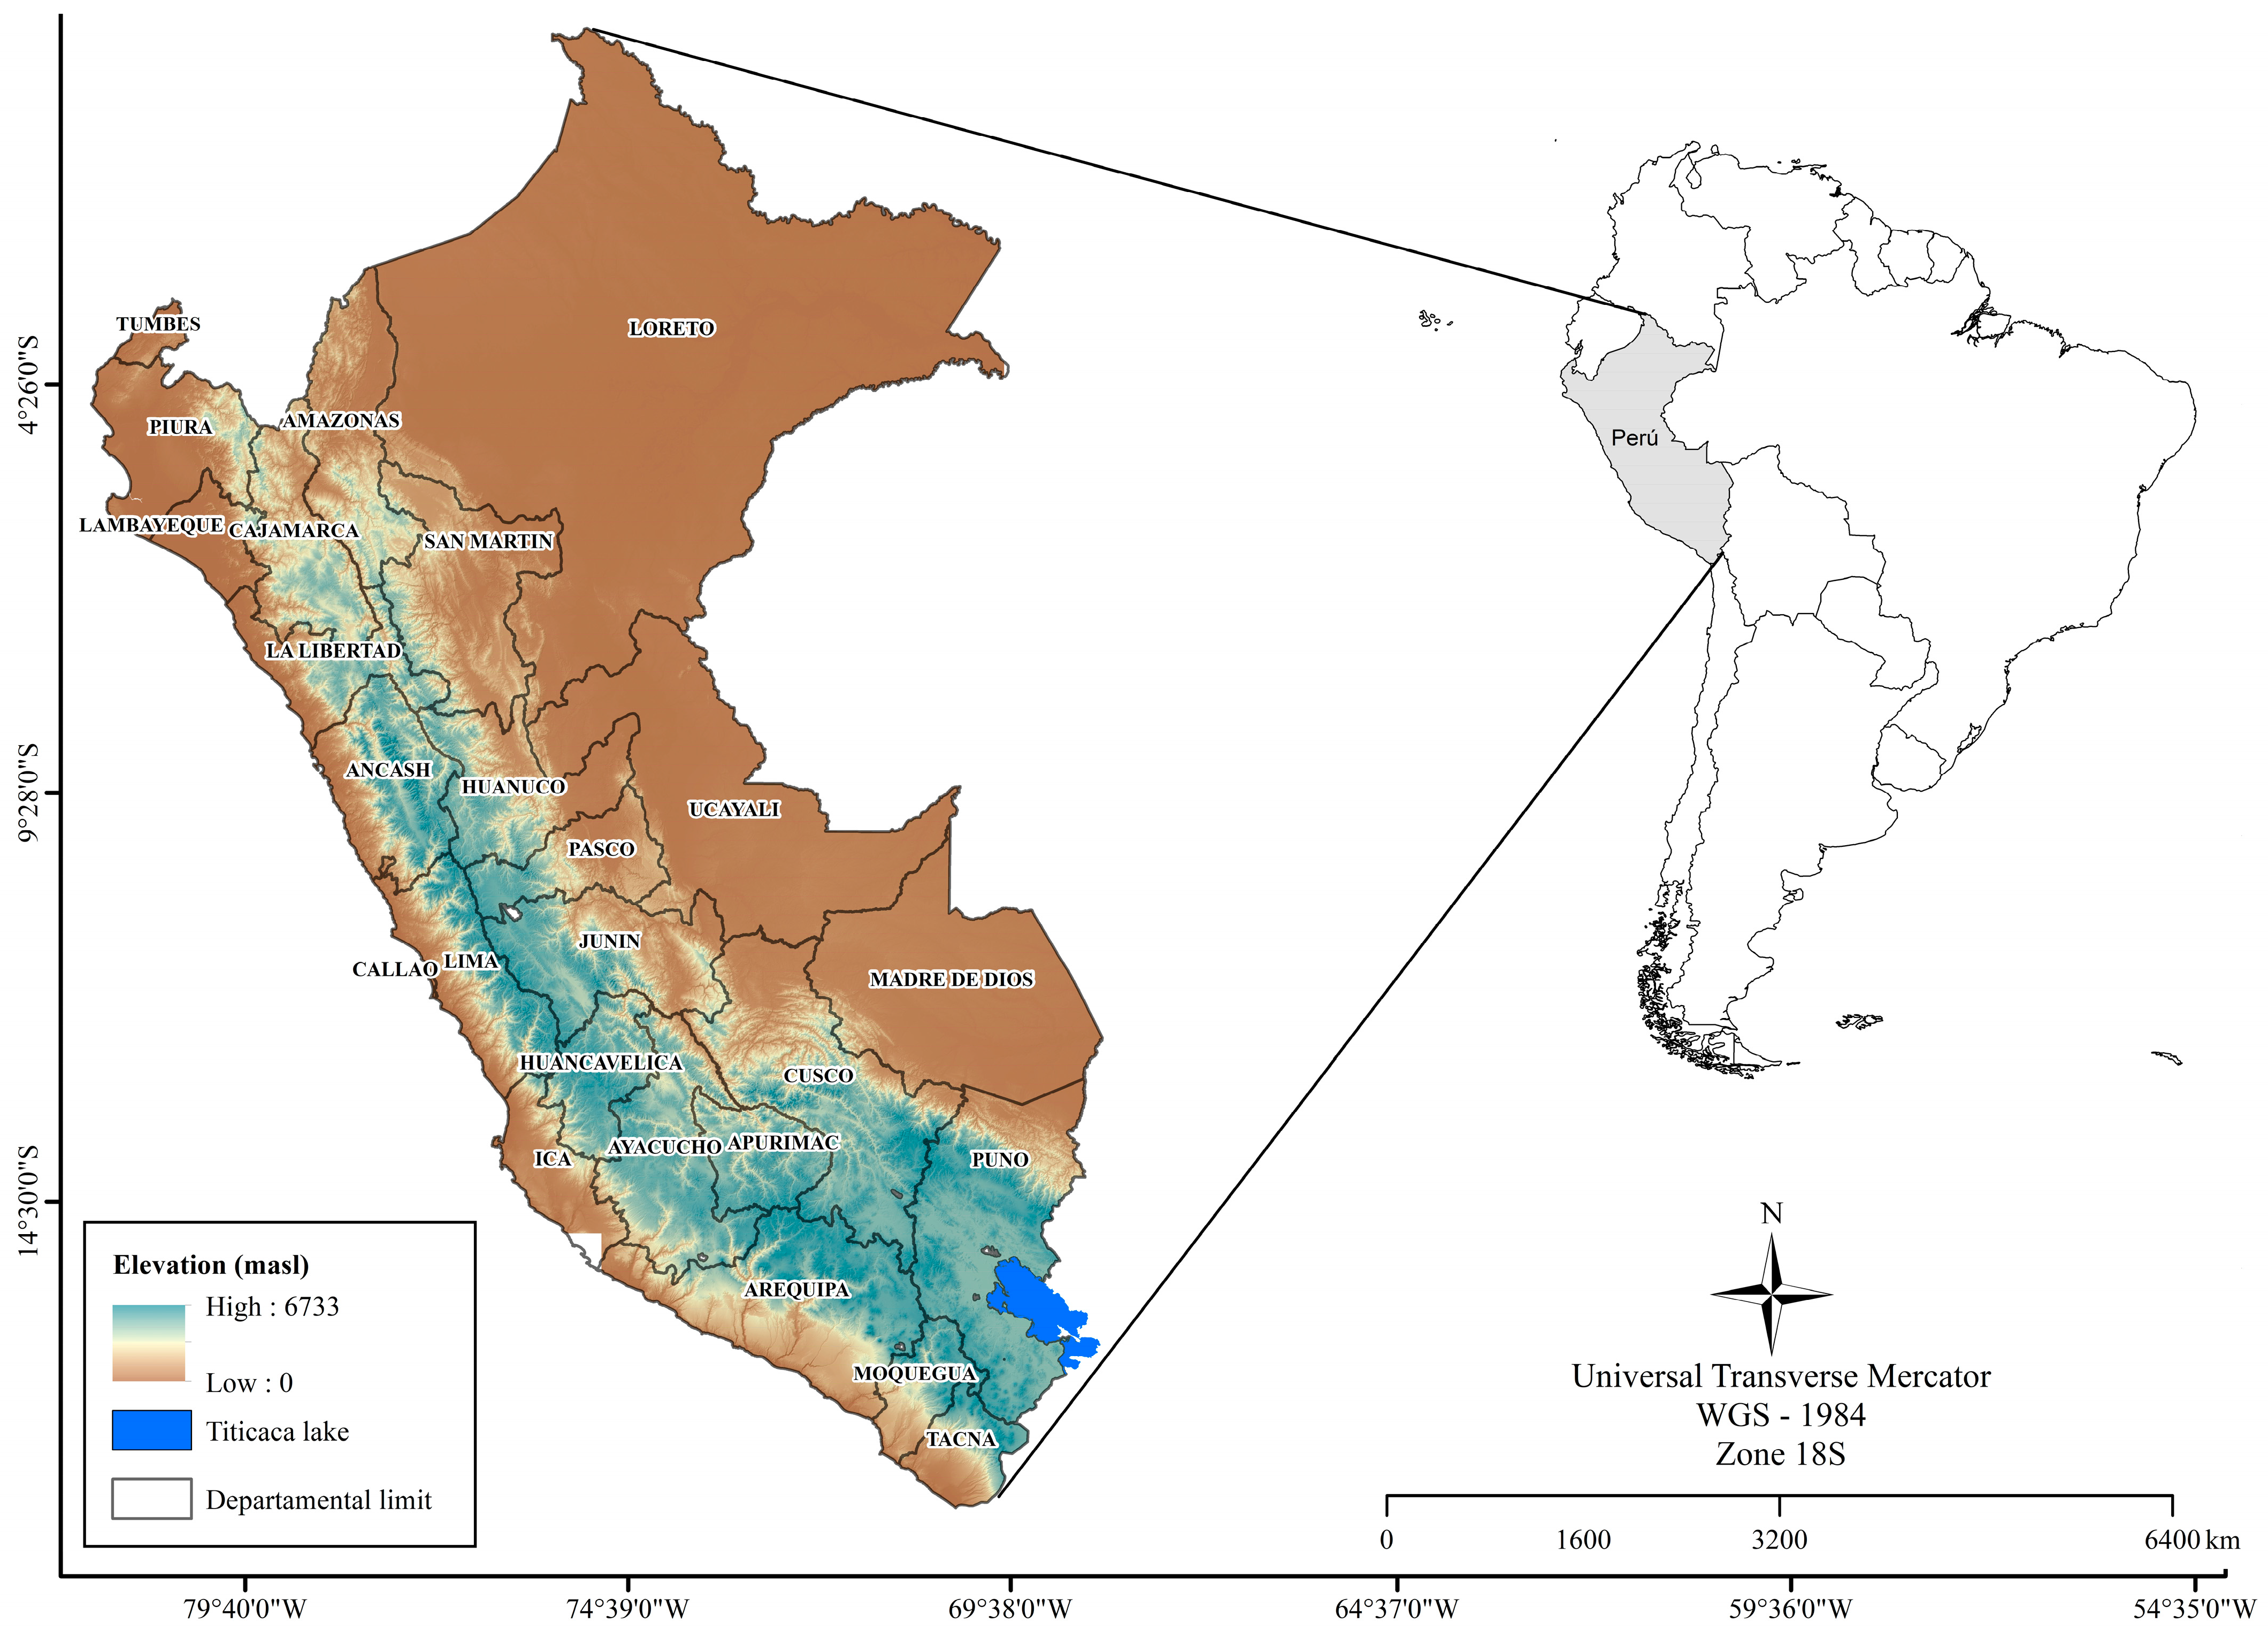
2.1. Study Area

The present study was conducted in Peru. This country is located on the western side of South America, at latitude 0°2′ and 18°21′34″ and longitude 68°39′7″ and 81°20′13″. The territory has a total area of 1,285,215.9 km2 and altitudes ranging from below sea level to 6733 m above sea level (Figure 1). Due to its geographical location, Peru includes a wide variety of climatic zones and presents great ecological diversity [34]. Geographically, Peru is traditionally described in terms of three broad longitudinal regions: (a) the low, arid coast that experiences a subtropical climate in the north (average temperatures of 24 °C) and a wide thermal amplitude in the center and south (average temperatures range from 13 to 26 °C), (b) the Andean highlands with variable altitudes and climates and the eastern lowlands and (c) the Amazon rainforest with tropical climate. Annual rainfall occurs throughout the year in Amazonia and the Andes, although annual rainfall varies in the Andean highlands, depending on geographical features (North, Central and South) [35].

2.2. Database and Processing of the Occurrence of the Genus Cinchona

We collected 567 records of historical occurrences for the genus Cinchona from two data sources: (i) the Global Biodiversity Information Facility (GBIF) platform, available at https://www.gbif.org/, accessed on 16 November 2022; (ii) Web of Science and Scopus database of research publications and citations. Subsequently, duplicate occurrences of data points were filtered out and removed with the same longitude and latitude in a specific spatial resolution area [36,37], yielding 165 occurrence points which were used to build the model.

2.3. Variables and Processing

Twenty-eight (28) variables were used as raster files (Table 1), which were organized into groups of nineteen (19) bioclimatic variables, obtained from the WorldClim 2.1 website (https://www.worldclim.org/, accessed on 27 November 2022) with spatial resolution of 2.5 arcminutes (~21 km2) [38]. Three (03) topographic variables were created as a Digital Elevation Model (DEM) from the Shuttle Radar Topography Mission (SRTM) provided by the United States Geological Survey (USGS) Geodata Portal (http://srtm.usgs.gov, accessed on 1 December 2022). Six (06) edaphic variables were collected from SoilGrids 0.5.3 (http://soilgrids.org, accessed on 18 December 2022) [30]. We standardized all variables to a spatial resolution of 250 m using the bilinear interpolation method [29]. Variables were selected, excluding highly correlated variables, using variables with Pearson matches ≤0.80 [39,40], thus preventing multicollinearity. Variables were processed using QGIS v3.18.3 (https://qgis.org, accessed on 29 December 2022) and R v4.2.1. (http://www.rstudio.com/, accessed on 13 January 2023) (Figure 2).

2.4. Selection of Climate Models for Future Distribution
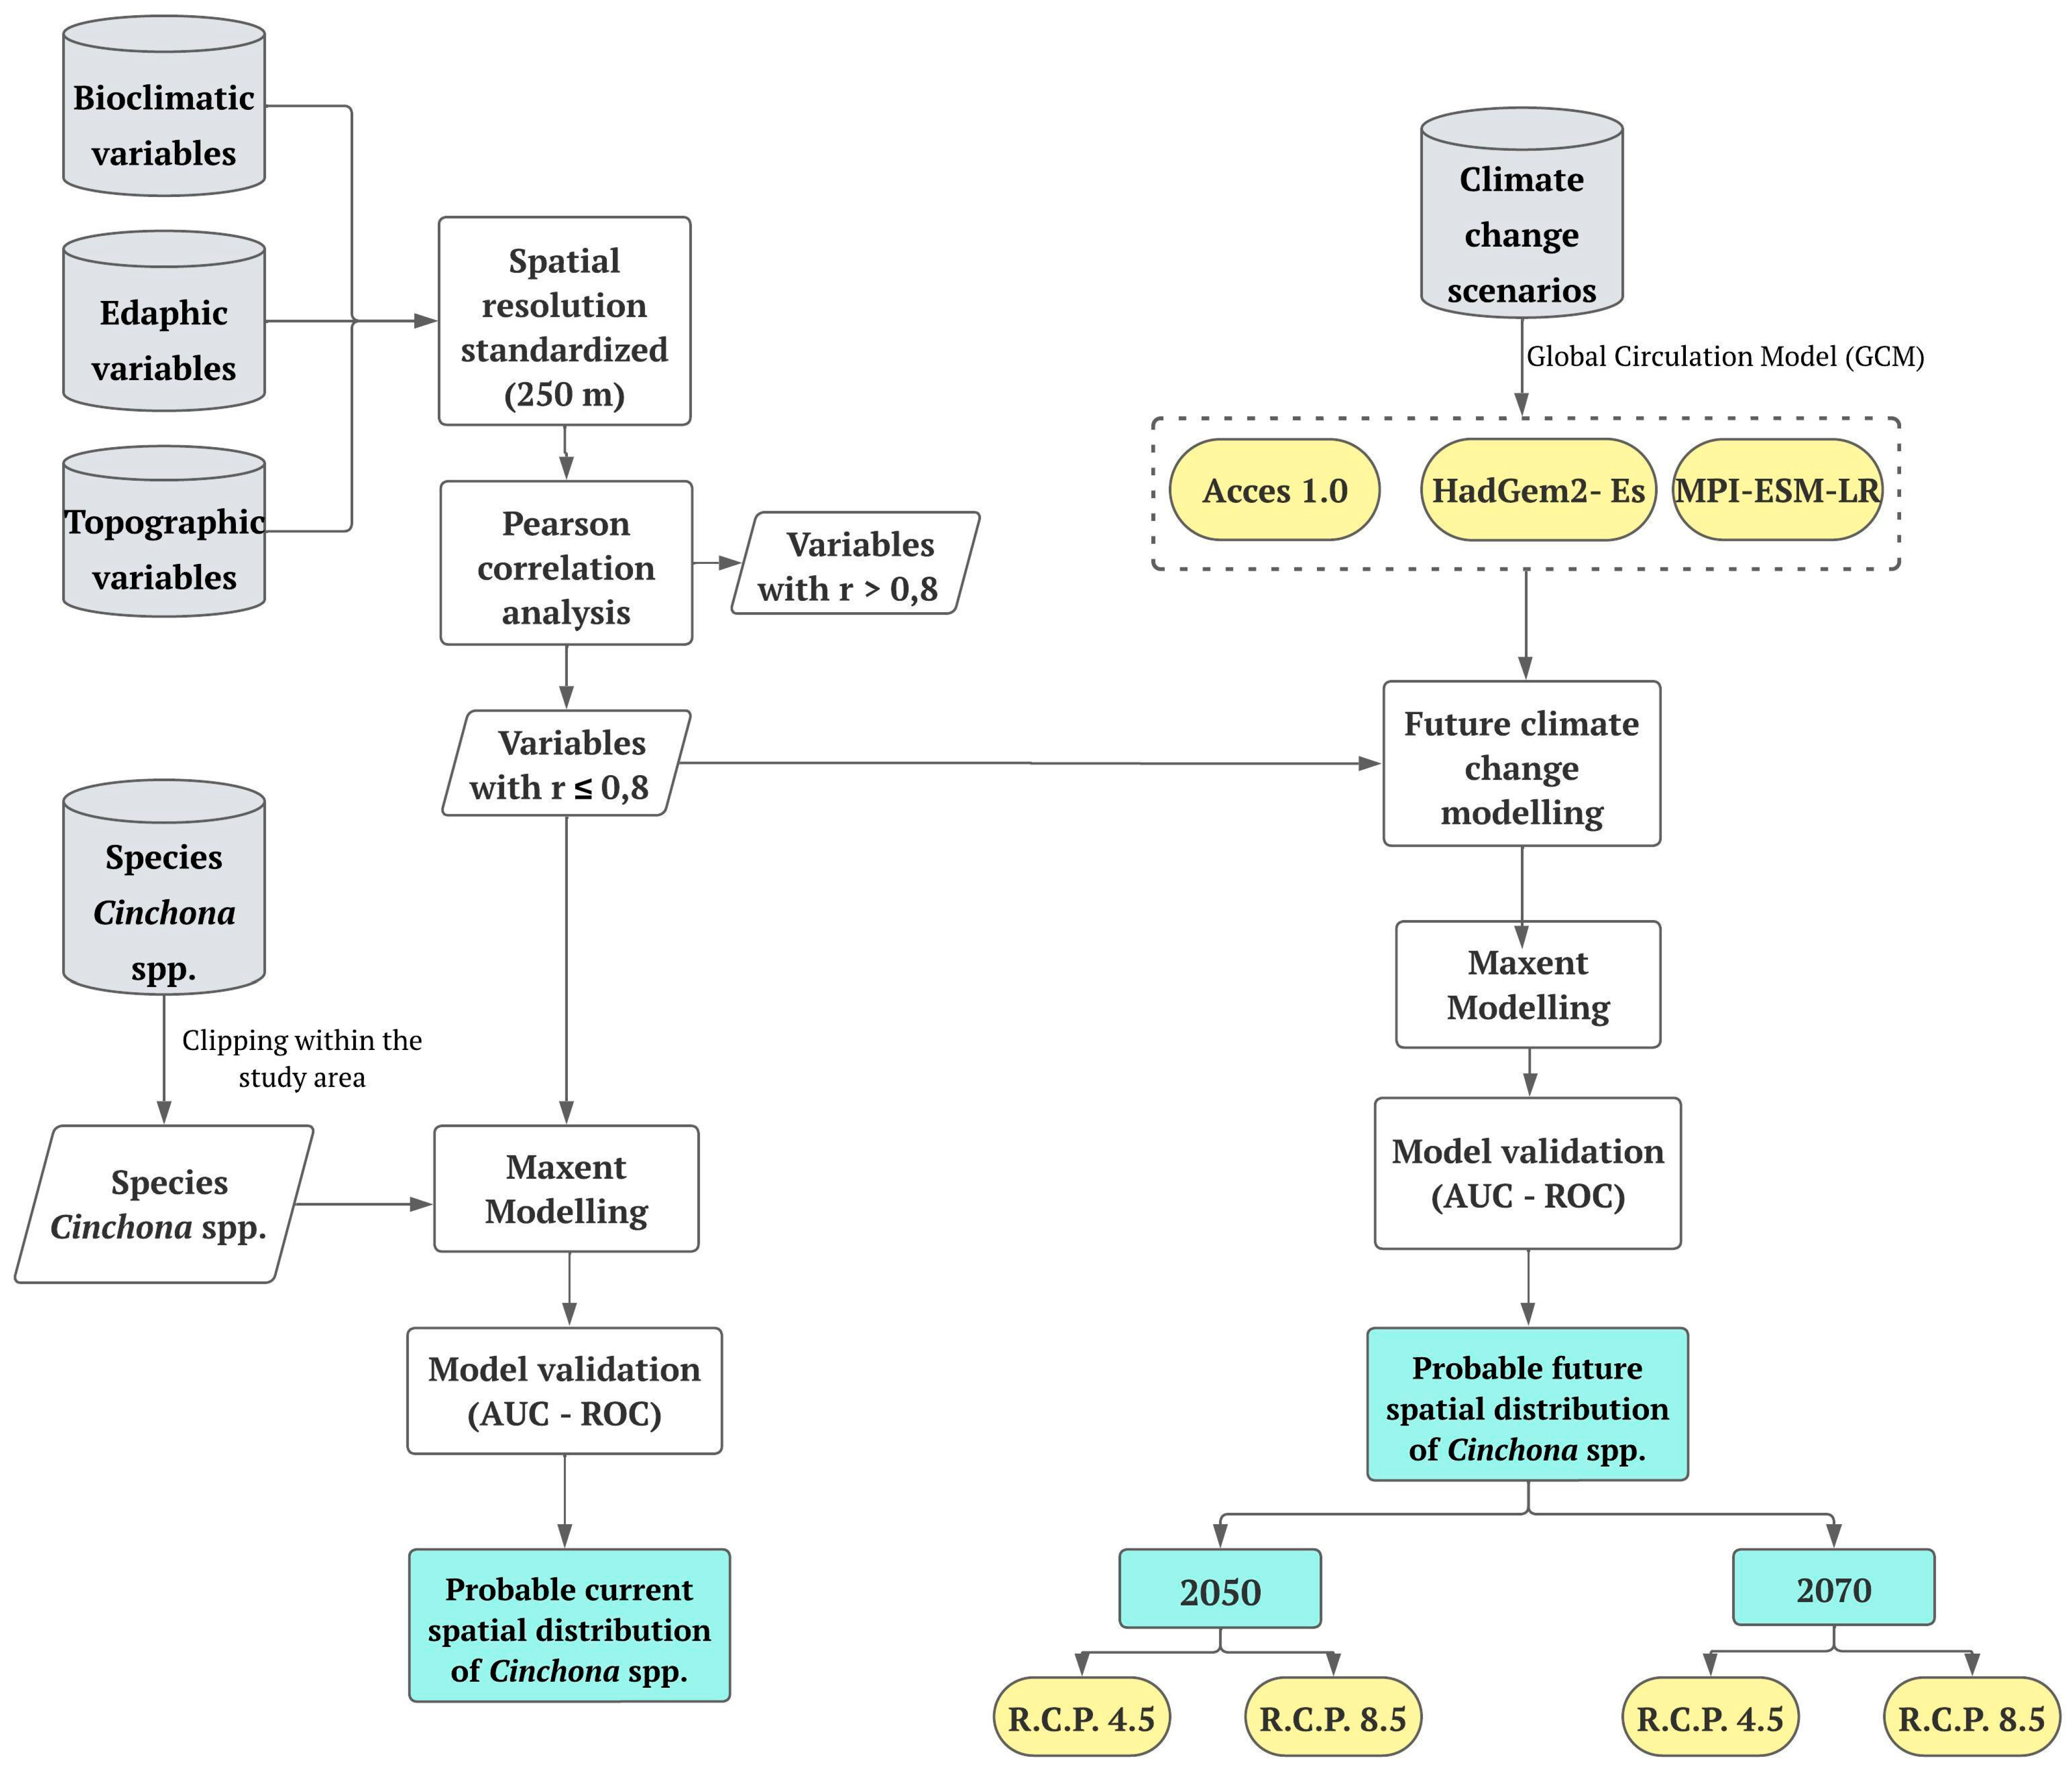
To assess the effect of future climate change on the distribution [41] of the genus Cinchona in Peru, the modeling based on climate change was split for the two future climate periods of 2041–2060 (reference: 2050) and 2061–2080 (reference: 2070), respectively, using the Global Circulation Model (GCM) (Access 1.0, HadGem2-Es, MPI-ESM-LR).

2.5. Modeling

The MaxEnt modeling process was performed using the DISMO package of the R software, where twenty-eight (28) variables were integrated. To validate this model, 50% of the randomly selected presence data were employed as training and 50% for calibration purposes. The model was configured as follows: Random test percentage = 25; regularization multiplier = 1; max.number of background points = 10,000. A total of 10 replicates were considered for simulation and used to estimate mean relative occurrence or fitness probabilities [29]. The modeling output was a raster map with a probability distribution range from 0 to 1; Jenks’ natural cut-off classification method was used to classify the ranges, dividing potential habitat into four (04) levels: unsuitable (0–0.1), low suitability (0.1–0.3), moderate suitability (0.3–0.5) and high suitability (0.5–1.0) [42].

2.6. Mode Evaluation

The model performance was evaluated using the Area Under the ROC Curve (AUCROC) metric [43,44], which is widely used as a performance measure for classification and diagnostic rules [45]. An ROC curve that follows the left axis and the top of the figure represents a model that predicts correctly. On the other hand, an ROC curve that follows the 1:1 line depicts a model that cannot reliably categorize the locations where the species is present and missing [39]. Model performance was divided into five levels according to the AUC value: 0.5–0.6 (poor), 0.6–0.7 (fair), 0.7–0.8 (good), 0.8–0.9 (very good), 0.9–1.0 (excellent) [46,47,48].

3. Results

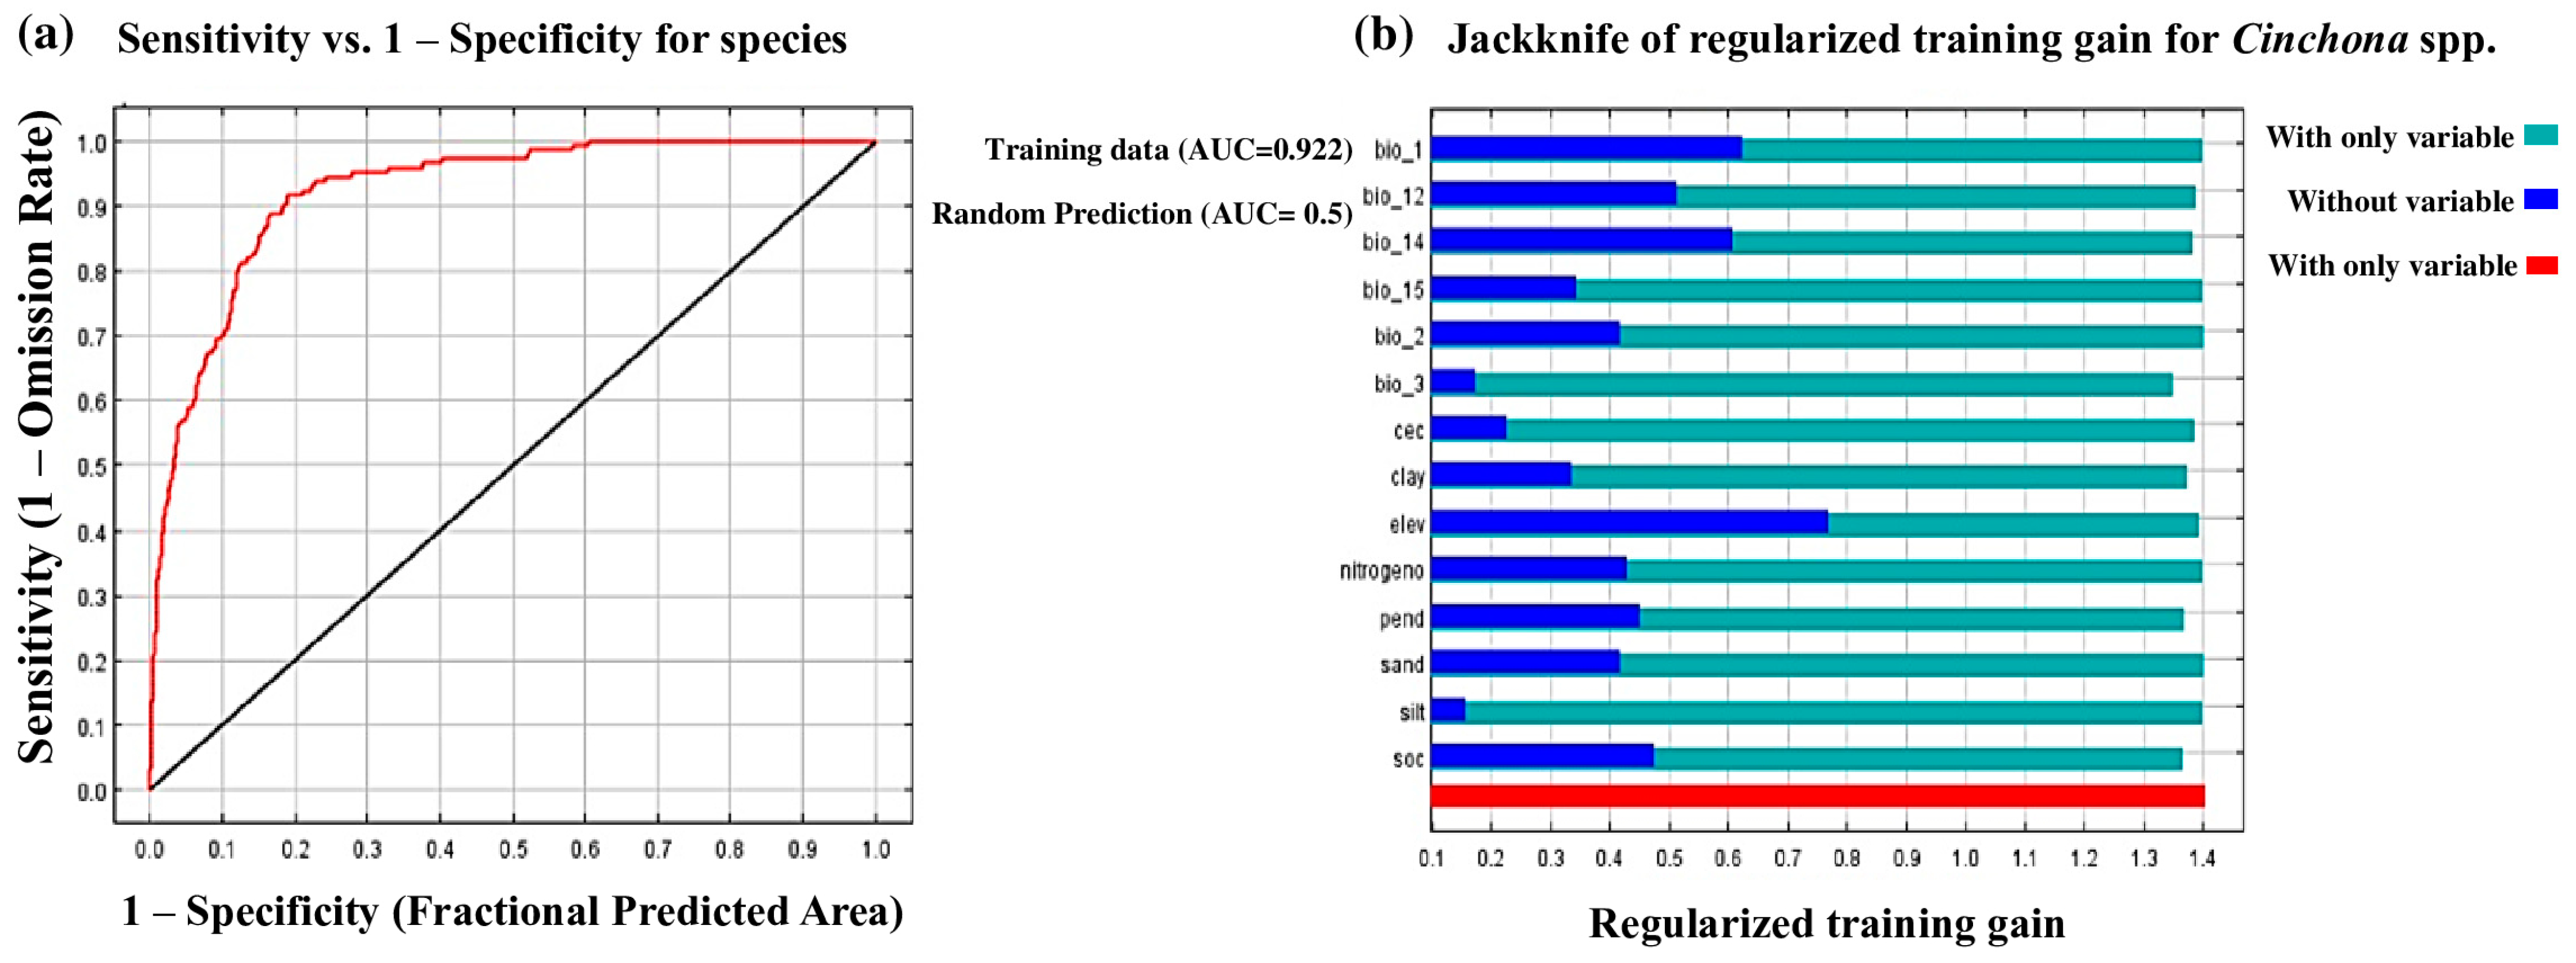
3.1. Contribution of the Variables Selected for the Study and the Probabilistic Model

The accuracy of the current distribution probability model performed with MaxEnt obtained an AUC value equal to 0.922 for the training data (Figure 3a). Jackknife analysis (Figure 3b) shows that the variables’ elevation (elev), precipitation of the driest month (bio_14) and Mean Annual Temperature (bio_1) contribute highly to the model.

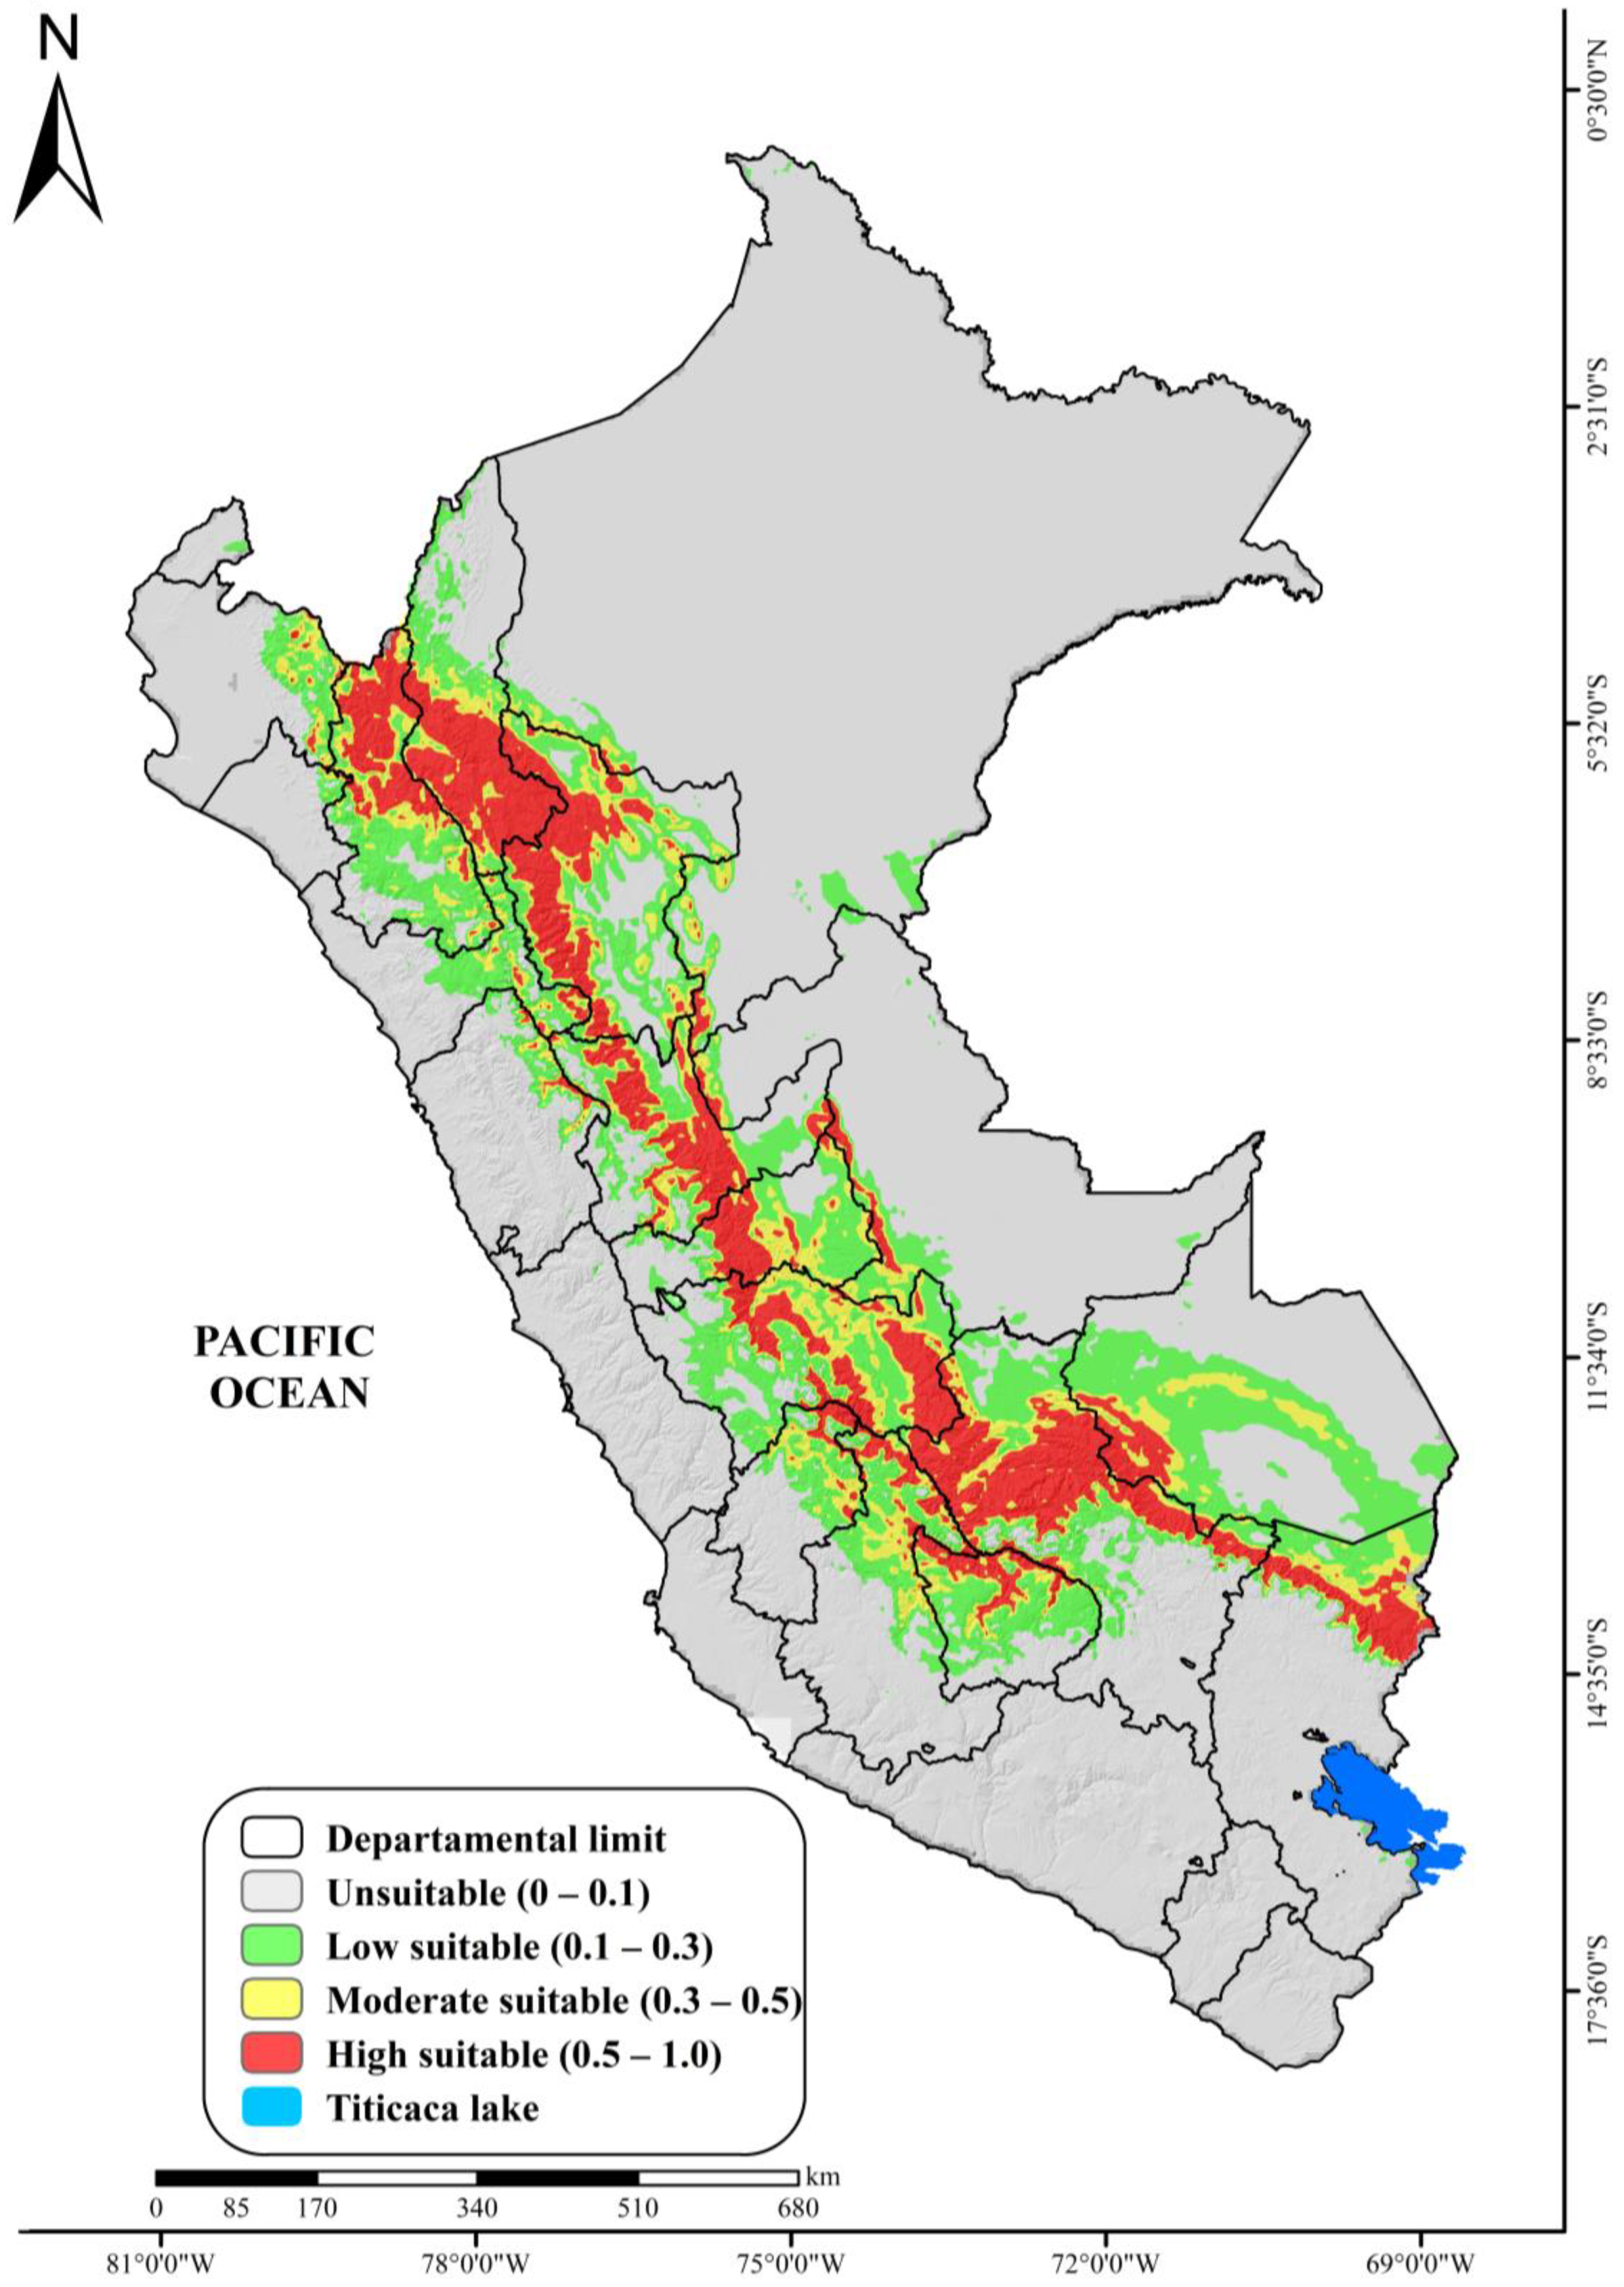
3.2. Probability of Areas for the Current Distribution of the Genus cinchona spp.

In Peru, the areas with a high adequate probability for the current distribution of the genus Cinchona total 103,547.89 km2, which is 8.08% of the total Peruvian territory. These areas with a high suitable probability extend over 17 departments (Figure 4), of which Cusco, Amazonas, San Martín and Cajamarca possess the largest territorial extension for this probability level with 21,293.71 km2, 14,168.54 km2, 14,603.72 km2 and 9290.56 km2, respectively (Table 2 and Table S1).

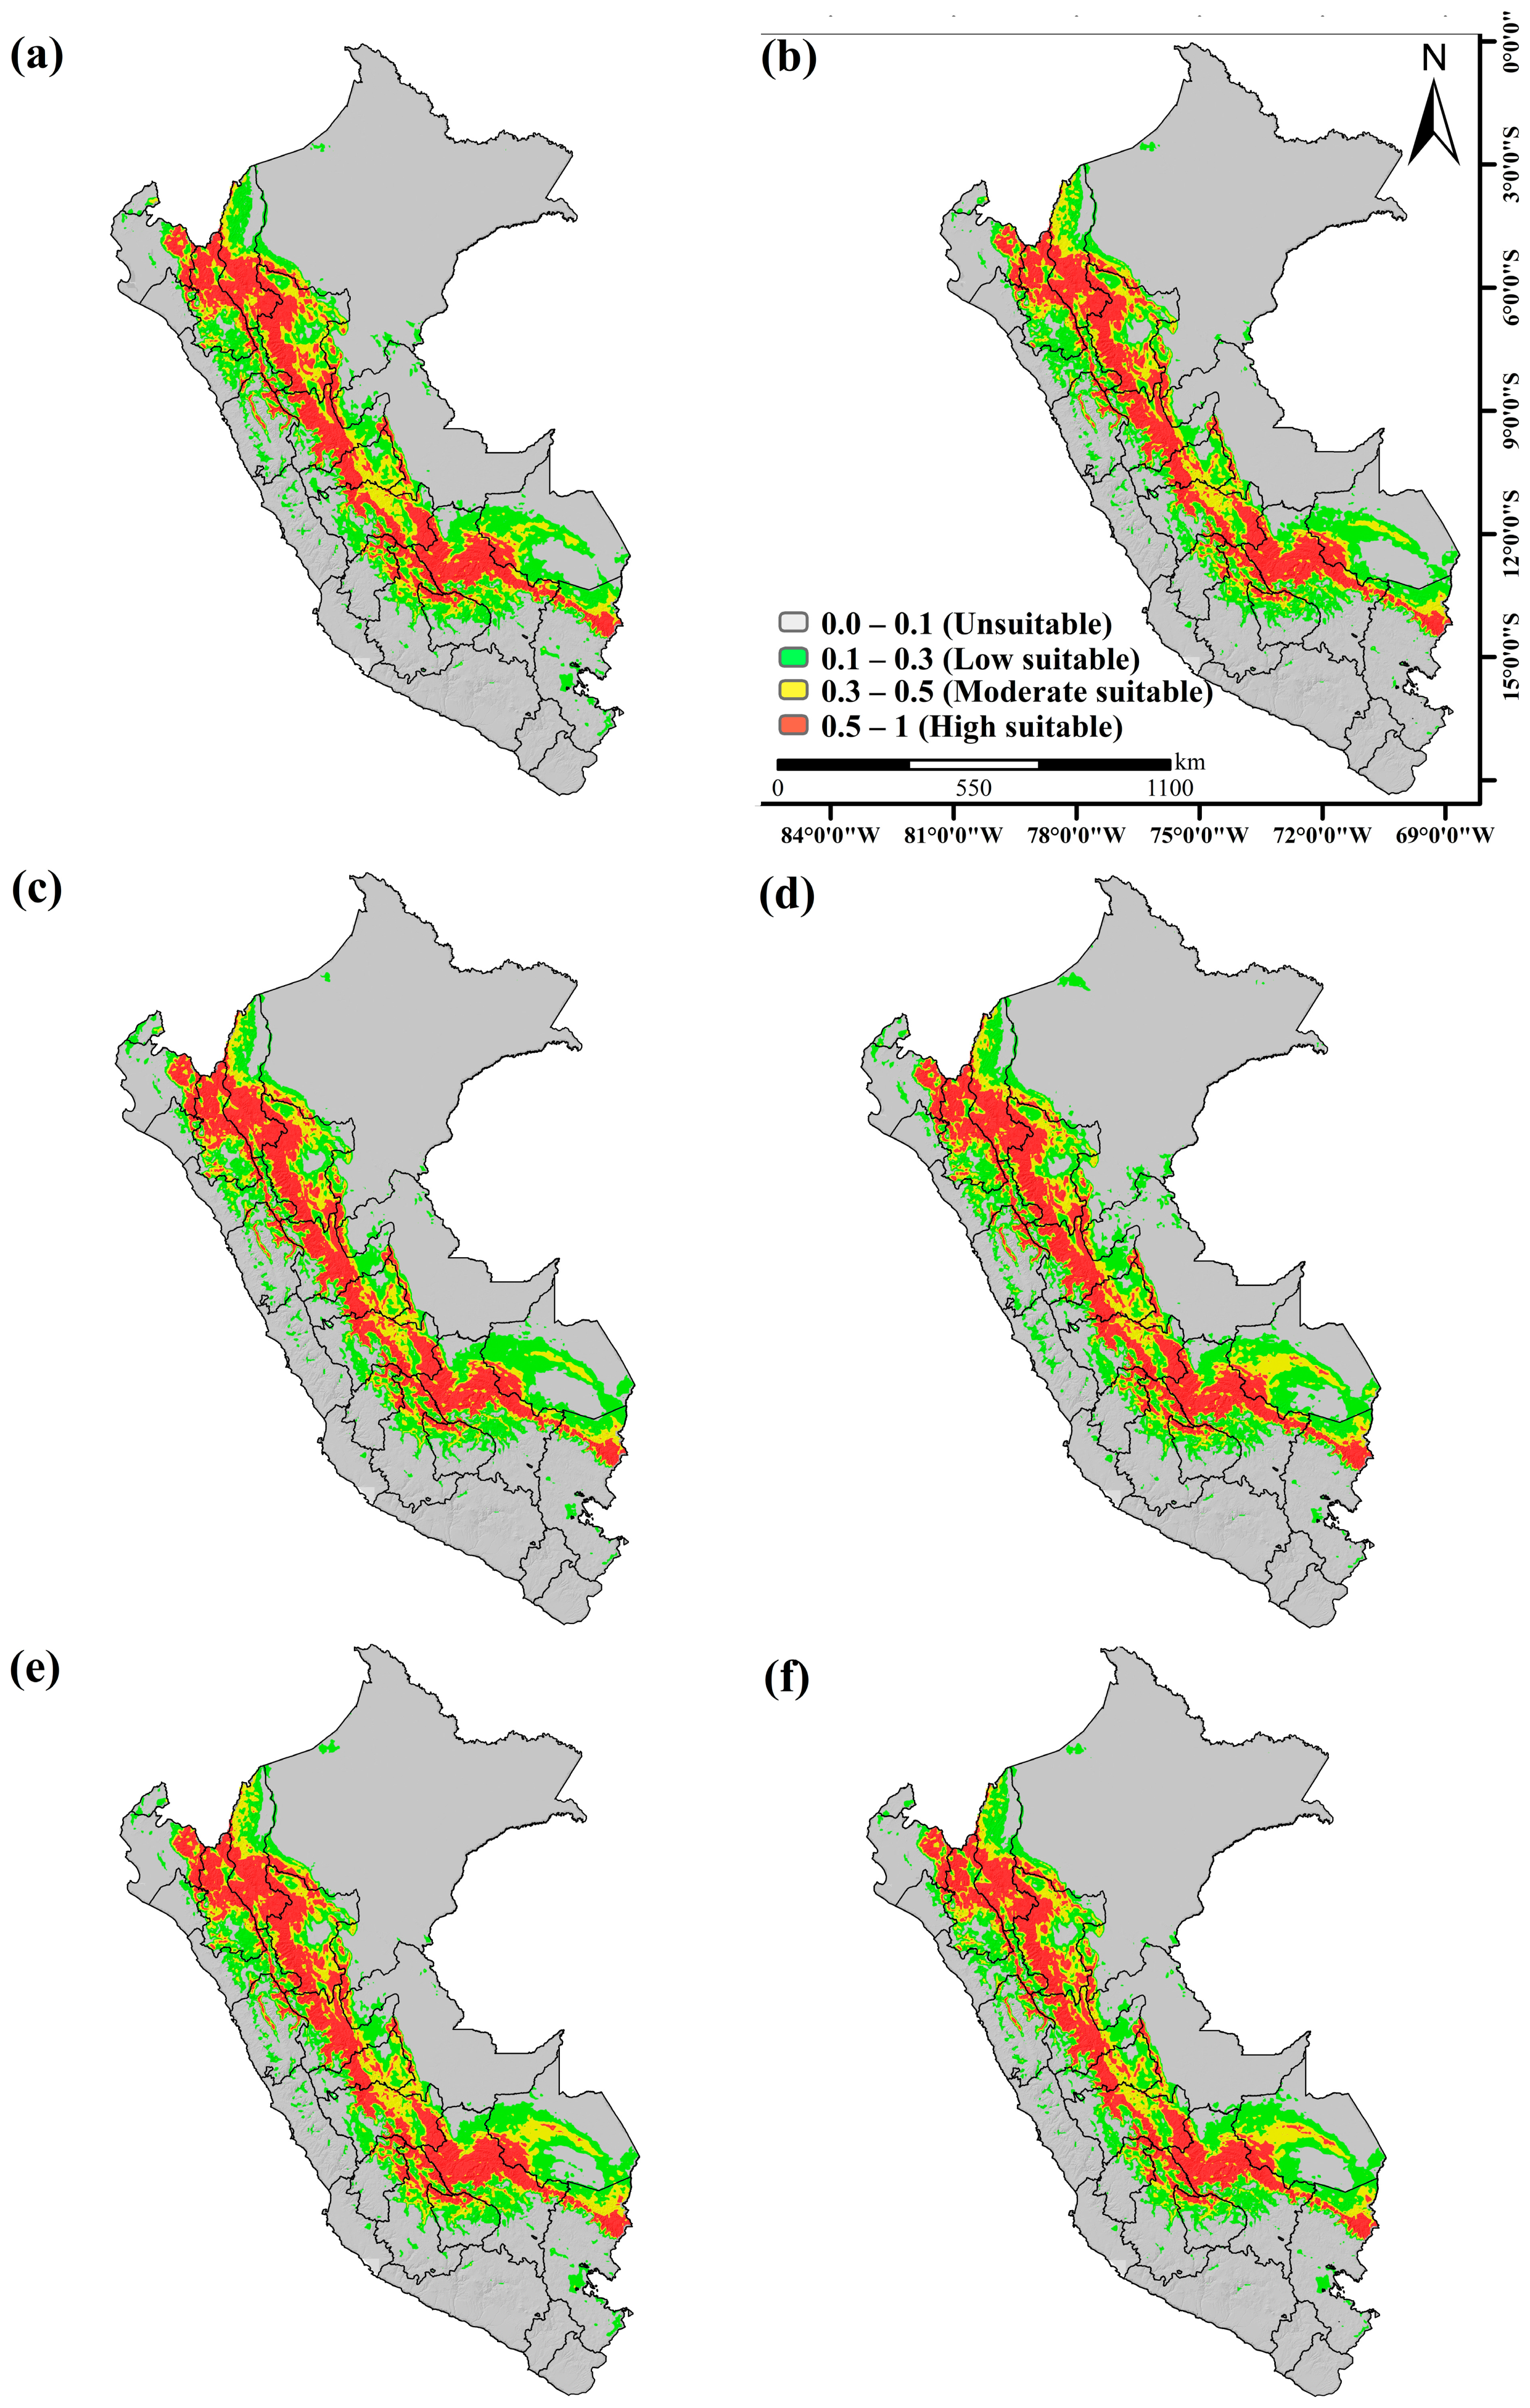
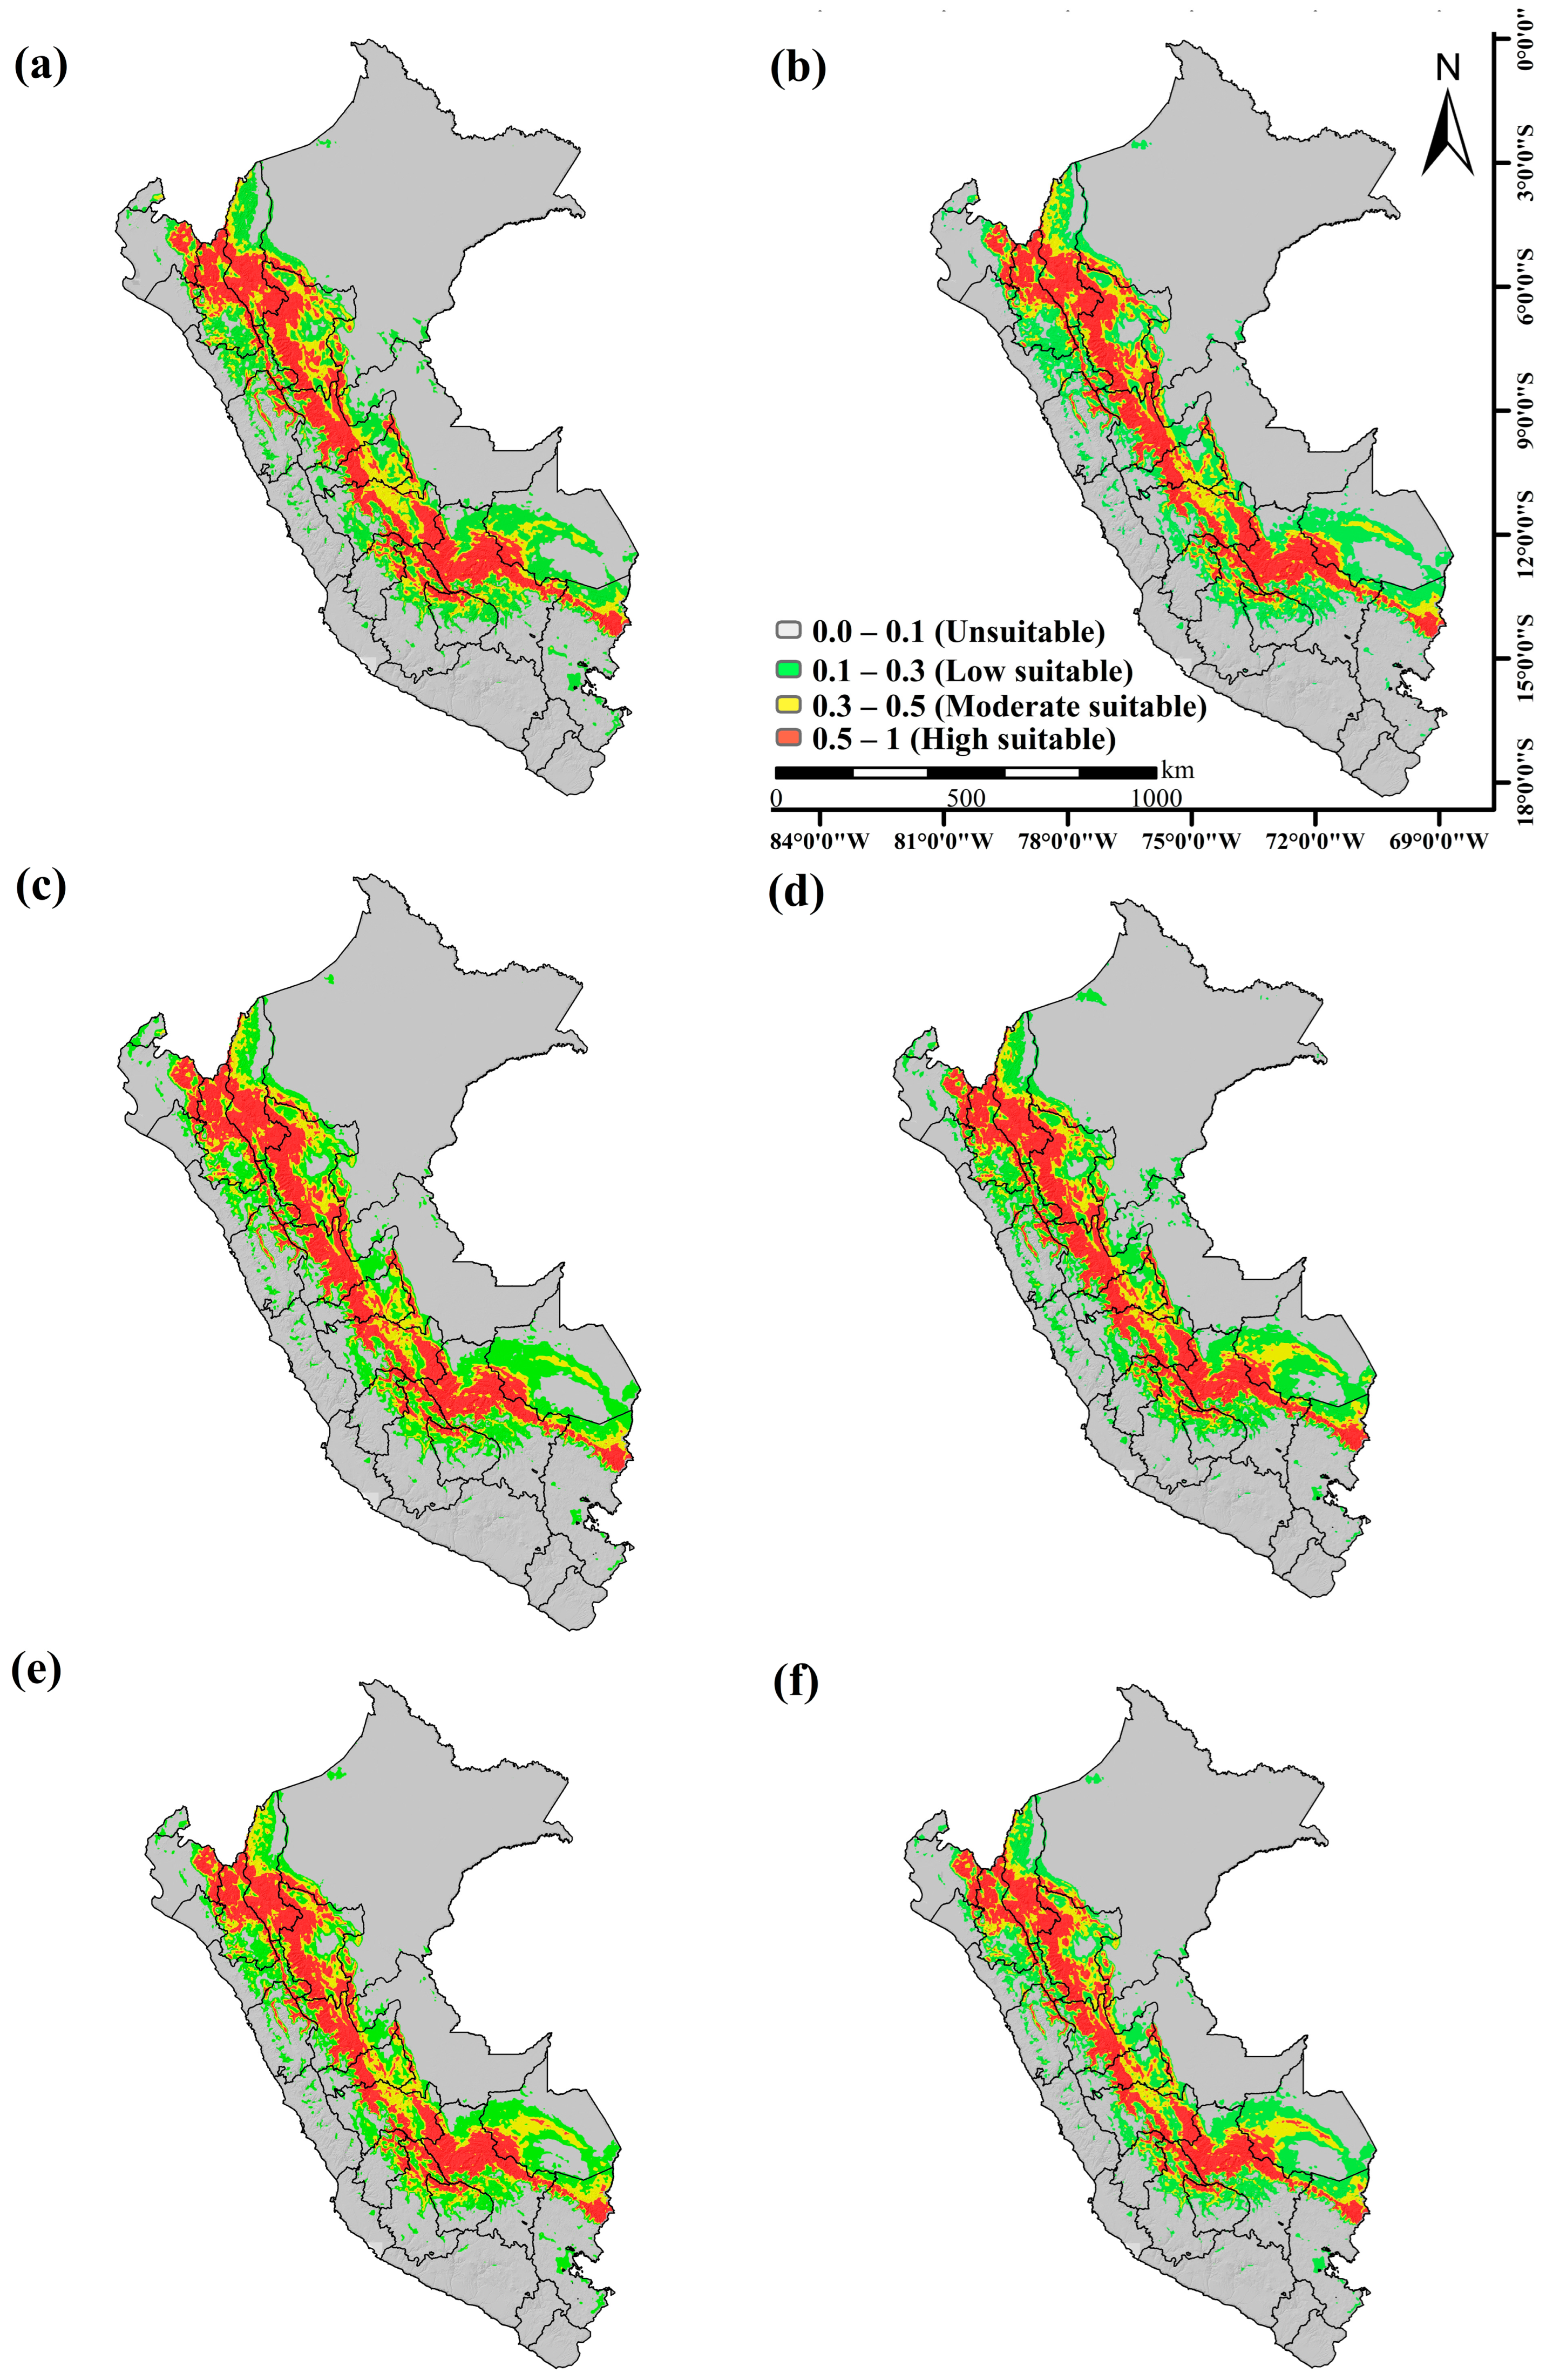
3.3. Potential Distribution of Cinchona spp. under Climate Change Scenario

The future projection of potential areas for the distribution of Cinchona spp. in Peru was carried out taking into account a more favorable scenario (RCP 8.5) (Figure 5 and Figure S1) and a more pessimistic scenario (RCP 4.5) (Figure 6 and Figure S2). It can be seen that for the year 2050, in both the most favorable scenario (RCP 4.5) and the most pessimistic scenario (RCP 8.5), the HadGem2 model is the one that presents the greatest increase in terms of areas in the High Suitability class, ranging from 8.08% to 11.73% of the surface area for both scenarios. In addition, for the year 2070, the Access 1.0 model is the one that registers the largest areas in the High Suitability class and gains the largest amount of area, from 8.08% to 11.98%, in both scenarios (RCP 8.5 and RCP 4.5) (Table 3).

4. Discussion

This work assessed the current and future distribution of Cinchona spp. in Peru. These species are threatened by urban growth, agriculture, selective logging and massive deforestation. Cinchona spp. possess a high level of regrowth in their natural habitat, but their percentage of regeneration is low [49]. Studies on this genus in Peru are still limited. We here used the MaxEnt model to determine the current and future distribution of Cinchona spp. as this model is suitable for working with a large number of qualitative and quantitative variables [36,46] and performs well in predicting the distribution of species until 2100.
The distribution of both the flora and fauna species is directly influenced by edaphoclimatic factors that respond to the particular needs and requirements of each species [50]. Consequently, in studies where the distribution of the flora species is modeled, bioclimatic, edaphic and topographic variables are integrated. Therefore, in this study, 28 variables were considered and we determined that the variables that had the greatest contribution were (i) elevation (altitude), (ii) precipitation in the driest month (bio_14) (iii) and mean annual temperature (bio_1), which is consistent with conclusions of similar studies such as the one conducted by Ma et al. [50]. On the other hand, with the results obtained in this work, we found that the probability level of the distribution of Cinchona spp. has a direct relationship with the climatic and geographical conditions, which is congruent and necessary since Cinchona spp. trees have restrictions with these variables for their development both in diameter and height and for propagation. Similar results were obtained by Kufa et al. [39] as they mentioned that the variables that mainly affect species dispersal are precipitation and temperature. Cotrina Sánchez et al. [33] also indicated that the dispersal of species is also affected by biogeographical conditions.
The probable distribution of the genus Cinchona in Peru is found in the central part of the country, extending between the Amazonian and Andean areas, with greater preponderance in the departments of Cusco, Amazonas, San Martin and Cajamarca, which contrasts with the natural requirements for the distribution of this species (i.e., cloud forest areas with altitudes ranging from 600 to 3200 m.a.s.l. [51]). However, for Garcia et al. [8], the habitats with a high distribution potential for the genus Cinchona were found to a greater extent in the regions of Junín, Huánuco and San Martín, with 36.3% (15,953.46 km2), 47.60% (17,718.96 km2) and 33.0% (16,813.68 km2) of their respective territories. A plausible explanation for these differences is that they did not integrate edaphic variables as we did in the present work. Garcia et al. [8] only used 10 bioclimatic variables and the elevation of the terrain. We believe our results provide more robust evidence since it is known that for the development of tree species it is necessary to take into account the soil where they grow.
Regarding the accuracy of the spatial probability model of the Cinchona genus in Peru, an AUC value equal to 0.922 was obtained, which ratifies the results of other studies demonstrating the good performance of the MaxEnt model to define the suitability of geographical spaces for the distribution of tree species [28,38,44,52] and differs from some theories that mention that the model has some limitations in the prediction accuracy [38,47]. On the other hand, the success of the model developed with MaxEnt lies mainly in the variables used for range prediction.
For the future prediction of the spatial probability modeling of the genus Cinchona spp. in Peru for the years 2050 and 2070, three climate models were used (MPI-ESM-LR, HadGem2-Es and Access 1.0), obtaining significant contributions for the future distribution of the species under study. At the territorial level, it can be observed that each of the models presents different changes in the surface areas for the species, showing that in the projection for the year 2050, in both the most favorable scenario (RCP 4.5) and the most pessimistic (RCP 8.5), the HadGem2-Es model is the one that presents the greatest increase in terms of the surface areas of the High Suitability class, since it goes from 8.08% to 11.73% of the surface area for both scenarios. On the other hand, for the year 2070, the Access 1.0 model is the one that registers the largest areas in the High Adequate class and the one that gains the largest amount of area, as it goes from 8.08% to 11.98% in both scenarios (RCP 8.5 and RCP 4.5).
These results contrast with those obtained by Kufa et al. [36], who reported an increase in the suitable areas for the distribution of species when making the future projection with the HadGEM2-ES model. The future projection of suitable areas for the flora species is of great importance as it helps to correctly plan planting areas [30]. Currently, global climate changes are a very big concern since it is difficult to mitigate the problems involved. Therefore, the findings obtained from the climate models are the results of different trends that can often help long-term sustainability by applying various management plans such as reforestation [53] and species adaptation to climate changes [54]. On the other hand, our results showed the possibility of suitable areas for the spatial distribution of Cinchona spp. in the future, taking into consideration the climate change trends established for the years 2050 and 2070. However, the probability that this trend may continue is uncertain due to the drastic alterations in climate parameters such as temperature and rainfall that have been occurring. Therefore, it is very likely that in a few years the climate change models will vary, which would generate the need to re-evaluate the suitable areas for the spatial distribution of members of the genus Cinchona.
We demonstrated that although there is a notorious climate change during the period 2050 and 2070, the tendency of the presence of the species is maintained with respect to the points of presence; however, in the future, not only may the climate change model affect the distribution of the genus Cinchona, but also environmental variables such as habitat fragmentation, change of land use and invasive species [55]. However, biological variables such as those mentioned above were not considered in this study because this would require field studies to determine the trend of ecological succession with respect to climate change. With an additional budget, in the near future, we will conduct other studies in Cinchona spp., considering additional biological variables.
The species distribution models have certain limitations such as the certainty of the species presence database, since applying the study to large areas makes it difficult to validate the points. This problem can be corrected with independent testing, as indicated by West et al. [56]. They mentioned that another problem regarding modeling with MaxEnt has to do with the decision making during model execution, sampling bias, sample size, multicollinearity and spatial autocorrelation [55]; these can be solved with nonparametric statistical analysis during the modeling process.

5. Conclusions

In Peru, tropical forests are threatened by invasive practices such as deforestation and climate change. Here, for the first time, we developed a probability model to identify current and future areas for the spatial distribution of members of the genus Cinchona under different climatic scenarios. We used the MaxEnt probability method and it was possible to verify that, by the year 2022, Peru possessed 103,547.89 ha of highly adequate class territory, which represents 8.08% of the total territory. In addition, it was possible to verify that the department that has the largest area for the distribution of Cinchona spp. is Cusco. On the other hand, for the years 2050 and 2070 an increase in the highly adequate class areas of 3.65% and 3.9%, respectively, is forecasted. The generated model includes bioclimatic and edaphic variables which directly contribute to the identification of suitable areas for this purpose; likewise, the reliability of the model is quite high since it obtained an AUC of 0.922. The results obtained in this investigation demonstrate the probable areas where species of Cinchona can be found in their natural habitat. Our results also show areas with aptitude for the development of the species, which serves as a supporting material for decision making and the management of the species with the certainty of the veracity of the data obtained through the scientific method.

Supplementary Materials

The following supporting information can be downloaded at: https://www.mdpi.com/article/10.3390/su151914109/s1, Table S1: Quantification of probable areas for future projection of Cinchona spp. according to climate change scenarios for each department of Peru. Figure S1: Estimated high probability of Cinchona spp. for the years 2022, 2050 and 2070 under a favorable scenario (RCP 4.5) using the following models: MPI-ESM-LR, HadGem2-Es and Access 1.0. Figure S2: Estimated high probability of Cinchona spp. for the years 2022, 2050 and 2070 under an unfavorable scenario (RCP 8.5) using the following models: MPI-ESM-LR, HadGem2-Es and Access 1.0.

Author Contributions

Conceptualization, A.J.V.; methodology, A.J.V., D.C.-T. and C.O.; software, D.C.-T. and A.J.V.; validation, A.J.V., D.C.-T. and C.O.; formal analysis, A.J.V., D.C.-T., C.O., L.Q. and C.I.A.; investigation, A.J.V., D.C.-T. and C.O.; resources, E.A.A.-S., G.I.-V., R.J.C. and L.D.M.-A.; data curation A.J.V., D.C.-T. and C.O.; writing—original draft preparation, A.J.V., D.C.-T. and C.O.; writing—review and editing, A.J.V., D.C.-T., C.O., L.Q. and C.I.A.; visualization, A.J.V., D.C.-T., C.O. and C.I.A.; supervision, E.A.A.-S., G.I.-V., R.J.C. and L.D.M.-A.; funding acquisition, G.I.-V. and L.D.M.-A. All authors have read and agreed to the published version of the manuscript.

Funding

This research was funded by Vicerrectorado de Investigación, UNTRM, and project “Creación de los servicios de Investigación, Innovación y Desarrollo de Tecnología para el Sector Agrario y Agroindustrial de la UNTRM” of the Peruvian Government, with the grant number CUI 2313205.

Institutional Review Board Statement

Not applicable.

Informed Consent Statement

Not applicable.

Data Availability Statement

Not applicable.

Acknowledgments

The authors thank the project “Mejoramiento del servicio de formación de pre grado en educación superior universitaria de la Escuela Profesional de Ingenieria Forestal de la UNTRM distrito de Chachapoyas—Provincia De Chachapoyas—Departamento De Amazonas”, of the Peruvian Government with the grant number CUI 2513702, and the Laboratorio de Sensoramiento Remoto y Analisis de Datos by National University of Jaén.

Conflicts of Interest

The authors declare no conflict of interest.

References

  1. González-Orozco, C.E.; Guillén, E.G.; Cuvi, N. Changes of Cinchona Distribution over the Past Two Centuries in the Northern Andes. R. Soc. Open Sci. 2023, 10, 230229. [Google Scholar] [CrossRef]
  2. Cárdenas, G.P.; Bravo, N.; Barboza, E.; Salazar, W.; Ocaña, J.; Vázquez, M.; Lobato, R.; Injante, P.; Arbizu, C.I. Current and Future Distribution of Shihuahuaco (Dipteryx Spp.) under Climate Change Scenarios in the Central-Eastern Amazon of Peru. Sustainability 2023, 15, 7789. [Google Scholar] [CrossRef]
  3. Aymard, C.G.A.; Aymard, C.G.A. Breve Reseña de Los Aspectos Taxonómicos y Nomenclaturales Actuales Del Género Cinchona (Rubiaceae-Cinchoneae). Rev. Acad. Colomb. Cienc. Exactas Fis. Nat. 2019, 43, 234–241. [Google Scholar] [CrossRef]
  4. Vivanco-Galván, O.; Jiménez, Y.; Castillo Malla, D.P.; Lucero, H. Blue LED Light Enhances the Growth of Cinchona Officinalis 7L. Cultured in Vitro. SPIE 2022, 12210, 12210067. [Google Scholar] [CrossRef]
  5. Cuvi, N. Legacies of Boldness: Caldas, Humboldt and Knowledge about Cinchonas, 1801–1821. Hist. Cienc. Saude Manguinhos 2022, 29, 61–79. [Google Scholar] [CrossRef] [PubMed]
  6. Canales, N.A.; Gress Hansen, T.N.; Cornett, C.; Walker, K.; Driver, F.; Antonelli, A.; Maldonado, C.; Nesbitt, M.; Barnes, C.J.; Rønsted, N. Historical Chemical Annotations of Cinchona Bark Collections Are Comparable to Results from Current Day High-Pressure Liquid Chromatography Technologies. J. Ethnopharmacol. 2020, 249, 112375. [Google Scholar] [CrossRef] [PubMed]
  7. Yacila, K.A.P.; Suarez-Peña, E.A.; Pera, C.A.T.; Requena, L.A.B.; Sánchez, L.X.L.; Rodríguez, I.Z.; Paredes-Vilca, O.J.; García, J.Y.D. Genetic Diversity and Phylogeny of the Genus Cinchona in Cutervo National Park, Peru. Sci. Agropecu. 2021, 12, 517–524. [Google Scholar] [CrossRef]
  8. García, L.; Veneros, J.; Chavez, S.G.; Oliva, M.; Rojas-Briceño, N.B. World Historical Mapping and Potential Distribution of Cinchona Spp. in Peru as a Contribution for Its Restoration and Conservation. J. Nat. Conserv. 2022, 70, 126290. [Google Scholar] [CrossRef]
  9. Sasongko, N.D.; Yuniati, A.; Billmora, L.A.G. Genetic Profiles of Three Cinchona Species in Junghuhn Natural Reserve, Indonesia. SABRAO J. Breed. Genet. 2021, 53, 697–709. [Google Scholar] [CrossRef]
  10. Aarts, G.; Fieberg, J.; Matthiopoulos, J. Comparative Interpretation of Count, Presence–Absence and Point Methods for Species Distribution Models. Methods Ecol. Evol. 2012, 3, 177–187. [Google Scholar] [CrossRef]
  11. Báez, J.C.; de Stephanis, R.; García-Ramos, M.C.; Ramos, M.L.; Pascual, P. Differential Space Distribution of the Genus Balaenoptera in the Eastern Tropical Atlantic Ocean. Reg. Stud. Mar. Sci. 2020, 37, 101346. [Google Scholar] [CrossRef]
  12. Pathak, A.K.; Verma, P.; Dayal, R.; Sarkar, U.K. Species Distribution Modeling and Assessment of Environmental Drivers Responsible for Distribution and Preferred Niche of Critically Endangered and Endemic Ornamental Freshwater Fish Species of the Genus Sahyadria. Environ. Sci. Pollut. Res. 2022, 29, 50584–50597. [Google Scholar] [CrossRef] [PubMed]
  13. Wu, B.; Zhou, L.; Qi, S.; Jin, M.; Hu, J.; Lu, J. Effect of Habitat Factors on the Understory Plant Diversity of Platycladus Orientalis Plantations in Beijing Mountainous Areas Based on MaxEnt Model. Ecol. Indic. 2021, 129, 107917. [Google Scholar] [CrossRef]
  14. Elith, J.; Phillips, S.J.; Hastie, T.; Dudík, M.; Chee, Y.E.; Yates, C.J. A Statistical Explanation of MaxEnt for Ecologists. Divers. Distrib. 2011, 17, 43–57. [Google Scholar] [CrossRef]
  15. Stickley, S.F.; Fraterrigo, J.M. Microclimate Species Distribution Models Estimate Lower Levels of Climate-Related Habitat Loss for Salamanders. J. Nat. Conserv. 2023, 72, 126333. [Google Scholar] [CrossRef]
  16. Daniel, J.; Horrocks, J.; Umphrey, G.J. Efficient Modelling of Presence-Only Species Data via Local Background Sampling. J. Agric. Biol. Environ. Stat. 2020, 25, 90–111. [Google Scholar] [CrossRef]
  17. Fernandes, R.F.; Honrado, J.P.; Guisan, A.; Roxo, A.; Alves, P.; Martins, J.; Vicente, J.R. Species Distribution Models Support the Need of International Cooperation towards Successful Management of Plant Invasions. J. Nat. Conserv. 2019, 49, 85–94. [Google Scholar] [CrossRef]
  18. Torreblanca, E.; Caminãs, J.A.; MacIás, D.; Garciá-Barcelona, S.; Real, R.; Baéz, J.C. Using Opportunistic Sightings to Infer Differential Spatio-Temporal Use of Western Mediterranean Waters by the Fin Whale. PeerJ 2019, 2019, e6673. [Google Scholar] [CrossRef]
  19. Tang, Y.; Winkler, J.A.; Viña, A.; Wang, F.; Zhang, J.; Zhao, Z.; Connor, T.; Yang, H.; Zhang, Y.; Zhang, X.; et al. Expanding Ensembles of Species Present-Day and Future Climatic Suitability to Consider the Limitations of Species Occurrence Data. Ecol. Indic. 2020, 110, 105891. [Google Scholar] [CrossRef]
  20. Ovalle-Rivera, O.; Läderach, P.; Bunn, C.; Obersteiner, M.; Schroth, G. Projected Shifts in Coffea Arabica Suitability among Major Global Producing Regions Due to Climate Change. PLoS ONE 2015, 10, e0124155. [Google Scholar] [CrossRef]
  21. Schnase, J.L.; Carroll, M.L.; Gill, R.L.; Tamkin, G.S.; Li, J.; Strong, S.L.; Maxwell, T.P.; Aronne, M.E.; Spradlin, C.S. Toward a Monte Carlo Approach to Selecting Climate Variables in MaxEnt. PLoS ONE 2021, 16, e0237208. [Google Scholar] [CrossRef] [PubMed]
  22. Thomas Ledig, F.; Rehfeldt, G.E.; Sáenz-Romero, C.; Flores-López, C. Projections of Suitable Habitat for Rare Species under Global Warming Scenarios. Am. J. Bot. 2010, 97, 970–987. [Google Scholar] [CrossRef] [PubMed]
  23. Lassalle, G.; Crouzet, P.; Gessner, J.; Rochard, E. Global Warming Impacts and Conservation Responses for the Critically Endangered European Atlantic Sturgeon. Biol. Conserv. 2010, 143, 2441–2452. [Google Scholar] [CrossRef]
  24. Guan, Y.; Hohn, S.; Wild, C.; Merico, A. Vulnerability of Global Coral Reef Habitat Suitability to Ocean Warming, Acidification and Eutrophication. Glob. Chang. Biol. 2020, 26, 5646–5660. [Google Scholar] [CrossRef]
  25. Mao, M.; Chen, S.; Ke, Z.; Qian, Z.; Xu, Y. Using MaxEnt to Predict the Potential Distribution of the Little Fire Ant (Wasmannia Auropunctata) in China. Insects 2022, 13, 1008. [Google Scholar] [CrossRef]
  26. Mahmoodi, S.; Heydari, M.; Ahmadi, K.; Khwarahm, N.R.; Karami, O.; Almasieh, K.; Naderi, B.; Bernard, P.; Mosavi, A. The Current and Future Potential Geographical Distribution of Nepeta Crispa Willd., an Endemic, Rare and Threatened Aromatic Plant of Iran: Implications for Ecological Conservation and Restoration. Ecol. Indic. 2022, 137, 108752. [Google Scholar] [CrossRef]
  27. Vásárhelyi, Z.; Scheuring, I.; Avilés, L. The Ecology of Spider Sociality: A Spatial Model. Am. Nat. 2022, 199, 776–788. [Google Scholar] [CrossRef]
  28. Hwang, J.H.; Kim, S.H.; Yoon, S.; Jung, S.; Kim, D.H.; Lee, W.H. Evaluation of Spatial Distribution of Three Major Leptocorisa (Hemiptera: Alydidae) Pests Using MaxEnt Model. Insects 2022, 13, 750. [Google Scholar] [CrossRef]
  29. Mugiyo, H.; Chimonyo, V.G.P.; Kunz, R.; Sibanda, M.; Nhamo, L.; Ramakgahlele Masemola, C.; Modi, A.T.; Mabhaudhi, T. Mapping the Spatial Distribution of Underutilised Crop Species under Climate Change Using the MaxEnt Model: A Case of KwaZulu-Natal, South Africa. Clim. Serv. 2022, 28, 100330. [Google Scholar] [CrossRef]
  30. Zhang, S.; Liu, X.; Li, R.; Wang, X.; Cheng, J.; Yang, Q.; Kong, H. AHP-GIS and MaxEnt for Delineation of Potential Distribution of Arabica Coffee Plantation under Future Climate in Yunnan, China. Ecol. Indic. 2021, 132, 108339. [Google Scholar] [CrossRef]
  31. Zhao, H.; Zhang, H.; Xu, C. Study on Taiwania Cryptomerioides under Climate Change: MaxEnt Modeling for Predicting the Potential Geographical Distribution. Glob. Ecol. Conserv. 2020, 24, e01313. [Google Scholar] [CrossRef]
  32. Wang, Y.; Dong, P.; Hu, W.; Chen, G.; Zhang, D.; Chen, B.; Lei, G. Modeling the Climate Suitability of Northernmost Mangroves in China under Climate Change Scenarios. Forests 2022, 13, 64. [Google Scholar] [CrossRef]
  33. Cotrina Sánchez, A.; Rojas Briceño, N.B.; Bandopadhyay, S.; Ghosh, S.; Torres Guzmán, C.; Oliva, M.; Guzman, B.K.; Salas López, R. Biogeographic Distribution of Cedrela Spp. Genus in Peru Using Maxent Modeling: A Conservation and Restoration Approach. Diversity 2021, 13, 261. [Google Scholar] [CrossRef]
  34. Blazquez-Soriano, A.; Ramos-Sandoval, R. Information Transfer as a Tool to Improve the Resilience of Farmers against the Effects of Climate Change: The Case of the Peruvian National Agrarian Innovation System. Agric. Syst. 2022, 200, 103431. [Google Scholar] [CrossRef]
  35. Ramírez, I.J.; Lee, J. Deconstructing the Spatial Effects of El Niño and Vulnerability on Cholera Rates in Peru: Wavelet and GIS Analyses. Spat. Spatiotemporal Epidemiol. 2022, 40, 100474. [Google Scholar] [CrossRef]
  36. Zhang, H.T.; Wang, W.T. Prediction of the Potential Distribution of the Endangered Species Meconopsis Punicea Maxim under Future Climate Change Based on Four Species Distribution Models. Plants 2023, 12, 1376. [Google Scholar] [CrossRef]
  37. Kayet, N.; Chakrabarty, A.; Pathak, K.; Sahoo, S.; Dutta, T.; Hatai, B.K. Comparative Analysis of Multi-Criteria Probabilistic FR and AHP Models for Forest Fire Risk (FFR) Mapping in Melghat Tiger Reserve (MTR) Forest. J. For. Res. 2020, 31, 565–579. [Google Scholar] [CrossRef]
  38. Xu, D.; Zhuo, Z.; Wang, R.; Ye, M.; Pu, B. Modeling the Distribution of Zanthoxylum Armatum in China with MaxEnt Modeling. Glob. Ecol. Conserv. 2019, 19, e00691. [Google Scholar] [CrossRef]
  39. Kufa, C.A.; Bekele, A.; Atickem, A. Impacts of Climate Change on Predicted Habitat Suitability and Distribution of Djaffa Mountains Guereza (Colobus Guereza Gallarum, Neumann 1902) Using MaxEnt Algorithm in Eastern Ethiopian Highland. Glob. Ecol. Conserv 2022, 35, e02094. [Google Scholar] [CrossRef]
  40. Scrivanti, L.R.; Anton, A.M. Impact of Climate Change on the Andean Distribution of Poa Scaberula (Poaceae). Flora 2021, 278, 151805. [Google Scholar] [CrossRef]
  41. Berhanu, Y.; Tassie, N.; Sintayehu, D.W. Predicting the Current and Future Suitable Habitats for Endemic and Endangered Ethiopian Wolf Using MaxEnt Model. Heliyon 2022, 8, e10223. [Google Scholar] [CrossRef] [PubMed]
  42. Zhao, Y.; Deng, X.; Xiang, W.; Chen, L.; Ouyang, S. Predicting Potential Suitable Habitats of Chinese Fir under Current and Future Climatic Scenarios Based on Maxent Model. Ecol. Inform. 2021, 64, 101393. [Google Scholar] [CrossRef]
  43. Liu, Y.; Huang, P.; Lin, F.; Yang, W.; Gaisberger, H.; Christopher, K.; Zheng, Y. MaxEnt Modelling for Predicting the Potential Distribution of a near Threatened Rosewood Species (Dalbergia Cultrata Graham Ex Benth). Ecol. Eng. 2019, 141, 105612. [Google Scholar] [CrossRef]
  44. Mehmud, S.; Kalita, N.; Roy, H.; Sahariah, D. Species Distribution Modelling of Calamus Floribundus Griff. (Arecaceae) Using Maxent in Assam. Acta Ecol. Sin. 2022, 42, 115–121. [Google Scholar] [CrossRef]
  45. Hand, D.J. Measuring Classifier Performance: A Coherent Alternative to the Area under the ROC Curve. Mach. Learn. 2009, 77, 103–123. [Google Scholar] [CrossRef]
  46. Wang, R.; Jiang, C.; Liu, L.; Shen, Z.; Yang, J.; Wang, Y.; Hu, J.; Wang, M.; Hu, J.; Lu, X.; et al. Prediction of the Potential Distribution of the Predatory Mite Neoseiulus Californicus McGregor in China Using MaxEnt. Glob. Ecol. Conserv. 2021, 29, e01733. [Google Scholar] [CrossRef]
  47. Zheng, T.; Sun, J.Q.; Shi, X.J.; Liu, D.L.; Sun, B.Y.; Deng, Y.; Zhang, D.L.; Liu, S.M. Evaluation of Climate Factors Affecting the Quality of Red Huajiao (Zanthoxylum Bungeanum Maxim.) Based on UPLC-MS/MS and MaxEnt Model. Food Chem. X 2022, 16, 100522. [Google Scholar] [CrossRef]
  48. Shen, Y.; Tu, Z.; Zhang, Y.; Zhong, W.; Xia, H.; Hao, Z.; Zhang, C.; Li, H. Predicting the Impact of Climate Change on the Distribution of Two Relict Liriodendron Species by Coupling the MaxEnt Model and Actual Physiological Indicators in Relation to Stress Tolerance. J. Environ. Manag. 2022, 322, 116024. [Google Scholar] [CrossRef]
  49. Arbizu, C.I.; Ferro-Mauricio, R.D.; Chávez-Galarza, J.C.; Guerrero-Abad, J.C.; Vásquez, H.V.; Maicelo, J.L. The Complete Chloroplast Genome of the National Tree of Peru, Quina (Cinchona Officinalis L., Rubiaceae). Mitochondrial DNA B Resour. 2021, 6, 2781–2783. [Google Scholar] [CrossRef]
  50. Ma, Q.; Li, X.; Wu, S.; Zeng, F. Potential Geographical Distribution of Stipa Purpurea across the Tibetan Plateau in China under Climate Change in the 21st Century. Glob. Ecol. Conserv. 2022, 35, e02064. [Google Scholar] [CrossRef]
  51. Villar, M.; Marcelo, F.; Baselly, J. Evaluación de la Regeneración Natural de la Cinchona Officinalis L. en la Zona de Amortiguamiento del Bosque de Protección de Pagaibamba—II Etapa; Instituto Nacional de Innovación Agraria—INIA: La Molina, Peru, 2018; pp. 1–9. [Google Scholar]
  52. Yan, H.; Feng, L.; Zhao, Y.; Feng, L.; Wu, D.; Zhu, C. Prediction of the Spatial Distribution of Alternanthera Philoxeroides in China Based on ArcGIS and MaxEnt. Glob. Ecol. Conserv. 2020, 21, e00856. [Google Scholar] [CrossRef]
  53. Sandoval-Martínez, J.; Badano, E.I.; Guerra-Coss, F.A.; Flores Cano, J.A.; Flores, J.; Gelviz-Gelvez, S.M.; Barragán-Torres, F. Selecting Tree Species to Restore Forest under Climate Change Conditions: Complementing Species Distribution Models with Field Experimentation. J. Environ. Manag. 2023, 329, 117038. [Google Scholar] [CrossRef] [PubMed]
  54. Määttänen, A.M.; Virkkala, R.; Leikola, N.; Aalto, J.; Heikkinen, R.K. Combined Threats of Climate Change and Land Use to Boreal Protected Areas with Red-Listed Forest Species in Finland. Glob. Ecol. Conserv. 2023, 41, 1–15. [Google Scholar] [CrossRef]
  55. Guitérrez, E.; Trejo, I. Efecto Del Cambio Climático En La Distribución Potencial de Cinco Especies Arbóreas de Bosque Templado En México. Rev. Mex. Biodivers. 2014, 85, 179–188. [Google Scholar] [CrossRef]
  56. West, A.M.; Kumar, S.; Brown, C.S.; Stohlgren, T.J.; Bromberg, J. Field Validation of an Invasive Species Maxent Model. Ecol. Inform. 2016, 36, 126–134. [Google Scholar] [CrossRef]
Figure 1. Location of the area of study.
Sustainability 15 14109 g001
Figure 2. Flow chart of the laboratory procedures employed in this study.
Sustainability 15 14109 g002
Figure 3. Accuracy of the probability model. (a) Area under the ROC curve (AUC); (b) Contribution of variables.
Sustainability 15 14109 g003
Figure 4. Probable areas for the distribution of Cinchona spp. by 2022 in Peru using MaxEnt.
Sustainability 15 14109 g004
Figure 5. Projected future distribution of Cinchona spp. under an unfavorable scenario (RCP 8.5) using the following models: (a) MPI-ESM-LR RCP 8.5, year 2070, (b) MPI-ESM-LR RCP 8.5, year 2050, (c) HadGem2-Es RCP 8.5, year 2070, (d) HadGem2-Es RCP 8.5, year 2050, (e) Access 1.0 RCP 8.5, year 2070, (f) Access 1.0 RCP 8.5 year 2070.
Sustainability 15 14109 g005
Figure 6. Projected future distribution of Cinchona spp. under a favorable scenario (RCP 4.5) using the following models: (a) MPI-ESM-LR RCP 4.5, year 2070, (b) MPI-ESM-LR RCP 4.5, year 2050, (c) HadGem2-Es RCP 4.5, year 2070, (d) HadGem2-Es RCP 4.5, year 2050, (e) Access 1.0 RCP 4.5, year 2070, (f) Access 1.0 RCP 4.5, year 2070.
Sustainability 15 14109 g006
Table 1. Variables used in the MaxEnt modeling of genus Cinchona in Peru.
TypeVariablesDescriptionSource
Bioclimatic variablesbio01Annual Mean TemperatureWorldclim
bio02Mean Diurnal Range (Mean of monthly (max temp–min temp))
bio03Isothermality (BIO2/BIO7) (×100)
bio04Temperature Seasonality (standard deviation ×100)
bio05Max Temperature of Warmest Month
bio06Min Temperature of Coldest Month
bio07Temperature Annual Range (BIO5-BIO6)
bio08Mean Temperature of Wettest Quarter
bio09Mean Temperature of Driest Quarter
bio10Mean Temperature of Warmest Quarter
bio11Mean Temperature of Coldest Quarter
bio12Annual Precipitation
bio13Precipitation of Wettest Month
bio14Precipitation of Driest Month
bio15Precipitation Seasonality (Coefficient of Variación)
bio16Precipitation of Wettest Quarter
bio17Precipitation of Driest Quarter
bio18Precipitation of Warmest Quarter
bio19Precipitation of Coldest Quarter
Topographic variablesPendSlopeSRTM
ElevElevation
AspectLand aspect
Edaphic variablesSandSandSoilgrid
ClayClay
LimoSilt
NitrogenoNitrogen in the soil
CecCation exchange capacity
SocSoil organic carbon
Table 2. Probable areas for the distribution of Cinchona spp. according to Peruvian departments.
DepartamentUnsuitableLow SuitabilityModerate SuitabilityHigh Suitability
Km%Km%Km%Km%
Amazonas13,861.6035.626855.0017.614032.5110.3614,168.5436.41
Ancash30,777.4687.072760.617.811250.053.54561.851.59
Apurimac5607.0026.568978.8342.532940.6013.933587.7216.99
Arequipa60,423.51100.000.000.000.000.000.000.00
Ayacucho28,100.5964.597719.9017.754911.7011.292771.636.37
Cajamarca5328.8616.2211,804.1735.946420.3819.559290.5628.29
Callao19.58100.000.000.000.000.000.000.00
Cusco29,287.9340.6314,873.3020.646621.219.1921,293.7129.54
Huancavelica13,454.7860.984595.3520.832590.3111.741424.606.46
Huanuco12,369.9633.259379.7525.215104.9913.7210,345.8327.81
Ica19,825.18100.000.000.000.000.000.000.00
Junin8835.4920.0815,590.7035.448779.6719.9610,791.4324.53
La Libertad15,040.7461.836452.7626.522052.498.44781.653.21
Lambayeque12,532.2892.87673.654.99191.111.4296.710.72
Lima33,599.4799.7584.450.250.000.000.000.00
Loreto355,021.5096.807758.302.122970.350.811016.610.28
Madre De Dios72,298.3166.3726,544.9024.375914.255.434174.473.83
Moquegua15,510.31100.000.000.000.000.000.000.00
Pasco6551.3133.918013.6541.484752.9224.600.000.00
Piura26,521.0778.274512.7413.322421.307.15430.671.27
Puno47,434.0473.746327.839.844392.376.836167.769.59
San Martin12,689.6224.9014,788.3429.028879.5817.4214,603.7228.66
Tacna14,609.62100.000.000.000.000.000.000.00
Tumbes3923.6694.85212.975.150.000.000.000.00
Ucayali92,285.0789.066353.106.132938.022.842040.451.97
Total935,908.9473.07164,280.3012.8377,163.816.02103,547.898.08
Table 3. Quantification of probable areas for future projection of Cinchona spp. according to climate change scenarios.
Climatic ModelRCPYearUnsuitableLow SuitabilityModerate SuitabilityHigh Suitability
Km2%Km2%Km2%Km%
MPI-ESM-LR8.52050887,610.7470.31154,305.4312.2275,749.806.00144,812.3311.47
2070915,828.9972.54136,222.1310.7976,159.436.03134,281.4010.64
HadGem2-Es2050856,788.4067.86166,305.3713.1788,489.027.01150,925.4311.95
2070854,821.2467.71164,256.6713.0180,335.066.36163,112.9612.92
Access 1.02050881,473.6169.71142,311.0611.2582,134.196.50158,625.0112.54
2070875,345.8169.34155,740.8112.3484,643.806.70146,691.0411.62
MPI-ESM-LR4.52050861,742.4768.26163,697.7712.9782,076.256.50154,988.4012.28
2070885,413.1670.12154,516.7212.2480,853.396.40141,856.8611.23
HadGem2-Es2050860,090.6968.12167,517.5313.2783,209.736.59151,781.2912.02
2070857,099.6867.89163,598.6712.9688,834.587.04153,002.1012.12
Access 1.02050882,769.2869.92152,931.7812.1184,630.406.70142,185.1511.26
2070861,766.0068.26164,886.5413.0687,146.926.90148,705.6411.78
Disclaimer/Publisher’s Note: The statements, opinions and data contained in all publications are solely those of the individual author(s) and contributor(s) and not of MDPI and/or the editor(s). MDPI and/or the editor(s) disclaim responsibility for any injury to people or property resulting from any ideas, methods, instructions or products referred to in the content.

