Article

Technical Feasibility for the Boosting of Positive Energy Districts (PEDs) in Existing Mediterranean Districts: A Methodology and Case Study in Alcorcón, Spain

by
Martina Dell’Unto
1,*,
Louise-Nour Sassenou
1,2,
Lorenzo Olivieri
1,2 and
Francesca Olivieri
1
1
Department of Construction and Technology in Architecture, Escuela Técnica Superior de Arquitectura, Universidad Politécnica de Madrid, Av. de Juan de Herrera 4, 28040 Madrid, Spain
2
Instituto de Energía Solar, Universidad Politécnica de Madrid, Av. Complutense 30, 28040 Madrid, Spain
*
Author to whom correspondence should be addressed.
Sustainability 2023, 15(19), 14134; https://doi.org/10.3390/su151914134
Submission received: 27 July 2023 / Revised: 15 September 2023 / Accepted: 21 September 2023 / Published: 24 September 2023
(This article belongs to the Special Issue Energy Transition in the Urban Environment)

Abstract

:
The deployment of Positive Energy Districts (PEDs) is currently facing a set of diverse and complex challenges, mainly arising from their novelty and the lack of practical experience. In that sense, there is a clear need for translating concepts and strategies into instruments that support the design, planning and operation of PEDs. The present research aims to address this gap by introducing a methodology to assess the potential of an existing district to be converted into a PED in the specific context of Mediterranean cities, which, in addition to presenting similar climatic characteristics, share a common urban pattern and culture. The first step consists of analyzing the initial state of the district through the study of its bioclimatic and urban characteristics and estimation of its energy demand. Then, the second step allows for selecting and designing a set of passive and active strategies for the district. Finally, the technical feasibility of the scenario is evaluated by calculating its annual energy balance. The methodology is applied to a district of Alcorcón, Spain. Results show that the selected district could achieve an annual surplus of 4 GWh and, therefore, has the technical potential to be converted into a PED.

1. Introduction

Today, cities, which occupy only 3% of the earth’s surface, are responsible for up to 75% of primary energy consumption and about 60% of Greenhouse Gas (GHG) emissions [1].
Despite this alarming data, anthropocentric emissions are not decreasing to the levels established in the Paris Agreement [2].
In this sense, many initiatives promoted by the EU are currently underway in this context to mitigate emissions in urban areas, among others, including the Green Deal [3], the Sustainable Development Agenda [4], the Renovation Wave [5], or the REPowerEU Plan [6].
Another key initiative in the transformation of cities is the European Strategic Energy Technology Plan (SET Plan) [7], which is the reference strategy to accelerate the transition to a low-carbon energy system. Action 3.2, ‘Smart cities and communities,’ focuses on stimulating the energy transition of cities. Supporting its main city transformation goals in this plan is the objective to drive and support the planning, deployment, and replication of 100 Positive Energy Districts (PEDs). In the SET Plan, PEDs are defined as a tool that can accelerate the transition of the cities.
Urban Europe [8] defines PEDs as energy-efficient and flexible urban areas that produce net zero or positive greenhouse gas emissions and actively manage an annual surplus production of renewable energy at the local or regional level. They require the integration of different systems and infrastructures and interaction between buildings, users, and regional energy, mobility, and ICT systems while optimizing the livability of the urban environment in line with social, economic, and environmental sustainability. EERA JP Smart Cities [9] further establishes a classification of four different categories of PED types [10], separated according to the positive balance that they can achieve in the selected District: Autonomous, Dynamic, Virtual and Pre-PED.
Due to the high ambitions and scope of the PEDs in the energy transition, they have been recognized by the EU as one of the key and pioneering strategies to lead cities in the energy transition and decarbonization in the coming years [11,12]. However, these models are still emerging precisely because of this high level of ambition, presenting several limitations and barriers to boosting their deployment. In fact, the number of PEDs in operation is still very low [13]. This can be explained by a lack of practical methods and tools to support the design, implementation, and operation of PEDs [14]. In fact, although there are several initiatives to promote these models [15,16,17,18], there is a lack of a single methodological structure [19] for the development of instruments that can help municipalities know and understand the potential for transition to PEDs in their territory and, consequently, to be able to promote this transformation. This article proposes a methodology that can be used to estimate the feasibility and effectiveness of PED transition, which can inform municipalities’ and stakeholders’ decisions.
The methodology also takes into account factors that are not usually considered in others [14], such as the climatic and urban characteristics of the district analyzed and the proposal of bioclimatic strategies for demand reduction.
In this way, it is hoped that this methodology will be replicable in other Mediterranean cities to create a common tool for this area that shares similar characteristics in terms of climate, construction, and culture. To verify its performance, this methodology has been validated through its application in a case study of Alcorcón, and it has also been defined in consideration of the tools developed so far [11,12,20] to integrates possible gaps for the intended purposes.
For a better understanding of the methodology, the article has the following structure: First, Section 2 explains the methodology at a theoretical level, allowing a general understanding; Section 3 presents the results of the validation of the methodology in the case study; Section 4 presents the discussion where the results are applied to a more general context, the limits of the methodology, and the future lines of research are discussed; and finally, Section 5 presents the conclusions of the research.

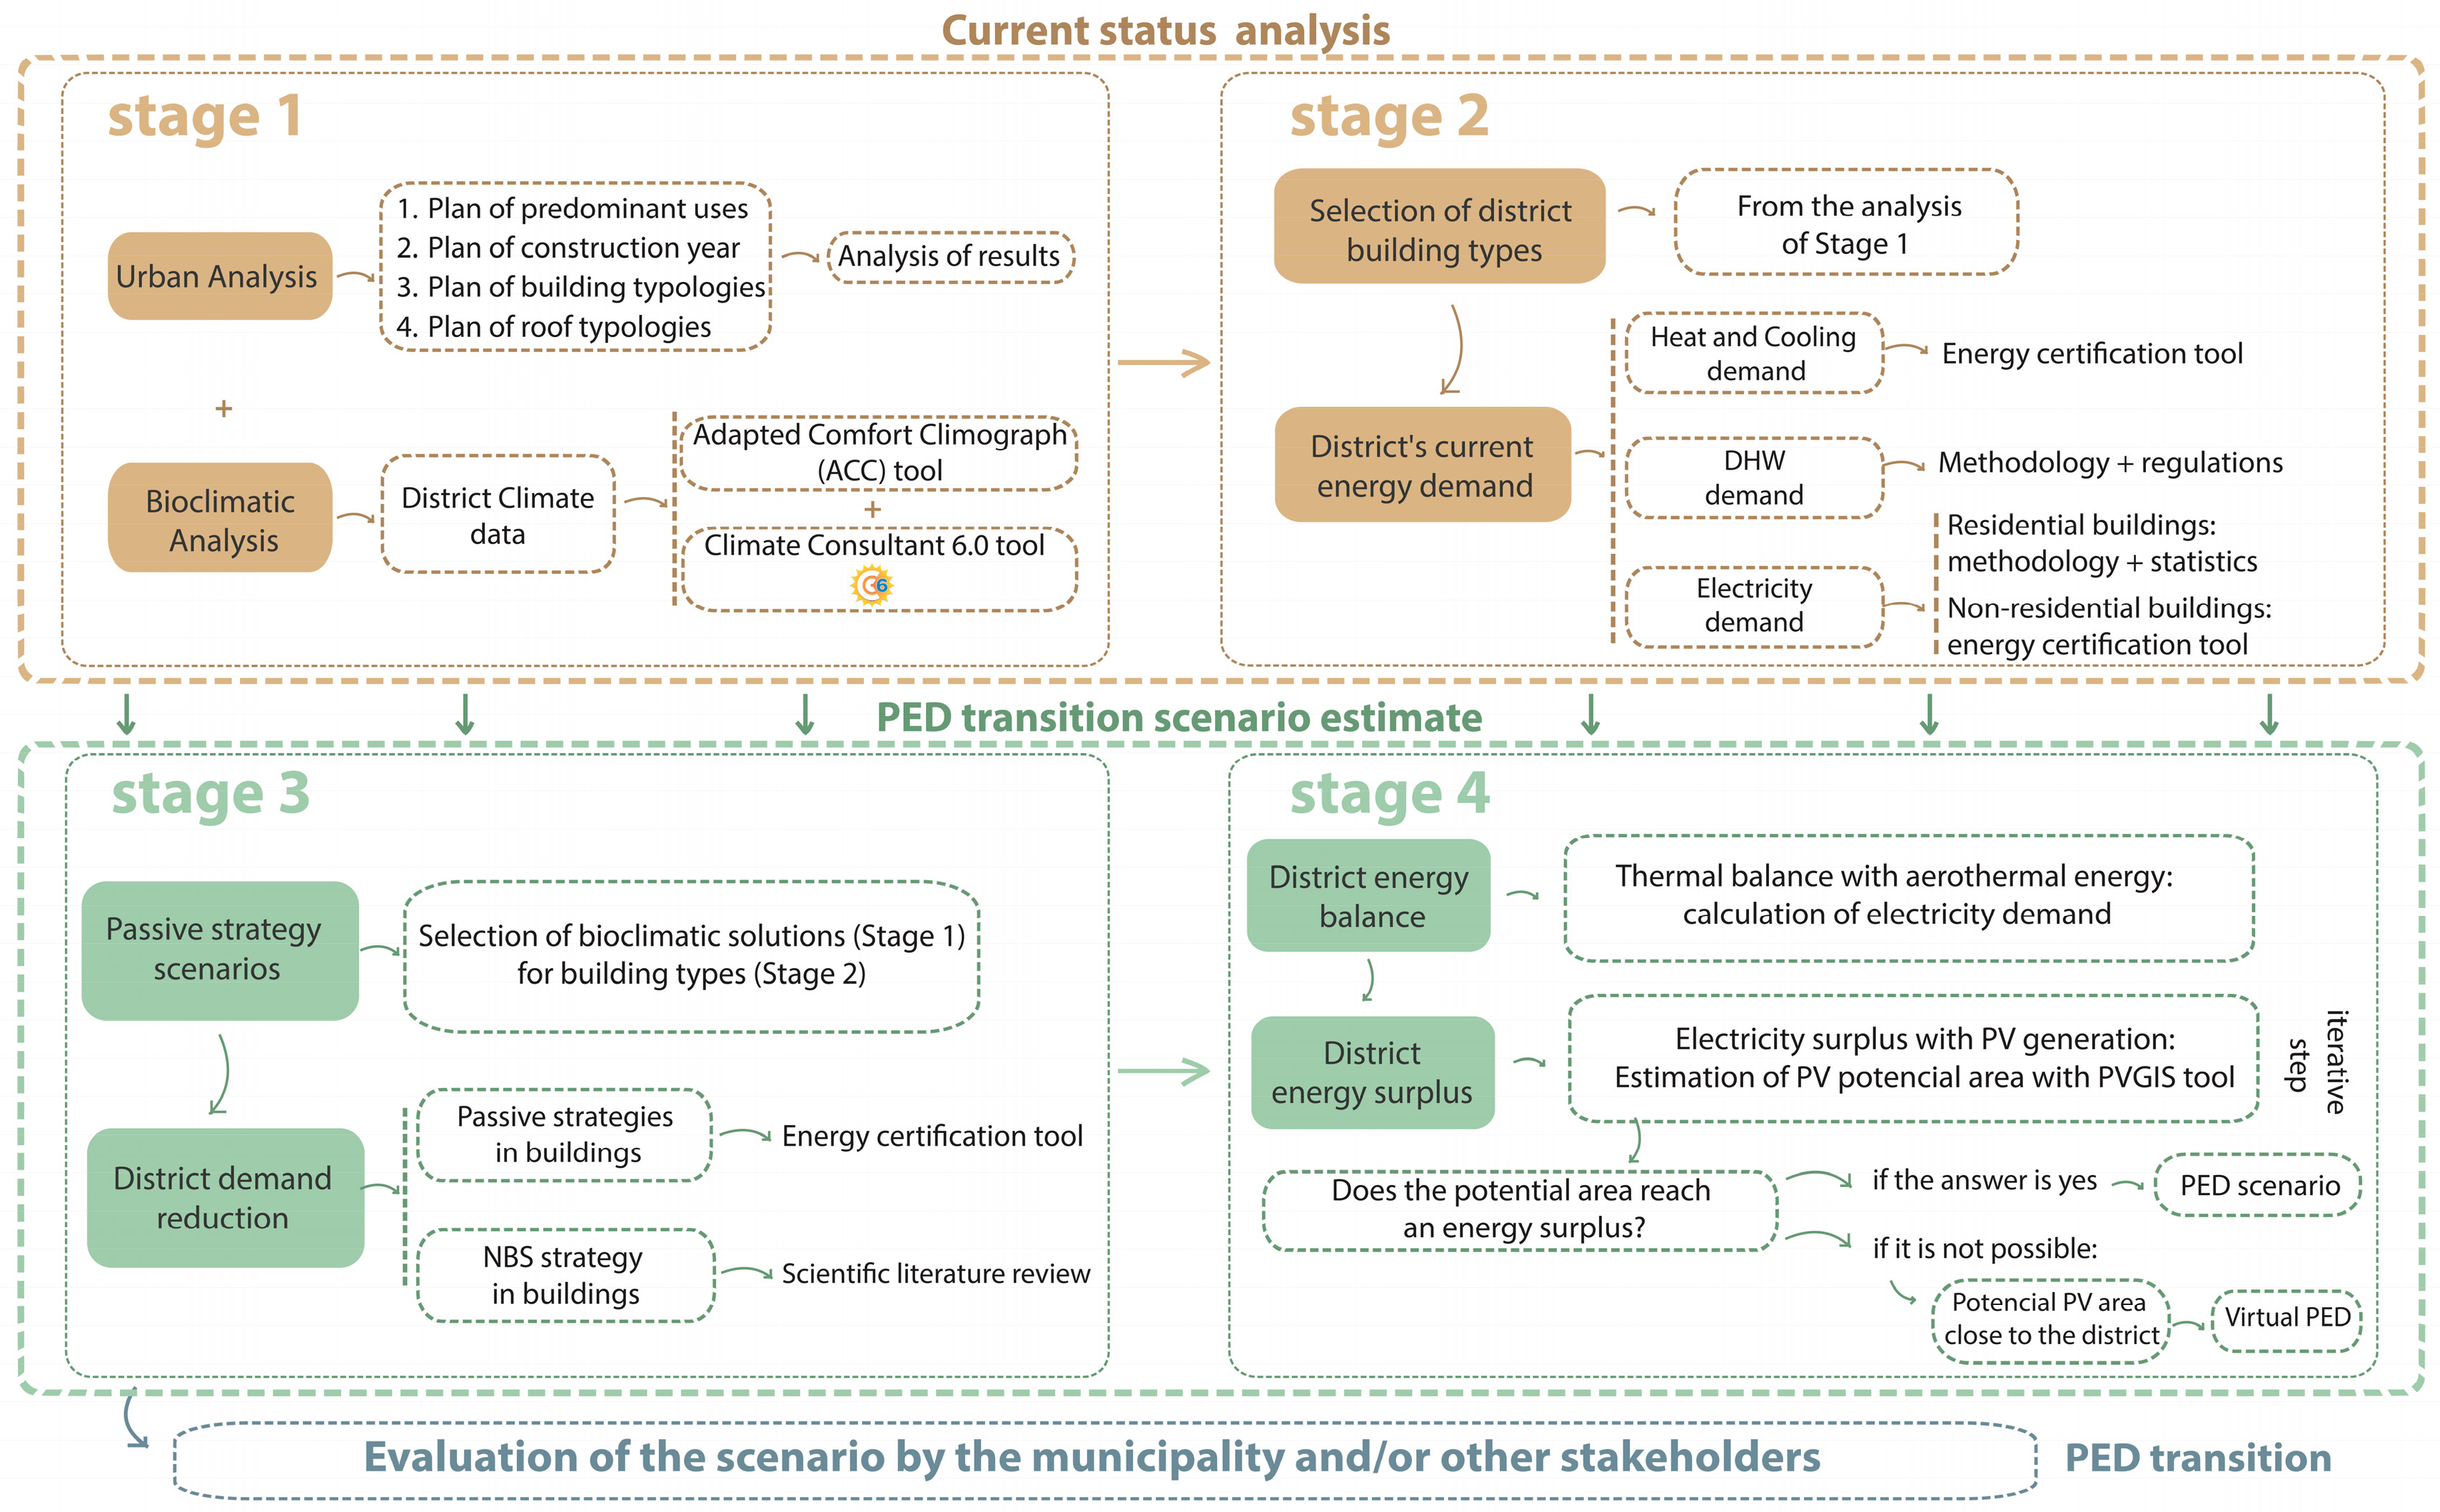
2. Material and Methods

The transition of an existing district to a PED can be achieved by implementing strategies focused on improving its energy characteristics, with the objective of producing more energy than is consumed within the district boundaries [10].
The presented methodology allows for the assessment of the potential of an existing district to become a PED and proposes a scenario of improvement strategies that can be brought to the district for its transition.
The methodology follows a multi-step process (Figure 1) in which the different facets of the transition to a PED [7] are analyzed. Once the district is selected, the methodology is used to first perform an urban analysis of the environment of the district, followed by a climate and bioclimatic analysis to adapt the solutions to its climatic and urban characteristics (Stage 1). Subsequently, the energy demand of the district in the current situation is calculated (Stage 2) to identify passive proposals for demand reduction (Stage 3). Then, the potential energy balance and surplus generated by the active strategies implemented in the PED transition scenario are estimated (Stage 4).
This methodology has been validated through its application to a real case study in a mixed-use district in the Spanish municipality of Alcorcón.

2.1. Stage 1: Urban and Bioclimatic Analysis

The first step of this methodology consists of analyzing the urban environment and the climatic and bioclimatic conditions of the neighborhood to identify its main characteristics and energy needs.
The urban environment is a complex and heterogeneous system composed of numerous materials, geomorphologies, and devices [21]. This determines the need to analyze it to define its real needs. In addition, the continuous modification and impermeabilization of soil in cities is generating unexpected effects on the climate, such as the urban heat island [22]. These effects prove that the urban context and local climatic phenomena can influence the energy analysis of the environment. For this reason, the methodology first analyzes the urban environment of the district in transition to a PED in order to identify the main urban characteristics and needs. Subsequently, the environment is analyzed bioclimatically to determine the energy strategies adapted to the climatic context of the district.

2.1.1. Urban Analysis

The transition from an existing district to a PED requires a first analysis of the existing urban characteristics to determine the most viable transition scenario in this territory. In that sense, the first step of methodology aims to characterize four main features of the different district’s buildings: the predominant use, the age of construction, the typology of the buildings, and the roofs. The definition of these features will provide an estimate of the district’s energy demand.
In this methodology, it has been possible to visualize and determine these features through the realization of four urban plans:
  • Predominant uses: The identification of the main category of use of a building (e.g., mixed-use, residential, industrial, commercial) facilitates the definition of the district’s energy demand and the selection and design of possible intervention strategies for its reduction.
  • Construction year: Many characteristics of a building depend on its year of construction. In particular, the building’s age can indicate a good deal about its materials and construction techniques that can influence its energy demand [23].
  • Building typologies: Architectural forms and typologies can influence the correct use of environmental resources, such as sun and wind, etc., and building heights can also impact other neighboring buildings, e.g., with their shade.
  • Roof typologies: The analysis of the building’s roof identifies areas and can provide estimates for their potential for renewable energy and green roof installation.
These plans are carried out with the support of the various instruments of urban planning control available in the country of the area under analysis. They can provide information on the territorial characteristics of the district.
Once the urban environment analysis plans have been made, they are analyzed to define the main characteristics of the district. The usefulness of this analysis of the urban environment will be discussed in the next steps of the methodology (Stages 2, 3, and 4).

2.1.2. Bioclimatic Analysis

A bioclimatic analysis is the study of climatic and environmental data of an urban area to define and minimize energy needs throughout the year and reduce conventional energy consumption [24]. This analysis connects the study of the climatic conditions of an area (e.g., solar radiation, wind, temperature, and relative humidity) with the thermal comfort conditions of its inhabitants. The methods and tools used to execute the bioclimatic analysis are described below.
  • District climate data:
Climate zones help to understand the climate and provide a framework for analyzing a range of environmental and socio-economic data and phenomena [25]. By determining a particular climate zone, it is possible to define systems or strategies to be implemented in buildings to achieve a situation of well-being for the inhabitants.
The classification system used in this methodology is the Köppen-Geiger [26], as it is currently the most widely used classification system [25]. Once the climatic zone is identified and a general idea of the climatic framework of the area is obtained, a further detailed climatic analysis of the district is carried out by defining air temperature, relative humidity, rainfall, and wind speed. This data will support the next step of this stage.
2.
Bioclimatic climograph
The bioclimatic climograph is a graph that relates the comfort of people to the meteorological data of the region, such as temperature, humidity, air velocity, solar radiation, etc.
Currently, the most popular climographs are those of Olgyay [24] and Givoni [27]. The Olgyay climograph makes it possible to identify a person’s comfort zone according to temperature, humidity, metabolic activity (met unit), and thermal insulation of clothes (clo unit), while the Givoni climograph helps to define passive strategies by using zones defined on a psychrometric chart. To combine the advantages of the two climographs, the bioclimatic analysis proposed in this methodology is based on the Adapted Comfort Climograph (ACC) [28], which combines the advantages of the two climographs, Olgyay and Givoni, complemented by Climate Consultant 6.0 software [29].
The aim of the ACC is to support the determination of site-adapted passive strategies to improve the performance of buildings and mitigate the urban microclimate of the district. This climograph for the definition of the comfort zones is based on the local population (genetic footprint), the climate of the site, the thermal insulation of clothes, the metabolic activity of the users, the indoor temperature of the building surfaces and the internal loads (equipment use, occupancy, and activity) [30]. The result of this combination of data is a climograph indicating two comfort zones and other zones indicating the passive strategies necessary to achieve the comfort state of the users.
Climate Consultant 6.0 [31] is commonly used in the climate analysis of a site for passive building design. This tool is based on climate data from Energy Plus Weather (EPW) [32]. The results of these combinations of data define a psychrometric chart in which a set of passive design strategies can be identified with the number of hours they have to be used to achieve indoor comfort. Another result of this tool is the definition of a list of design guidelines and actual passive strategies applicable to the analyzed area [33]. These strategies will improve the performance of the buildings in the different seasons and optimize the well-being of the inhabitants.
The results of this stage will be used in Stages 3 and 4 of the methodology to support the identification and selection of passive and active strategies.

2.2. Stage 2: Calculation of the Energy Demand of the District in the Current Situation

In order to estimate a PED transition scenario, an energy framework of the initial state of the district needs to be established. This value is obtained by estimating the energy demand of the existing buildings. It must be considered that PEDs vary greatly in terms of surface area and number of buildings [10]. Therefore, for large and densely built PEDs, it may not be feasible to calculate the initial energy demand of the districts on a building-by-building basis [21]. In that context, the most adequate and accurate method is to rely on already estimated data on consumption or demand in the selected area, sometimes directly provided by municipalities and/or energy distributors.
In case some of the data are not available, this methodology proposes a calculation method to estimate the energy demand of buildings.
The energy demand is calculated according to the steps indicated in Figure 1 and described below.
In order to calculate the energy demand, it is first necessary to select typical buildings (BT) in the district through the urban analysis of Stage 1. Then, the total energy demand is calculated and subdivided into heating (TDHeat), cooling (TDCool), Domestic Hot Water (DHW) (TDDHW), and electricity (DED). The heating (DHeat) and cooling (DCool) estimate is calculated with the support of the energy certification tool available in the country of the district. These types of tools allow estimating the thermal demand for heating and cooling of typical buildings by expressing values in kWh/m2. Once these estimated values are obtained for each building (BT1, BT2, BTn…), they are multiplied by the total m2 of the buildings corresponding to the calculated typology. These values are added together to obtain the total heating and cooling demand.
TDHeat = DHeatBT1+ DHeatBT2+ DHeatBTn
TDCool = DCoolBT1+ DCoolBT2+ DCoolBTn
Subsequently, the DHW total demand (TDDHW) is calculated according to the regulations of the country of the district. For reference, in the case study, the technical guide [34] used considers the DHW consumption at 60 °C (ConsDHW) and multiplied it by the Stocking Density (SD).
TDDHW = ConsDHW × SD
In the residential case, the SD is estimated from the m2 of a dwelling. In the case of non-residential buildings, the SD may again be possible to obtain from the country’s regulations; in the case of Spain, for example, it is found in the DB SI [35].
The Electricity Demand (DED) is then calculated. This estimate includes, on the one hand, Public Lighting Demand (PLD) and, on the other hand, the demand for residential and non-residential buildings. The estimation of the PLD is obtained from statistical data on lighting in the municipality. This is common information in municipalities. For residential buildings, the demand has been estimated considering the methodology proposed in the article [11] combined with statistical household appliance consumption data for the country under analysis [36]. In the study described in [11], the following calculation is considered for the electrical demand for light (DEDlight) and ventilation (DEDvent):
DEDlight = m2 × SpecEEN
DEDvent = m2 × SpecEEN
As referenced in the same article, for the specific electrical energy needs (SpecEEN), average data from the INSPIREFP7 D2.1 project [37] and TABULA [38] are chosen. In these projects, it has been estimated that the specific electrical energy needs for lighting are 5 kWh/m2 per year and for ventilation between 1, 3, and 5.5 kWh/m2 per year.
Once the two values have been calculated, they are added together to calculate the District Residential Electricity Demand for lighting and ventilation (DEDlight+vent) using the following formula:
DEDlight+vent = DEDlight + DEDvent
In order to make the calculation more realistic, in this methodology, it has been necessary to estimate the demand coming from household appliances. This value is difficult to estimate since the data depends on the occupants’ habits.
For this reason, the statistical study of the consumption of household appliances in the residential sector in the country of the district is taken into consideration. In the case study, the statistical report “Consumption in the Residential Sector in Spain” carried out by the Eurostat Institute and the IDAE [36] have been consulted. This estimates a total consumption (ConsAppl) of 20 kWh/m2 per household. This value will be multiplied by the m2 of residential use in the district (DRS). Therefore, the formula for calculating the District’s Appliance Demand (DEDAppl) will be as follows:
DEDAppl = DRS × ConsAppl
The District Residential Electricity Demand (DEDRes) will then be calculated by adding the demand for lighting and ventilation and the demand for appliances. Therefore, the following formula will be used:
DEDRes = DEDlight+vent + DEDAppl
The purpose of this stage is to estimate the initial energy demand without having energy data available; for this reason, the resulting data will not be of high-resolution detail. Due to this low detail scale and the limited energy data available, we have used the methodology of [11] in which the:
Consumption ≅ Demand
For a more detailed analysis of the exact energy balance of the district, it is recommended to have higher-resolution data that can be provided by the municipality.The District Non-Residential Electrical Demand (DEDNRes) buildings can be estimated with the country’s energy certification tool, as without real estimated data, it is difficult to identify their demand. Once the value is obtained, as in the case of DHeat and DCool, the values are multiplied by the m2 of the buildings corresponding to the estimated typology (BT1, BT2, BTn…), and finally, the values are added together:
DEDNRes = EDNResBT1 + EDNResBT2 + EDNResBTn
Once the values of the electricity needs of residential buildings, non-residential buildings, and public lighting have been obtained, the values are added according to this formula for District Electricity Demand (DEDtotal):
DEDtotal = PLD + DEDRes + DEDNRes

2.3. Stage 3: Identification of Passive Strategies and Calculation of the Demand Reduction of the District

Passive strategies are defined as interventions aimed at improving the energy efficiency of buildings by acting on the building envelope to improve energy performance and, therefore, significantly reduce energy consumption [39].
The PED transition of an existing district will require a decrease in the demand for existing buildings to increase the energy efficiency of the local renewable energy systems. Consequently, the next step of the proposed methodology is to suggest passive strategy scenarios identified in the bioclimatic analysis (Stage 1) and estimate the reduction of energy demand.
The first step in this stage is to define which of the typical buildings in the district (Stage 2) are most suitable for intervention to reduce demand. Once the buildings have been defined, the most appropriate passive strategies for the type of intervention are selected. Then, again, using the energy certification tool used in Stage 2, the energy demand reduction obtained from the intervention scenarios is estimated.
In addition to the passive strategies defined in Stage 1, Nature-Based Solutions (NBS) can contribute to reducing the energy demand of buildings. Therefore, the reduction of energy demand through the installation of NBS [40] is also calculated. This estimate can be calculated by first analyzing the potential for NBS installation using the plan of roof typologies of Stage 1 and then estimating the reduction of energy demand due to these solutions. NBS are composed of elements that include many variables, such as plant type, substrate, and other climatic elements [41]. These variables make the estimation of the benefits more complex. For this reason, this methodology proposes an estimation through the analysis of the scientific literature published in the last ten years of experimental studies like the case study (similar climate and buildings).
Once the improvement scenarios for each building typology have been estimated, the total reduction in cooling (TDRCool) and heating demand (TDRHeat) in the district is quantified, thanks to the implementation of the strategies.

2.4. Stage 4: Calculation of Renewable Energy Generation Potential, Balance and Surplus of the PED Scenario

This stage focuses on the active renewable strategies to be installed and estimates the energy generated in the district.
The renewable energy that can be produced locally depends on the urban characteristics of the district and the energy transition policies of the country [42].
The Mediterranean countries have the greatest potential in Europe for the use of renewable energies in buildings. The most widely used renewable energy is solar energy, thanks to the hours of sunshine and the remarkable development of this business and industrial sector in these territories. However, other renewable sources such as aerothermal energy, geothermal energy, and biomass are currently being promoted [23].
For this reason, a number of factors have been taken into account before developing the methodology for estimating renewable energy generation:
  • The high electrification of the building stock in terms of thermal energy generation because of the high installation of heat pumps in recent years [23];
  • The future needs to install cooling systems in homes due to climate change [43] to reach a comfortable temperature in dwellings [23].
Given this background, this methodology has focused on an analysis of energy potential considering the most common renewable energy generation technologies in the Mediterranean countries: aerothermal energy for the generation of all thermal energy (heating, cooling, and DHW) and photovoltaic (PV) panels to generate electricity.
In Stage 4, the amount of electricity demanded by an aerothermal system to meet the district’s thermal demand balances was first estimated. This estimation can be achieved by starting from the COP [44] of an aerothermal. The COP expresses the ratio between the thermal energy, which is provided by a system, and the amount of electrical energy (EE) that would be necessary to generate it.
The COP of an aerothermal installation varies depending on the temperature to be supplied, the mode (heating or cooling) and the temperature of the source [11]. However, in order to simplify the pre-design calculations of the methodology, a conservative number has been taken into account among the possible range of values, using the COP value of 3 to calculate the electrical demand of this type of equipment, which makes it possible to consider a standard installation.
The COP is expressed by the following calculation:
COP = TD/EE = 3
Since the value of the thermal energy for heating and DHW is already known, the electrical energy has been estimated using the inverse equation:
EEHeat+DHW = TDHeat+DHW/3
In the same way, the electrical energy consumed by cooling can be estimated:
EECool = TDCool/3
The PV potential of the district is then analyzed using the Photovoltaic Geographical Information System (PVGIS) tool [45]. This is an iterative step until an energy balance and surplus of the district is achieved. The methodology first analyzes the rooftop potential of the district by estimating the collector surface using visualization tools such as Google Maps or Bing Maps. Once the total collector m2 is obtained, the photovoltaic generation is estimated by multiplying the PV energy production (PVEnergy Prod) with the collector area (CA) and then the value by the total m2 of the build-up district (TBDA).
PVGRoof = (PVEnergy Prod × CA)/TBDA
If the energy surplus has not been achieved only with the photovoltaic potential of the building roofs, the potential of other solutions can be estimated. Among other options, photovoltaic pergolas can be considered to be installed in green spaces such as parks or car parks.
PVG Urban area = (PV Energy Prod × CA)/TBDA
It is re-evaluated whether the PV generation is adequate to meet the district’s demand and whether it has an energy surplus to be a PED. If this is not possible, a Virtual PED [10] can be considered by having renewable energy sources close to the PED (TVA).
If it is a Virtual PED, the formula would be as follows:
PVGVirtual area = (PVEnergy Prod × CA)/TVA
Once the possible scenarios for the district under analysis have been estimated, the total surplus energy value and thermal energy balance are calculated.

3. Results

Once the district is identified, the methodology is validated by applying it to the case study of Alcorcón.
The selected district of Alcorcón presents from the beginning potential characteristics to be transformed into a PED.
In recent years, the municipality has promoted many renewable energy initiatives, and most of them are concentrated in an area of approximately 1 km2, which was defined as the case study district (Figure 2).
The actions carried out by the municipality of Alcorcón have been: PV installation in municipal buildings, NZEB retrofitting of public buildings and the promotion of a programme to foster energy communities in the municipality (informative workshops and adaptation of the regulatory framework).

3.1. Stage 1 Urban and Bioclimatic Analysis

The methodology starts with the urban analysis and its bioclimatic analysis of the selected district. The results derived from the Alcorcón case study are presented below.

3.1.1. Urban Analysis

The urban analysis allows for the methodology to provide a general framework of the main characteristics of the district under analysis. These characteristics make it possible to define the needs and assets of the district to consider in the pre-design of the PED. A similar study of urban characteristics is developed in the methodology of the PEDRERA project presented in the article [12]. However, this project does not consider the analysis of the potential of roofs for the installation of renewable energy.
Different tools have been used for this analysis as instruments of the territory. Firstly, the Territorial Information System (SIT Viewer) of the Community of Madrid was used to define the main uses of the districts. To identify the years of construction, the tool “Nomecalles-Nomenclator y Callejero de la Comunidad de Madrid” [46] was used. Finally, visualization tools such as Google Maps or Bing Maps were used to identify the typologies of the buildings and roofs.
The analysis of the urban environment shows that, firstly, the selected district has a mixed land use (Figure 3a), characterized as 31% residential (between single-family and multi-family housing), 32% equipment (schools, libraries, health centers, etc.), 19% green zones, 18% sports facilities, and a very small area of commercial and tertiary land.
Regarding the age of the buildings (Figure 3b), it can be observed that most of them (75%) were built between 1990 and 2006, which means that the buildings have the construction characteristics regulated by the Spanish “Norma Basica de la Edificación NBE-CT-79” [47]. This standard provided for the use of thermal insulation, although to a lesser extent than the current standard. This means that, in the event of having to renovate the buildings in the district, the thermal insulation of the building must be reinforced to reduce the demand.
Then, buildings have different typological characteristics (Figure 3c), which can be distinguished among two-story single-family houses, which represent 22% of the district’s land area, three-story residential buildings (17%), five to six-story blocks (32%), three-story equipment buildings (20%), two-story sports facilities (6%) and, finally, 2% of one or two-story commercial buildings.
Finally, thanks to Figure 3d, it is possible to observe that only 26% of the roof areas in the district will be suitable for a green roof system, and the remaining 74% will be suitable for a renewable energy generation system such as PV.

3.1.2. Bioclimatic Analysis

A bioclimatic analysis makes it possible to define the district’s potential needs according to its climatic situation. There are still few PED transition methodologies that consider the climate factor. The methodology proposed by the Making City MAKING-CITY project [11], for example, only considered the current energy performance of the district under analysis and seeks to improve the district’s buildings through passive strategies to reduce the current energy demand. In another research work [20], a bioclimatic analysis was carried out for the transition to a Zero Energy District (ZED).
Stage 1 of the proposed methodology for the case of Alcorcón allows for the selection of possible passive strategies that could be adapted to the typologies of buildings present in the district. This preliminary selection of bioclimatic strategies will support Stage 3 in defining a PED transition scenario that includes passive strategies to reduce the district’s demand.
The results of the analysis in the case study are detailed below:
  • District climate data:
Alcorcón has a continental Mediterranean climate (Köppen Csa climate classification). Winters reach an average temperature of 4.8 °C and summers 26 °C. The maximum relative humidity is in December at 77% and the lowest in July at 28%. Annual rainfall is 415 mm, with the heaviest months being October, November, and December [48]. The months with the most wind are January and February, with a westerly direction, and the month with the least wind is July [49].
  • ACC Climograph:
The ACC Climograph analyzes the bioclimatic conditions of Alcorcón in the different seasons of the year in order to identify the most suitable improvement strategies for this environment.
According to the ACC Climograph, the bioclimatic strategies in winter (Figure 4a) for the municipality of Alcorcón are primarily the capture of solar radiation and the use of the thermal mass. Likewise, for this climate, it is necessary to provide active heating systems in the more frigid months.
In the spring-fall (Figure 4b), solar gain and thermal mass are still necessary, especially in colder months, such as March and April. In May and October, solar gain and thermal mass will be needed to compensate for the cold at night, the warmer midday hours will require solar shading, and the evening hours will be able to achieve comfort with the internal loads.
Finally, in summer (Figure 4c), during the hottest hours of the day, it is necessary to shade the façade openings. The hottest days in July will require measures to humidify the environment. Likewise, in the summer months, climate change is a factor that must be considered, as this phenomenon is exponentially raising temperatures. With this scenario, night ventilation solutions, thermal mass, and evaporative cooling should also be provided for the hottest months of the year, July and August.
  • Climate Consultant:
Finally, for the bioclimatic analysis, the Climate Consultant software has been used to define in more detail the strategies to improve the neighborhood according to the climate of Alcorcón.
In the case of Climate Consultant, to estimate the strategies, the EPW data of Madrid is used, and it is selected the “ASHRAE Standard 55 and Current Handbook of Fundamentals Model” [50]. The resulting psychrometric chart is shown in Figure 5:
The chart shows that in the winter and during the coldest months of spring-autumn, direct solar radiation and thermal mass are recommended as passive strategies for a total of 1507 h per year. Internal gains were also suggested for a total of 1975 h per year and heating for a total of 3226 h per year. In the summer and during the hottest months of spring-autumn, shading of the façade openings is recommended for a total of 842 h per year, and the thermal mass of cold accumulation during the night.
The main strategies identified by Climate Consultant that can fit with the Alcorcón case study are orientation towards the utilization of solar gains; appropriate window glazing for winter solar gain, natural ventilation, and fans in summer, and conservation of the internal temperature by external insulation and internal thermal mass.
Finally, another factor considered is that the predominant orientation of the buildings in the district is North East–South West (NE-SW), which means that in summer and winter, the openings will have an unfavorable orientation [51]. This orientation will certainly influence the calculation of the heating and cooling demand of the buildings.

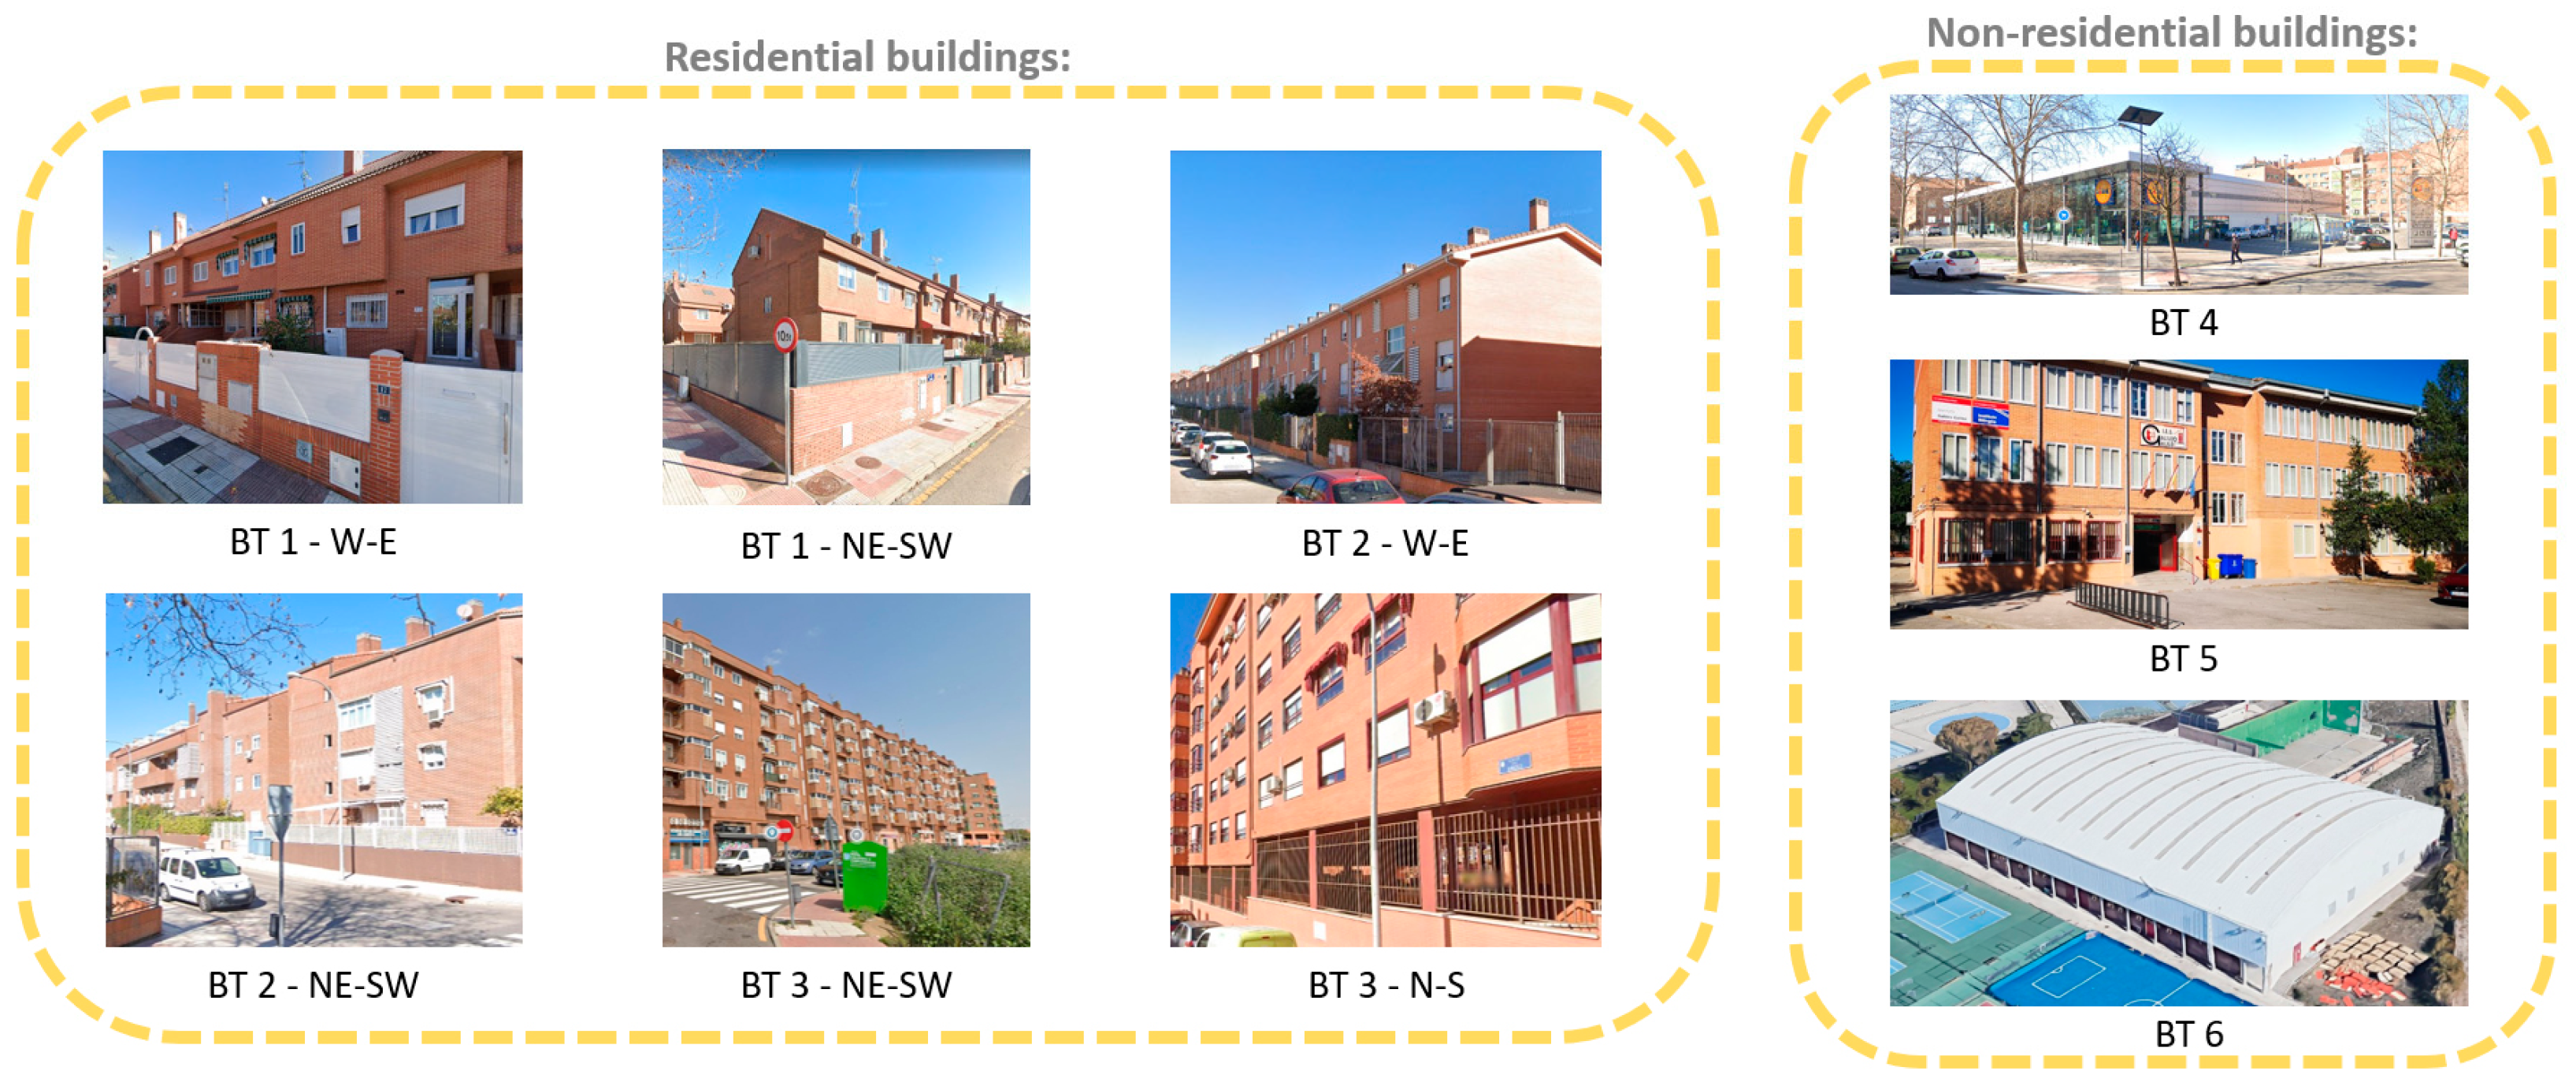
3.2. Stage 2: Calculation of the Energy Demand of the District in the Current Situation

First, in order to calculate the current energy demand of the district, district-type buildings (BT) are selected in order to consider the different characteristics that can define the energy needs of each building. This selection of buildings is based on use, years of construction, typology, and orientation. For this case study, a total of nine buildings are selected to represent the buildings present in the district (Figure 6).
The total results obtained in Stage 2 are specified in the following table, and the calculations are detailed below (Table 1):
For this stage, the methodology study carried out in the MAKING-CITY project [11] is taken into account and is complemented with other calculation tools to adapt the estimation to more factors that can influence the energy demand of a district, e.g., household appliances. Furthermore, the identification of building types in the district has helped to simplify the district estimation without omitting important elements that influence the energy demand of a building: orientation, year of construction, and building typology and use.

3.2.1. Estimation of Heating and Cooling Energy Demand

After selecting typical buildings in the district, the DHeat and DCool are estimated using the CE3X tool [52]. CE3X is an energy certification tool recognized by the Spanish Ministry for Ecological Transition and Demographic Challenge (MITECO) [53].
Once the most relevant data necessary for the calculation is inserted, the tool estimates the heating and cooling demand of the buildings. These results are multiplied by the total area of the same typology to identify the total demand generated by the district.
Finally, Equation (1) calculates the value of TDHeat, which corresponds to 52 GWh/year and Equation (2) calculates the value of TDCool, which corresponds to 10 GWh/year.
These values can be reduced through Stage 3 of the methodology and the passive strategies identified in Stage 1.

3.2.2. DHW Energy Demand

The DHW demand of the case study is calculated following the “Technical guide for central domestic hot water” of the IDAE [34].
Following Equation (3) with the values corresponding to the typology in the district, the TDDHW is obtained. The total value corresponds to 10 GWh per year.

3.2.3. Electric Energy Demand

In the case of Alcorcón, it is possible to estimate the Public Lighting Demand (PLD) thanks to a study carried out in 2021 by the same City Council [54]. In this study, they define the total annual consumption of lighting in the entire municipality, which corresponds to 6 GWh per year. Thanks to this baseline data, it is estimated that in the District, there is a total consumption of 704 MWh per year.
The residential electricity demand (DEDRes) is estimated using Equations (4)–(8) and is equivalent to a total of 15 GWh per year of total demand. It is interesting to note the difference in the results when including the consumption of household appliances in the estimation since the calculation without appliances is only 4 GWh per year.
On the other hand, the electricity demand of non-residential buildings (DEDNRes) is calculated using the CE3X tool and (10). The total electricity demand is 2 GWh per year.
With Equation (11), the total amount of electricity (DEDtotal) corresponds to 17 GWh per year. For the district to be a PED, this value must be exceeded by the renewable energy generated in the district. Furthermore, if this is not possible, areas close to the district could be identified for energy generation (Virtual PED).

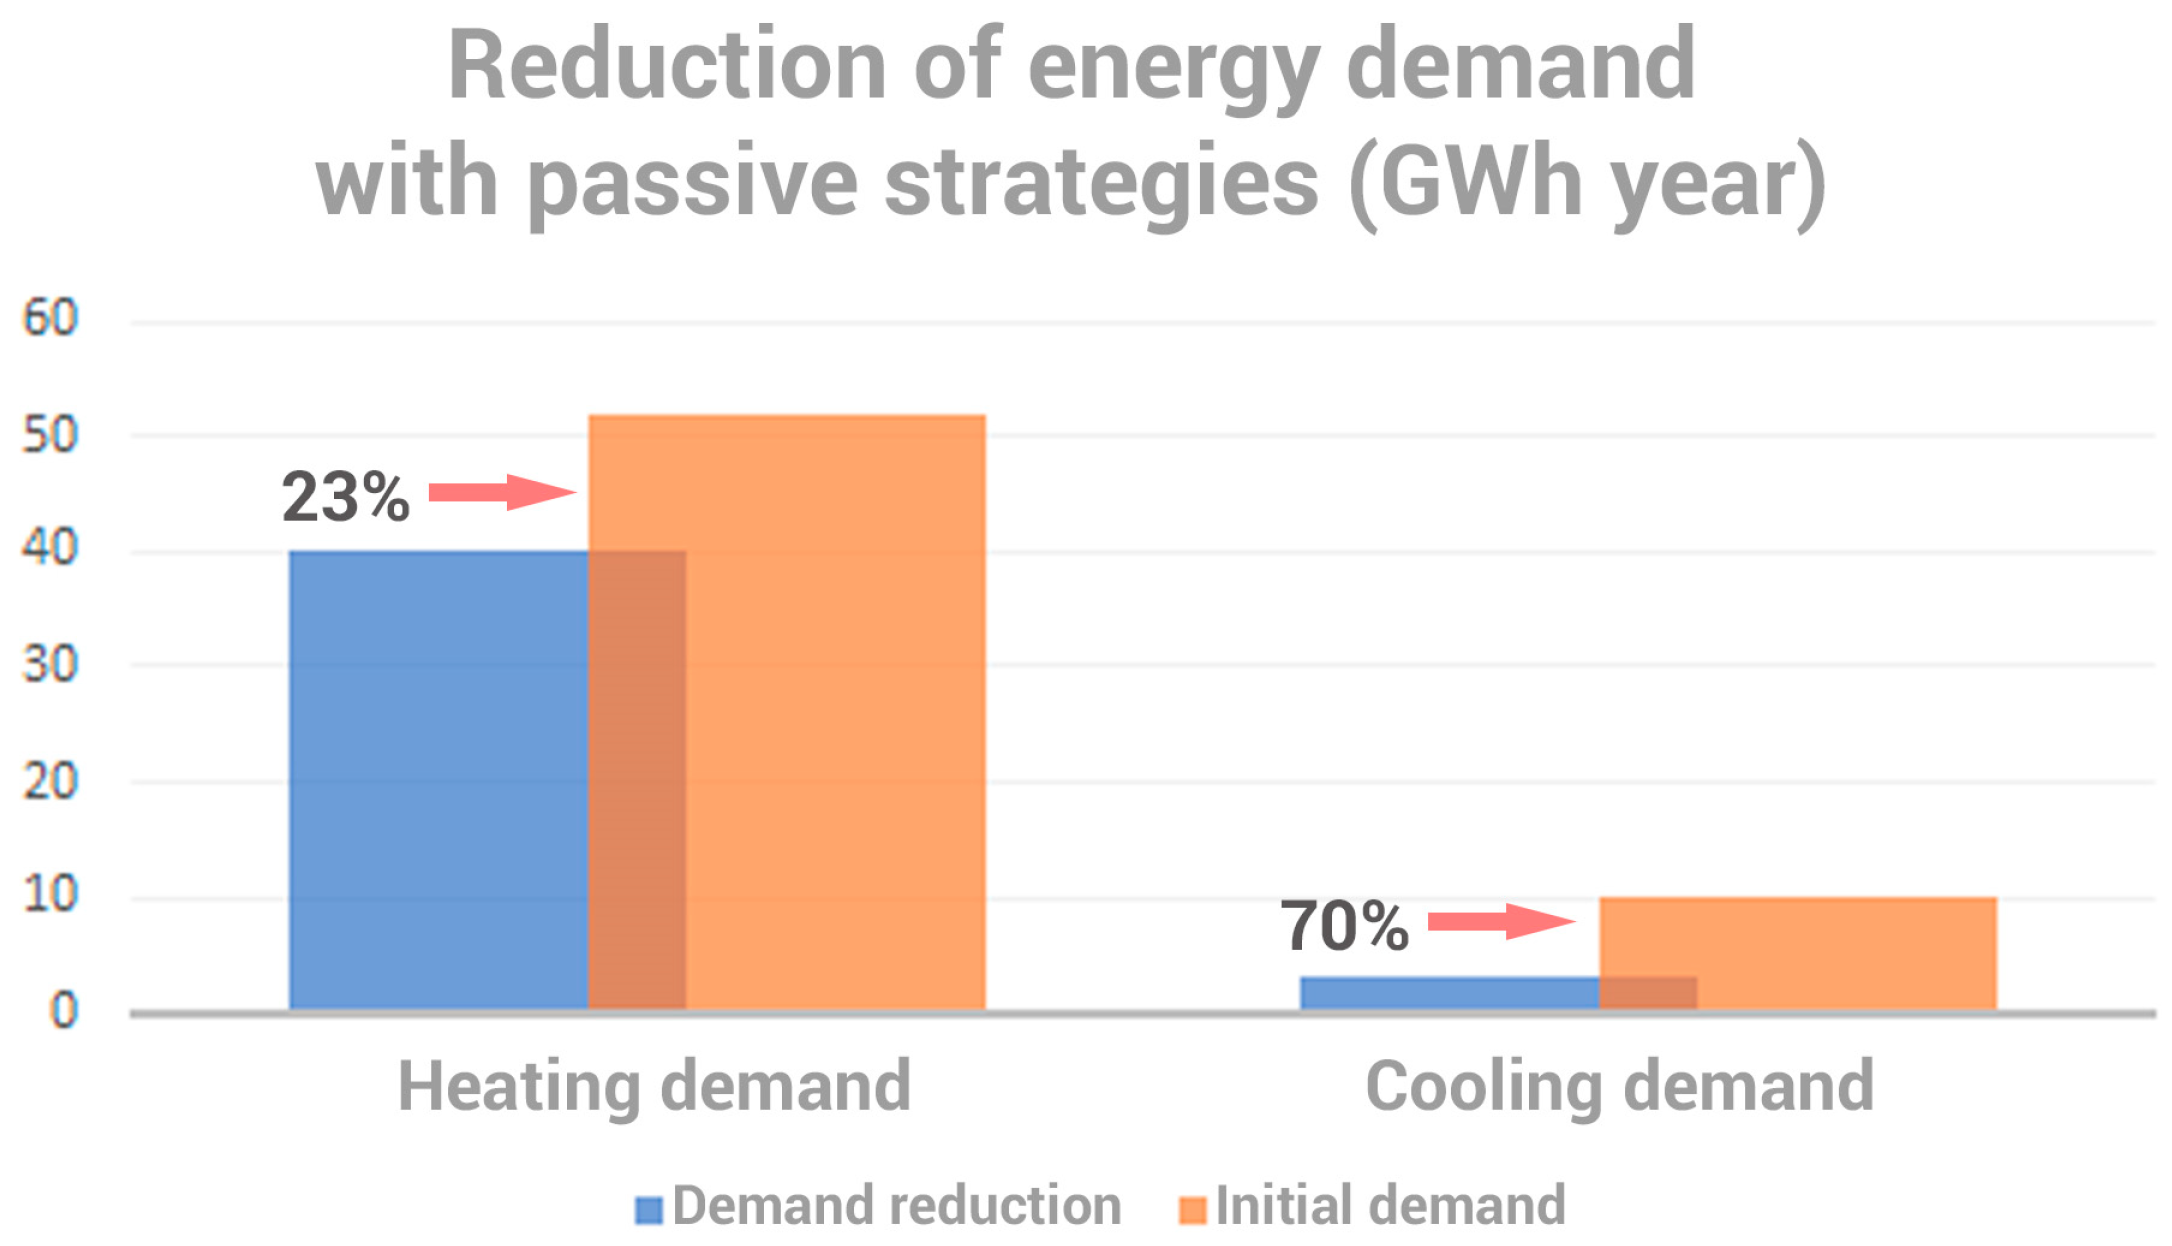
3.3. Stage 3: Identification of Passive Strategies and Calculation of the Demand Reduction of the District

This stage of the methodology estimates the reduction of the energy demand of the district’s buildings through passive strategies.
This approach was also used in the PEDRERA project [12], although it has a different analysis approach, as it proposes energy rehabilitation without prior bioclimatic analysis or considering NBS as a strategy. Likewise, this pre-design of passive strategies provides an estimate of the PED potential by obtaining more detail on the potential of the district. Moreover, by means of this methodology, the municipality can already have a clear idea of possible future lines of action to promote the transition of the districts towards PED models in its area.

3.3.1. Passive Strategies (PS) in Buildings

In order to quantify the reduction of demand in the district of Alcorcón, it is assumed that the most demanding and oldest residential buildings and equipment buildings have been renovated. In this remodel, PS are proposed to improve the facade windows, adding thermal insulation and solar protection for the windows, oriented to W, E, S and SW.
The demand reduction (DRHeat and DRCool) estimation is carried out using the CE3X tool, estimating the same buildings selected previously (Table 2).
Finally, with the application of these strategies, a total heating demand of 40,344,219 kWh/m2 per year and a cooling demand of 2,886,301 kWh/m2 per year have been obtained.

3.3.2. Nature-Based Strategy (NBS) in Buildings

For the estimation of the temperature reduction by these solutions, the following scientific articles are taken as a reference: [55,56,57,58]. These scientific articles quantify the demand reduction by means of “Living Wall” type green walls (heating demand reduction of 4.2% and cooling demand reduction of 58.94%) and extensive green roofs in Mediterranean climates (heating demand reduction 25% and cooling demand reduction 60%).
For this analysis, the flat roof surfaces of the district were taken into account, and it was assumed that all of them had an extensive type of green roof. For the green wall, the potential is also estimated, in this case only taking into account the equipment buildings, so that this solution can bring added aesthetic, environmental, and health benefits to the courtyards of schools and public buildings.
Applying the percentages of improvements for each NBS system, as defined by the scientific literature, the resulting total heating demand (TDRHeat) is 40,343,377 kWh/year, and the cooling demand (TDRCool) is 2,886,138 kWh/year.
In conclusion, with the application of PS and NBS, the total thermal demand of the district has been reduced by 23% in heating. Meanwhile, in summer, the cooling demand has clearly improved, reaching a savings of 70% (Figure 7).

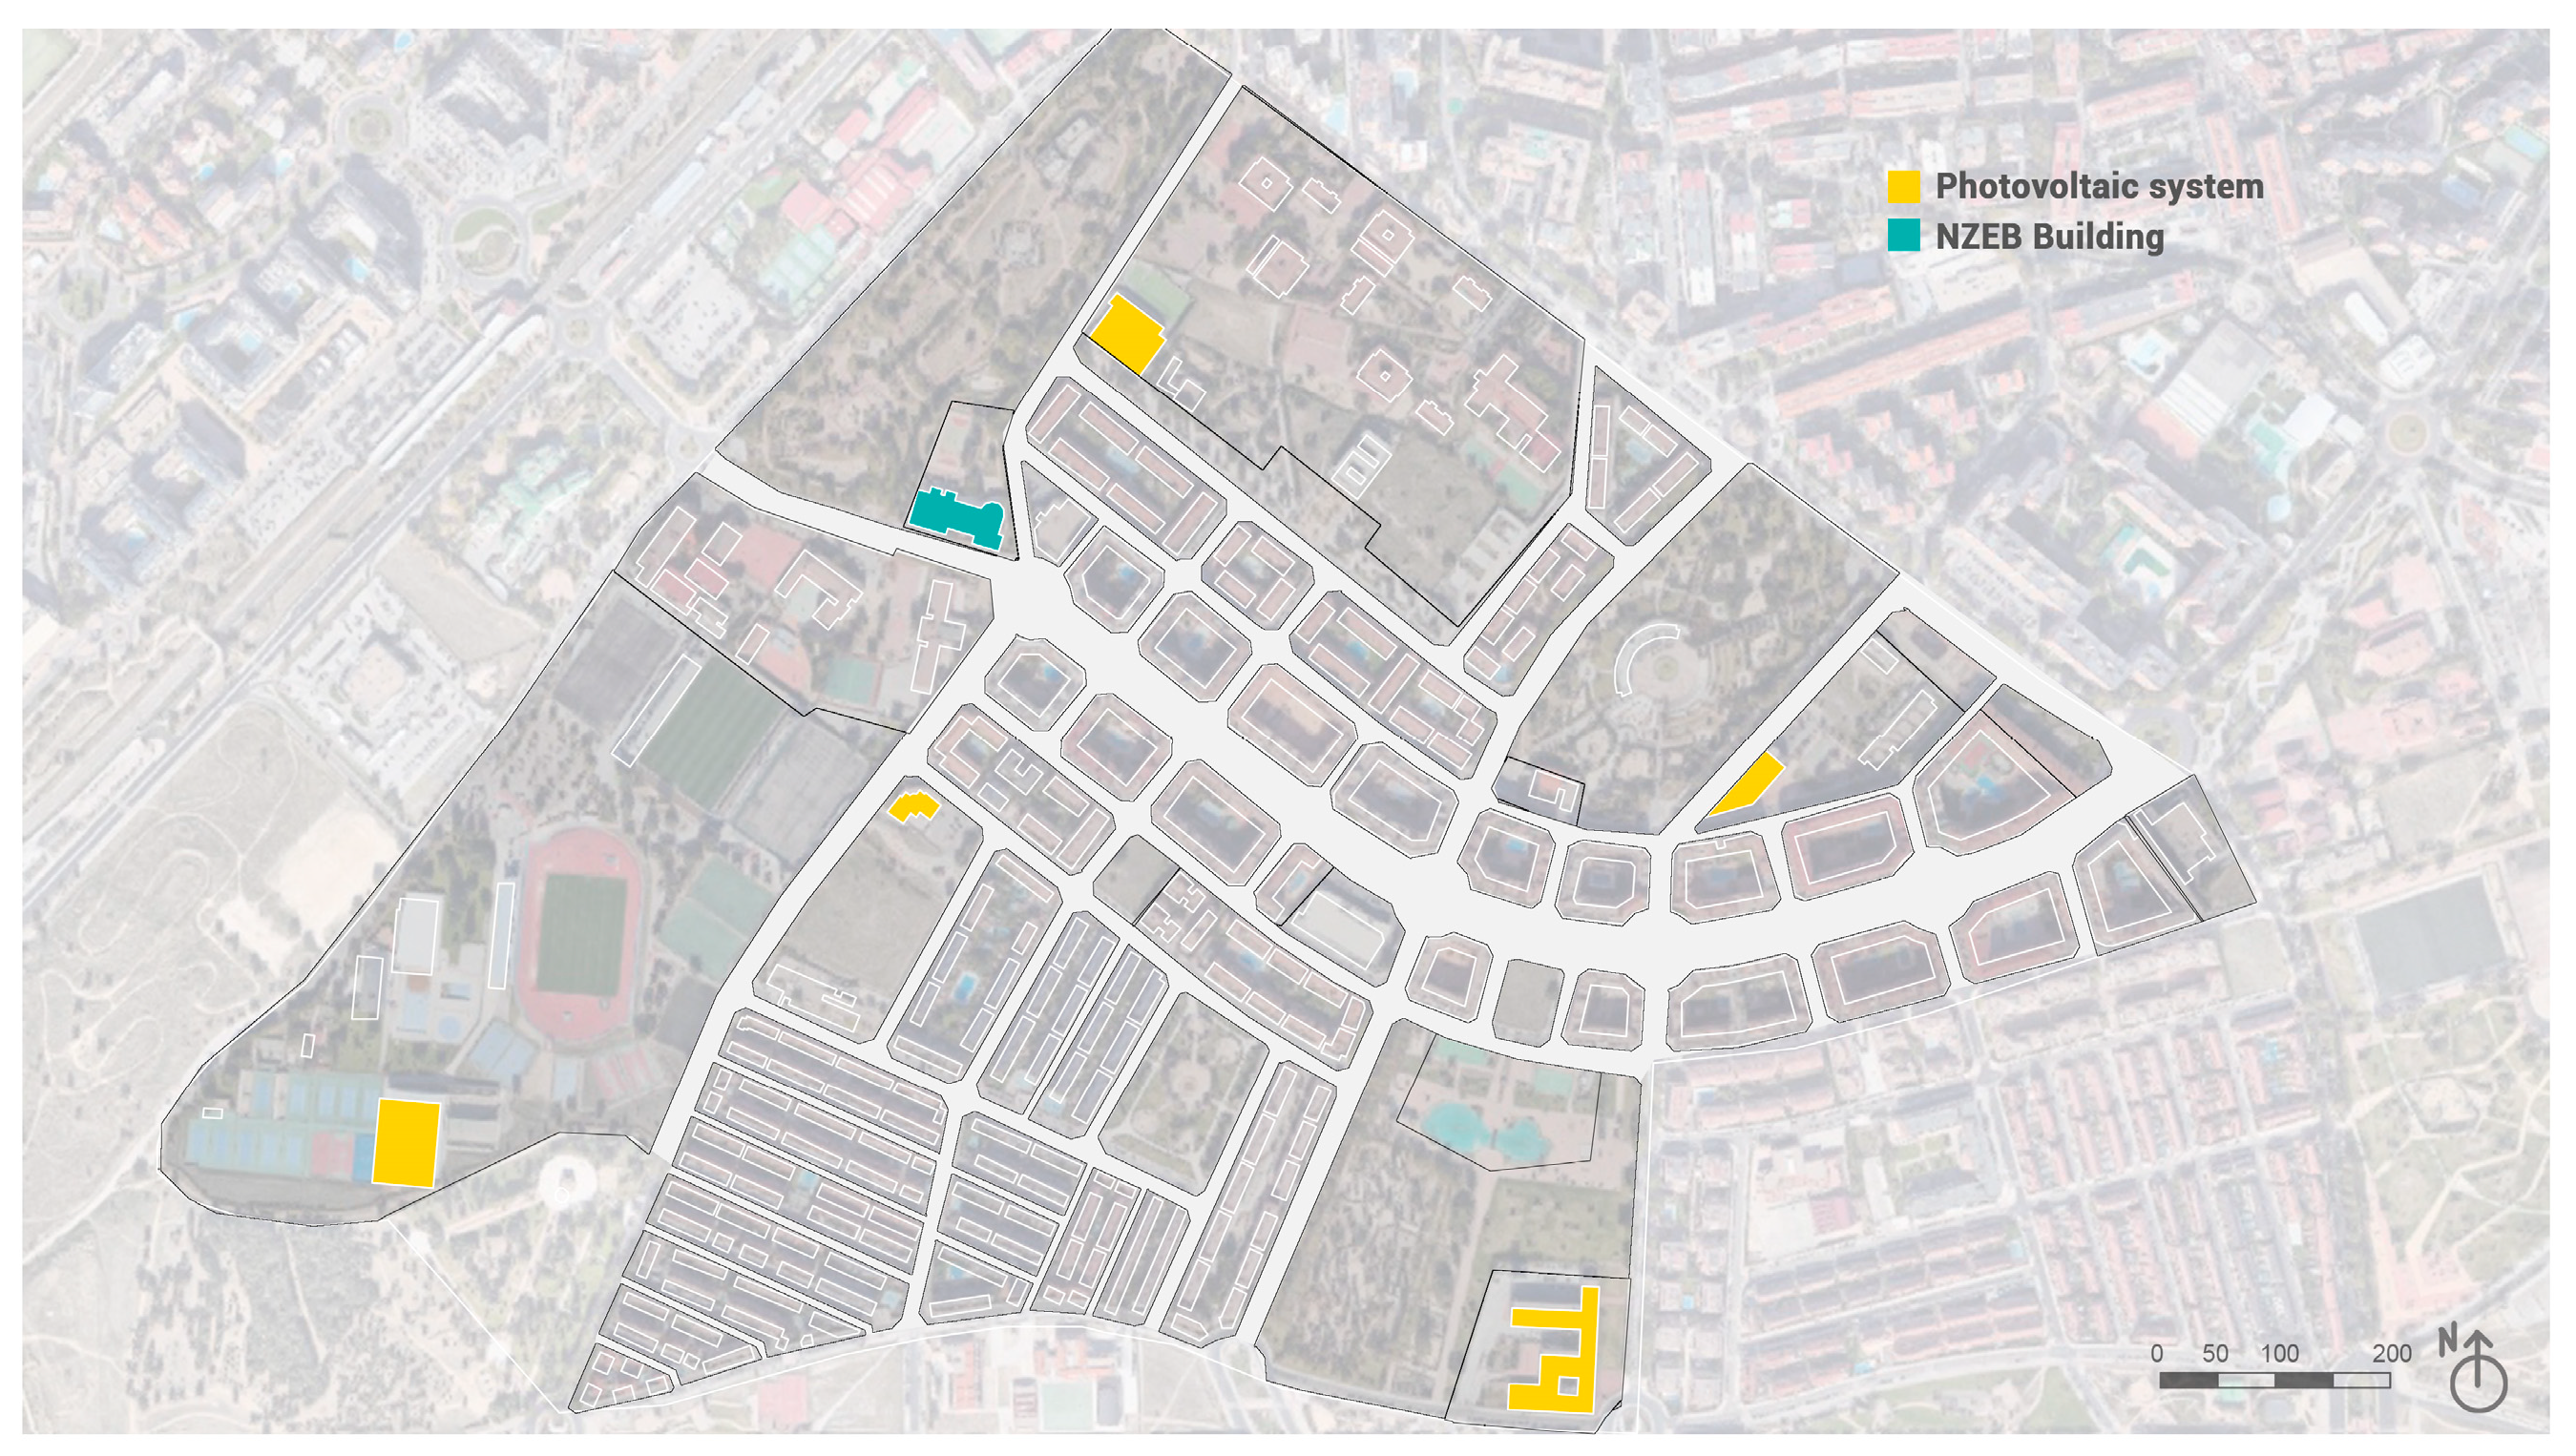
3.4. Stage 4: Calculation of Renewable Energy Generation Potential, Balance and Surplus of the PED Scenario

Finally, this stage allows the methodology to pre-determine possible scenarios of active strategies that can allow energy generation systems such as aerothermal and photovoltaic energy to reach a positive energy balance in the district. This pre-determining is based on the total energy demand of the district reduced by passive strategies. A similar analysis is developed in the methodology [11] of the MAKING-CITY project, in which a numerical calculation is proposed to estimate the on-site energy generation of a district, but without considering the reduction through passive strategies.
The results of the validation of the methodology in the case study are detailed below.

Active Strategies Scenario and Estimation of Energy Surplus:

In order to achieve the transition to a PED in the identified area, it is necessary to find a thermal balance of the demand through the contribution of renewable energies, starting from the previously estimated data of 40 GWh per year of TDRHeat, 10 GWh per year of TDDHW and 3 GWh per year of TDRCool. From these values, the amount of electrical energy that the aerothermal system will require to reach the estimated balance is calculated.
Equations (13) and (14) are used for this calculation. The value provides the total estimated electricity demand of the district in the transition scenario.
Furthermore, the district aerothermal system will require a total of 17 GWh per year to cover heating and DHW demand (EEHeat+DHW) and a total of 1 GWh per year for cooling (EECool).
With this data, the PV generation potential of the roofs of the district’s buildings is estimated using the Equation (15). The total estimated value is 18 GWh per year. This value covers the current demand of the district but is not enough to cover the demand of the transition scenario with aerothermal energy. To reach the surplus energy generation, the PV potential of other spaces in the district, such as PV pergolas in parks and gardens and solar pergolas in parking lots (PVGUrban area), is estimated. This proposal is estimated again, with the PVGIS tool and the Equation (16), and a total generation of 2 GWh per year is quantified.
This value still does not meet the needs of the PED transition scenario, so a Virtual PED transition is chosen.
Close to the study area, there is the Alcorcón Campus of the Rey Juan Carlos University and shopping malls with a large parking area. This area has good potential to generate PV energy. Again, using PVGIS and the Equation (17), it is estimated that a total of 3 GWh per year can be generated on the campus by installing parking shelters in the parking lots of the shopping malls, up to 16 GWh per year can be produced (PVGVirtual area) (Table 3).
Finally, the potential PV generation can reach a total of 39 GWh per year (PVGtot). This value manages to cover the total electricity demand of the district, including the demand for the aerothermal system. In addition, there could be a surplus of 4 GWh per year that will serve to cover the energy demand of other areas of the city of Alcorcón.

4. Discussion and Future Development

This methodology aims to solve or address the major gaps that are currently holding back the PED deployment in cities [59]. Among them, the lack of agreement in the methodologies for calculating energy demand and energy balance between EU member countries has been identified [60]. This gap has been addressed by identifying a calculation flow that considers data sources that can be easily found in the various Mediterranean countries. Although Spanish tools and sources are mentioned in the methodology, these can also be identified in other countries, e.g., in Italy, instead of the CE3Xv2.3 software, the ProCasaClima 2022 [61] software can be used for the calculation of the building energy demand and the UNI TS 11300-2 standard [62]for the DHW demand. Similarly, there are European draft tools such as TABULA [38] and INSPIREFP7 [37] that estimate the thermal demands of buildings. The proposed methodological flow will serve as a basis for a calculation that provides unified results for the various Mediterranean countries.
Another gap addressed by this methodology has been to study the development of a tool to forecast the possible transition of an existing district into a PED. Currently, there are no unified instruments for PED design that consider the whole process from start to finish. For this reason, it is important to address this gap as it will help in the deployment of PEDs. In addition, this methodology can help municipalities strengthen their energy transition policies by studying the PED transition potential of an existing district on the basis of transformation policies already present in the municipality. In this way, through this methodology, it will be possible to complement the actions present in the territory with other strategies that integrate them and allow the PED models to be promoted in the area.
Finally, the methodology presented aims to ensure the replicability of the PED not only in Spain but throughout the Mediterranean region.
Currently, there are several working groups such as COST Action [17], Annex 83 [18] or European projects such as MAKING-CITY [63] that are trying to address these gaps to promote a coordinated and harmonized PED deployment that covers the different EU countries. This methodology aims to join these investigations to achieve the PED boost in the shortest possible time.
This methodology also has several limitations that need to be mentioned. The first limitation is the lack of unification of energy demand calculations and the lack of public information on actual energy consumption. This factor has led to simplifying energy calculation estimates to determine data that could be valid for different cases to estimate possible PED transition scenarios. In this estimation, there is a main limitation that the simplification of the calculations can lead to an underestimation or overestimation of the real energy needs. Underestimation can include Equation (9) or the omission of urban ventilation by considering only the ventilation demand of residential buildings with Equation (5), among others. For this reason, the results obtained thanks to this methodology should be taken into account only for the intended purpose, i.e., to estimate the PED potential of the district and the technical feasibility of its transition.
Another limitation is in the estimation of the local renewable energy generation. In this estimation, only two energy generation systems, aerothermal and photovoltaic, have been considered. Although these are the most widely used systems at present, there are other generation systems that should also be considered to differentiate the energy sources to provide the districts with a flexible energy system.
Limitations have also been identified due to a lack of inclusion in the methodology, such as the consideration of social strategies to further reduce demand and the estimation of CO2 emissions reduction in the atmosphere.
Therefore, new lines of research are proposed to complement this methodology. First, calculations will be studied to allow more resolution in the estimation of energy demand. Another line of research to add to the methodology is the estimation of energy generation by means of other renewable energy systems. Subsequently, a methodology for estimating energy demand reduction through social strategies will be proposed. Finally, a method for calculating CO2 emissions in the initial state of the district and the quantification of emission reductions in the final transition scenario will be studied and added to the methodology.

5. Conclusions

The main objective of this methodological feasibility study was the creation of a tool to estimate a PED transition scenario of an existing district to assist municipalities in the implementation of these models.
The validation of the methodology was possible through its application in a case study located in Alcorcón.
In order to fulfill the main objective, a methodology has been developed that includes different factors essential for defining a transition scenario towards a PED. These factors have been identified on the one hand by considering the contextual components of a district derived from the urban and climatic environment of the transition site (Stage 1) and the estimation of the initial energy demand (Stage 2). On the other hand, district improvement factors have been considered, such as demand reduction through passive strategies (including NBS) (Stage 3) and the implementation of renewable energy generation systems to meet the energy balance and surplus that characterize a PED (Stage 4).
Through the case study in Alcorcón, it has been possible to validate the urban and bioclimatic analysis and determine the general characteristics of the district and its needs. In addition, the estimation of the current energy demand of the district has provided possible passive solutions that could reduce the energy demand of the district. These passive solutions have made it possible to define a transition scenario in Alcorcón that reduces the district’s cooling demand by 70% and heating demand by 23%. Finally, through this first PED transition scenario, it was possible to estimate the PED renewable energy generation thanks to the implementation of aerothermal systems and photovoltaic panels in the district. The result of this estimation determined the district’s transition scenario, which resulted in a Virtual PED that generates an annual electricity surplus of 4 GWh and achieves the balance of the district’s thermal demand.
The consideration in the methodology of climatic and bioclimatic factors and the characteristics of the urban environment in the PED transition is a rather novel approach. This idea is only beginning to be considered in the latest PED research, such as in the MAKING-CITY [63] or PEDRERA [12] projects, and most methodologies for calculating the PED potential focus only on the energy system of the transition district [14].
In addition, the consideration of a Virtual PED is a strong element of this methodology, as it prevents limiting the calculation to only one type of boundary and considers the various possibilities of PED boundaries that may vary according to the urban environment of the district under analysis.
This methodology’s estimation of a PED scenario can help municipalities consider an energy surplus that could be reinvested in other areas of the territory that are more energy-disadvantaged. This methodology is proposed as a tool that could be replicated in other case studies in different Mediterranean countries. By finding a common method for these countries, it will be possible to estimate the transition potential of a district and to compare the results of each case despite the complexity of the PED transition process. Likewise, by identifying the methodological flow for defining energy characteristics, several limitations have been found in the current context. These limitations, addressed in the discussion, will be material for future lines of research.

Author Contributions

Conceptualization, M.D., L.-N.S. and L.O.; methodology, M.D. and L.-N.S.; validation, M.D., L.-N.S., L.O. and F.O.; formal analysis, M.D., L.-N.S., L.O. and F.O.; investigation, M.D. and L.-N.S.; resources, F.O.; data curation, M.D.; writing—original draft preparation, M.D.; writing—review and editing, M.D. and L.-N.S.; visualization, M.D. and L.-N.S.; supervision, F.O. and L.O.; project administration, F.O.; funding acquisition, F.O. All authors have read and agreed to the published version of the manuscript.

Funding

The research presented in this paper has received funding from the Spanish Ministry of Science and Innovation via a doctoral grant to the second author (FPU20/07591) and from the Comunidad de Madrid through the call Research Grants for Young Investigators from Universidad Politécnica de Madrid as part of the project APOYO-JOVENES-21-LI6SVQ-77-664ZUQ.

Institutional Review Board Statement

Not applicable.

Informed Consent Statement

Not applicable.

Data Availability Statement

Not applicable.

Conflicts of Interest

The authors declare no conflict of interest.

Abbreviations

The following acronyms have been used in the calculations of the present methodology.
AcronymName
TDHeatDistrict Thermal Heating Demand (GWh year)
TDCoolDistrict Thermal Cooling Demand (GWh year)
TDDHWDistrict Thermal DHW Demand (GWh year)
DHeatThermal Heating Demand (kWh/m2 year)
DCoolThermal Cooling Demand (kWh/m2 year)
DDHWThermal DHW Demand (kWh/m2 year)
DEDDistrict Electricity Demand (GWh year)
EDElectricity Demand (kWh/m2 year)
TDRHeatDistrict Thermal Heating Demand Reduction (GWh year)
TDRCoolDistrict Thermal Cooling Demand Reduction (GWh year)
COPCoefficient of performance
EEHeat+DHWElectrical Energy for Heating and DHW
EECoolElectrical Energy for Cooling
PVGPhotovoltaic generation potential (GWh year)

References

  1. Ritchie, H.; Roser, M.; Rosado, P. CO₂ and Greenhouse Gas Emissions. Available online: https://ourworldindata.org/co2-and-greenhouse-gas-emissions (accessed on 10 February 2023).
  2. United Nations. The Paris Agreement. Available online: https://climate.ec.europa.eu/eu-action/international-action-climate-change/climate-negotiations/paris-agreement_en (accessed on 20 August 2023).
  3. European Commission. A European Green Deal. Available online: https://commission.europa.eu/strategy-and-policy/priorities-2019-2024/european-green-deal_en (accessed on 7 June 2023).
  4. United Nations. The Sustainable Development Agenda. Available online: https://www.un.org/sustainabledevelopment/development-agenda/ (accessed on 7 June 2023).
  5. European Commission. Renovation Wave. Available online: https://energy.ec.europa.eu/topics/energy-efficiency/energy-efficient-buildings/renovation-wave_en (accessed on 7 June 2023).
  6. European Commission. REPowerEU Affordable, Secure and Sustainable Energy for Europe. Available online: https://commission.europa.eu/strategy-and-policy/priorities-2019-2024/european-green-deal/repowereu-affordable-secure-and-sustainable-energy-europe_en (accessed on 7 June 2023).
  7. SET-Plan Working Group 3.2. Europe to Become a Global Role Model in Integrated, Innovative Solutions for the Planning, Deployment, and Replication of Positive Energy Districts. 2018. Available online: https://jpi-urbaneurope.eu/wp-content/uploads/2021/10/setplan_smartcities_implementationplan-2.pdf (accessed on 20 September 2021).
  8. JP Urban Europe. Available online: https://jpi-urbaneurope.eu/ (accessed on 15 June 2023).
  9. EERA JPSC. Available online: https://www.eera-sc.eu/ (accessed on 25 July 2023).
  10. Albert-Seifried, V.; Murauskaite, L.; Massa, G.; Aelenei, L.; Baer, D.; Krangsås, S.G.; Alpagut, B.; Mutule, A.; Pokorny, N.; Vandevyvere, H. Definitions of Positive Energy Districts: A Review of the Status Quo and Challenges. In Sustainability in Energy and Buildings 2021; Springer: Singapore, 2022. [Google Scholar] [CrossRef]
  11. Moreno, A.G.; Vélez, F.; Alpagut, B.; Hernández, P.; Montalvillo, C.S. How to Achieve Positive Energy Districts for Sustainable Cities: A Proposed Calculation Methodology. Sustainability 2021, 13, 710. [Google Scholar] [CrossRef]
  12. Civiero, P.; Pascual, J.; Arcas Abella, J.; Salom, J. Innovative PEDRERA Model Tool Boosting Sustainable and Feasible Renovation Programs at District Scale in Spain. Sustainability 2022, 14, 9672. [Google Scholar] [CrossRef]
  13. White Paper on Reference Framework for Positive Energy Districts and Neighbourhoods. Available online: https://jpi-urbaneurope.eu/ped/ (accessed on 10 July 2023).
  14. Brozovsky, J.; Gustavsen, A.; Gaitani, N. Zero Emission Neighbourhoods and Positive Energy Districts—A State-of-the-Art Review. Sustain. Cities Soc. 2021, 72, 103013. [Google Scholar] [CrossRef]
  15. European Commission. Horizon Europe-Work Programme 2023-2024 Climate, Energy and Mobility; European Commission: Luxembourg, 2023.
  16. Bylund, J.; Gollner, C.; Jäger, M.; Klaming, G.; Noll, M.; Riegler, J.; Rodenstedt, A.; Wallsten, B. European Partnership. Driving Urban Transitions to a Sustainable Future Roadmap. Available online: https://dutpartnership.eu/ (accessed on 15 June 2023).
  17. PED-EU-NET. COST Action CA19126. 2020. Available online: https://pedeu.net/ (accessed on 7 June 2023).
  18. IEA. Annex 83 PED. Available online: https://nachhaltigwirtschaften.at/en/iea/technologyprogrammes/ebc/iea-ebc-annex-83.php#:~:text=IEA%20EBC%20-%20Annex%2083%20-%20Positive%20Energy,agile%2Fflexible%20enough%20to%20respond%20to%20energy%20market%20fluctuations (accessed on 15 June 2023).
  19. Guarino, F.; Bisello, A.; Frieden, D.; Bastos, J.; Brunetti, A.; Cellura, M.; Ferraro, M.; Fichera, A.; Giancola, E.; Haase, M.; et al. State of the Art on Sustainability Assessment of Positive Energy Districts: Methodologies, Indicators and Future Perspectives. In Sustainability in Energy and Buildings 2021; Smart Innovation, Systems and Technologies; Springer: Singapore; Volume 263, pp. 479–492.
  20. De León, L.; Mora, D.; Carpino, C.; Arcuri, N.; Chen Austin, M. A Reference Framework for Zero Energy Districts in Panama Based on Energy Performance Simulations and Bioclimatic Design Methodology. Buildings 2023, 13, 315. [Google Scholar] [CrossRef]
  21. Vandevyvere, H.; Ahlers, D.; Wyckmans, A. The Sense and Non-Sense of PEDs—Feeding Back Practical Experiences of Positive Energy District Demonstrators into the European PED Framework Definition Development Process. Energies 2022, 15, 4491. [Google Scholar] [CrossRef]
  22. Shao, L.; Liao, W.; Li, P.; Luo, M.; Xiong, X.; Liu, X. Drivers of Global Surface Urban Heat Islands: Surface Property, Climate Background, and 2D/3D Urban Morphologies. Build Environ. 2023, 242, 110581. [Google Scholar] [CrossRef]
  23. MITMA. ERESEE 2020. Available online: https://www.mitma.gob.es/recursos_mfom/paginabasica/recursos/es_ltrs_2020.pdf (accessed on 25 January 2023).
  24. Giannarou, S.; Tsatiris, M.; Kitikidou, K. Bioclimatic Analysis Based on the Climate of Greece, in Order to Minimize Energy Consumption in Buildings. Int. Ref. J. Eng. Sci. 2018, 7, 25–50. [Google Scholar]
  25. Lasantha, V.; Oki, T.; Tokuda, D. Data-Driven versus Köppen-Geiger Systems of Climate Classification. Adv. Meteorol. 2022, 2022, 3581299. [Google Scholar] [CrossRef]
  26. Beck, H.E.; Zimmermann, N.E.; McVicar, T.R.; Vergopolan, N.; Berg, A.; Wood, E.F. Present and Future Köppen-Geiger Climate Classification Maps at 1-Km Resolution. Sci. Data 2018, 5, 180214. [Google Scholar] [CrossRef]
  27. Givoni, B. Comfort, Climate Analysis and Building Design Guidelines. Energy Build. 1992, 18, 11–23. [Google Scholar] [CrossRef]
  28. Neila, J. Arquitectura Bioclimática En Un Entorno Sostenible: Buenas Prácticas Edificatorias; MUNILLALERIA: Madrid, Spain, 2004. [Google Scholar]
  29. Climate Consultant 6.0. Available online: https://www.sbse.org/resources/climate-consultant (accessed on 15 June 2023).
  30. Román López, E.; Higueras García, E.; Neila González, F.J. Bioclimatic Characterisation Methodology of a City. In Urban Sustainability and Energy Management of Cities for Improved Health and Well-Being; Information Science Reference: Hershey, PA, USA, 2022; pp. 1–31. [Google Scholar]
  31. Kusuma, Y.; Nuzir, F.A. Penilaian Kinerja Bangunan Hijau Dengan EDGE Building App Pada Perancangan Klinik Yang Menerapkan Strategi Passive Design Dari Climate Consultant. J. Arsit. 2022, 12, 65. [Google Scholar] [CrossRef]
  32. EnergyPlus. Available online: https://energyplus.net/ (accessed on 15 June 2023).
  33. Architecture 2030 Palette 2030. Available online: http://2030palette.org/ (accessed on 15 June 2023).
  34. IDAE. Guía Técnica Agua Caliente Sanitaria Central; IDAE, Ed.; IDAE: Madrid, Spain, 2010. [Google Scholar]
  35. CTE. Documento Basico, Seguridad En Caso de Incendio. Available online: https://www.codigotecnico.org/pdf/Documentos/SI/DBSI.pdf (accessed on 23 September 2023).
  36. IDAE. EUROSTAT Consumos Del Sector Residencial En España. Available online: https://www.idae.es/uploads/documentos/documentos_Documentacion_Basica_Residencial_Unido_c93da537.pdf#:~:text=Consumos%20del%20.%20S.%20ector%20Residencial%20en%20Espa%C3%B1a,25%25%20.%202.-Consumo%20Medio%20seg%C3%BAn%20Tipo%20de%20Vivienda (accessed on 10 January 2023).
  37. Birchall, S.; Wallis, I.; Churcher, D.; Pezzutto, S.; Fedrizzi, R.; Causse, E. D2.1a—Survey on the Energy Needs and Architectural Features of the EU Building Stock; iNSPiRe: Bracknell, UK, 2014. [Google Scholar]
  38. Loga, T.; Stein, B.; Diefenbach, N. TABULA Building Typologies in 20 European Countries—Making Energy-Related Features of Residential Building Stocks Comparable. Energy Build. 2016, 132, 4–12. [Google Scholar] [CrossRef]
  39. Bekele, M.T.; Atakara, C. Residential Building Energy Conservation in Mediterranean Climate Zone by Integrating Passive Solar and Energy Efficiency Design Strategies. Buildings 2023, 13, 1073. [Google Scholar] [CrossRef]
  40. Azkorra-Larrinaga, Z.; Romero-Antón, N.; Martin-Escudero, K.; Lopez-Ruiz, G. Environmentally Sustainable Green Roof Design for Energy Demand Reduction. Buildings 2023, 13, 1846. [Google Scholar] [CrossRef]
  41. Gholami, M.; Barbaresi, A.; Tassinari, P.; Bovo, M.; Torreggiani, D. A Comparison of Energy and Thermal Performance of Rooftop Greenhouses and Green Roofs in Mediterranean Climate: A Hygrothermal Assessment in WuFi. Energies 2020, 13, 2030. [Google Scholar] [CrossRef]
  42. Derkenbaeva, E.; Halleck Vega, S.; Hofstede, G.J.; van Leeuwen, E. Positive Energy Districts: Mainstreaming Energy Transition in Urban Areas. Renew. Sustain. Energy Rev. 2022, 153, 111782. [Google Scholar] [CrossRef]
  43. United Nations Environment Programme. 2022 Global Status Report for Buildings and Construction: Towards Zero-emission, Efficient and Resilient Buildings and Construction Sector; United Nations Environment Programme: Nairobi, Kenya, 2022. [Google Scholar]
  44. Bruno, R.; Nicoletti, F.; Cuconati, G.; Perrella, S.; Cirone, D. Performance Indexes of an Air-Water Heat Pump versus the Capacity Ratio: Analysis by Means of Experimental Data. Energies 2020, 13, 3391. [Google Scholar] [CrossRef]
  45. European Commissions. Photovoltaic Geographical Information System (PVGIS). Available online: https://joint-research-centre.ec.europa.eu/pvgis-online-tool_en (accessed on 20 April 2023).
  46. Nomecalles—Nomenclator y Callejero de La Comunidad de Madrid. Available online: https://gestiona.comunidad.madrid/nomecalles/ (accessed on 15 June 2023).
  47. Norma Básica de la Edificación NBE-CT-79. Available online: https://boe.es/boe/dias/1979/10/22/pdfs/A24524-24550.pdf (accessed on 20 September 2023).
  48. Climate data Clima Alcorcón Climate Data. Available online: https://es.climate-data.org/europe/espana/comunidad-de-madrid/alcorcon-3776/ (accessed on 10 June 2023).
  49. Windfinder. Available online: https://www.windfinder.com/#3/49.5042/9.5421/spot (accessed on 10 June 2023).
  50. ASHRAE STANDARD 55—Thermal Environmental Conditions for Human Occupancy. Available online: https://www.ashrae.org/technical-resources/bookstore/standard-55-thermal-environmental-conditions-for-human-occupancy (accessed on 15 June 2023).
  51. Chiesa, G.; Acquaviva, A.; Grosso, M.; Bottaccioli, L.; Floridia, M.; Pristeri, E.; Sanna, E.M. Parametric Optimization of Window-to-Wall Ratio for Passive Buildings Adopting a Scripting Methodology to Dynamic-Energy Simulation. Sustainability 2019, 11, 3078. [Google Scholar] [CrossRef]
  52. Efinovatic CE3X Software. Available online: https://efinova.es/CE3X (accessed on 15 June 2023).
  53. Ministerio para la Transición Ecológica y el Reto Demográfico Procedimientos Para La Certificación de Edificios. Available online: https://energia.gob.es/desarrollo/EficienciaEnergetica/CertificacionEnergetica/DocumentosReconocidos/Paginas/procedimientos-certificacion-proyecto-terminados.aspx (accessed on 15 June 2023).
  54. Ramos, I. Ayuntamiento de Alcorcón Estudio Modalidad de Gestión Del Mantenimiento Del Alumbrado Público En El Ayuntamiento de Alcorcón. Available online: https://www.ayto-alcorcon.es/sites/default/files/2022-12/ESTUDIO%20MODALIDAD%20DE%20GESTI%C3%93N_signed.pdf (accessed on 12 August 2023).
  55. Banti, N.; Ciacci, C.; Di Naso, V.; Bazzocchi, F. Green Walls as Retrofitting Measure: Influence on Energy Performance of Existing Industrial Buildings in Central Italy. Buildings 2023, 13, 369. [Google Scholar] [CrossRef]
  56. Coma, J.; Pérez, G.; de Gracia, A.; Burés, S.; Urrestarazu, M.; Cabeza, L.F. Vertical Greenery Systems for Energy Savings in Buildings: A Comparative Study between Green Walls and Green Facades. Build. Environ. 2017, 111, 228–237. [Google Scholar] [CrossRef]
  57. Silva, C.M.; Gomes, M.G.; Silva, M. Green Roofs Energy Performance in Mediterranean Climate. Energy Build. 2016, 116, 318–325. [Google Scholar] [CrossRef]
  58. Al-Kayiem, H.H.; Koh, K.; Riyadi, T.W.B.; Effendy, M. A Comparative Review on Greenery Ecosystems and Their Impacts on Sustainability of Building Environment. Sustainability 2020, 12, 8529. [Google Scholar] [CrossRef]
  59. Sareen, S.; Albert-Seifried, V.; Aelenei, L.; Reda, F.; Etminan, G.; Andreucci, M.B.; Kuzmic, M.; Maas, N.; Seco, O.; Civiero, P.; et al. Ten Questions Concerning Positive Energy Districts. Build. Environ. 2022, 216, 109017. [Google Scholar] [CrossRef]
  60. Krangsås, S.G.; Steemers, K.; Konstantinou, T.; Soutullo, S.; Liu, M.; Giancola, E.; Prebreza, B.; Ashrafian, T.; Murauskaitė, L.; Maas, N. Positive Energy Districts: Identifying Challenges and Interdependencies. Sustainability 2021, 13, 10551. [Google Scholar] [CrossRef]
  61. Casa Clima. Available online: https://www.agenziacasaclima.it/it/software-casaclima-2239.html (accessed on 1 July 2023).
  62. UNI. UNI/TS 11300-2:2019; Energy performance of buildings - Part 2: Evaluation of primary energy need and of system efficiencies for space heating, domestic hot water production, ventilation and lighting for non-residential buildings. UNI: Milan, Italy, 2019.
  63. MAKING-CITIES. Available online: https://makingcity.eu/ (accessed on 20 January 2023).
Figure 1. Workflow of the methodology to evaluate the PEDs’ potential and technical feasibility.
Sustainability 15 14134 g001
Figure 2. Area case study district with identified municipality initiatives.
Sustainability 15 14134 g002
Figure 3. (a) Plan 1: Predominant uses; (b) Plan 2: Construction years; (c) Plan 3: Building typologies; (d) Plan 4: Roof typologies.
Sustainability 15 14134 g003
Figure 4. (a) ACC Winter, from [28]; (b) ACC Spring-Fall, from [28]; (c) ACC Summer, from [28].
Sustainability 15 14134 g004
Figure 5. Psychrometric chart, from [29].
Sustainability 15 14134 g005
Figure 6. Selection of district-type buildings, photos from Google Street View.
Sustainability 15 14134 g006
Figure 7. Reduction of energy demand with passive strategies, own produced data.
Sustainability 15 14134 g007
Table 1. The energy demand of district-type buildings in their initial condition, from energy certification tool CE3X and Equations (1) and (8).
NameDHeat
(kWh/m2 Year)
DCool
(kWh/m2 Year)
DDHW
(kWh/m2 Year)
EDRes and NRes (kWh/m2 Year)
BT-1 W-E121.618.840.228.4
BT 1-NE-SW11717.440.228.4
BT 2-W-E81.620.11428.4
BT 2-NE-SW81.318.31428.4
BT 3-NE-SW88.31611.428.4
BT 3-N-S7114.411.428.4
BT 438.937.728.527.44
BT 515764.045.733.88
BT 670.317.695.419.35
Table 2. Heating and cooling energy reduction of district type buildings with passive solutions from CE3X.
NameDRHeat
(kWh/m2 Year)
% Heating
Reduction
DRCool
(kWh/m2 Year)
% Cooling
Reduction
BT 1-W-E93.423.24.961.5
BT 1-NE-SW96.417.75.568.3
BT 2-W-E63.330.85.275.5
BT 2-NE-SW6330.45.472.5
BT 3-NE-SW58.531.53.975
BT 3-N-S56.3173.53.5
BT 5138.318.74.9272.2
Table 3. Total electricity generated with PV systems from PVGIS data.
Name of PV Generation AreaPotential Electricity Generation
(GWh Year)
PVGroof18
PVGUrban area2
PVGVirtual area 19
Disclaimer/Publisher’s Note: The statements, opinions and data contained in all publications are solely those of the individual author(s) and contributor(s) and not of MDPI and/or the editor(s). MDPI and/or the editor(s) disclaim responsibility for any injury to people or property resulting from any ideas, methods, instructions or products referred to in the content.

