Article

A Study on Modifying Campus Buildings to Improve Habitat Comfort—A Case Study of Tianjin University Campus

1
School of Architecture, Tianjin University, Tianjin 300072, China
2
School of Civil Engineering, Tianjin University, Tianjin 300072, China
3
School of Environment Science and Engineering, Tianjin University, Tianjin 300072, China
*
Author to whom correspondence should be addressed.
These authors contributed equally to this work.
Sustainability 2023, 15(19), 14200; https://doi.org/10.3390/su151914200
Submission received: 18 August 2023 / Revised: 19 September 2023 / Accepted: 24 September 2023 / Published: 26 September 2023

Abstract

:
At present, the design and planning of teaching and living areas on university campuses are relatively straightforward but encounter problems, such as poor ventilation, low indoor air quality, and poor sound insulation. In this study, the teaching building and living area cluster at the Tianjin University campus were selected as the research objects. We verified the effectiveness of the simulation results before and after renovation through onsite testing. To improve ventilation, an atrium and patio were added to the teaching building, and the ventilation of the renovated building was studied. The indoor thermal environment intelligent control system regulates carbon dioxide (CO2) concentration and humidity in the teaching building and changes the thermal comfort of the teaching building. Limiting vehicle speeds near the teaching building and the living area cluster, using muffling materials and muffling equipment, and increasing greenery to reduce noise were factors we studied, considering whether they had a noise-reduction effect. It was found that the average number of air changes in the overall functional space of the first teaching building reaches 6.49 times/h, and the wind speed in the human activity region is below 1 m/s. When using a thermal environment intelligent control system, the indoor temperature throughout the year was within the thermal comfort range 81% of the time. The maximum noise around the teaching building during the daytime was 51.0 dB, the maximum noise at nighttime was 41.5 dB, and the maximum sound level on the facade of the living area cluster was 53 dB. The average noise-reduction rate was 22.63%, which exceeds the noise-reduction rate given in the above research literature.

1. Introduction

Existing campuses have problems with heat dissipation in summer, poor wind protection in winter, and poor sound insulation [1]. The wind comfort of pedestrians is an important indicator of livability [2] and affects indoor and outdoor thermal comfort [3]. In addition, background noise, glare, and room temperature in the learning environment can affect the concentration and productivity of students and teachers [4]. However, it has been increasingly recognized that both the outdoor environment [5] and Indoor Environmental Quality (IEQ) [6] have an impact on the health of users; meanwhile, more research has been performed on the relationship between indoor air quality (IAQ) and user comfort [7]. In this study, the existing building system was reported by users to have poor indoor heat dissipation in summer and poor body sensation in the corridor in winter due to the cold monsoon. The indoor air conditioning system is not intelligent enough to adjust the indoor neutral temperature nor to detect the change in IEQ quickly enough to optimize the indoor environment, and there is greater noise in the teaching area and living area. Reducing environmental noise, optimizing the indoor thermal environment, and reducing indoor and outdoor wind speed are important issues to be solved to effectively improve the comfort level of the campus.
The indoor temperature has an important effect on the health and learning effectiveness of students in colleges and universities. The room temperature of campus buildings [8] affects the learning efficiency and health condition of students. Temperature and humidity affect the indoor thermal environment [9]; improving room temperature can be achieved by adding insulation materials, improving ventilation systems, and optimizing the structure of building facades, where intelligent control systems can achieve fine-grained temperature control [10]. As an important part of the building, the atrium can enhance daylighting [11,12] and provide passive ventilation [13], which can be reasonably combined with mechanical ventilation to better achieve a comfortable indoor thermal environment and reduce energy consumption. The fresh air treatment system can fine-tune the temperature of the indoor fresh air and improve indoor thermal comfort [14]. Due to dense personnel clustering and poor ventilation conditions in campus classrooms, the concentration of indoor pollutants will increase [15], especially indoor carbon dioxide, which increases the risk of respiratory diseases [16], has a negative impact on brain function, the cardiovascular system, and mood [17], and affects students’ performance and happiness [18]. Methods and measures, such as increasing indoor ventilation and using air purification equipment, can effectively reduce the CO2 concentration and thus improve air quality [19], especially in existing and old buildings [20]. Intelligent monitoring of room air and temperature is a prerequisite for improving indoor air quality. At the same time, energy-saving measures, such as recycling, should be considered so that the campus building can develop in a green and sustainable direction [21]. Most of the existing literature has studied the testing of intelligent monitoring systems or related fresh air equipment, with little analysis of the measured data after use and a lack of accurate quantitative analysis [22], whereas this study emphasizes the accurate quantitative analysis of survey data.
Air-heat recovery systems are very important in regulating the overall indoor and outdoor thermal comfort and CO2 concentration [23], but since air-heat recovery systems exchange heat between indoor and outdoor areas, their efficiency is affected by the outdoor temperature, and thus they generate additional energy consumption. According to statistics, 50% of the energy consumption of the building industry is used to maintain indoor thermal comfort [24]. Combined with the previous research review, at present, campus buildings do not fully consider the impact of reconstruction methods on building IEQ. The current research lacks quantitative studies on indoor humidity, wind speed, and other factors, and only a few studies have studied the IEQ model of the neutral temperature quantitative test [25], the detection of CO2 concentrations without considering other equipment that can be used to improve air quality, and missing wind-heat recovery systems, fresh air systems, and detection systems, so there are problems, such as inaccurate assessment of IEQ, low efficiency, and excessive energy consumption. This study will use a suitable detection system to quantify indoor thermal comfort while considering the above problems. The acoustic environment has a significant impact on the physiology [26] and psychology [23] of users, and noise pollution seriously affects public health [27]. Noisy environments are not conducive to learning-related activities [28], and exposure to noise increases the risk of related diseases [16]. The use of appropriate sound insulation techniques and soundproofing materials in classrooms can effectively reduce the impact of noise on the room [29]. When designing buildings, it is also necessary to take into account the differences in the acoustic environment required for different activities [30] in order to establish appropriate control measures [31] and reduce the impact of noise [32]. In addition, the study of a systematic soundscape environment can make the building community sustainably integrated into the development of future campus planning [33]. Most of the existing studies are based on the renovation of buildings in colleges and universities, and noise reduction is completed in the form of single material selection or external sound-insulation components, and there are fewer applications for the combination of overall building planning and material selection. Colleges and universities should take cost-effective measures, such as setting speed bumps, limiting the type of traffic, and planting greenery, to achieve noise reduction while considering costs and thus creating a healthy learning and living environment.
At present, the design and planning of teaching and living areas on university campuses are relatively straightforward but encounter problems, such as poor ventilation, low indoor air quality, and poor sound insulation. This study aims to help in the planning and designing of campus buildings in the Beijing–Tianjin–Hebei province using software simulation and field data acquisition to analyze indoor and outdoor wind environment comfort, thermal comfort, and acoustic environment comfort. We verify the effectiveness of simulation results using wind speed and noise monitoring data of building facades at different indoor and outdoor locations. The ventilation effect of both the first teaching building’s east and west areas and the joint areas using patios or only the joint areas using patios is compared and analyzed using PHOENICS (version 2009) software. The first teaching building is designed with an atrium, which can effectively improve the comfort of the wind environment. The indoor thermal environment intelligent fresh air system composed of a split ethylene glycol heat-recovery fresh air treatment unit, fresh air system, and air quality detection system is used to regulate indoor carbon dioxide concentration and humidity in the first teaching building and perform real-time monitoring of CO2 concentration, temperature, and humidity. Thus, this system can effectively improve the thermal comfort of the internal environment of the first teaching building. Based on the simulation of the noise distribution on the building facade using CadnaA (version 4.4) and SoundPLAN (version 7.2) software, it can be seen that the outdoor noise-reduction effect of the first teaching building and living area group is very significant. Reducing the noise by limiting the speed of vehicles near the first teaching building and living area using indoor sound-insulation materials and noise-reduction equipment and increasing the surrounding green plants has an obvious noise-reduction effect on the two main functional areas.

2. Methodology

2.1. Navier–Stokes (N–S) Equation

The airflow around buildings is an incompressible low-speed turbulent flow and is restricted by the presence of buildings. The K-ε standard model simulates restricted flow well and is, therefore, widely used for numerical simulations in low-speed turbulent flows. The governing equations for incompressible turbulence around buildings are continuous, and the Reynolds-averaged Navier–Stokes equations are given [34] as follows:
u i u j x i = ρ j [ v L ( u i x i + u j x j ) u i u j ¯ ] + B i p x i
u i x i = 0
where u is the instantaneous velocities, ρ is the density, v is the kinematic viscosity, and p is the kinematic pressure.
When the turbulent stresses appearing in Equation (2) are described using the concept of vortex viscosity, the following expression [34] is used:
ρ u i u j ¯ = ρ K 2 d i j 3 ρ C V s L s ( u i x j + u j x j )
where C is an empirical constant, vs. and Ls are the turbulent velocity and length scales characterizing. The kinematic eddy viscosity vt exists as an expression for [34]
v t = μ τ ρ
The form of the standard K-ε model is expressed using the turbulent transport equation [34]:
ρ x i ( u i K v t p r K K x i ) = ρ ( p K + Γ b ε )
ρ x i [ u i ε v t p r K ε x i ] = ρ ε ( C 1 ε p K + C 3 ε Γ b C 2 ε ε ) K
Equation (7) gives the viscosity of the moving turbulent (or vortex) flow [34]:
v t = C μ C d K 2 ε
where K is the turbulent kinetic energy, ε is the turbulent energy dissipation rate, and Γb is buoyancy production.
PHOENICS software contains several turbulence models. These models differ in accuracy and computational effort and are, therefore, suitable for different fields. This study is based on the Reynolds-averaged Navier–Stokes model for simulating indoor and outdoor wind environments. The parameters used in the K-ε standard model in this study are given in Table 1.

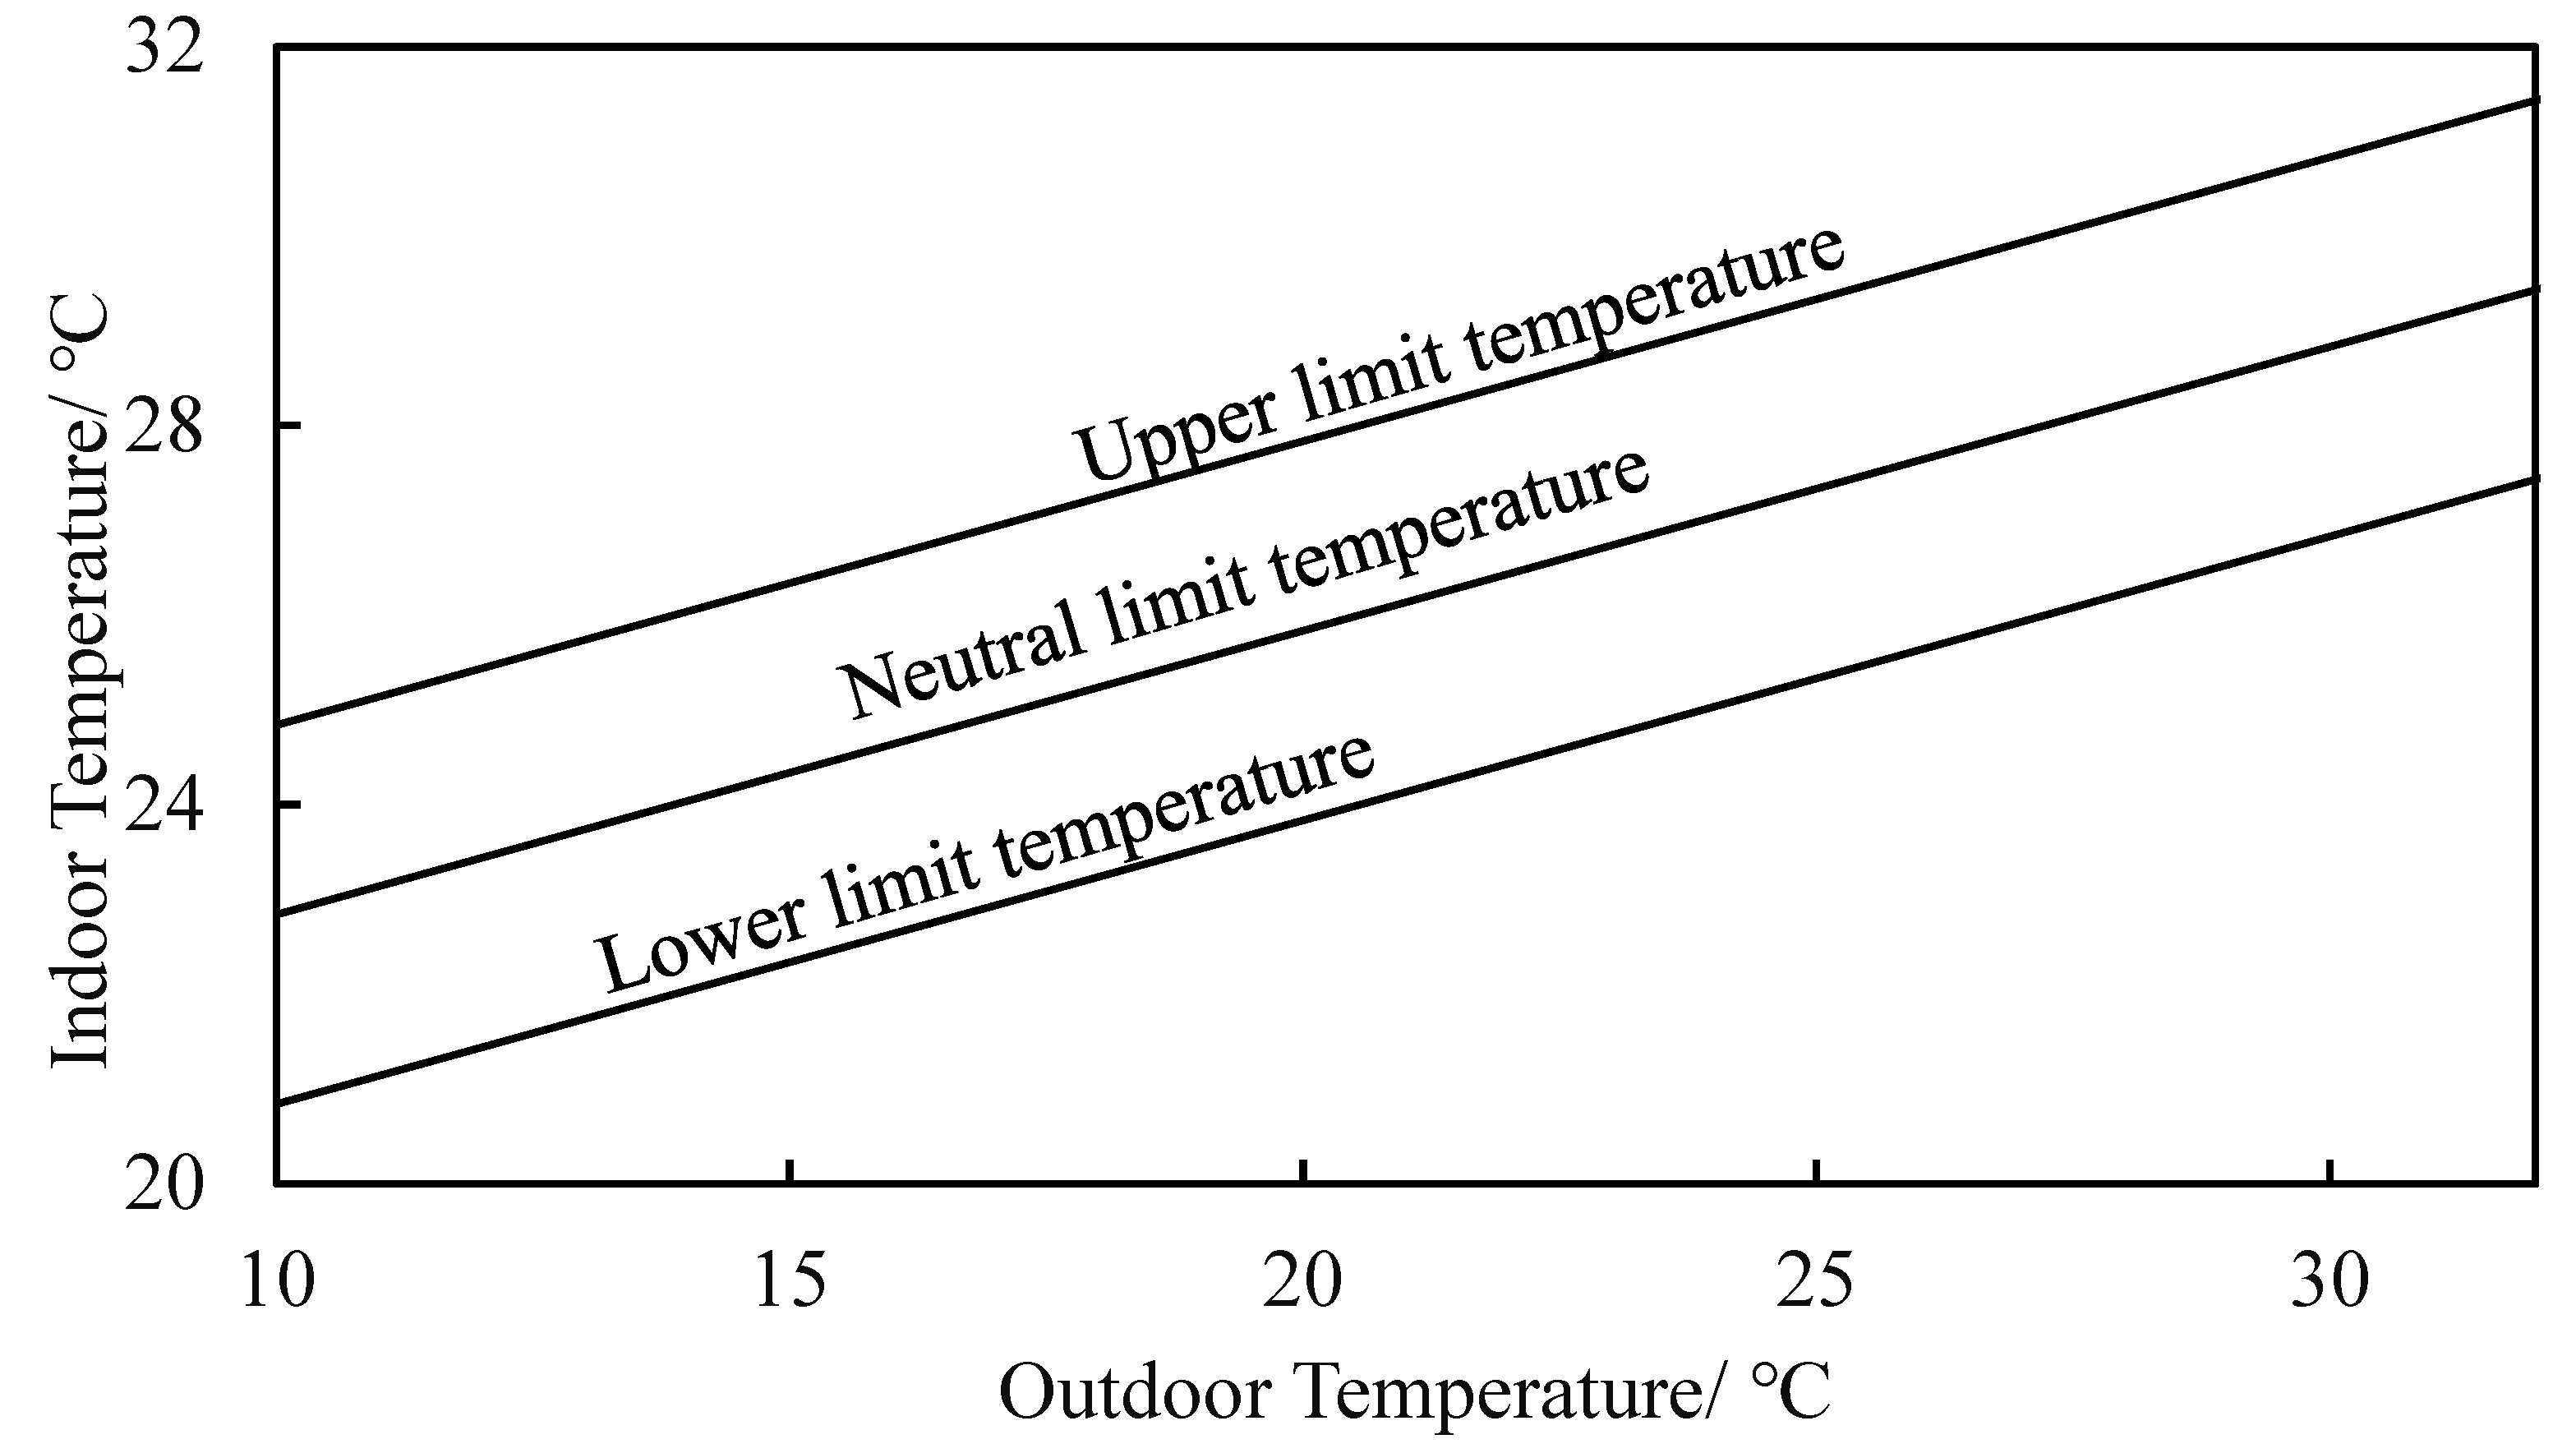
2.2. Neutral Temperature (Tc) Equation

According to ASHRAE Standard 55-1992 [35], in which the correction is based on the effect of airflow velocity, the calculation formula for the neutral temperature Tc in the human thermal comfort zone is given when the indoor temperature is above 28 °C and the outdoor relative humidity is greater than 70 [22].
T c = 19.7 + 0.30 θ 0 4 ( ϕ 0 70 % ) + 0.55 v 0.15
where ϕ0 is the indoor relative humidity, v0 is the body surface wind speed, and θ0 is the outdoor temperature. When the indoor temperature is below 28 °C, the effect of relative humidity on human thermal comfort is minimal, and Guo’s Equation (8) can be simplified as [22]
T c = 19.7 + 0.30 θ 0 + 0.55 v 0.15

2.3. Sound Pressure Level (LP) Theoretical Equation

Acoustic comfort should also be considered as a point within the overall building comfort; SoundPLAN software calculates the noise pressure level at the receiving point of the calculated value, and the measured value can be nearly the same. The LP theoretical calculation formula for sound pressure level [36] is shown below:
L p = 10 lg P 2 P 0 2
where P is the effective value of the measured sound pressure, and P0 is the reference sound pressure.
In the air medium, it is specified that P0 = 20 μPa, which is the sound pressure value of 1000 Hz of pure sound that can barely be heard by healthy young people. The sound intensity level [36] is often expressed by LI and is defined as
L I = 10 lg I I 0
where I and I0 are sound intensity.
In air, the reference sound intensity I0 is 10–12 W/m2. For a planar acoustic wave in air, there [36] is the following expression:
I = p 2 ρ c
where ρ is the density of the propagation medium, the density of air is 1.205 kg/m3 at 20 °C, c is the speed of sound in air, and c = 340.4 m/s.
Bringing Equation (3) into (2) yields [36]
L I = L p + 10 lg 400 ρ c
When calculating the common effect of several sound sources, it is not possible to simply add the numerical values of the sound pressure levels generated by each, but rather to perform energy superposition. For multiple unrelated noise sources, there will be no interference between them. There is an expression for the total sound pressure level of n sound sources [36]:
L p T = 10 lg ( i = 1 n 10 0.1 L p i )

3. Result and Discussion

3.1. Indoor and Outdoor Wind Environment

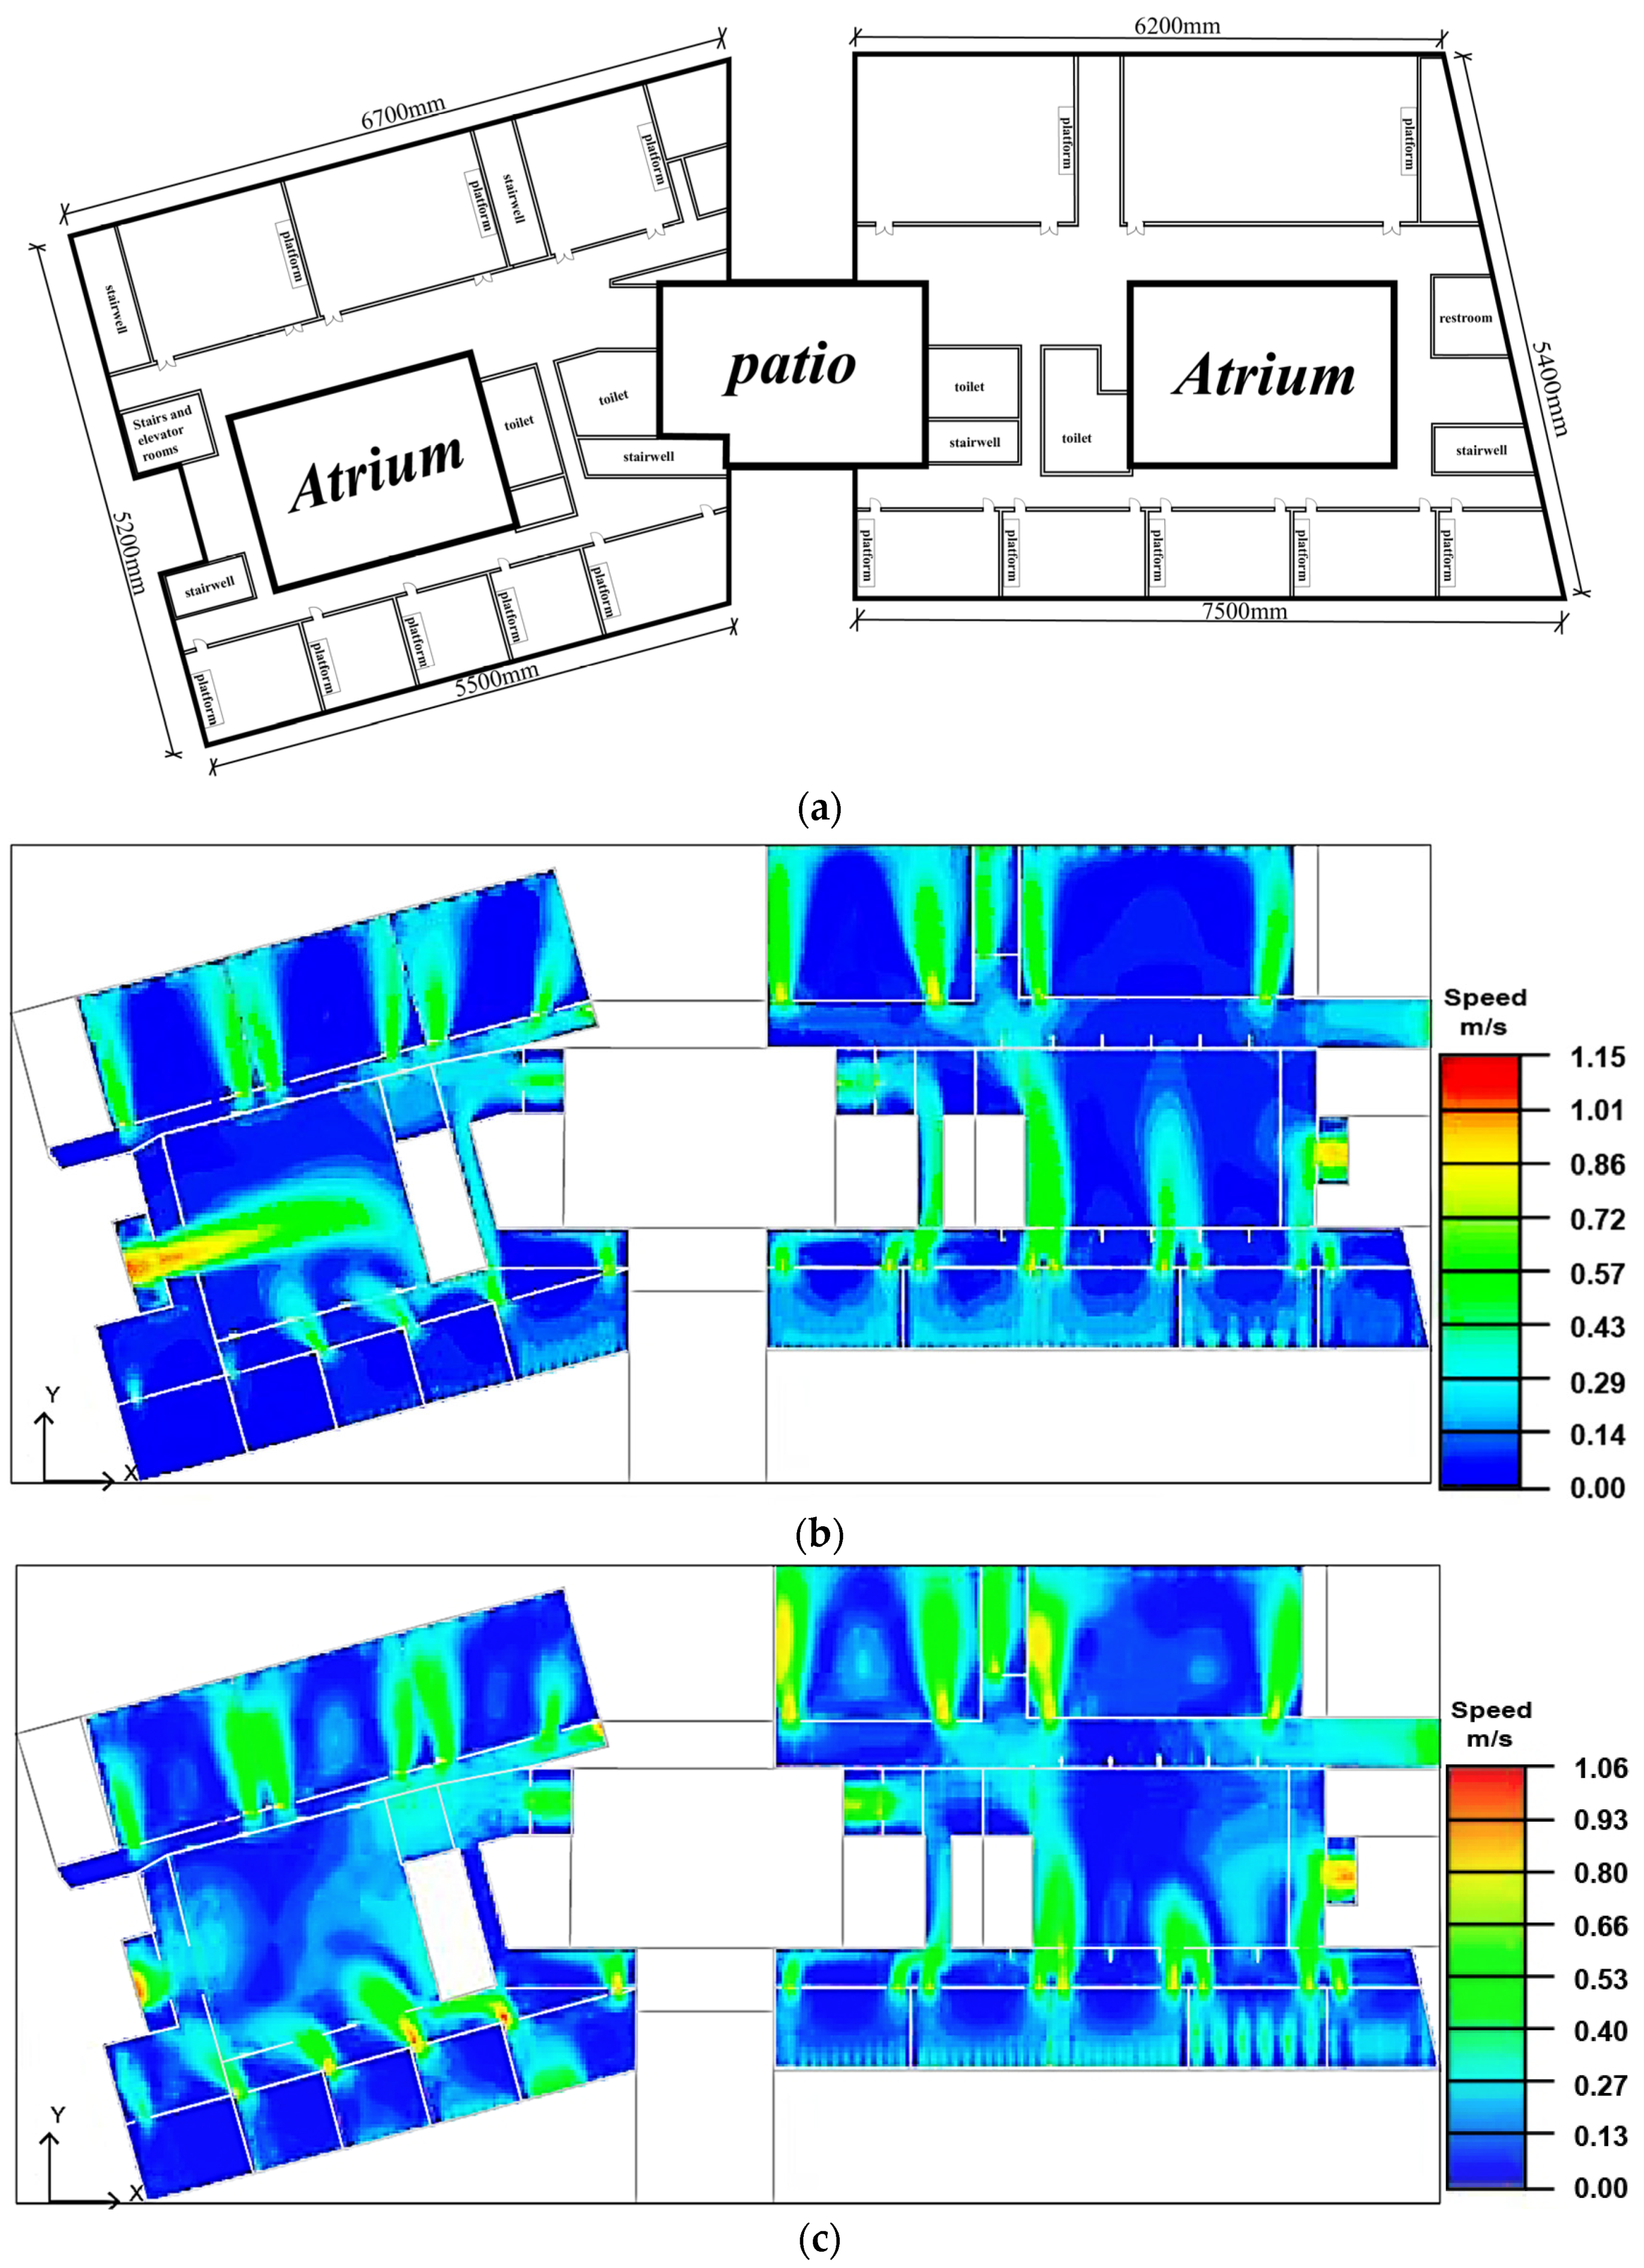
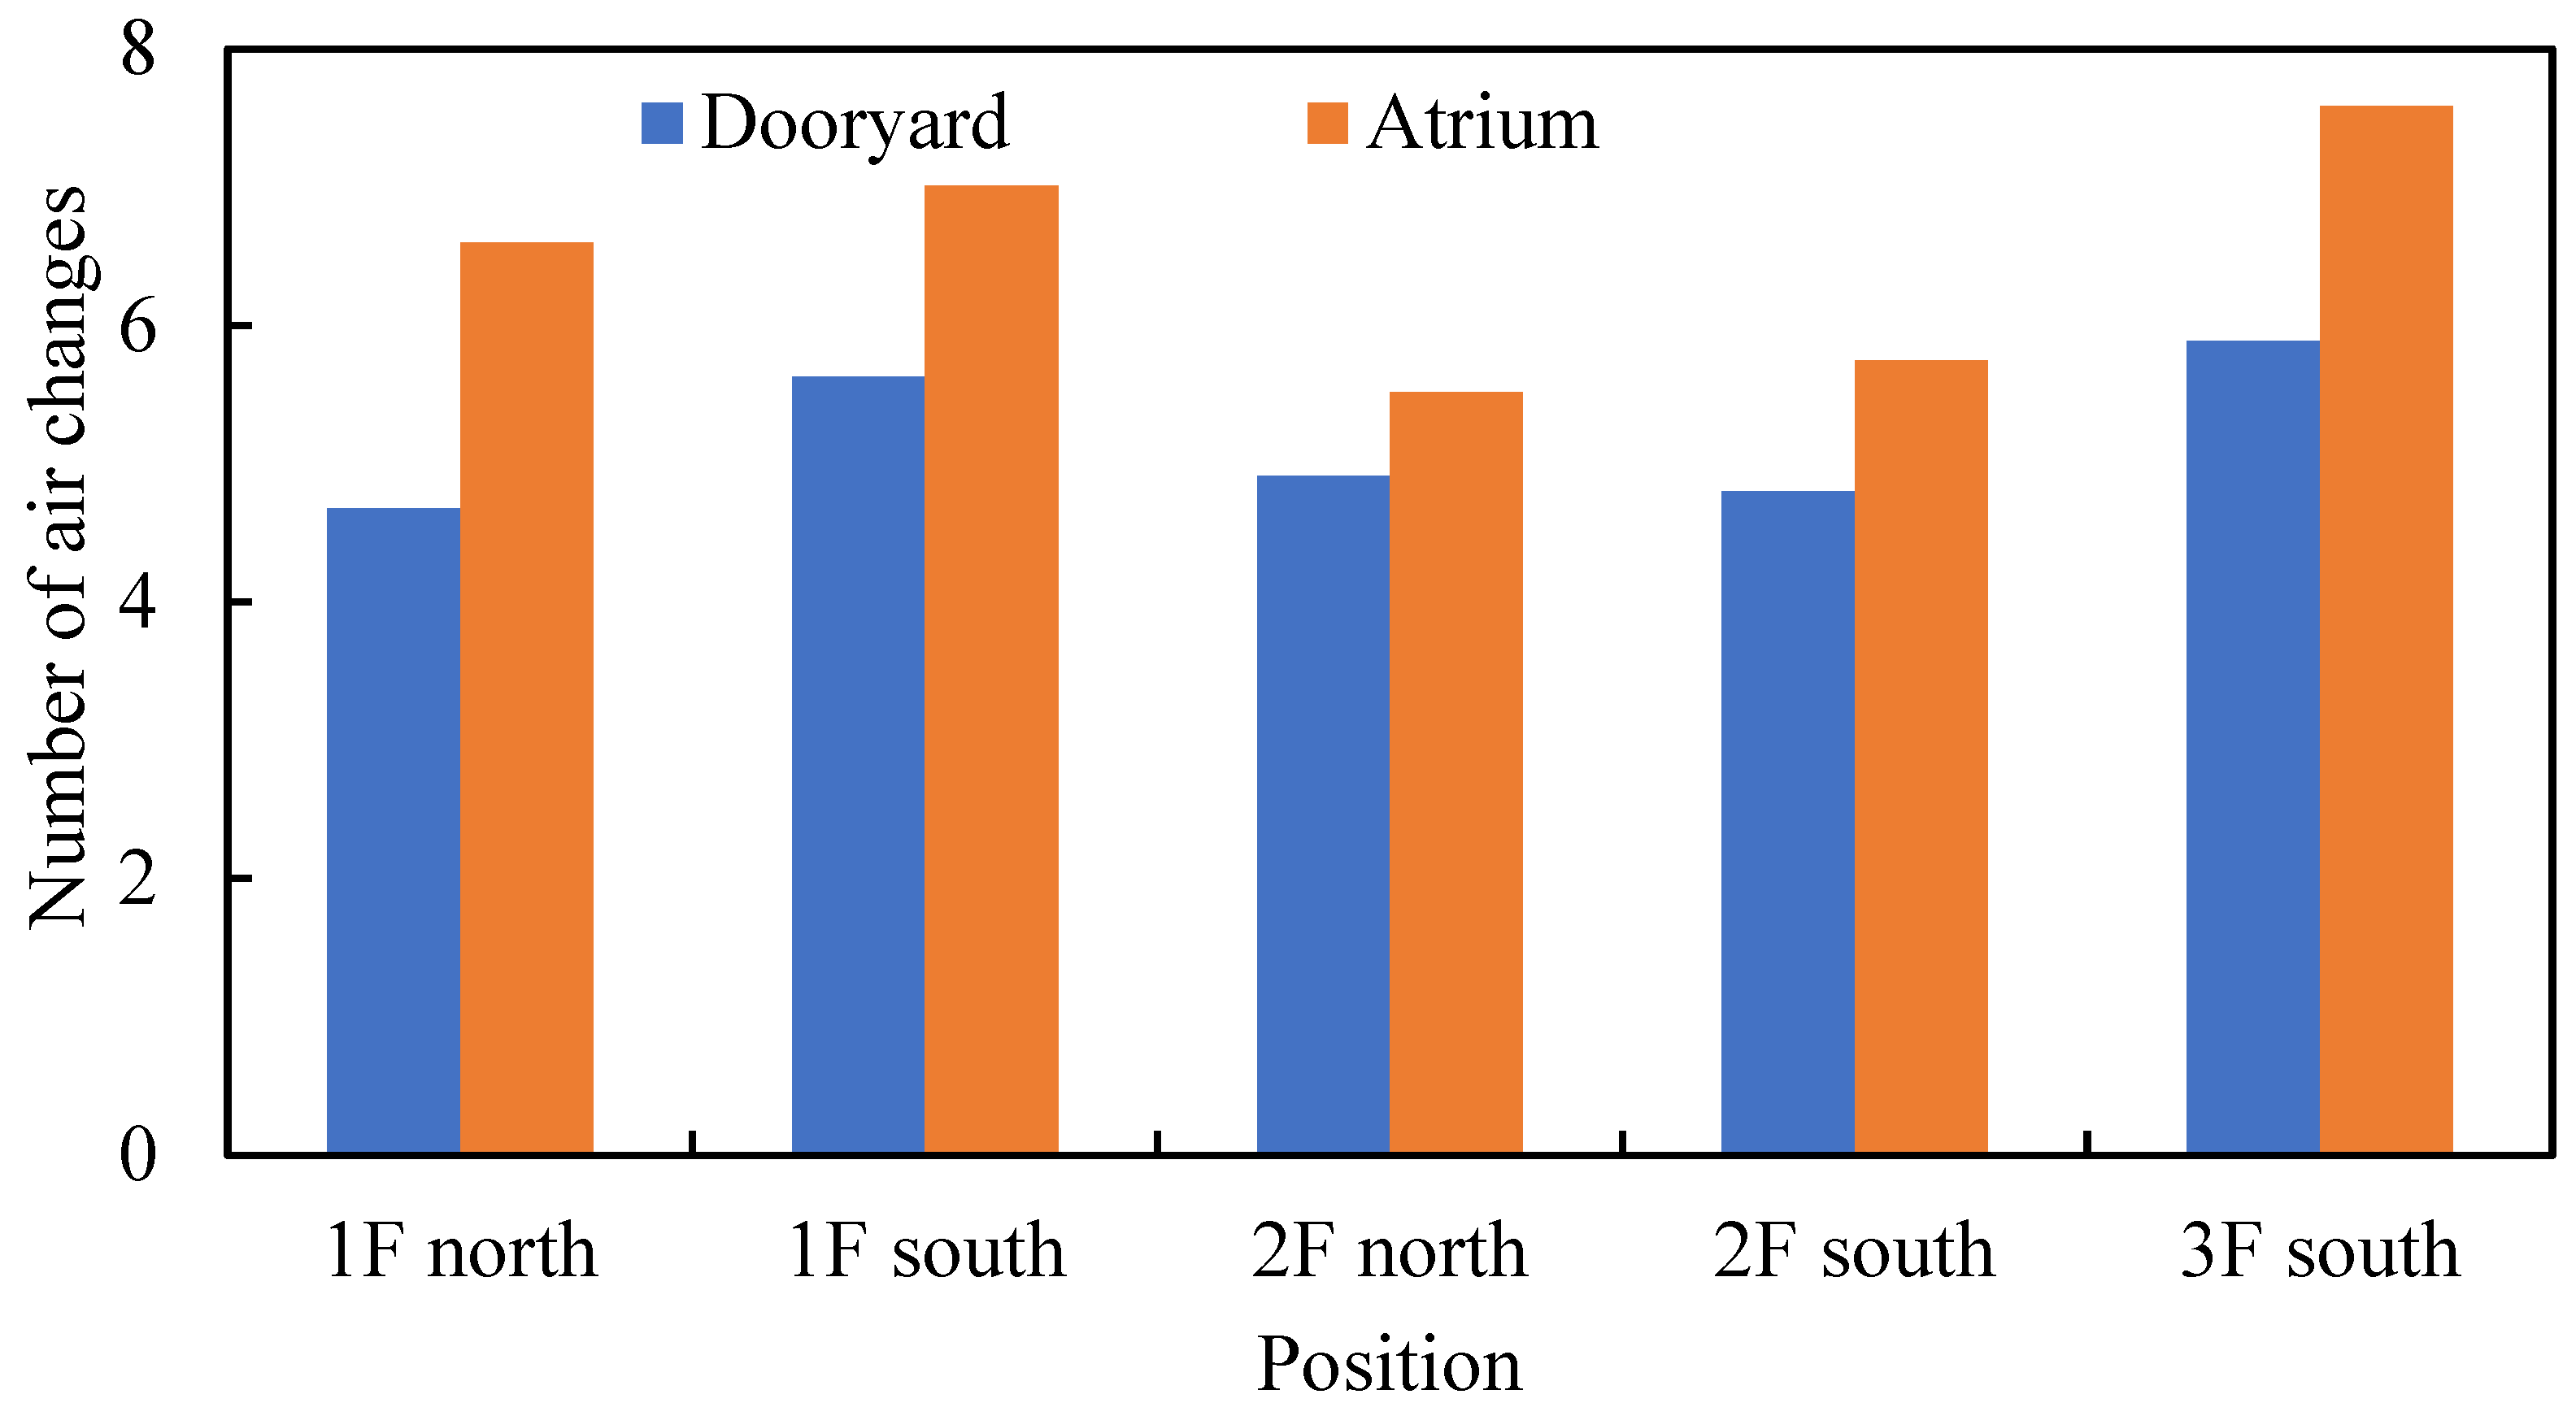
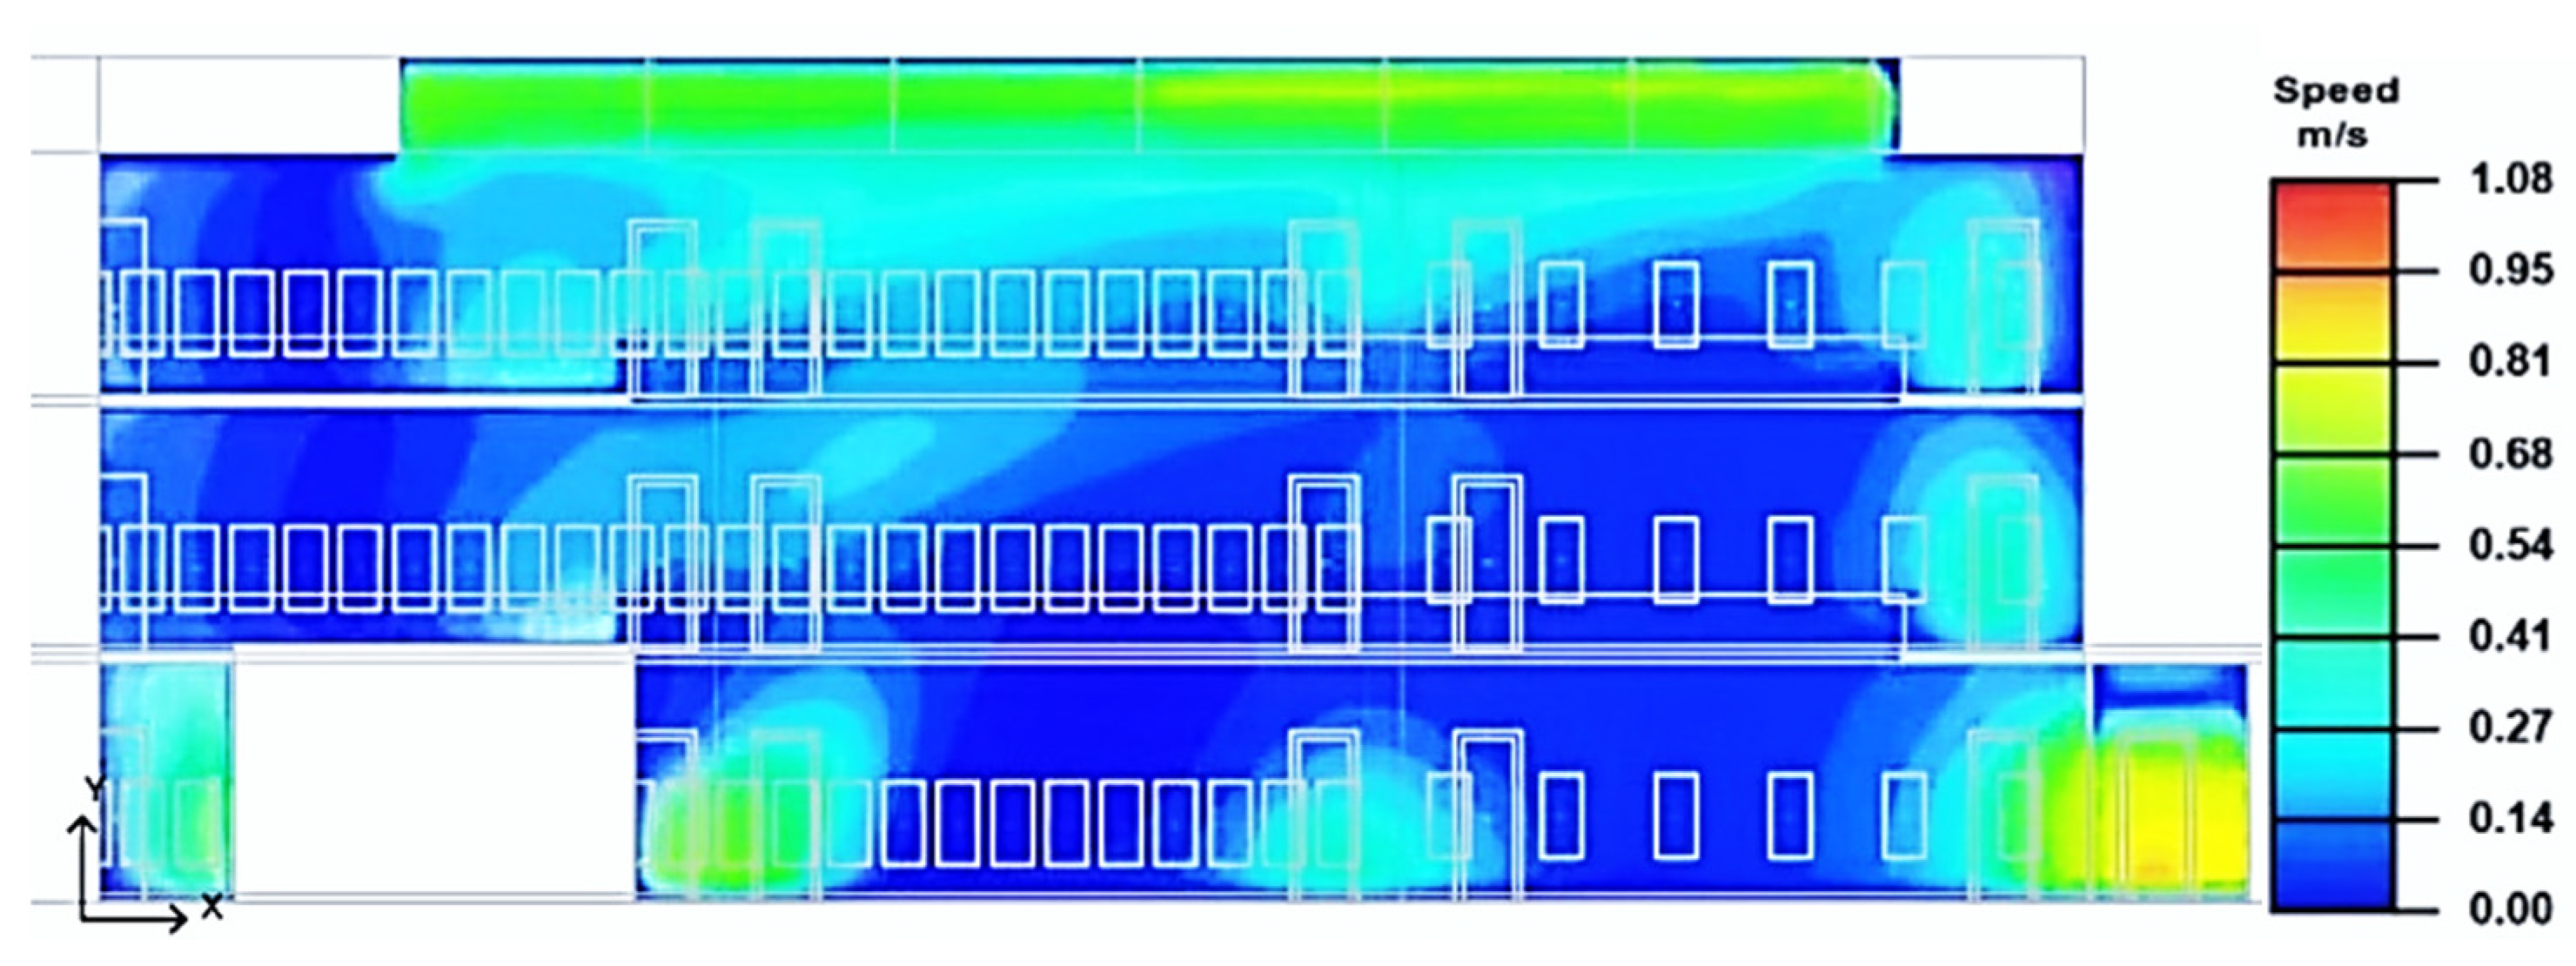
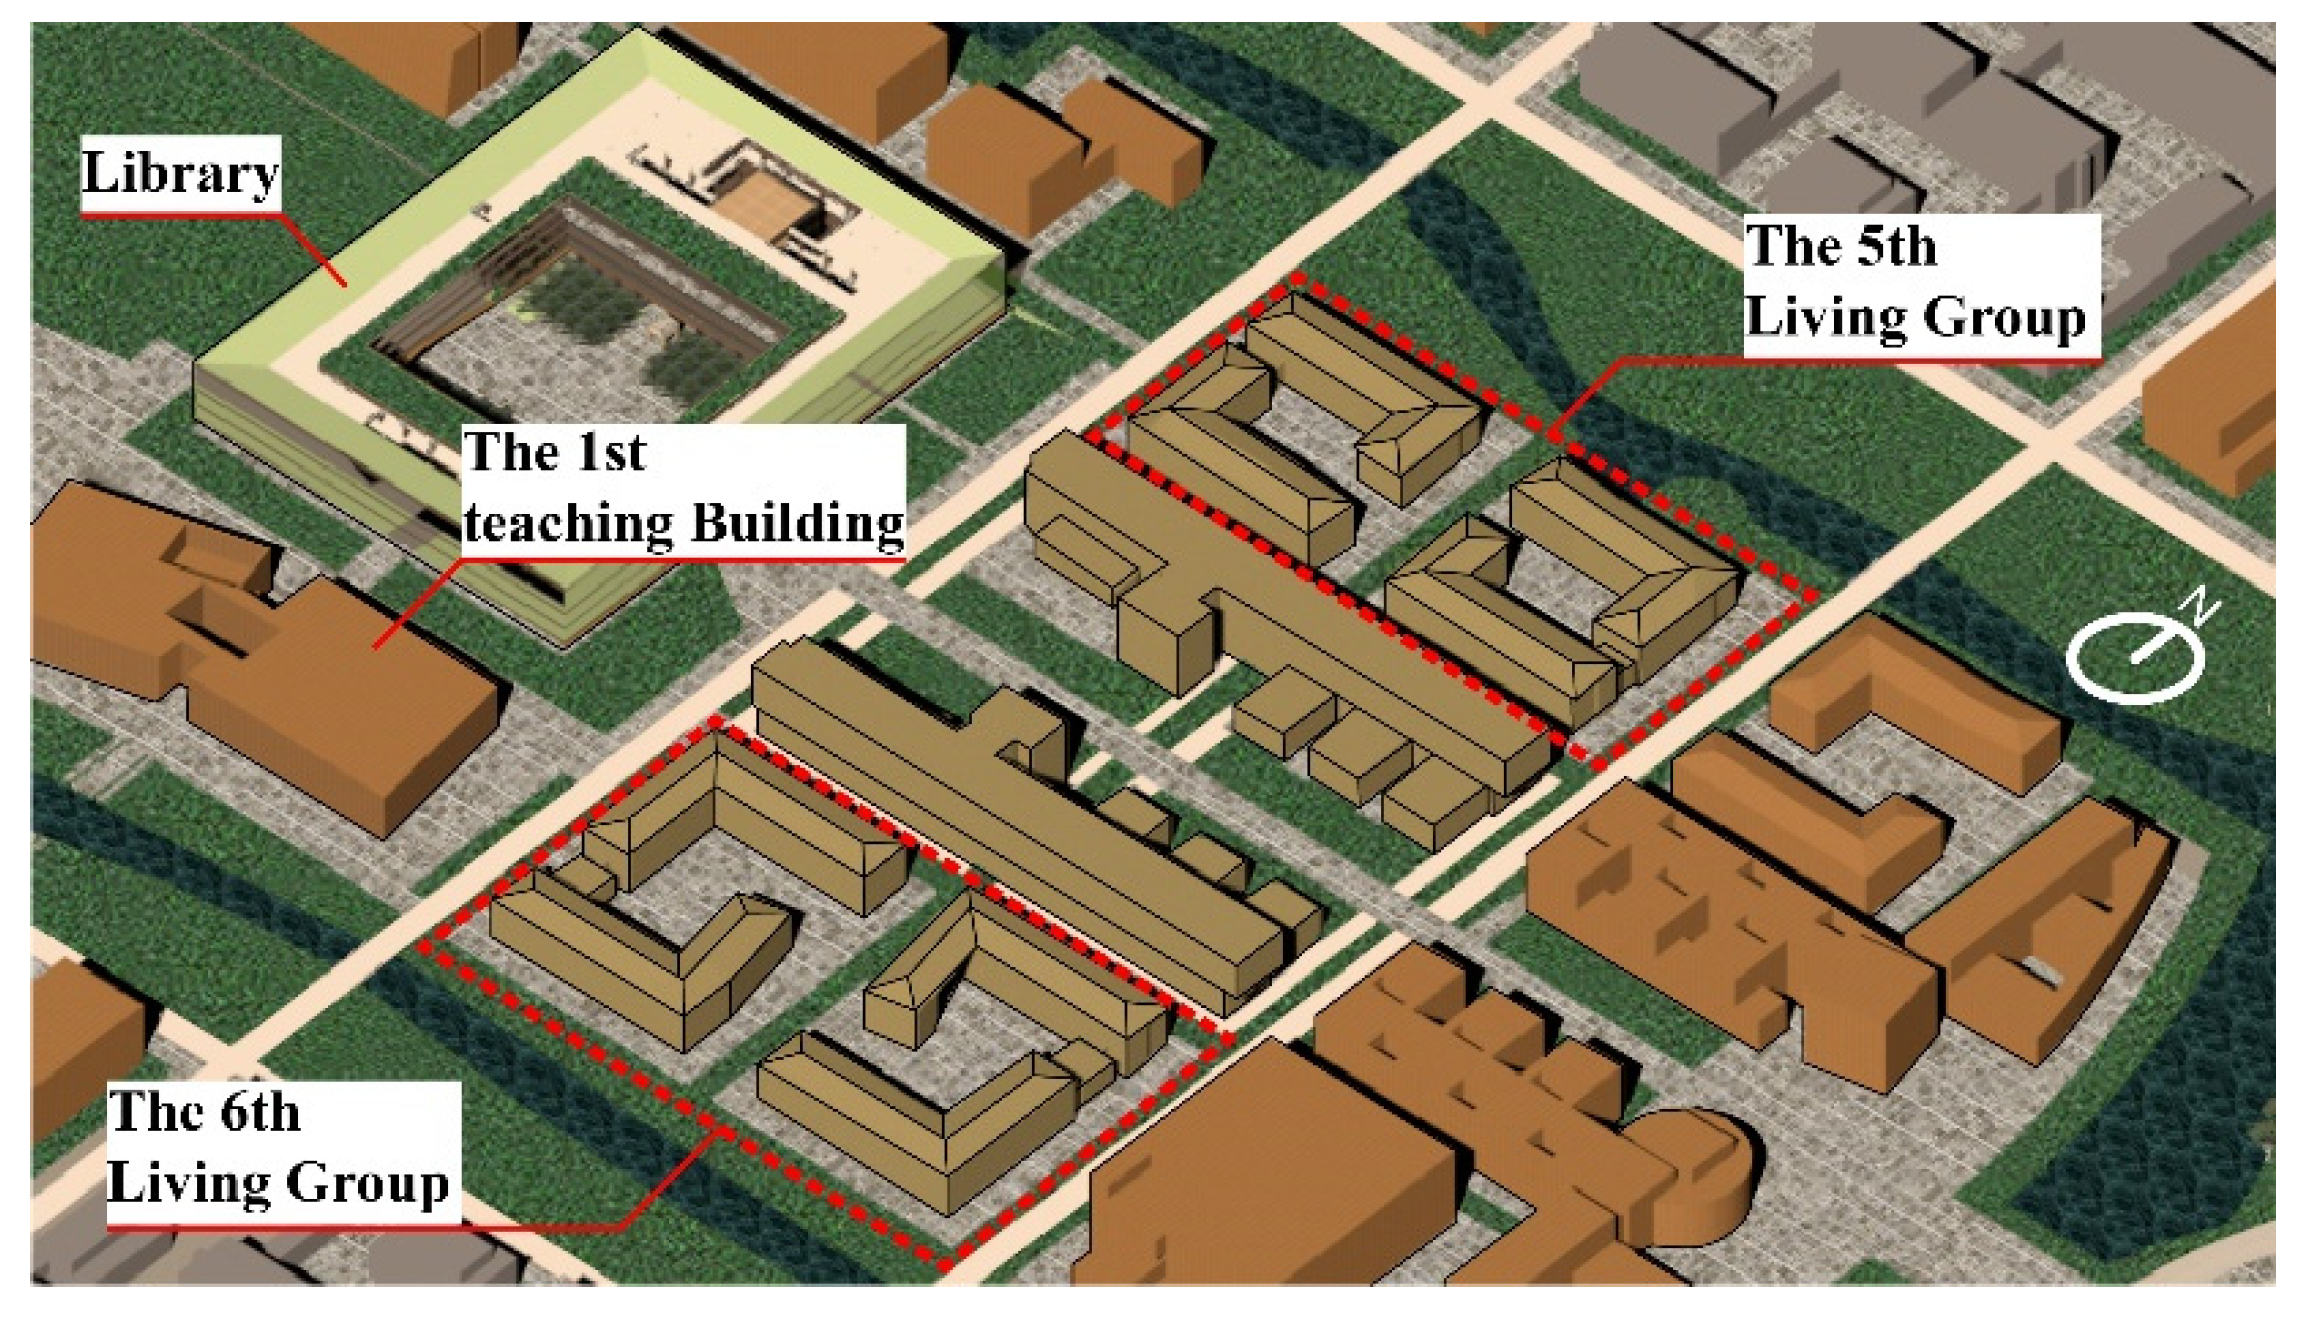
3.1.1. Indoor Ventilation of the First Teaching Building

As shown in Figure 1a, the teaching building is composed of two main bodies—east zone and west zone—connected by an atrium, with a 1.3 m high openable vertical window-type patio set at the roof of the atrium skylight. The initial design plan is to set up a patio both at the connection of the east and west zones and inside, which can serve as a transition between different functions and ensure natural indoor ventilation. Direct contact between the classroom and the outdoors is not conducive to heat preservation and rain protection, but retaining the two zones via the retention of the patio between the two zones is conducive to the formation of the chimney effect, which strengthens the ventilation efficiency and thus ensures the indoor air quality. The simulation results of PHOENICS software show that the overall number of air changes in the main indoor functional spaces reaches 5.48 times/h and 5.52 times/h when all the vents of the project are opened, respectively.
In the actual measurement, it can be seen that the wind speed inside the classroom under the initial building layout scheme is between 0.2 and 0.6 m/s, which has a good natural ventilation effect. According to the climatic parameters of Tianjin city [37] (GB50736-2012), the wind speed at the height of 1 m was compared under the outdoor wind environment conditions of the transitional season (March–June and September–November, 10 a.m.). However, if a patio is set up inside the building, which plays a gathering role for airflow, it can be seen from Figure 1b,c that the average wind speed in the corridor after the alteration is raised from 0.5 m/s to 0.8 m/s, causing a sense of blowing wind for pedestrians. Therefore, changing the patio into an atrium reduces the unevenness of the internal flow field of the teaching building, alleviates the degree of convergence of airflow at the corridor, with a wind speed of only about 0.4 m/s, and improves indoor airflow comfort. Figure 2 gives the number of air changes in each main activity area before and after the alteration. Setting the atrium can significantly increase the number of air changes on each floor of the first teaching building and reach more than 7 times/h on the first and third floors, and the average number of air changes in the overall functional space is 6.49 times/h.
As shown in Figure 3, the existence of the atrium can play the role of wind-pulling and cooling. The less-dense hot air floats up in the atrium, forming a thermal plume, and the resulting stable pressure difference can drive the flow of indoor air, thus forming stable ventilation and effectively reducing the temperature of the classroom in summer.
There is an obvious phenomenon of seasonal change in the wind direction at the location of the campus. The dominant wind direction throughout the year is southwest with a frequency of 15–20%; northwest and north winds prevail in winter with a frequency of 20–30% and a maximum wind speed of 20 m/s; southwest and south winds prevail in summer with a frequency of approximately 20% and a maximum wind speed of 16 m/s; spring and autumn are in the transitional season, with the most southwest and southerly winds and the lowest wind speed. The wind environment of the overall building layout is shown in Figure 4. The wind speed in the core area of the campus is low in the teaching area, dormitory area, and living service area, and the overall layout is reasonable.

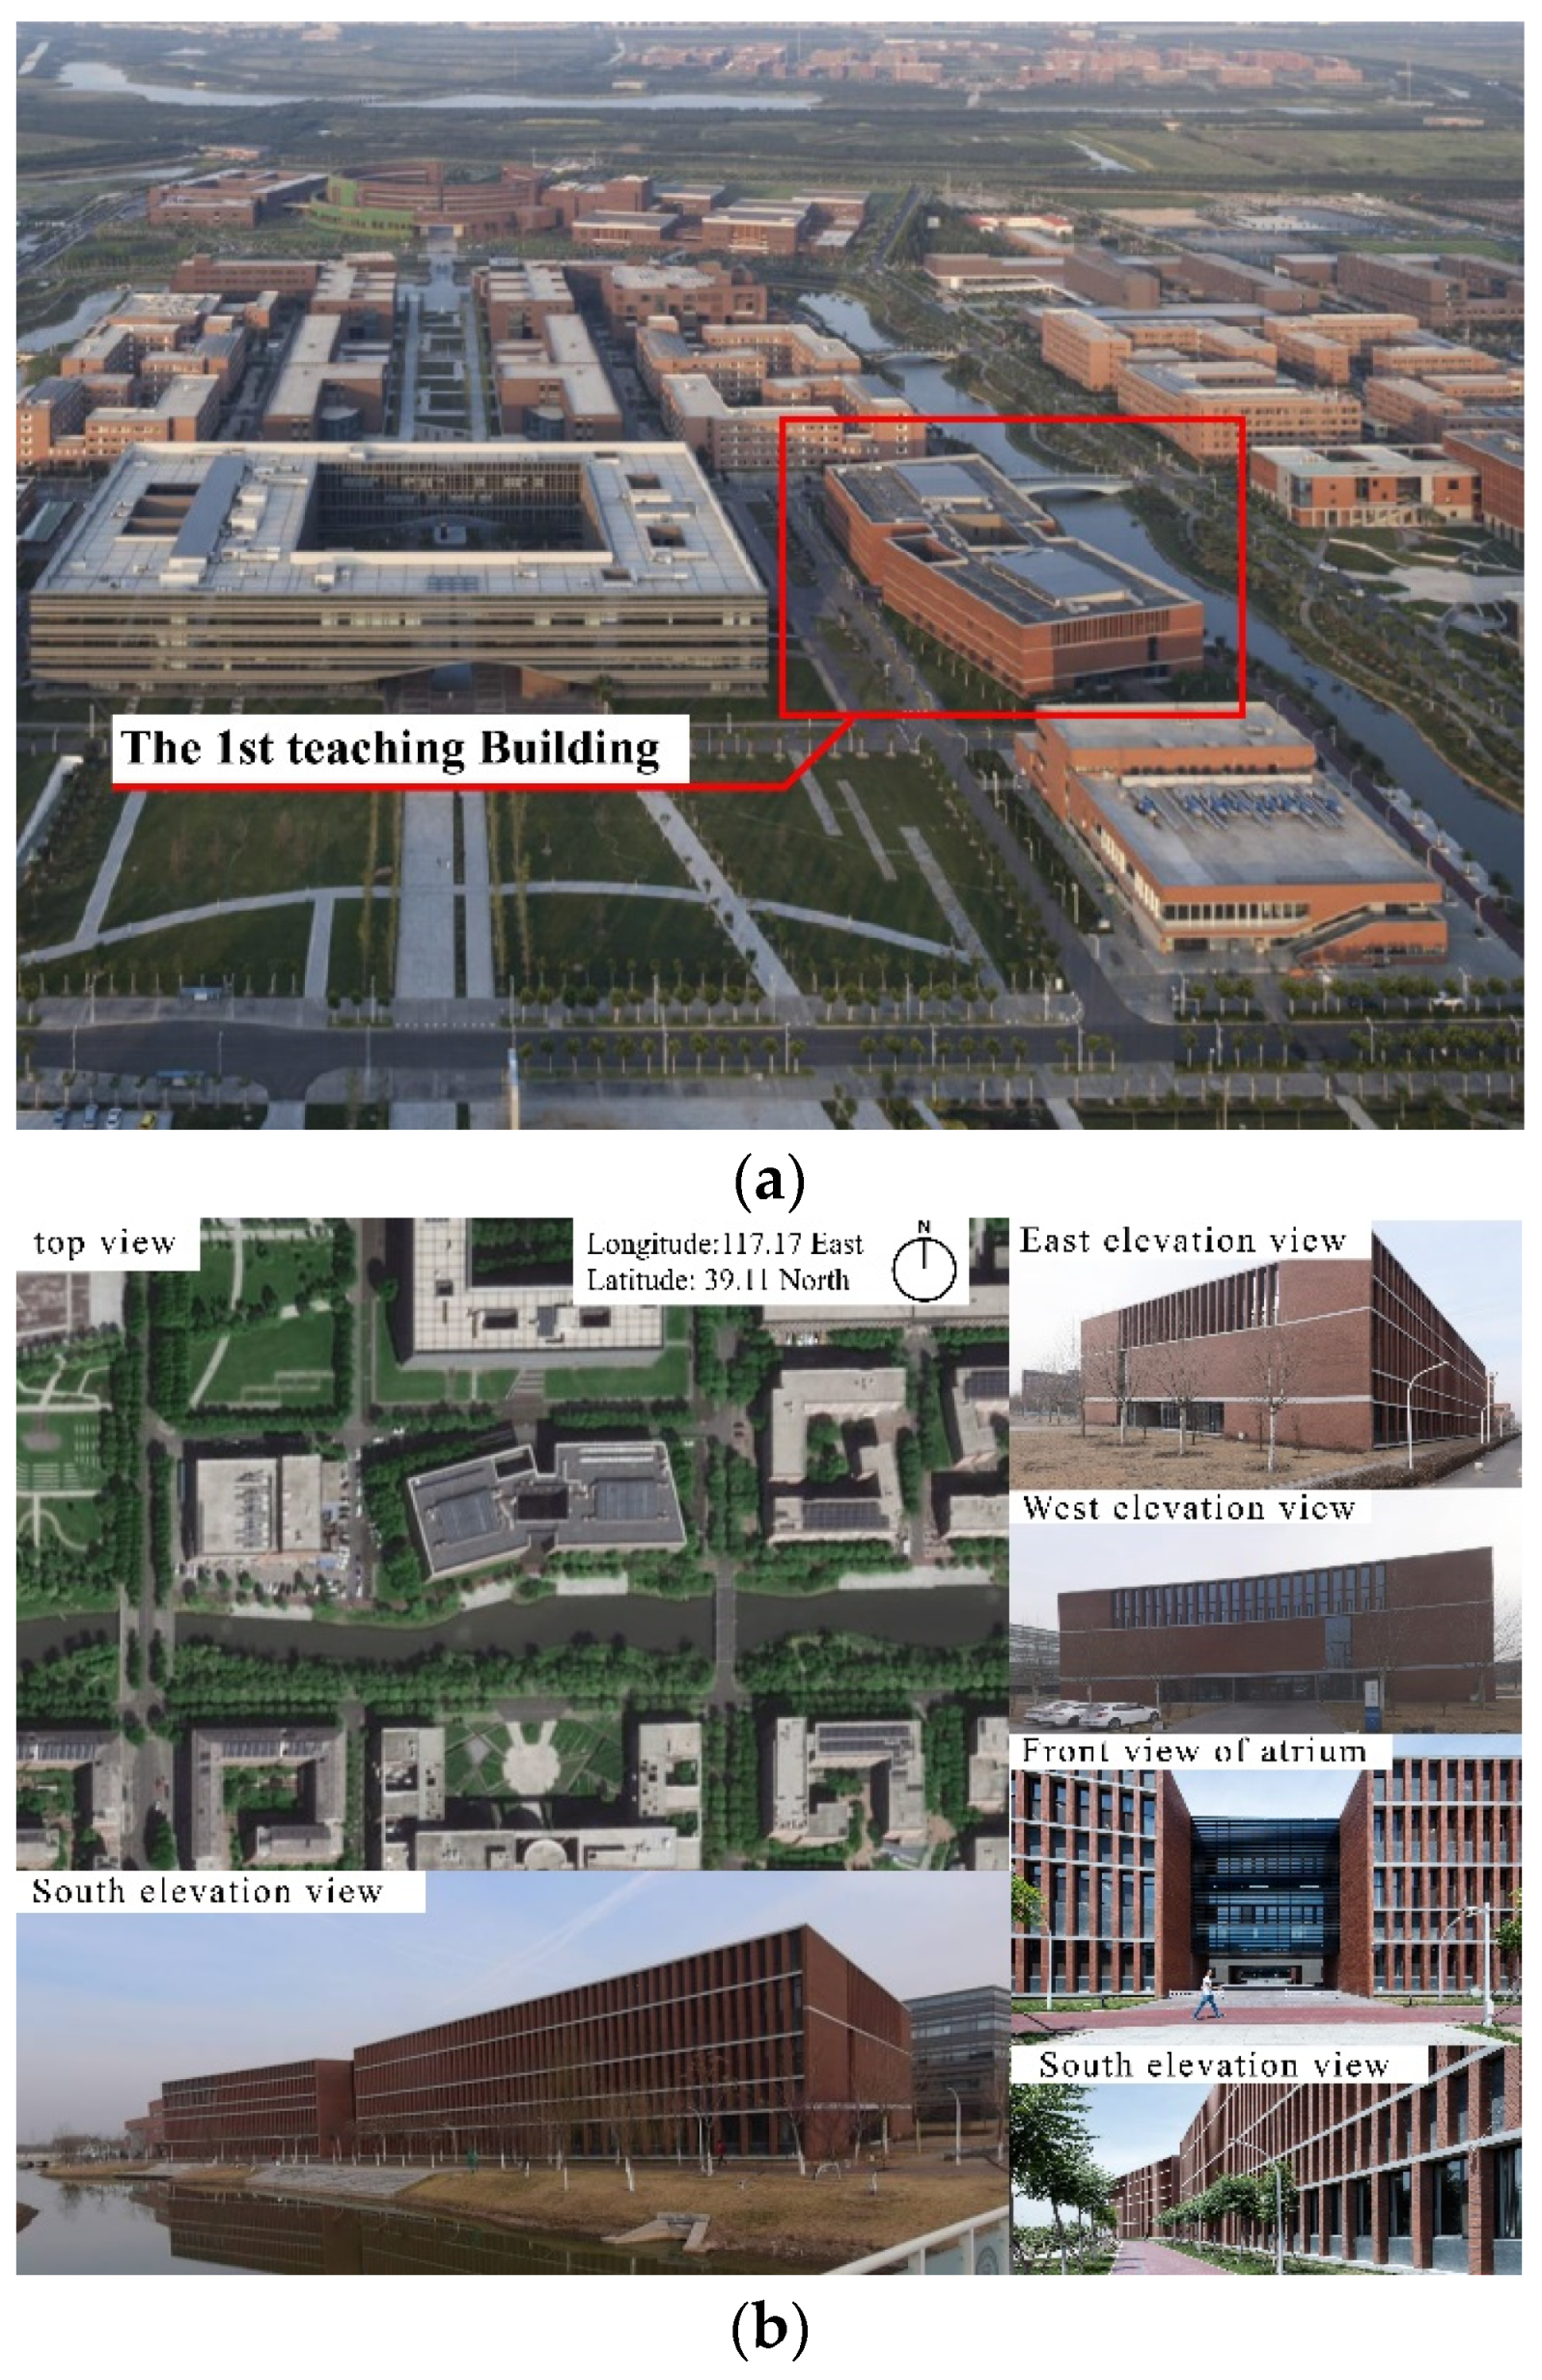
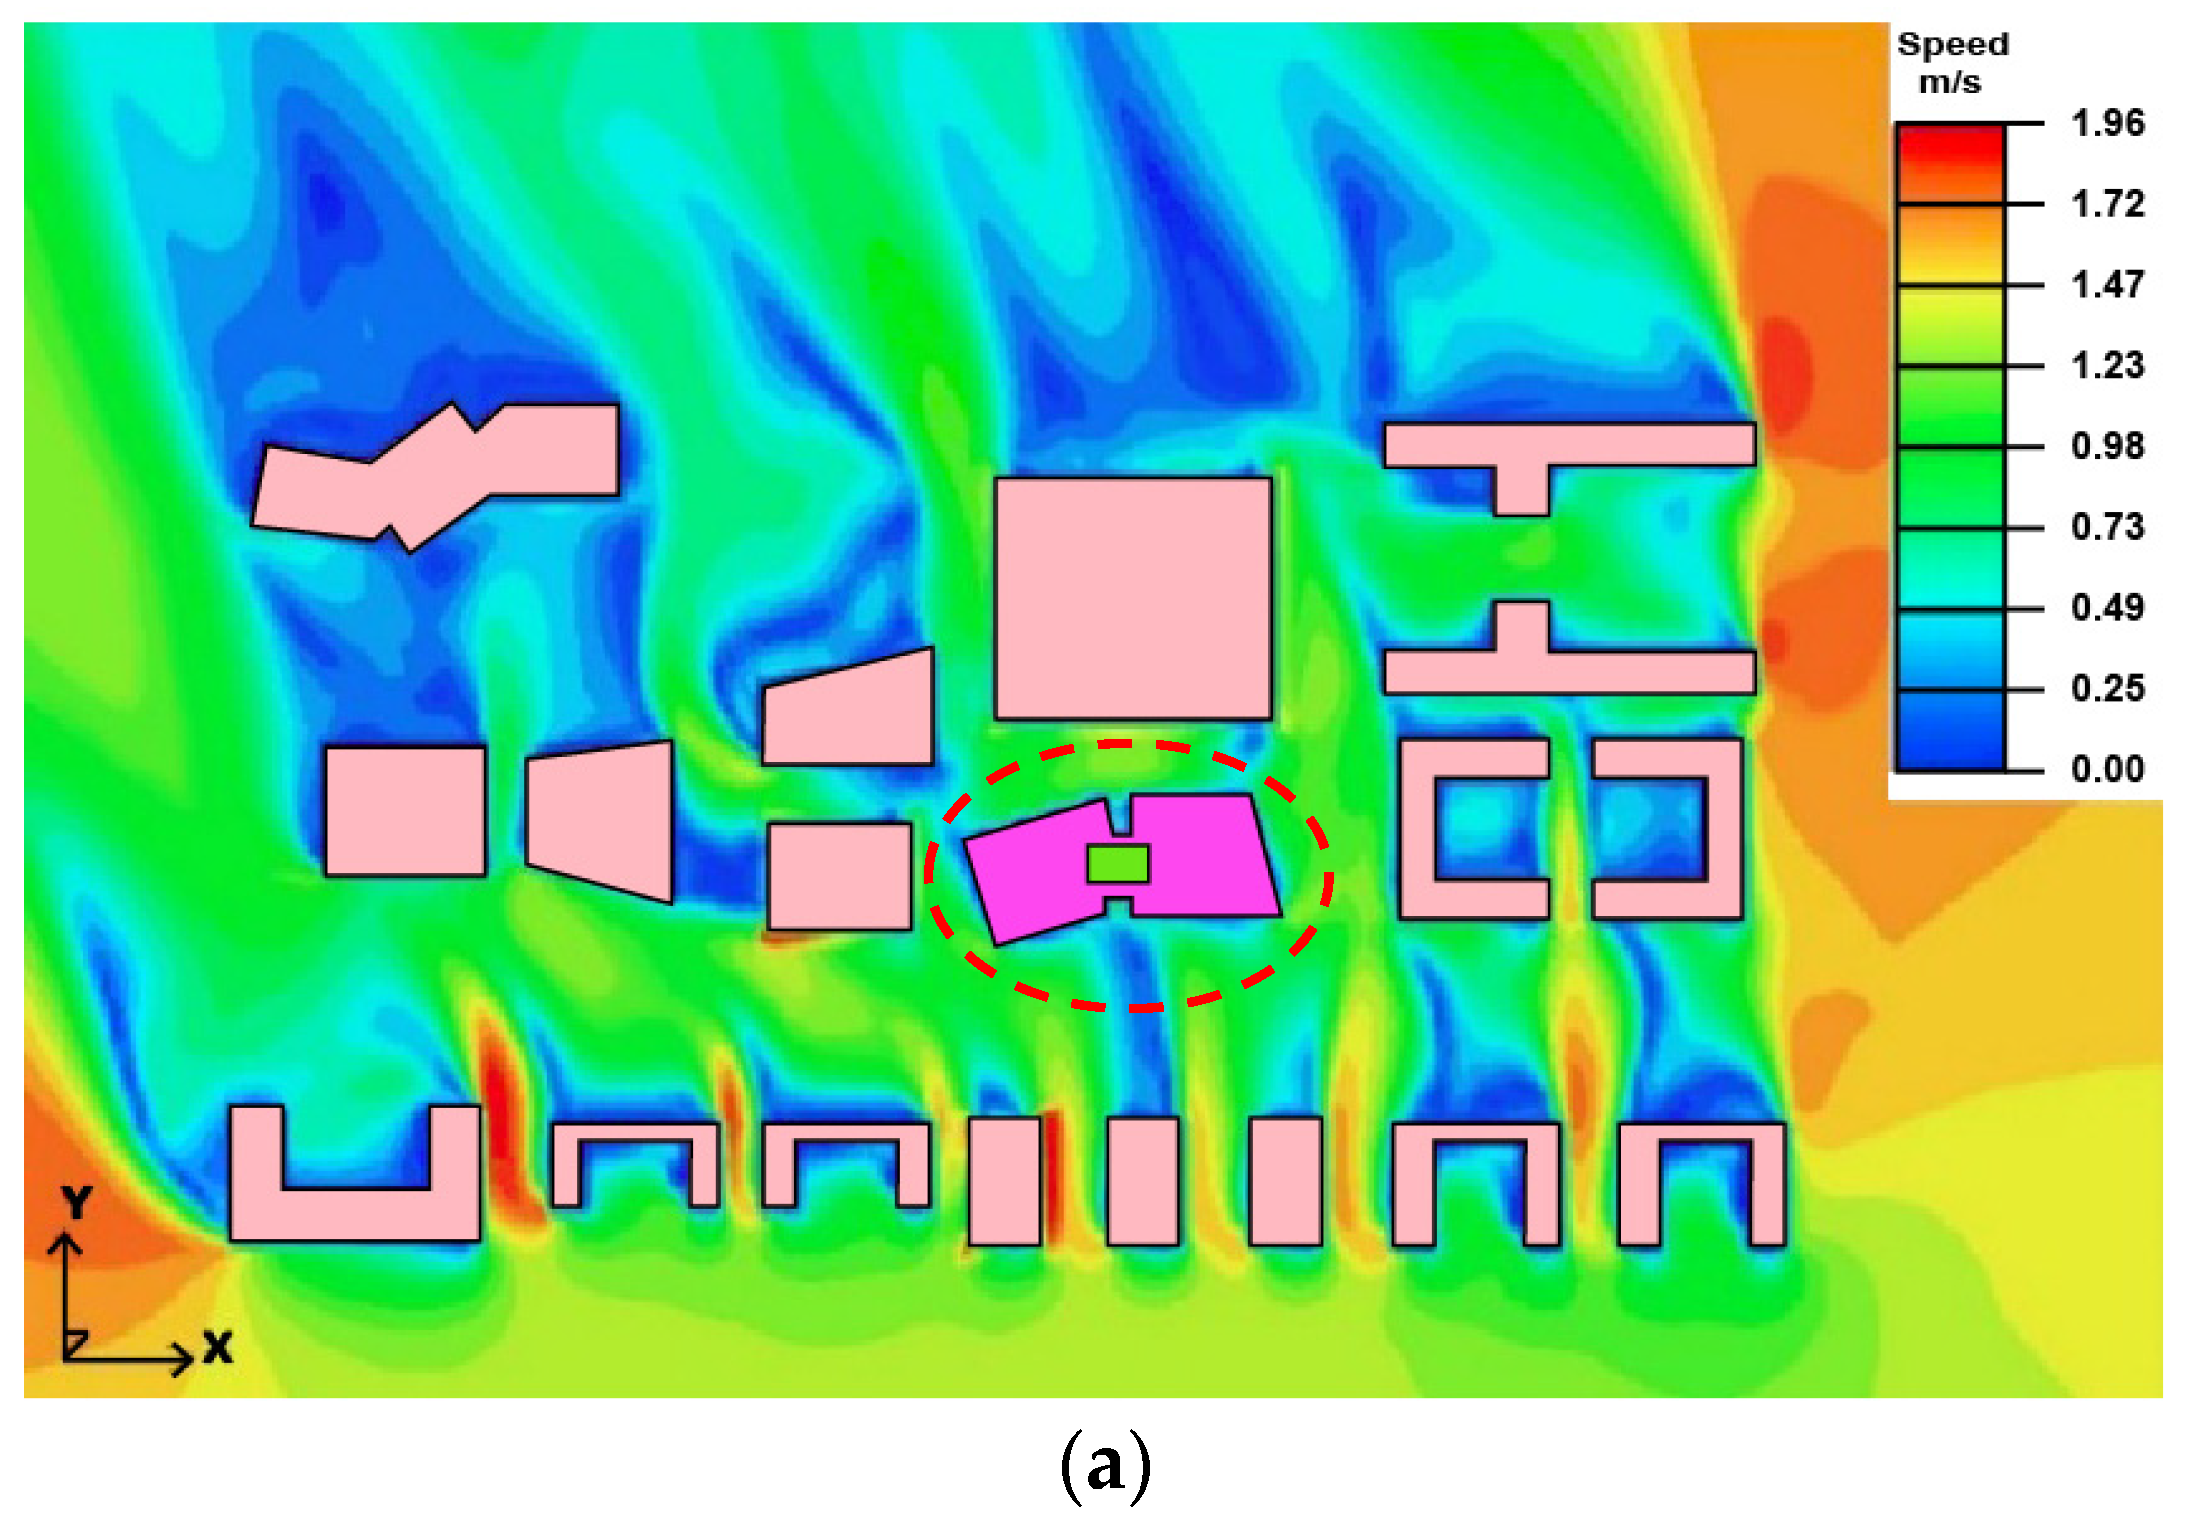
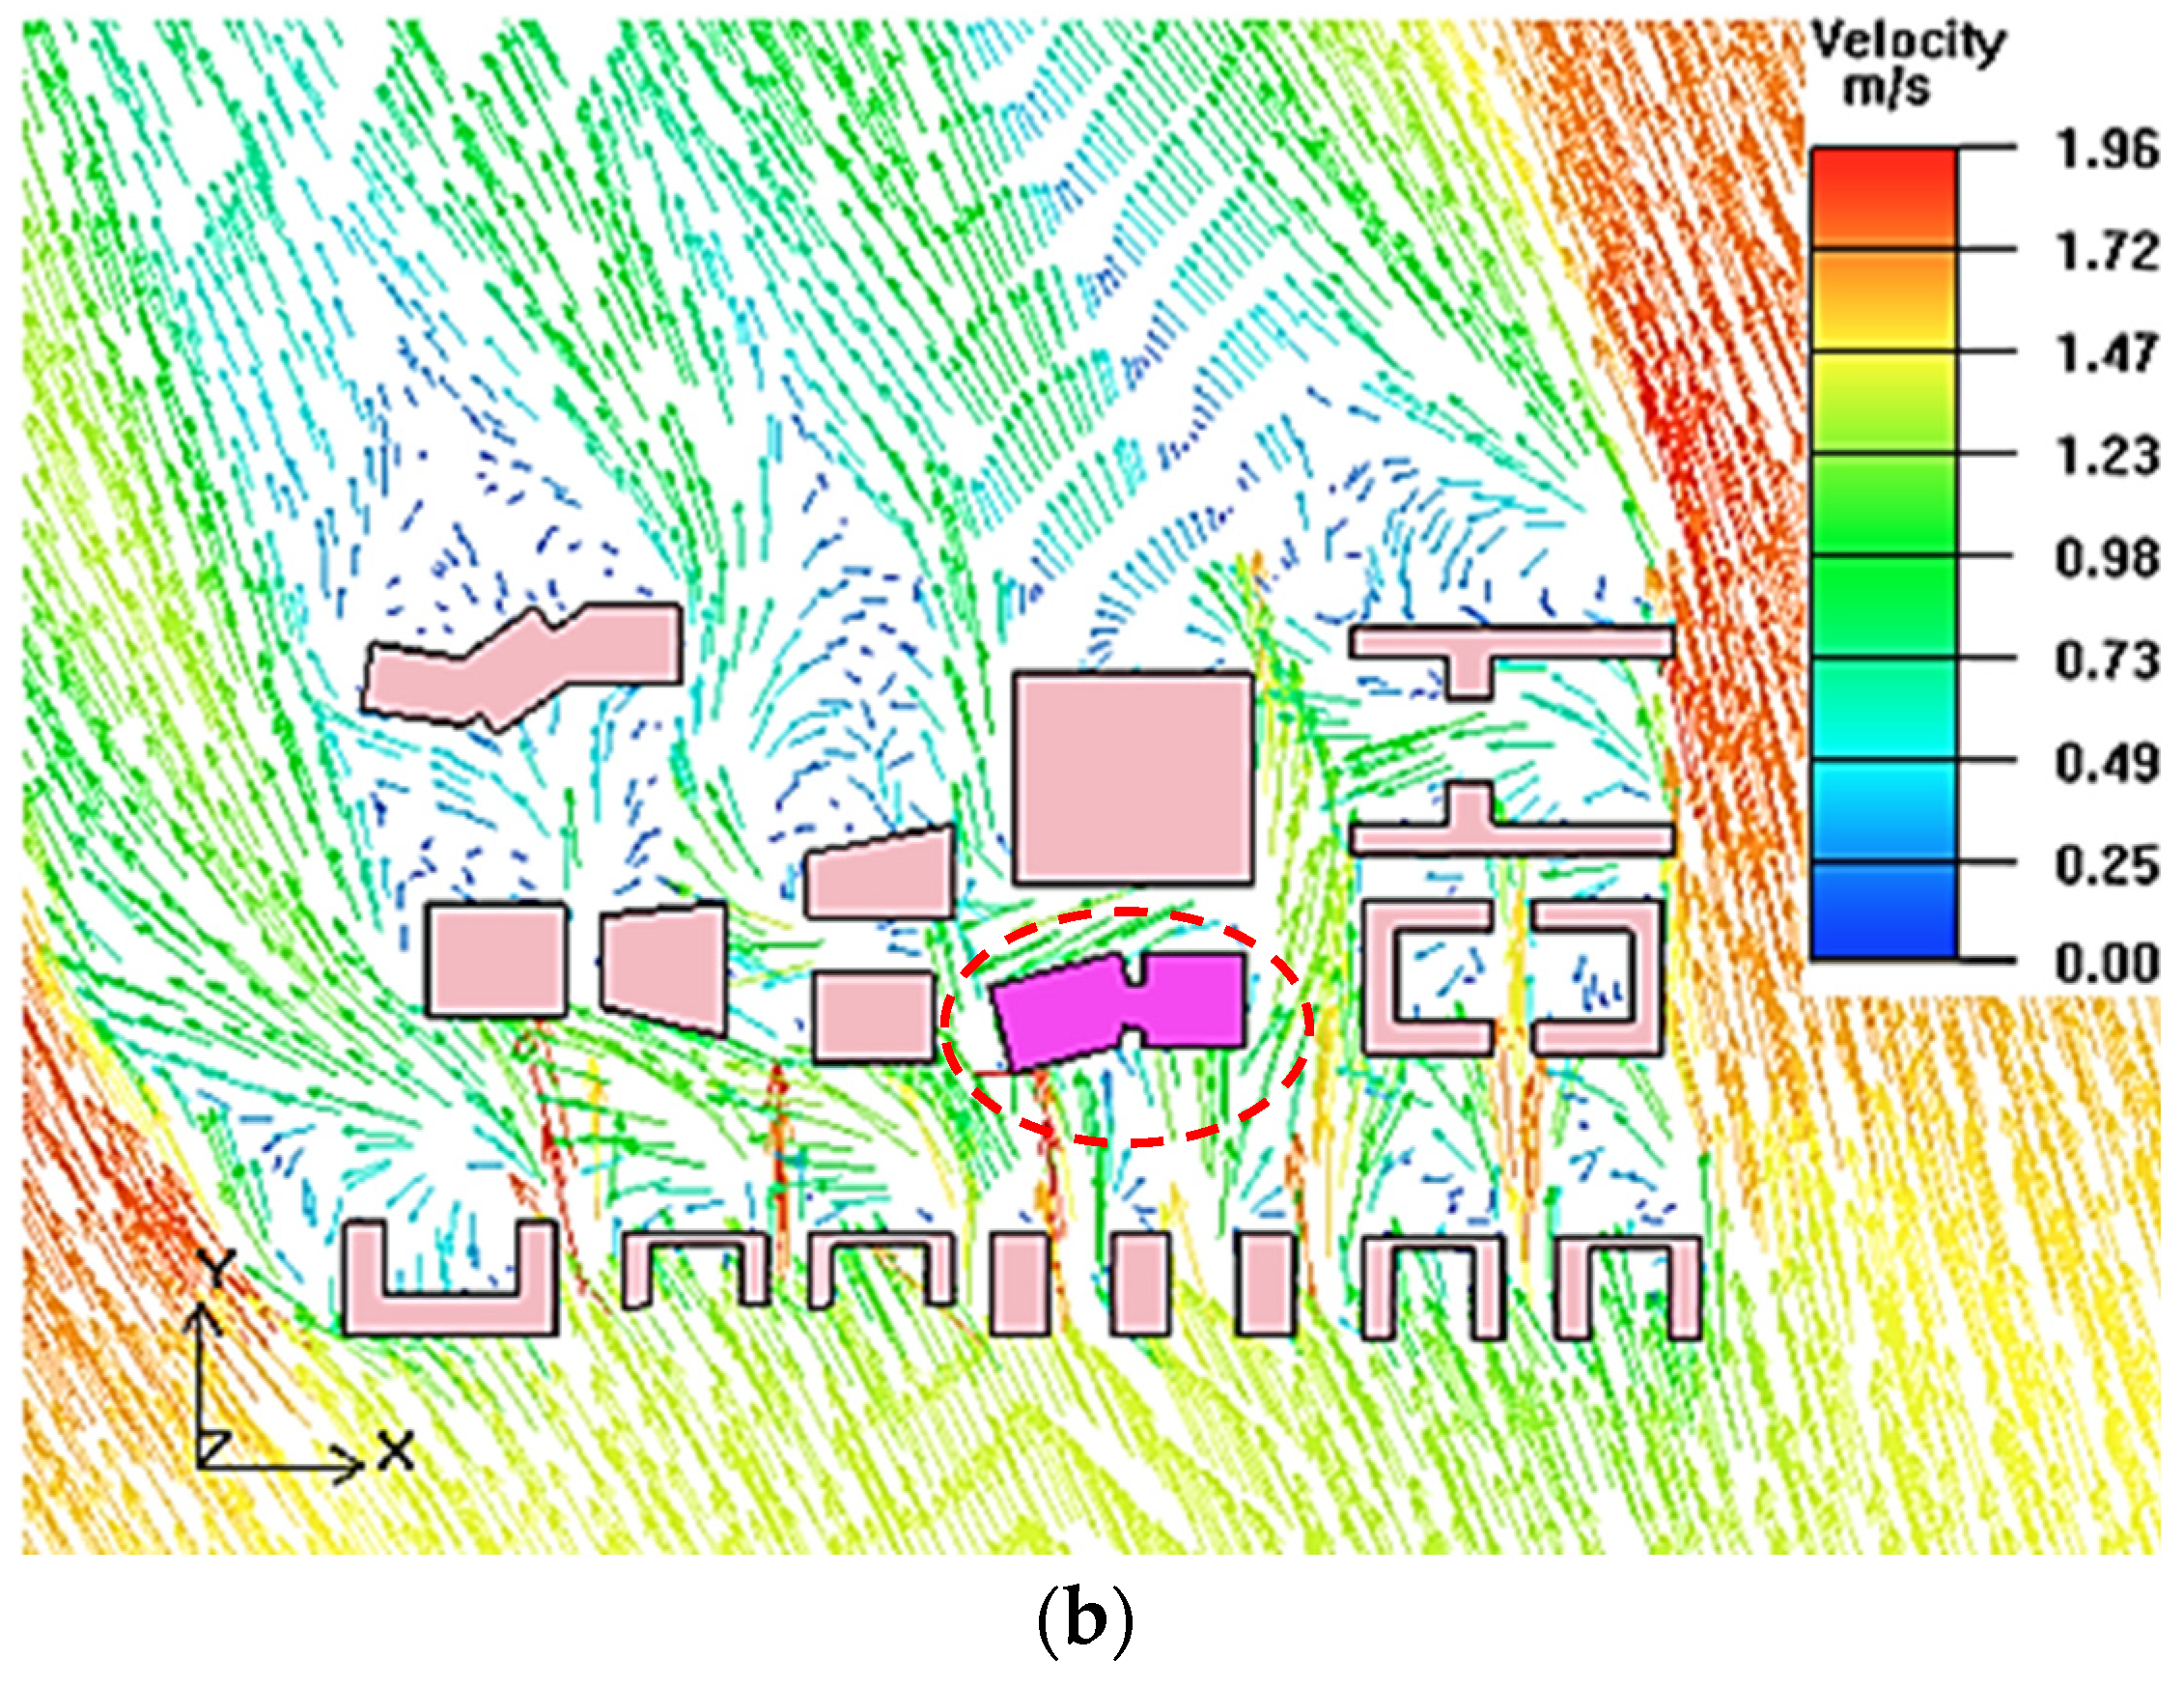
3.1.2. The Wind Environment of the First Teaching Building

In existing standards [38], the wind speed in the pedestrian zone around the building is less than 5 m/s. Figure 5 gives a realistic aerial view of the first teaching building, and the simulation prediction analysis of the wind speed around the first teaching building is shown using PHOENICS software.
Based on statistical results [39] (the Meteorological Data Room of the Meteorological Information Center of the China Meteorological Administration 2005), the working conditions shown in Table 2 were simulated. Table 3 shows the outdoor wind speed and direction, the wind speed at the height of 1.5 m and 10 m, the wind speed range at the campus, and the wind speed amplification coefficient for the first teaching building under different working conditions.
Figure 6 shows the wind speed contour and velocity vector diagram at the height of 1.5 m for the first teaching building ground in working condition 1. After the calculation by PHOENICS, it can be seen that the maximum wind speed of the yearly dominant wind direction at a height of 1.5 m on campus around the first teaching building is 3.29 m/s, which is less than the code requirement [38]. The maximum wind speed amplification factor is 0.99, which is less than the code requirement of 2. There is no vortex and stagnant wind area, and there is a large pressure difference between different facades of the building in summer and transitional seasons. The pressure difference between different facades of the building, except the windward side in winter, is about 1.0 Pa, which is less than the code requirement of 5 Pa and meets the requirement of pedestrian comfort.

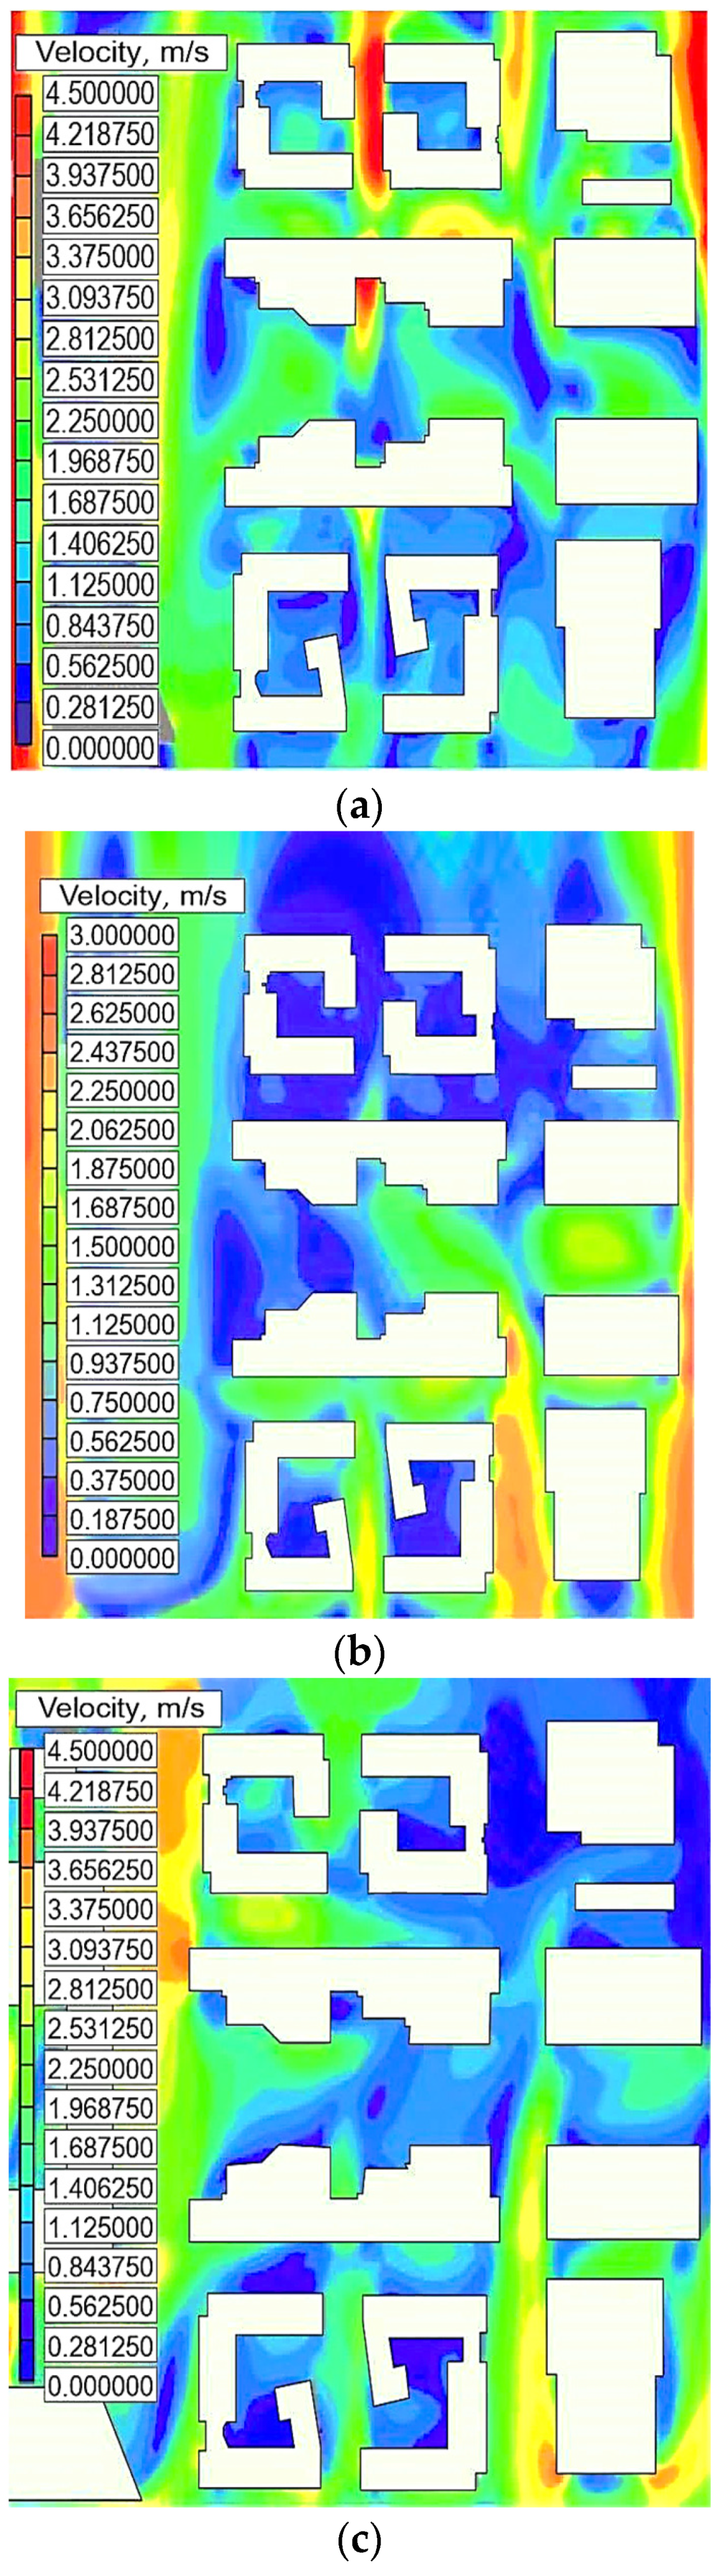
3.1.3. The Wind Environment of the Living Area Cluster

The campus wind environment is not only related to the climate but also to the shape and layout of the building. Figure 7 shows the composition of the living cluster building. The overall layout and design of the building need to avoid the dominant winter wind direction, which can reduce the wind pressure difference between the buildings. In this section of the study, the outdoor air flow of the living area cluster is simulated.
Figure 8 shows the wind speed and pressure difference at the height of 1.5 m around the building during winter, summer, and transition seasons. Figure 8a shows the average wind speed at the outdoor pedestrian height in winter as 4 m/s, which is less than the 5 m/s required by the code [40] (DB-T29-204-2010). The wind speed amplification coefficient is 1.1, less than the code requirement of 2. When the wind speed is higher, the building meets the standard [40] requirement, and the maximum pressure difference on the non-windward side is 1.2 Pa, less than the required 5 Pa. The pressure difference between the windward and windward sides of the building is 9 Pa. The windproofing of the north side of the building needs to be performed in winter, and the airtightness of the north side doors and windows should be strengthened. Figure 8b shows that the average wind speed at the outdoor pedestrian height in summer is 1 m/s, and the ventilation of the building is 4 m/s, less than the 5 m/s required by the code. The overall wind speed amplification coefficient is 1.1, less than the code requirements of 2. Due to the moderate wind speed, the overall ventilation effect is good, which is conducive to indoor heat dissipation. Figure 8c shows that during the transition season at a pedestrian height, the maximum wind speed is 2 m/s with a wind speed amplification factor of 0.77. The wind environment caused by the adjusted building layout fully meets the requirements of the specifications. The outdoor wind environment in the residential cluster area is relatively comfortable due to moderate wind intensity.
In summer, a continuous ventilation rate of 1–2 times/h is required. Night ventilation is a necessary condition for cooling buildings, which requires a high ventilation air flow rate, usually 4–6 times/h air exchange rate [41], and more than 6 times of air exchange will greatly improve indoor comfort. After the comparison and analysis of measured data and simulation data, after careful consideration, it is determined that the atrium is used in the interior of the east and west zones, and the patio is used in the connection between the east and west zones so that the indoor natural ventilation effect can be obtained comfortably. The simulation results of the final program are: under the boundary conditions of average wind speed in the dominant wind direction in summer and transitional season, the wind speed in the human activity area at the height of 1 m from the floor is 0.4 m/s (below the normative requirement of 1 m/s), and the number of air exchanges are all 5 times/h, which meets the requirement of ensuring that the number of air exchanges of major functional rooms is not less than 2 times/h under the condition of natural ventilation.

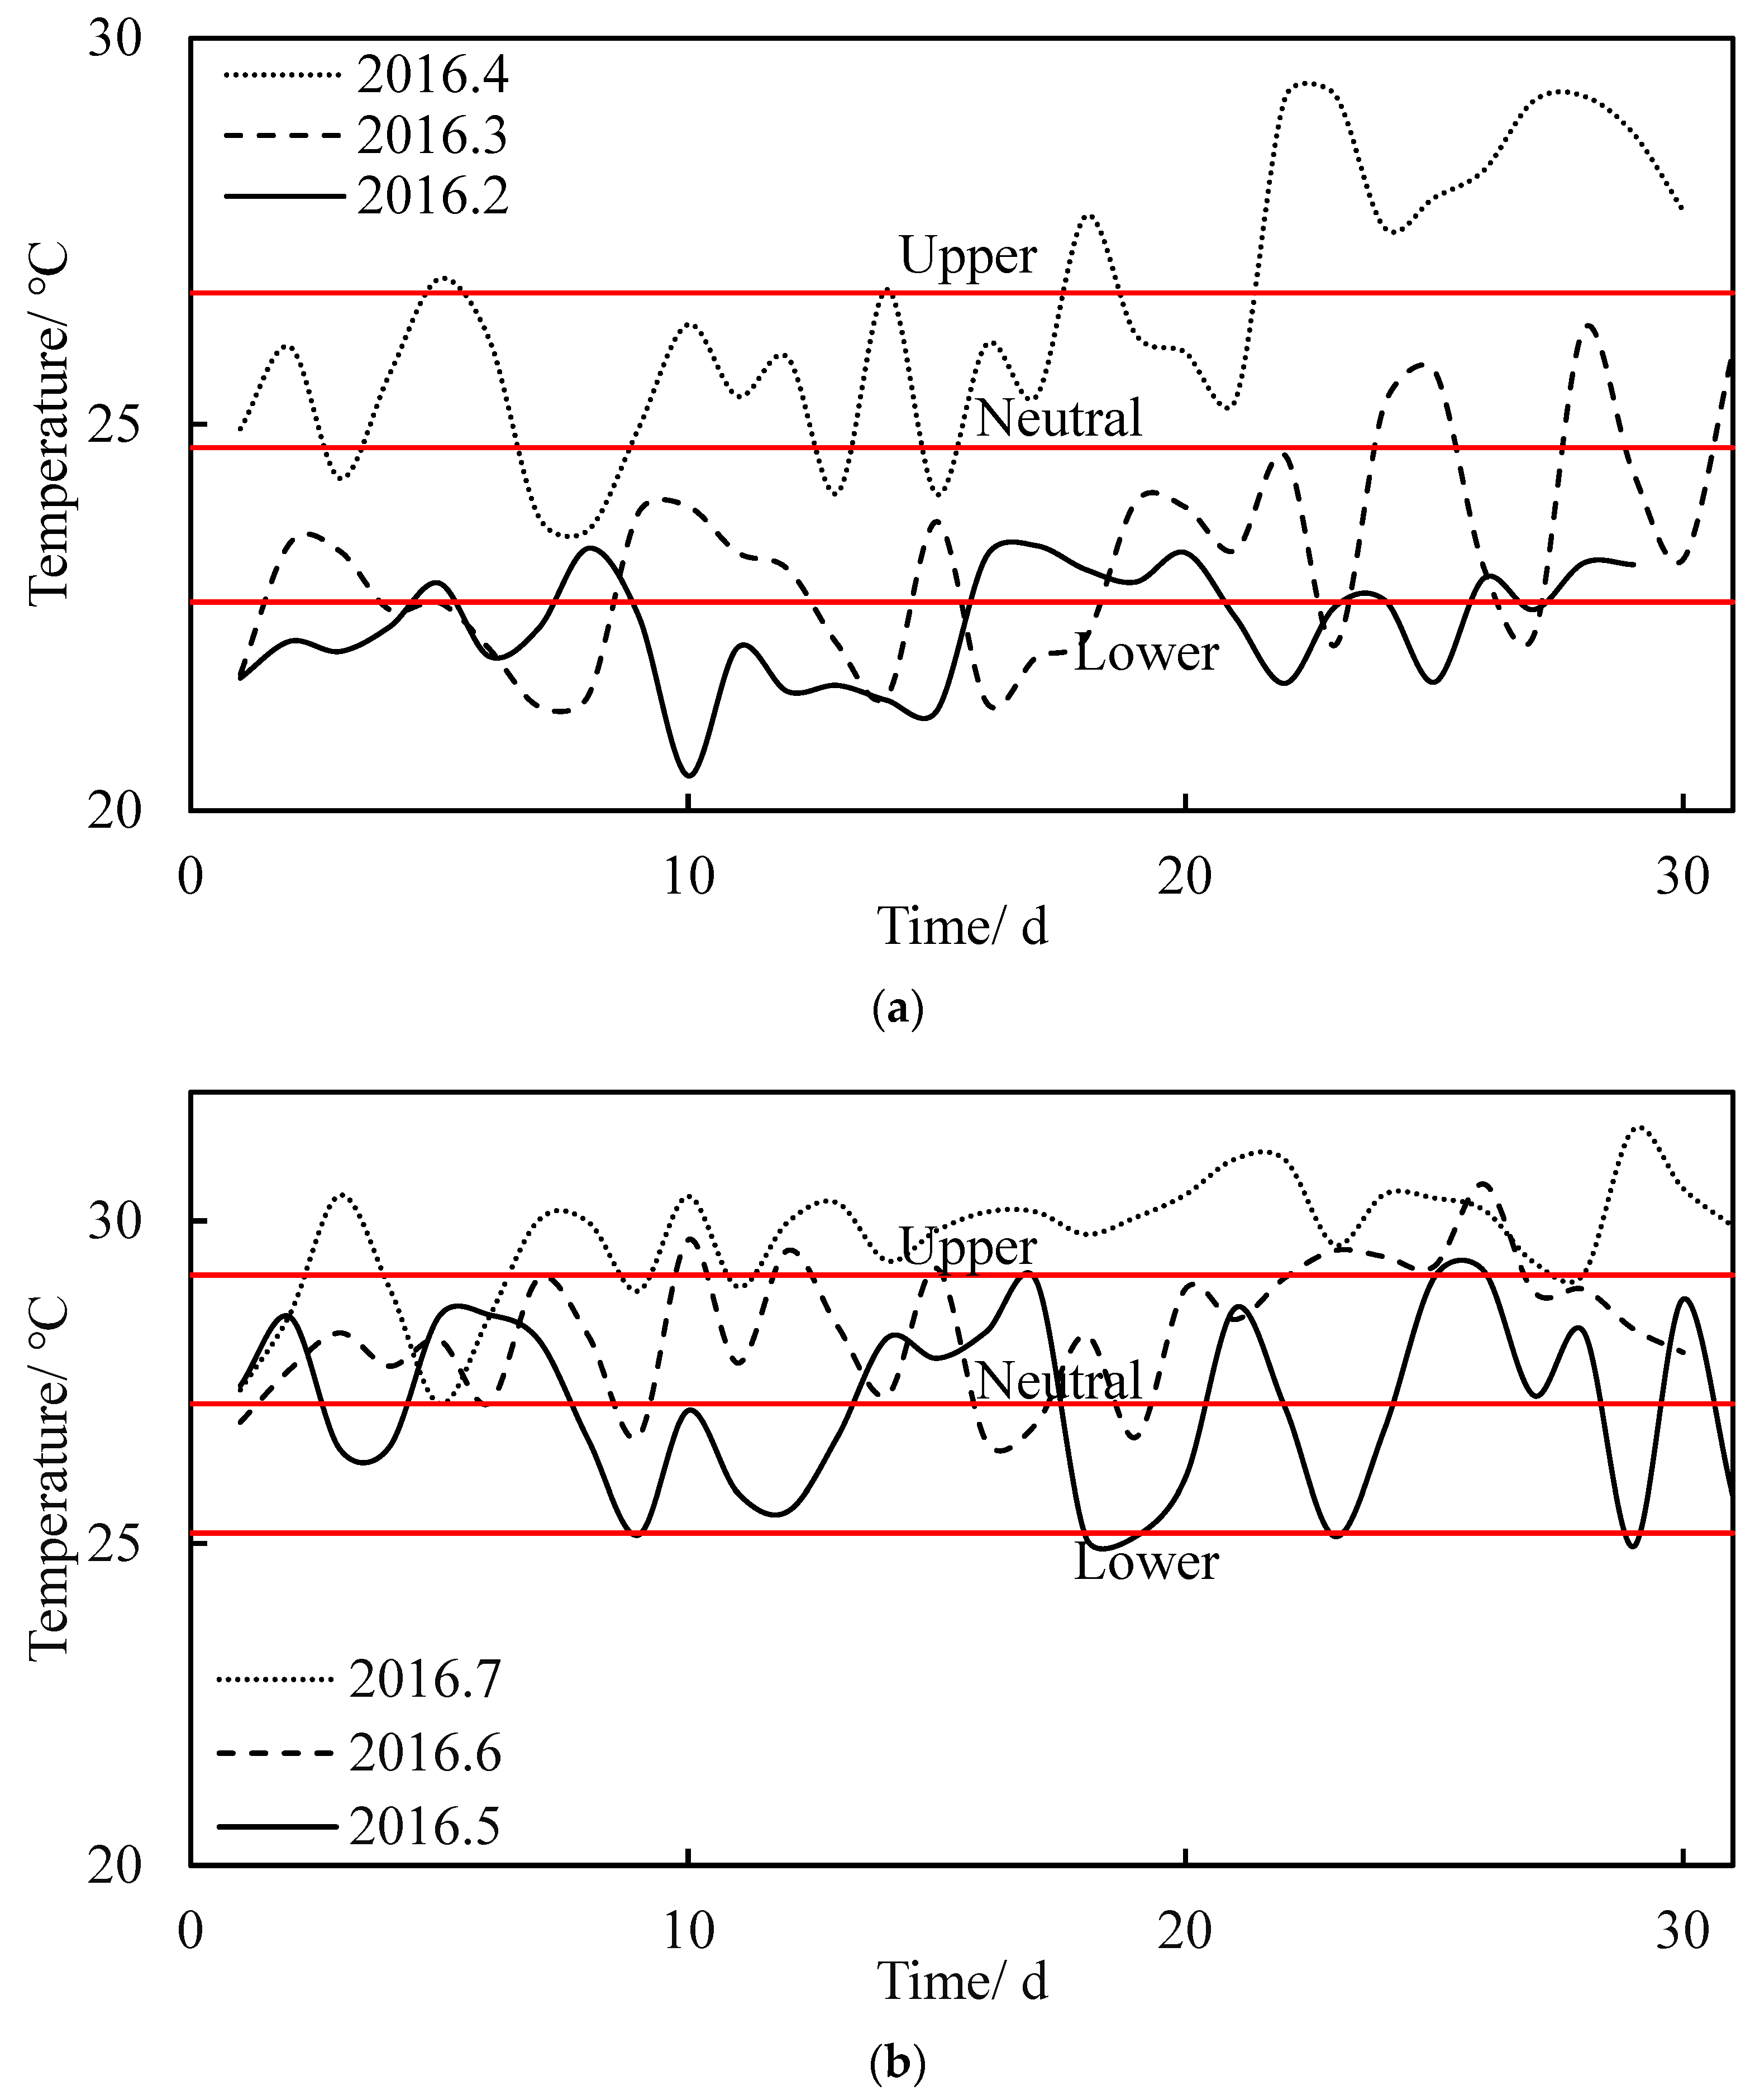
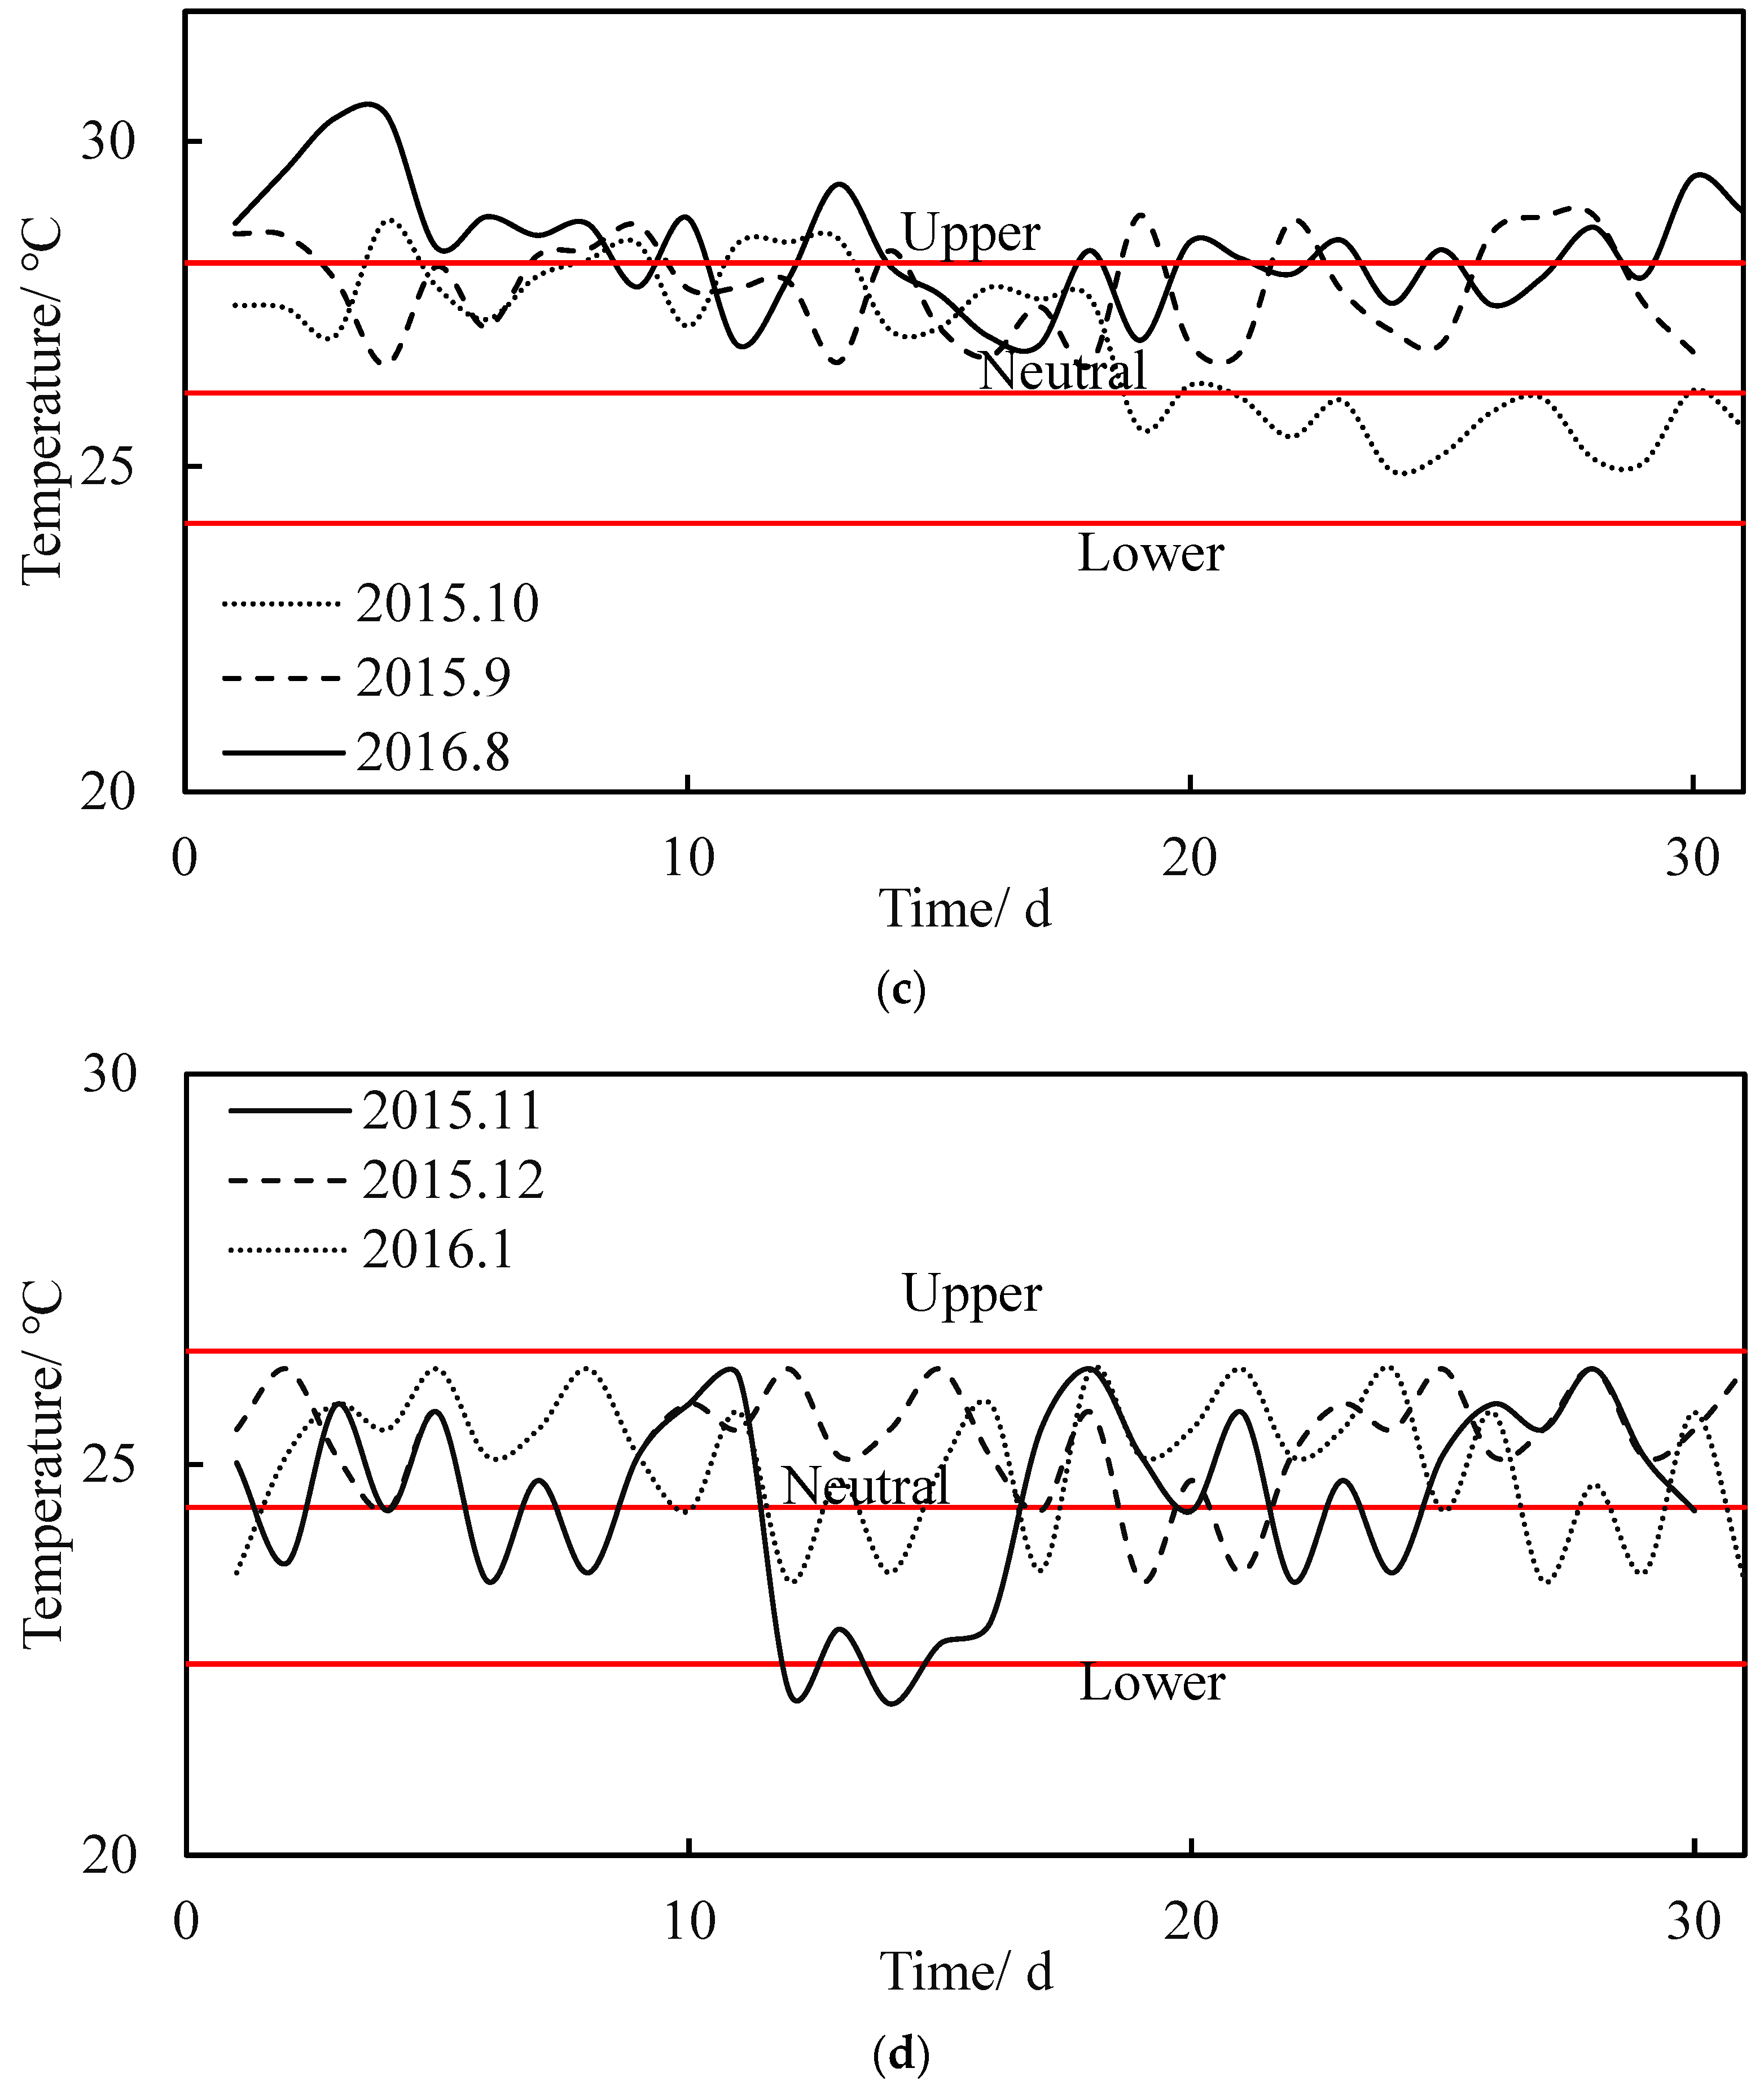
3.2. Thermal Comfort

The intelligent fresh air system of the first teaching building consists of four split ethylene glycol heat recovery fresh air processors with a power of 11/7.5 kW. The heat recovery rate of the fresh air treatment unit is 62%, with air volumes of 20,000 m3/h, 16,000 m3/h, 1900 m3/h, and 14,000 m3/h, respectively. In winter, the fresh air treatment system treats the outdoor air to the indoor state point and sends it into the room. In summer, the fresh air is directly sent into the room. In the transition season, the intelligent monitoring system compares the indoor and outdoor enthalpy values to determine whether to turn on the split glycol heat recovery system. Figure 9 shows the structure diagram, physical diagram, and CO2 intelligent monitoring system of the intelligent fresh air system (split-type heat-recovery fresh air unit functional section, fresh air handler with a hot water coil, primary filtration section, electronic dust sterilization section, and high-pressure micro-mist humidifier).

Intelligent Fresh Air System

The fresh air system is also equipped with a control panel with speed regulation and automatic cycle timing functions to ensure that the fresh air volume obtained by indoor personnel is not lower than the 30 m/h·p minimum fresh air standard in the “Assessment standard for green building” [38] and related energy-saving and health standards. The new air outlet has the function of sound insulation and dust removal. The air quality sensor can monitor the concentration of carbon monoxide, carbon dioxide, alcohol, formaldehyde, and other harmful and irritant gases in the indoor environment and compare it with the set value in the sensor; the built-in software in the sensor makes a judgment and outputs a 0 to 10 V speed adjustment or start and stop control signal to the intelligent control module of the fan, with many detection parameters. With high accuracy, when the concentration of indoor pollutants reaches the set action level, the ventilation equipment starts, and the concentration of pollutants is gradually reduced; when the standby level is reached, the ventilation is stopped, thus ensuring that the indoor air is always at a set level and effectively saves energy.
The transmission mode of the fresh air system adopts the displacement type rather than the internal circulation principle of air conditioning gas and the unhealthy practice of mixing old and new gases. The outdoor fresh air will be automatically pulled into the room through the negative pressure mode, and when entering the room through the fresh air outlet, it will automatically dust and filter. At the same time, the corresponding indoor pipeline is connected to the exhaust vents in several functional rooms, and the formed circulation system will take away the indoor exhaust gas and discharge it into the exhaust vents. In addition, considering the energy saving and reuse, the heat in the exhaust air is transferred to the glycol solution (25% concentration) through the heat exchanger on the exhaust side to improve the temperature of the glycol solution. Then, the heated glycol solution is transported to the heat exchanger on the fresh air side through the circulating pump to increase the fresh air temperature and reduce the load of the system and the operating cost of the entire air conditioning system.
In order to ensure comfort in the classrooms, CO2 monitoring probes are set up in each classroom. The intelligent fresh air system controls the amount of fresh air according to the indoor CO2 concentration. The room uses natural ventilation supplemented by mechanical ventilation during the transitional season to exhaust the residual heat and humidity in the room, reduce the opening of the chiller, and reduce the energy consumption of air conditioning. Su et al. set the range of the human thermal comfort zone at 4 °C and the upper and lower thermal comfort limit temperature at 2 °C above and below the neutral temperature [42]. Figure 10 shows the thermal comfort zone suitable for China [22].
Substitute the data monitored by the temperature and humidity measuring instrument in the classroom into Equation (9) to obtain the indoor neutral temperature change curve for each month of the four seasons. Substitute the outdoor average temperature of the corresponding month into Equation (9) to obtain the average thermal comfort zone range for each season. Figure 11 shows the thermal comfort region and temperature variation curve for each season. Figure 11a shows the temperature change curve in spring (February, March, and April). Under the regulation of the intelligent air exchange system, the proportion of indoor thermal comfort within the comfort range is 56.7%. Due to the fact that February is the winter vacation period and there are no teaching arrangements, the air conditioning in the classroom only maintains basic air exchange without turning on the heating. Therefore, the compliance rate in February was 44.8%, which lowered the average value in spring. Figure 11b shows the temperature change curve in summer (May, June, and July). Under the adjustment of the intelligent air exchange system, the proportion of indoor thermal comfort within the comfort range is 61%. July is the summer vacation, and the air conditioning in the classroom is not turned on for cooling, only maintaining the air exchange function. The compliance rate in July is only 22.6%, which is lower than the average compliance rate for that season. Figure 11c shows the temperature change curve in autumn (August, September, and October). Under the regulation of the intelligent air exchange system, the proportion of indoor thermal comfort within the comfort range is 62%. August is also summer vacation; in order to save energy, the entire system only maintains standby mode, with a compliance rate of 41.9%. Figure 11d shows the temperature change curve in winter (November, December, and January of the following year). Under the adjustment of the intelligent air exchange system, the proportion of indoor thermal comfort within the comfort range is 97.8%. The indoor temperature and humidity are properly controlled, and the thermal comfort compliance rate is extremely high. In summary, the comprehensive compliance rate for the whole year is about 70%, and the compliance rate excluding holidays is 81%.
Then, through the regulation and control of an intelligent fresh air conditioning system, indoor air quality and user comfort can be improved, while real-time monitoring of the CO2 concentration can enable timely regulation. This aspect can be combined with the research of Xia’s [43] to provide a suitable research method for campus indoor comfort in the future. Most of the existing literature has studied the testing of intelligent monitoring systems or related fresh air equipment, with little analysis of the measured data after use and a lack of accurate quantitative analysis [22]. This study emphasizes the accurate quantitative analysis of survey data, which is one of the innovative aspects of this study.

3.3. Theoretical Equation of Sound Pressure

3.3.1. Outdoor Sound Environment

To control the noise generated by vehicles during high-speed driving, slow-moving roads were set up on the east, west, and north sides of the first teaching building and living area cluster, mainly organizing bicycle and pedestrian traffic. Speed bumps were set up to limit the speed of campus buses passing through the living area cluster. The south side was set up as a pedestrian road, providing a quiet, safe, and comfortable walking area for students and faculty. In order to ensure teaching quality and learning efficiency, ultra-low noise equipment or noise-reduction measures, such as silencers, are used in the first teaching building. The doors and walls of the main functional space were treated with sound insulation. The classroom roof was suspended with sound-absorbing mineral wool board, and the floor was equipped with a five-layer damping cushion to reduce noise interference between the upper and lower classrooms. The wall decoration material of the atrium was made of material with a sound absorption coefficient of 0.6. Green plants were planted around the building to assist in noise reduction.

3.3.2. The First Teaching Building

The first teaching building is located in the middle of the front area of the school, the west side is near the fifth canteen, the north side is across the south road of the book garden and the library, the south side is near the central river, and the east side is in the central living area cluster. Using CadnaA to analyze the noise impact of the first public teaching building, Figure 12 shows the simulated values of each measurement point location during the day and night; it can be seen that the maximum noise around the teaching building is 51.0 dB during the day and 41.5 dB at night [44].

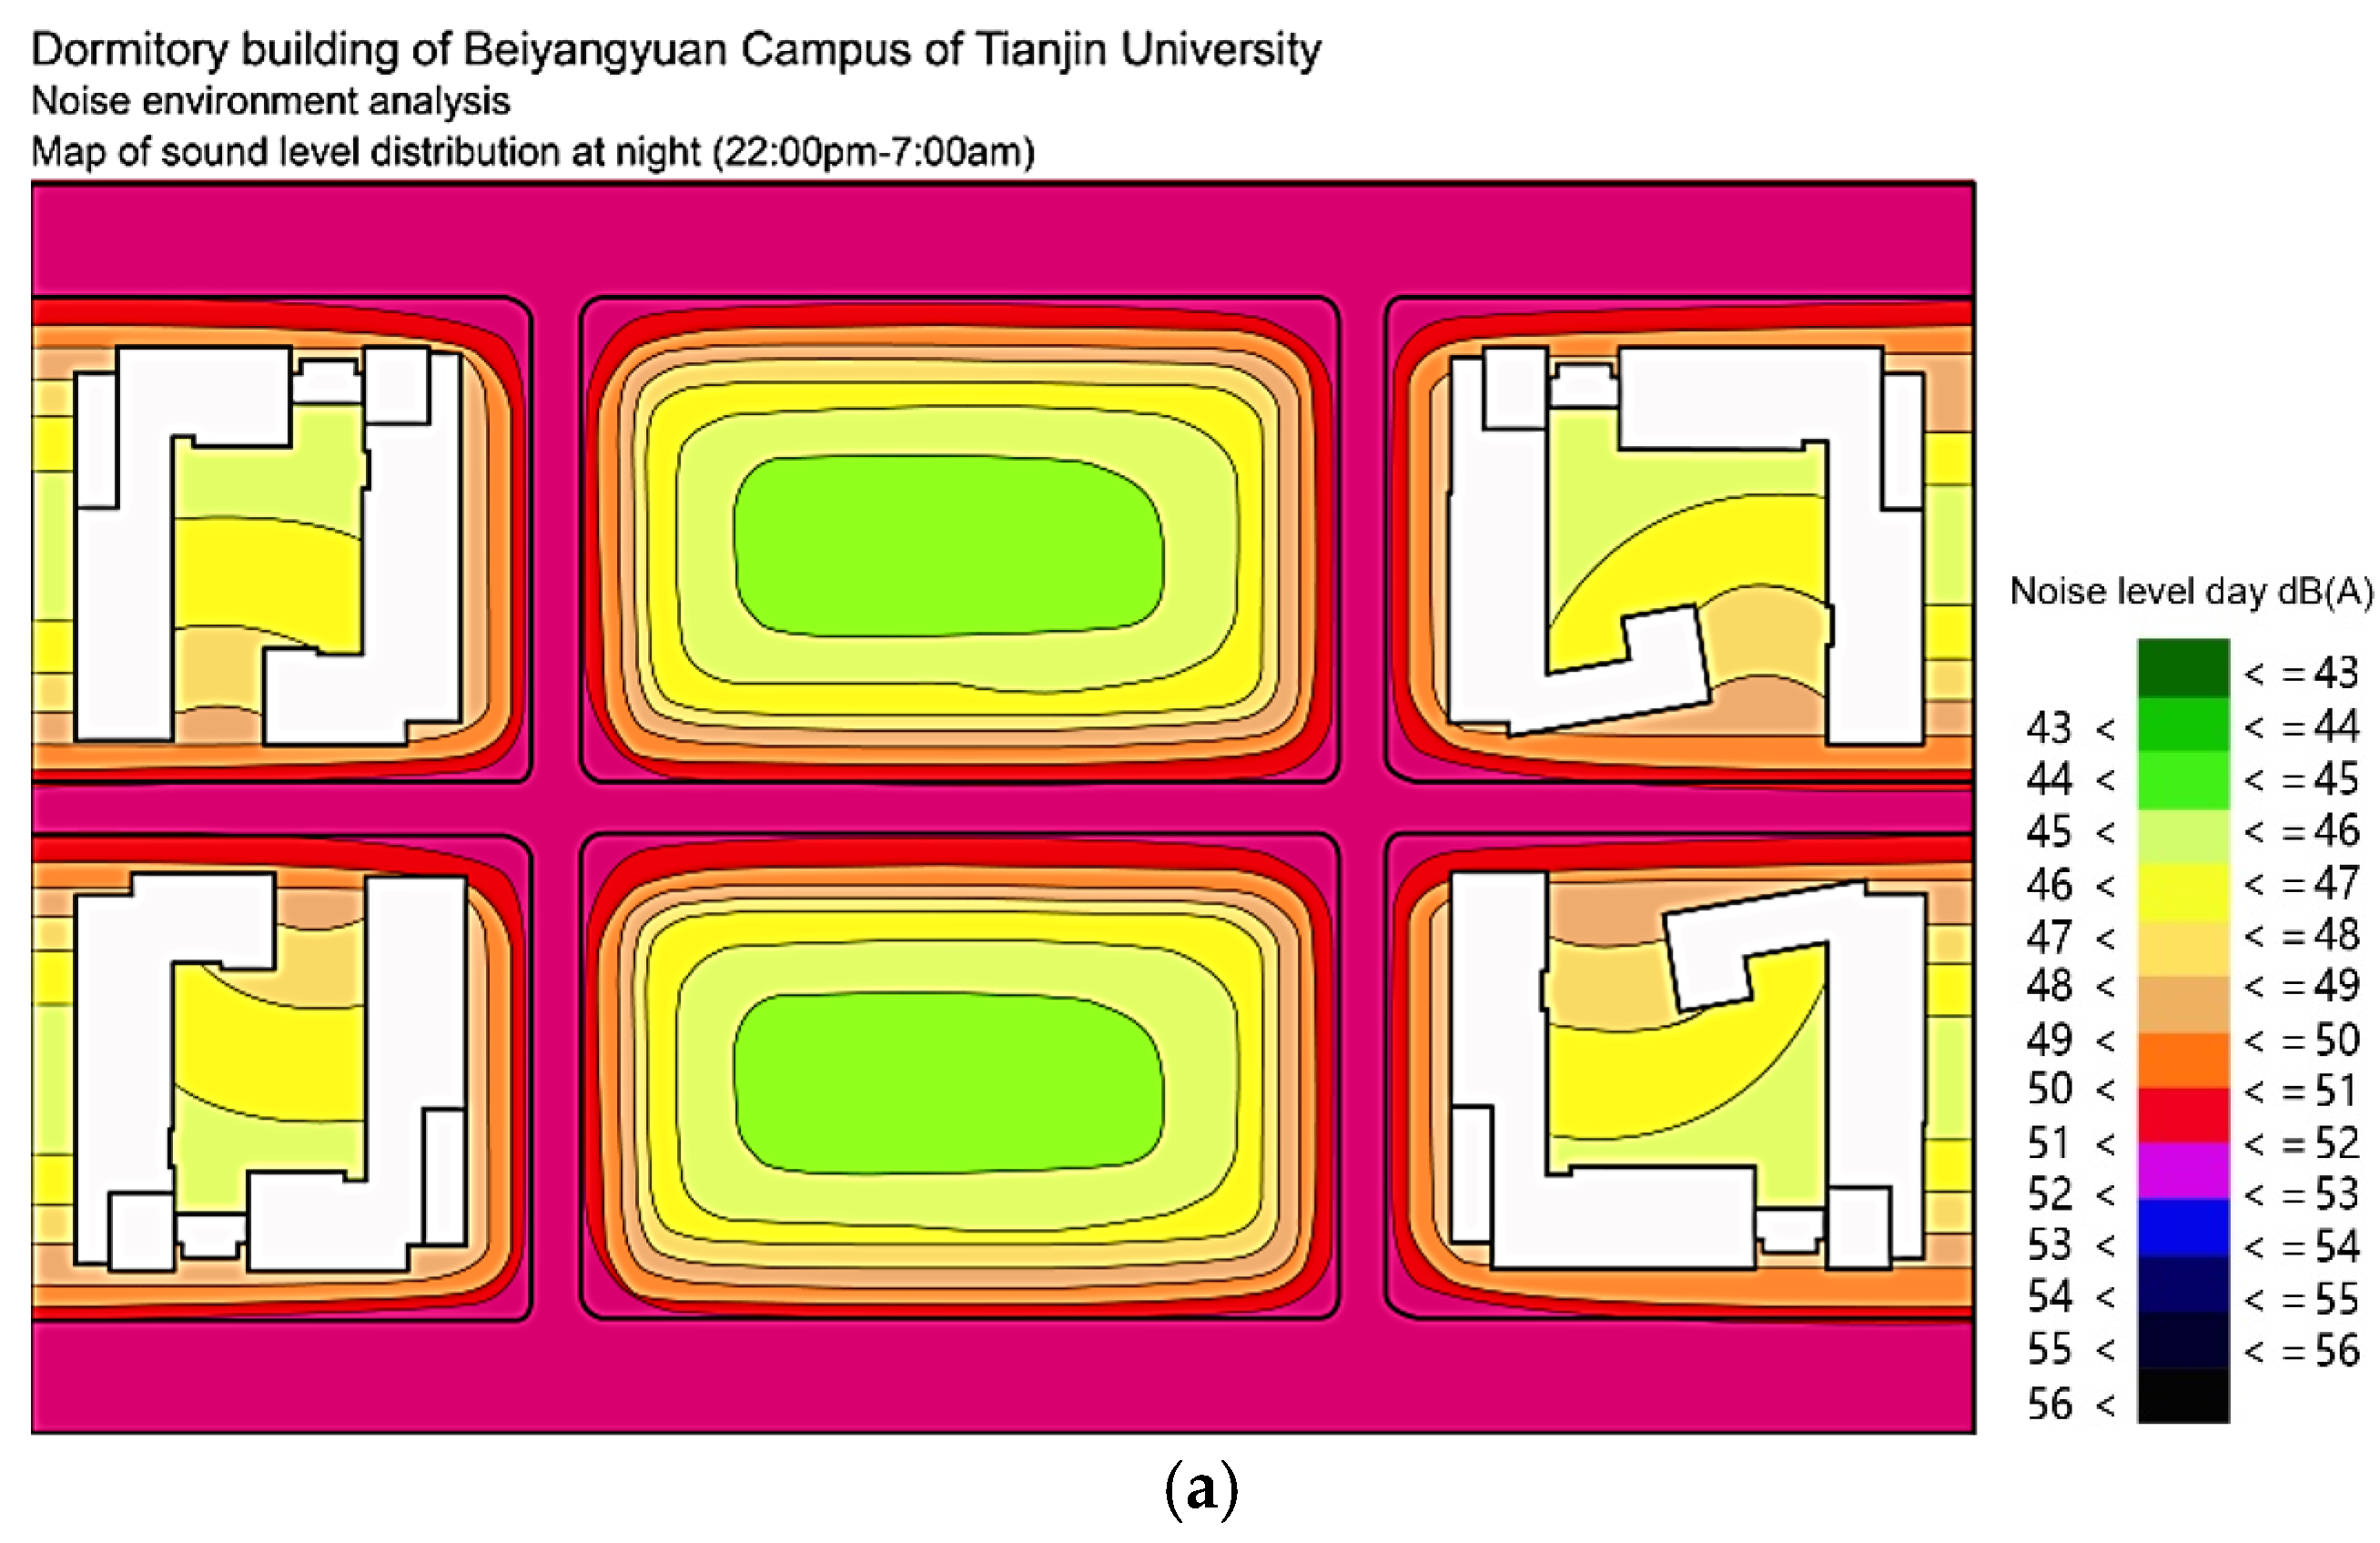
3.3.3. Living Area Cluster

The noise source of the living area cluster is mainly the traffic road around the residential area and the traffic road around the grade of urban secondary roads, and the secondary noise source is the noise generated by the crowd activity of the road in the residential area. According to the requirements of GB3096, the dormitory area belongs to the functional area of a class I sound environment; the standard value of daytime noise is 55 dB, and the standard value of nighttime noise is 45 dB. The noise impact can be reduced by limiting the speed of the roads near the living area cluster, adding sound insulation materials to the walls, and increasing the number of green plants around the building.
To determine the existence of more relatively independent noise sources, SoundPLAN software was used for noise simulation to analyze the sound level distribution of the building facades and the environmental sound level distribution of the plot. Figure 13 shows the sound level distribution of the exterior facade at different levels, with the same distribution trend during the day and night. The sound pressure level of the exterior facade of buildings near the road is significantly higher than that of other facades, and the distribution of the sound pressure level gradually decreases from the adjacent road to the interior of the plot. In terms of the facade sound level, the exterior of the first floor of the building has the highest sound level, and the surface noise of the building near the road during the day can reach 53 dB. Although meeting the requirements of GB3096, corresponding noise prevention measures are still needed. As the height of the building increases, the sound level gradually decreases, and the maximum noise on the road facade on the fourth floor is also less than 50 dB. Figure 14 shows the sound level distribution of the plot during the day and night. The environmental sound pressure level of the building near the surrounding roads is relatively high, but all meet the requirements of the specifications. The noise level in the central area of the living area cluster building enclosure is the lowest: 46 dB during the day and 35 dB at night. In summary, the facade sound level and plot environmental sound level of the entire living area cluster meet the requirements of the standard and still consider noise prevention during the day.
During the pre-planning and post-simulation verification, as shown in Table 4, the measured decibel level of the first floor of the first teaching building decreases from 68 dB to 53.4 dB in the daytime and from 56 dB to 42.7 dB at night. The decibel level on the facade of the first floor of the building in the residential cluster was reduced from 63 dB to 49 dB during the day and from 45 dB to 34.7 dB at night. The average noise-reduction rate is 22.63%, which exceeds the noise-reduction rate found in the above research literature. The error between the simulated value and the measured value is less than 6.5%, which verifies the rationality of the modified effect.
Via actual measurement and simulation, the use of materials and green layout meet the standards; this section can be combined with the research methods and conclusions of Huang’s [45] to provide a reference for noise reduction in future school buildings. According to the literature data, the decibel reduction after the renovation is between 10 and 14 dB, and the percentage of noise reduction is approximately 17% [46] and approximately 18.5% [47].

4. Conclusions

In this study, the indoor and outdoor wind environment, indoor thermal comfort, and outdoor acoustic environment are studied in the first teaching building and the living area cluster of the Campus of Tianjin University, and an atrium connected by a patio is set up in the east and west areas of the first teaching building to enhance the ventilation effect [46]. The comfort of the campus wind environment of the optimized design of the teaching building and the living area cluster was analyzed using PHOENICS. The intelligent fresh air system was used to regulate the CO2 concentration and humidity in the first teaching building, and the regulating effect of the system on the thermal comfort of the classroom was quantitatively analyzed. The noise impact was reduced by limiting the speed of vehicles near the first academic building and the living area cluster, using acoustic insulation materials and sound-deafening equipment, increasing the surrounding greenery, and using CadnaA and SoundPLAN to analyze the effect of the alterations. The following results were found:
(1)
The number of air changes on each floor of the renovated first teaching building significantly increased. The average number of air changes in the overall functional space is 6.49 times/h. The wind velocity in the human activity area at the height of 1 m from the floor is below 1 m/s. Setting up a patio can increase the wind velocity in the corridor from 0.4 m/s to 0.8 m/s in areas with high wind speeds. By regulating the intelligent fresh air system, the proportion of the annual temperature change curve within the comfortable range during the first teaching period is 70%. After removing the school vacation months, the range of indoor temperature change curve within the comfortable range can reach 81%;
(2)
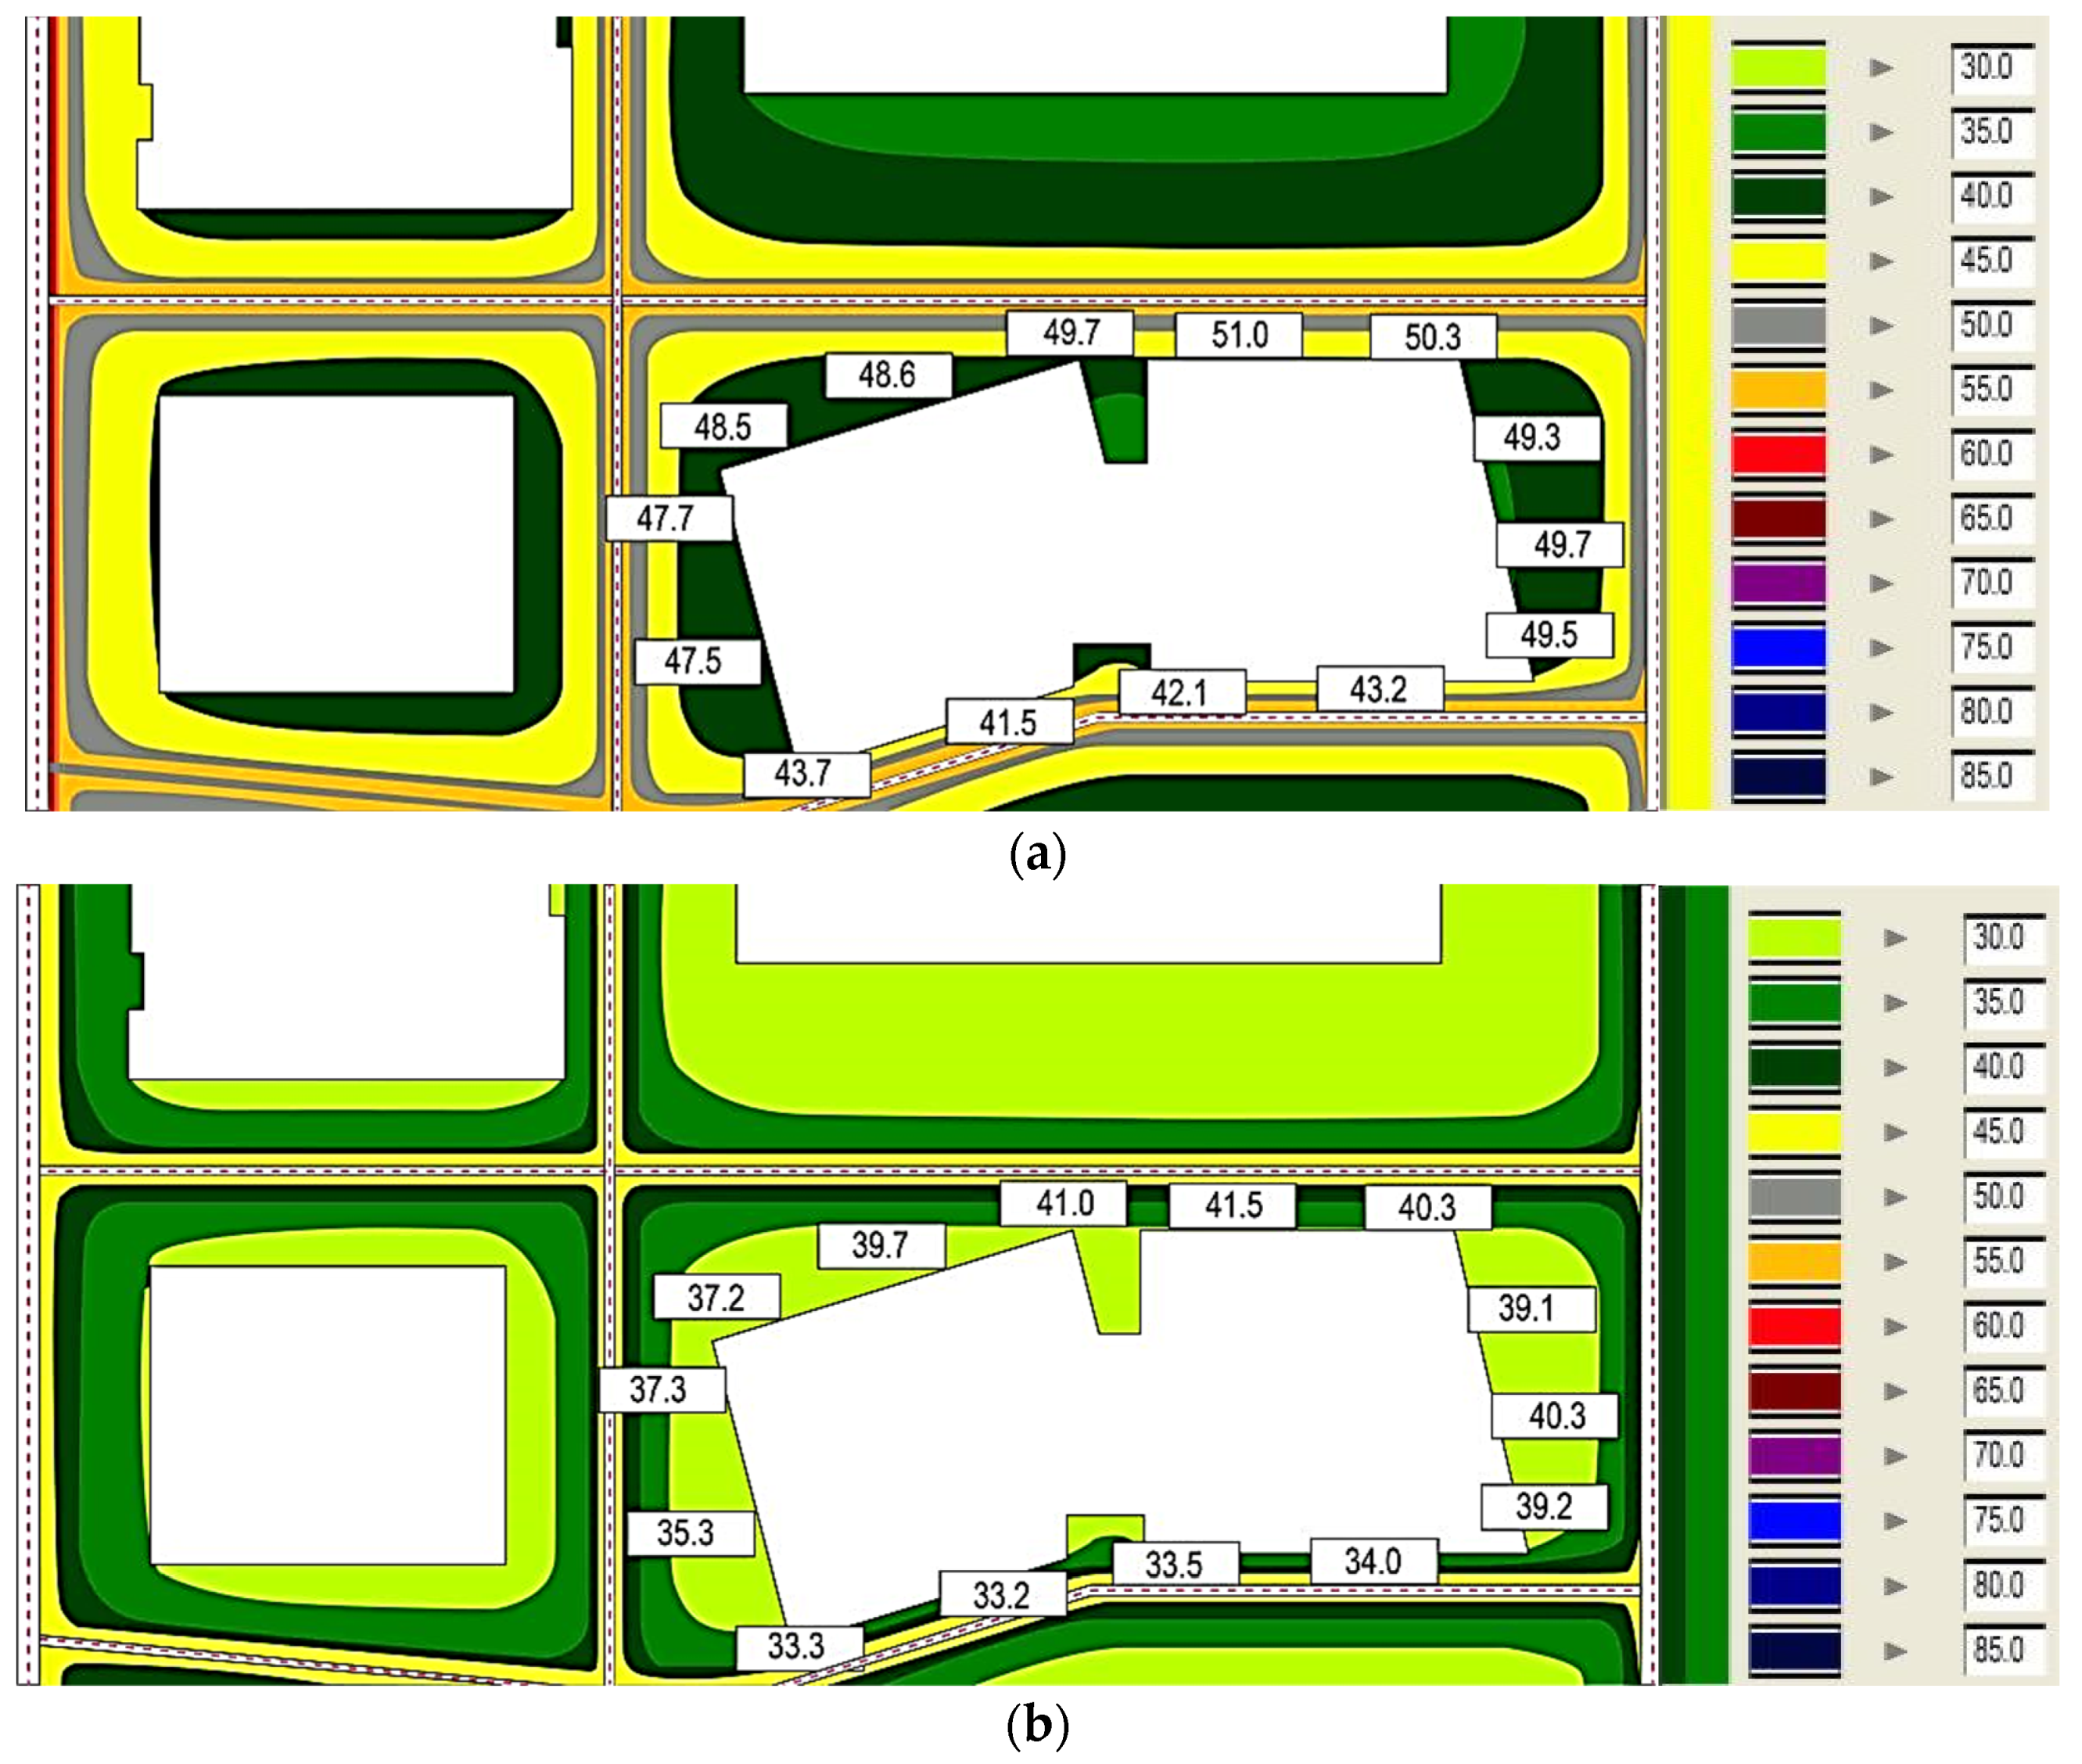
The maximum simulated noise level around the first teaching building is 51 dB during the daytime, and the maximum measured noise level is 53.4 dB, while the maximum simulated noise level at night is 41.5 dB, and the maximum measured noise level is 42.7 dB. The maximum simulated façade sound level of the living area cluster is 53 dB, and the maximum measured façade sound level is 53.2 dB. The simulated ambient noise level of the living area cluster is 46 dB during the daytime and 35 dB at night, and the measured noise level is 49 dB during the daytime and 34.7 dB at night, which is lower than the requirements of the relevant standards;
(3)
By setting the atrium as connected by the patio in the east and west areas of the first teaching building of Tianjin University Beiyangyuan campus, it is proved that the setting of the atrium is more conducive to the establishment of local wind environment comfort and rationality and provides an improved method for the design of related buildings. Setting intelligent fresh air systems for indoor thermal environments according to local conditions provides a reasonable temperature comfort treatment method for campus buildings in cold climate zones and makes up for the poor indoor environment caused by insufficient design. Utilizing simulation in the early design stage, the road design near the first teaching building and the living area is planned in advance, the traffic flow and speed are restricted, the sound insulation materials and noise reduction equipment are used indoors, and the surrounding green plants are increased;
(4)
The results of this study can be used to improve the design of existing or new campus buildings in cold areas to prevent problems due to over-design or under-design and provide a framework for design and improvement combined with simulation and measurement comparison. Through the measured analysis, simulation analysis, and comparative verification of the two main functional areas, a reasonable analysis method is provided for the planning and design of campus buildings in the Beijing–Tianjin–Hebei province.

5. Limitations and Further Study

In the future, more efforts should be made to increase the ventilation frequency of functional spaces under the premise of building layout and passive ventilation and effectively control the pedestrian level wind speed within a comfortable range; perform advance planning at the campus scale, utilizing the building layout and floor height settings to reduce the impact of monsoons on the overall wind environment of the campus, especially in the main functional areas; further improve the energy efficiency of the fresh air system and combine it with passive ventilation to improve the indoor temperature comfort of the teaching building during teaching hours, in addition to the temperature and wind speed, such as indoor acoustic environment, atmosphere and other factors should also be taken into account [48]; and establish pedestrian and vehicle separation at the level of campus planning to reduce the flow of vehicles near teaching buildings and dormitory areas, thereby further reducing the impact of noise on learning and life. The limitation of this study is that the research sample is singular, with strong regional characteristics, and its universality needs further verification.

Author Contributions

X.D.: Methodology, Data curation, Investigation, Writing original draft; G.G.: Methodology, Supervision, Writing review and editing; F.G.: Supervision, Writing review and editing, Funding acquisition; Z.Z.: Writing review and editing. All authors have read and agreed to the published version of the manuscript.

Funding

This study was supported by the National Natural Science Foundation of China: The Evaluation and Design Method of the Green Renovation of the Existing University Campus Based on the Multi-objective Optimization: Take the Beijing, Tianjin, Hebei Region as an Example. (NO. 52078325).

Institutional Review Board Statement

Not applicable.

Informed Consent Statement

Not applicable.

Data Availability Statement

The data that support the findings of this study are available from the authors upon reasonable request.

Conflicts of Interest

The authors declare no conflict of interest.

References

  1. Li, X.; Wang, J.; Eftekhari, M.; Qi, Q.; Jiang, D.; Song, Y.; Tian, P. Improvement Strategies Study for Outdoor Wind Environment in a University in Beijing Based on CFD Simulation. Adv. Civ. Eng. 2020, 2020, 8850254. [Google Scholar] [CrossRef]
  2. Blocken, B.; Janssen, W.D.; van Hooff, T. CFD simulation for pedestrian wind comfort and wind safety in urban areas: General decision framework and case study for the Eindhoven University campus. Environ. Model. Softw. 2012, 30, 15–34. [Google Scholar] [CrossRef]
  3. Norouziasas, A.; Ha, P.P.; Ahmadi, M.; Rijal, H.B. Evaluation of urban form influence on pedestrians’ wind comfort. Build. Environ. 2022, 224, 109522. [Google Scholar] [CrossRef]
  4. Hutchinson, L. ABC of learning and teaching: Educational environment. BMJ 2003, 326, 810–812. [Google Scholar] [CrossRef] [PubMed]
  5. Li, P.; Froese, T.M.; Brager, G. Post-occupancy evaluation: State-of-the-art analysis and state-of-the-practice review. Build. Environ. 2018, 133, 187–202. [Google Scholar] [CrossRef]
  6. Karapetsis, A.; Alexandri, E. Indoor environmental quality and its impacts on health–case study: School buildings. In Proceedings of the 5th International Conference “ENERGY in BUILDINGS”, Athens, Greece, 12 November 2016. [Google Scholar]
  7. Sharmin, T.; Gül, M.; Li, X.; Ganev, V.; Nikolaidis, I.; Al-Hussein, M. Monitoring building energy consumption, thermal performance, and indoor air quality in a cold climate region. Sustain. Cities Soc. 2014, 13, 57–68. [Google Scholar] [CrossRef]
  8. Tham, S.; Thompson, R.; Landeg, O.; Murray, K.A.; Waite, T. Indoor temperature and health: A global systematic review. Public Health 2020, 179, 9–17. [Google Scholar] [CrossRef]
  9. Miao, Y.; Ding, Y. Indoor environmental quality in existing public buildings in China: Measurement results and retrofitting priorities. Build. Environ. 2020, 185, 107216. [Google Scholar] [CrossRef]
  10. Sharif, S.A.; Hammad, A. Simulation-Based Multi-Objective Optimization of institutional building renovation considering energy consumption, Life-Cycle Cost and Life-Cycle Assessment. J. Build. Eng. 2019, 21, 429–445. [Google Scholar] [CrossRef]
  11. Ma, J.; Yang, Q. Optimizing Annual Daylighting Performance for Atrium-Based Classrooms of Primary and Secondary Schools in Nanjing, China. Buildings 2022, 13, 11. [Google Scholar] [CrossRef]
  12. Ghasemi, M.; Noroozi, M.; Kazemzadeh, M.; Roshan, M. The Influence of Well Geometry on the Daylight Performance of Atrium Adjoining Spaces: A Parametric Study. J. Build. Eng. 2015, 3, 39–47. [Google Scholar] [CrossRef]
  13. Romero-Odero, J.A.; Galán-Marín, C.; Rivera-Gómez, C. Atrium impact on a school-building: Thermal performance in a hot climate. Proceedings 2020, 38, 18. [Google Scholar] [CrossRef]
  14. Yang, J.; Dong, Z.; Yang, H.; Liu, Y.; Wang, Y.; Chen, F.; Chen, H. Numerical and Experimental Study on Thermal Comfort of Human Body by Split-Fiber Air Conditioner. Energies 2022, 15, 3755. [Google Scholar] [CrossRef]
  15. Allen, J.G.; MacNaughton, P.; Satish, U.; Santanam, S.; Vallarino, J.; Spengler, J.D. Associations of Cognitive Function Scores with Carbon Dioxide, Ventilation, and Volatile Organic Compound Exposures in Office Workers: A Controlled Exposure Study of Green and Conventional Office Environments. Environ. Health Perspect. 2016, 124, 805–812. [Google Scholar] [CrossRef] [PubMed]
  16. Sadrizadeh, S.; Yao, R.; Yuan, F.; Awbi, H.; Bahnfleth, W.; Bi, Y.; Cao, G.; Croitoru, C.; de Dear, R.; Haghighat, F.; et al. Indoor air quality and health in schools: A critical review for developing the roadmap for the future school environment. J. Build. Eng. 2022, 57, 104908. [Google Scholar] [CrossRef]
  17. Liu, Z.; Li, W.; Chen, Y.; Luo, Y.; Zhang, L. Review of energy conservation technologies for fresh air supply in zero energy buildings. Appl. Therm. Eng. 2019, 148, 544–556. [Google Scholar] [CrossRef]
  18. Jia, L.R.; Han, J.; Chen, X.; Li, Q.-Y.; Lee, C.-C.; Fung, Y.-H. Interaction between Thermal Comfort, Indoor Air Quality and Ventilation Energy Consumption of Educational Buildings: A Comprehensive Review. Buildings 2021, 11, 591. [Google Scholar] [CrossRef]
  19. Chen, A. Research on exhaust air heat recovery mode of air conditioning system in different types of buildings. In Proceedings of the 2017 6th International Conference on Energy and Environmental Protection (ICEEP 2017), Zhuhai, China, 29–30 June 2017; Atlantis Press: Amsterdam, The Netherlands, 2017. [Google Scholar] [CrossRef]
  20. Broderick, Á.; Byrne, M.; Armstrong, S.; Sheahan, J.; Coggins, A.M. A pre and post evaluation of indoor air quality, ventilation, and thermal comfort in retrofitted co-operative social housing. Build. Environ. 2017, 122, 126–133. [Google Scholar] [CrossRef]
  21. Rohdin, P.; Molin, A.; Moshfegh, B. Experiences from nine passive houses in Sweden–Indoor thermal environment and energy use. Build. Environ. 2014, 71, 176–185. [Google Scholar] [CrossRef]
  22. Guo, C.M. Research on Thermal Comfort of Natural Ventilation Office Building in Tianjin; Tianjin University: Tianjin, China, 2011. [Google Scholar]
  23. Fyhri, A.; Aasvang, G.M. Noise, sleep and poor health: Modeling the relationship between road traffic noise and cardiovascular problems. Sci. Total Environ. 2010, 408, 4935–4942. [Google Scholar] [CrossRef]
  24. Wu, Z.; Qin, M.; Zhang, M. Phase change humidity control material and its impact on building energy consumption. Energy Build. 2018, 174, 254–261. [Google Scholar] [CrossRef]
  25. Frontczak, M.; Wargocki, P. Literature survey on how different factors influence human comfort in indoor environments. Build. Environ. 2011, 46, 922–937. [Google Scholar] [CrossRef]
  26. Chang, T.Y.; Liu, C.S.; Bao, B.Y.; Li, S.-F.; Chen, T.-I.; Lin, Y.-J. Characterization of road traffic noise exposure and prevalence of hypertension in central Taiwan. Sci. Total Environ. 2011, 409, 1053–1057. [Google Scholar] [CrossRef]
  27. Balderrama, A.; Kang, J.; Prieto, A.; Luna-Navarro, A.; Arztmann, D.; Knaack, U. Effects of Façades on urban acoustic environment and soundscape: A systematic review. Sustainability 2022, 14, 9670. [Google Scholar] [CrossRef]
  28. Woolner, P.; Hall, E. Noise in schools: A holistic approach to the issue. Int. J. Environ. Res. Public Health 2010, 7, 3255–3269. [Google Scholar] [CrossRef]
  29. Pellegatti, M.; Torresin, S.; Visentin, C.; Babich, F.; Prodi, N. Indoor soundscape, speech perception, and cognition in classrooms: A systematic review on the effects of ventilation-related sounds on students. Build. Environ. 2023, 236, 110194. [Google Scholar] [CrossRef]
  30. Belojević, G.A.; Jakovljević, B.D.; Stojanov, V.J.; Slepčevic, V.Ž.; Paunović, K.Ž. Nighttime Road-Traffic Noise and Arterial Hypertension in an Urban Population. Hypertens. Res. 2008, 31, 775–781. [Google Scholar] [CrossRef]
  31. Barregard, L.; Bonde, E.; Ohrstrom, E. Risk of hypertension from exposure to road traffic noise in a population-based sample. Occup. Environ. Med. 2009, 66, 410–415. [Google Scholar] [CrossRef]
  32. Nieuwenhuijsen, M.J. Urban and transport planning, environmental exposures and health-new concepts, methods and tools to improve health in cities. Environ. Health 2016, 15, S38. [Google Scholar] [CrossRef]
  33. Kang, J.; Aletta, F.; Gjestland, T.T.; Brown, L.A.; Botteldooren, D.; Schulte-Fortkamp, B.; Lercher, P.; van Kamp, I.; Genuit, K.; Fiebig, A.; et al. Ten questions on the soundscapes of the built environment. Build. Environ. 2016, 108, 284–294. [Google Scholar] [CrossRef]
  34. Houda, S.; Zemmouri, N.; Athmani, R.; Belarbi, R. Effect of urban morphology on wind flow distribution in dense urban areas. J. Renew. Energ. 2011, 14, 85–94. [Google Scholar]
  35. 55-1992; Thermal Environmental Conditions for Human Occupancy. American Society of Heating, Refrigerating and Air conditioning Engineer: Peachtree Corners, GA, USA, 1992.
  36. Gao, Y. Study on Acoustic Field Characteristics and Noise Distribution Prediction in Substations; North China Electric Power University: Beijing, China, 2014. [Google Scholar]
  37. GB 50736-2012; Design Code for Heating, Ventilation and Air Conditioning of Civil Buildings. China Architecture and Building Press: Beijing, China, 2012.
  38. GB/T 50378-2014; Assessment Standard for Green Building. Ministry of Housing and Urban-Rural Development of the People’s Republic of China: Beijing, China, 2014. (In Chinese)
  39. Meteorological Data Room of the Meteorological Information Center of the China Meteorological Administration. Special Meteorological Dataset for Thermal Environment Analysis of Chinese Buildings; China Construction Industry Press: Beijing, China, 2005. (In Chinese) [Google Scholar]
  40. DB/T29-204-2010; Tianjin Green Building Evaluation Standard. Tianjin Housing and Urban-Rural Constraction Commission: Tianjin, China, 2010. (In Chinese)
  41. Heiselberg, P. Natural ventilation design. Int. J. Vent. 2004, 2, 295–312. [Google Scholar] [CrossRef]
  42. Su, X.; Zhang, X.; Gao, J. Evaluation method of natural ventilation system based on thermal comfort in China. Energy Build. 2009, 41, 67–70. [Google Scholar] [CrossRef]
  43. Xia, Y.; Lin, W.; Gao, W.; Liu, T.; Li, Q.; Li, A. Experimental and numerical studies on indoor thermal comfort in fluid flow: A case study on primary school classrooms. Case Stud. Therm. Eng. 2020, 19, 100619. [Google Scholar] [CrossRef]
  44. GB3096-2008; Environmental Quality Standard for Noise. China Environmental Science Press: Beijing, China, 2008.
  45. Huang, X.; Liu, J.; Meng, Z. Application of University Campus Noise Map Based on Noise Propagation Model: A Case in Guangxi University. Sustainability 2022, 14, 8613. [Google Scholar] [CrossRef]
  46. Balasbaneh, A.T.; Yeoh, D.; Abidin, A.R.Z. Life cycle sustainability assessment of window renovations in schools against noise pollution in tropical climates. J. Build. Eng. 2020, 32, 101784. [Google Scholar] [CrossRef]
  47. Secchi, S.; Astolfi, A.; Calosso, G.; Casini, D.; Cellai, G.; Scamoni, F.; Scrosati, C.; Shtrepi, L. Effect of outdoor noise and façade sound insulation on indoor acoustic environment of Italian schools. Appl. Acoust. 2017, 126, 120–130. [Google Scholar] [CrossRef]
  48. Wu, X.; Oldfield, P.; Heath, T. Spatial Openness and Student Activities in an Atrium: A Parametric Evaluation of a Social Informal Learning Environment. Build. Environ. 2020, 182, 107141. [Google Scholar] [CrossRef]
Figure 1. (a) The main building diagram of the first teaching building and wind speed cloud map at 1 m above the floor (b) before renovation and (c) after renovation.
Sustainability 15 14200 g001
Figure 2. Number of air changes in different areas before renovation and after renovation.
Sustainability 15 14200 g002
Figure 3. Vertical wind speed cloud map of the atrium area.
Sustainability 15 14200 g003
Figure 4. Wind speed cloud maps of campus buildings in (a) winter and (b) summer.
Sustainability 15 14200 g004
Figure 5. (a) Aerial view of the first teaching building. (b) Top view and people view of the first teaching building.
Sustainability 15 14200 g005
Figure 6. Wind speed (a) contour map and (b) vector map at 1.5 m of the first teaching building (The red circle is the research object).
Sustainability 15 14200 g006aSustainability 15 14200 g006b
Figure 7. Physical model of outdoor wind environment of the living group.
Sustainability 15 14200 g007
Figure 8. Wind speed map of the living area cluster with the dominant wind downward at the height of 1.5 m (a) in winter, (b) in summer, and (c) in the transitional season.
Sustainability 15 14200 g008
Figure 9. Split intelligent air exchange system (a) structural diagram, (b) physical diagram, and (c) CO2 intelligent monitoring system.
Sustainability 15 14200 g009
Figure 10. Typical climate thermal comfort zones in China.
Sustainability 15 14200 g010
Figure 11. The temperature and comfort temperature relationship of the optimized in (a) spring, (b) summer, (c) autumn, and (d) winter months.
Sustainability 15 14200 g011aSustainability 15 14200 g011b
Figure 12. Distribution map of the first teaching building (a) daytime noise and (b) nighttime noise distribution.
Sustainability 15 14200 g012
Figure 13. Sound pressure level distribution of living area cluster on (a) the first floor during the daytime, (b) the fourth floor during the daytime, (c) the first floor at nighttime, and (d) the fourth floor at nighttime.
Sustainability 15 14200 g013aSustainability 15 14200 g013b
Figure 14. Cloud map of sound level distribution at living area cluster during the (a) daytime and (b) at nighttime.
Sustainability 15 14200 g014aSustainability 15 14200 g014b
Table 1. Parameters of standard K-ε model.
Model ConstantValueModel ConstantValue
Cμ0.09C1.44
Cd0.1643C1.92
prK1.0C1.0
prε=K1.314C0.01
Table 2. Conditions for different working conditions in the outdoor wind environment of the first teaching building.
Work ConditionsBasic
Conditions
Wind Speed (m/s)Wind
Direction
Evaluation Content
110% gale force winds in summer3.0South-southeast Pedestrian
comfort
210% gale force winds in winter5.0East Windproof and energy-efficient
3Transitional season 10% gale4.0SouthwestPedestrian
comfort
4Average wind speed in summer1.7South-southeast Natural
ventilation
5Average wind speed in winter2.9EastWind protection and
energy saving
6Transitional season average wind speed2.2SouthwestNatural
ventilation
Table 3. Calculation results of the outdoor wind environment of the first teaching building.
Work ConditionsSimulation Wind Velocity (m/s)Measured Wind Velocity at 1.5 m (m/s)Wind Speed Amplification Factor
Wind Direction10 m 1.5 m
1South-southeast3.01.981.960.99
2East5.03.292.960.90
3Southwest4.02.642.530.96
4South-southeast1.71.121.110.99
5East2.91.911.750.92
6Southwest2.21.451.390.96
Table 4. Comparison and verification of noise simulation and measurement (dB).
DaytimeAt Night
Before reconstructionAfter reconstructionBefore reconstructionAfter reconstruction
The first teaching building
Measured Measured Simulated Measured Measured Simulated
6853.4515642.741.5
Living area cluster
Measured Measured Simulated Measured Measured Simulated
6349534537.439
Disclaimer/Publisher’s Note: The statements, opinions and data contained in all publications are solely those of the individual author(s) and contributor(s) and not of MDPI and/or the editor(s). MDPI and/or the editor(s) disclaim responsibility for any injury to people or property resulting from any ideas, methods, instructions or products referred to in the content.

