Article

Research on Urban Energy Sustainable Plan under the Background of Low-Carbon Development

1
China Academy of Building Research, Beijing 100013, China
2
China-Singapore Tianjin Eco-City Administrative Committee, Tianjin 300480, China
*
Author to whom correspondence should be addressed.
Sustainability 2023, 15(19), 14206; https://doi.org/10.3390/su151914206
Submission received: 27 July 2023 / Revised: 13 September 2023 / Accepted: 22 September 2023 / Published: 26 September 2023
(This article belongs to the Special Issue Energy Transition in the Urban Environment)

Abstract

:
Rational planning and the use of renewable energy are effective means to reduce urban carbon emissions. In view of the few urban renewable energy planning cases and unclear methods, the paper takes the Sino-Singapore Tianjin Eco-City renewable energy planning project as a case to provide a renewable energy planning method under the guidance of carbon constraints. Based on scenario analysis, the energy demand of urban buildings, industry and transportation is analyzed and predicted. On the basis of meeting the needs of terminal energy use, with the goal of reducing carbon emissions, the renewable energy planning scheme from 2021 to 2050 under the low-carbon scenario has been formulated, including the promotion of energy-efficient buildings, the utilization of renewable energy in buildings, the electrification of terminal energy use, and the application of large-scale municipal renewable energy. It is planned that, by 2050, the overall renewable energy utilization rate of the Sino-Singapore Tianjin Eco-City will reach 76.76%. It will use renewable energy to heat about 60 million square meters, generate about 766 million kWh of electricity, save about 0.723 million tons of standard coal and reduce 1.287 million tons of carbon dioxide every year, which will have a good effect of energy conservation and emission reduction. In this paper, the renewable energy planning method under the guidance of carbon constraint is established, which can achieve the purposes of saving resources, protecting the environment and driving sustainable development. The Sino-Singapore Tianjin Eco-City is an international co-creation city, which will receive extensive attention and provide theoretical guidance and demonstration cases for urban renewable energy planning in the context of carbon peak and carbon neutrality in the new era.

1. Introduction

Energy is the lifeblood of every country’s national economic and social development, as well as the cornerstone of human social development and stability. Under the background of the depletion of fossil fuels and the aggravation of environmental pollution in the world, the third energy transition, guided by carbon constraint and aiming at the sustainable development of human society, is accelerating around the world [1]. The ultimate goal of this transition is to form an energy system dominated by renewable energy [2,3,4]. Renewable energy has the characteristics of zero emission and easy access, which is conducive to carbon emission reduction and energy security.
China strictly implements the “dual control” system of energy and carbon emissions. In September 2020, China proposed to increase its nationally determined contributions to achieve carbon peak by 2030 and carbon neutrality by 2060. Now, China is focusing on building a new generation of energy system to transition from fossil to renewable energy. China has abundant coal resources, but fewer and unevenly distributed oil and gas resources. The energy utilization efficiency is only 36.3%, lower than the world’s advanced level of 44%. At the same time, the energy supply system is inefficient. Traditional energy is easily lost in mining, processing and transportation. China’s total energy consumption in 2022 was 5.41 billion tons of standard coal, an increase of 2.9 percent over the previous year. Coal consumption accounted for 56.2 percent of total energy consumption, up 0.3 percentage points from the previous year. Clean energy consumption, including natural gas, hydropower, nuclear power, wind power and solar power, accounted for 25.9 percent of total energy consumption, up 0.4 percentage points [5]. The situation of energy pressure and carbon emission reduction in China is still not optimistic; therefore, it has become particularly important to change the consumption structure of traditional energy and improve the utilization rate of renewable energy [6,7].
Nowadays, with the continuous improvement of people’s living standards, the scale and grade of urban areas are also increasing. Studies show that the urbanization process will promote carbon emissions and lead to increasing pressure on urban energy system [8,9,10]. If energy efficiency is improved in the process of urbanization, carbon emissions can be inhibited [11,12,13]. For example, in the Expo Village of the 2000 World Expo in Hanover, Germany, the energy consumption index of regional heating was reduced to 50 kWh/(m2·a) through careful energy planning before construction, which was 40% lower than the energy-saving standard of Germany in 1995. The residential electricity consumption index was 30 kWh/(m2·a), decreased by 2 kWh/(m2·a). The carbon dioxide emission index is 27.8 kg/(m2·a), which is reduced by 45% [14]. In addition, scholars at home and abroad have carried out a lot of research on urban area energy planning, and established energy demand models and energy supply system models [15,16,17,18], mainly including the MESSAGE model, CGE model, LEAP model, AIM model and Markal model. In energy planning, the scenario analysis method is usually adopted to make comprehensive assumptions on population, economy, transportation and other aspects. According to the characteristics of the region to be planned, energy demand is predicted and the relationship between energy supply and demand is analyzed so as to realize the comprehensive planning of the target region [19,20,21].
Urban renewable energy planning is an effective way to solve the problems of climate change and energy security in the process of national urbanization. In order to achieve sustainable development of urban energy systems, China has issued the assessment standard for green eco-district GB/T 51255-2017, which encourages all localities to carry out eco-urban planning in accordance with the standards and local conditions [22]. However, practice shows that there are many difficulties in the process of urban energy planning. Generally speaking, the current energy planning mainly has the following problems [23,24,25,26]: (1) Heat supply planning, power supply planning and gas planning operate independently, which results in double calculation of load due to isolated consideration; (2) The energy demand is superimposed according to the maximum load of each part, resulting in the load in actual operation being far less than the predicted load, and the system operation efficiency being low. (3) The development and utilization of renewable energy is very low, limited to solar streetlamps, independent solar water heating and other projects. (4) There is a one-sided pursuit of indicators while ignoring energy consumption in actual operation. In addition, there are many problems in the implementation of energy planning [27,28]. On the one hand, due to the late research on renewable energy planning theory and few engineering examples, the planning methods and depth are uneven. On the other hand, due to the lack of research on renewable energy planning, various regions and institutions lack unified standards and models for the preparation of renewable energy planning schemes, and lead to different urban planning indicators, calculation methods and achieved effects. All these have greatly weakened the role of renewable energy planning in actual projects and restricted the development of relevant research and technology.
In addition to following the general principles of coordinated development, structural optimization and adaptation to local conditions, renewable energy planning to achieve specific urban carbon reduction targets will be a new approach. This paper takes the Sino-Singapore Tianjin Eco-City renewable energy planning project as a case study to provide a method of urban renewable energy planning. Firstly, the current situation of energy consumption and carbon emissions in major sectors such as buildings, industries and transportation in urban areas is statistically calculated. Subsequently, low-carbon development scenarios of different intensities are set up, and the use of renewable energy is used as an important means of carbon emission reduction. Finally, with the goal of achieving carbon neutrality by 2050, a year-by-year renewable energy promotion plan is formulated, including laying municipal photovoltaics, heat pumps and other measures to gradually replace traditional energy power supply and heating. The Sino-Singapore Tianjin Eco-City is a major cooperation project between the governments of China and Singapore, and the first eco-city jointly developed between countries in the world [29]. At the beginning of the construction of the eco-city in 2008, China and Singapore formulated the world’s first eco-city indicator system, which provides a scientific basis and guidance for regional planning, construction and management. In order to meet the new situation and requirements, China and Singapore will continue to play an exemplary role in the application of renewable energy in eco-cities, propose to promote the application of low-carbon technologies, establish a city-level renewable energy utilization model based on solar energy and geothermal energy, and increase the proportion of renewable energy supply. Taking the Sino-Singapore Tianjin Eco-City as an example, renewable energy planning under the guidance of carbon constraint is conducive to coping with global climate change and energy conservation, and provides a model demonstration for urban sustainable development, and provides suggestions for the renewable energy planning of other urban areas.

2. Materials and Methods

2.1. Data Source

Since 2021, we have visited and investigated the Sino-Singapore Tianjin Eco-City many times, and collected construction data and energy consumption data of various departments. At the same time, government statistical yearbooks, development plans and reports have been collected as references to predict the future development scenarios of the eco-city.

2.1.1. Natural Resources of Sino-Singapore Tianjin Eco-City

Located in the northeast of Binhai New Area in Tianjin, China, the Sino-Singapore Tianjin Eco-City covers a planned area of 150.58 square kilometers with a planned residential population of 350,000. Total energy consumption in 2020 is equivalent to about 164,000 tons of standard coal. Among them, renewable energy consumption is about 20,000 tons of standard coal, accounting for about 12% [30] (Figure 1).
1.
Solar energy resources
Tianjin, where the Sino-Singapore Tianjin Eco-City is located, has abundant sunshine conditions, with 2500~2900 h of sunshine per year. It belongs to the solar energy resource rich zone and Class II light resource area. The annual total solar radiation is about 5256 megajoules per square meter, which has good conditions for photovoltaic power generation development.
2.
Geothermal resources
Located in the northern part of the coastal geothermal field, the Sino-Singapore Tianjin Eco-City is relatively rich in geothermal resources. In this area, there are three geothermal water reservoirs available for development and utilization, namely, Neogene Minghuazhen Formation thermal reservoir (Nm), Guantao Formation thermal reservoir (Ng) and Paleogene Dongying Formation thermal reservoir (Ed). The geothermal gradient is 2.4~2.9 °C/100 m, which has good conditions for the occurrence of middle and deep geothermal resources.
The thickness of the temperate zone in the eco-city is about 10 m. In the temperate zone, the surface temperature can be reduced to −9~−13 °C in winter, the thickness of the frozen layer is 0.6~0.8 m, and the surface temperature can reach 30 °C in summer. The temperature in the constant zone is about 13.5 °C, and the average geothermal warming rate in the temperate zone is 2.8 °C/100 m.
3.
Biomass resources
The biomass resources in the Sino-Singapore Tianjin Eco-City mainly include household waste, kitchen waste, garden waste and sludge from sewage treatment plant. Among them, the waste output of the eco-city is about 733.1 tons per day. The daily sewage capacity of sewage treatment plant is 260,000 m3/day, and every 10,000 tons of sewage can produce about 5–8 tons of sludge with 80% moisture content, which has certain potential of biomass resources utilization.

2.1.2. Energy Consumption of Sino-Singapore Tianjin Eco-City in 2020

The main energy consumption of the Sino-Singapore Tianjin Eco-City is shown in Table 1, which mainly includes construction, industry and transportation sectors, and the main energy consumption types are electricity, heat and natural gas.

2.1.3. Research Objective

The local government plans for the Sino-Singapore Tianjin Eco-City to peak carbon emissions by 2050 and become as close to carbon neutral as possible. The objective of this paper is to reasonably formulate energy-saving and low-carbon building promotion plans, electrification rate promotion plans and various renewable energy application plans on the basis of fully studying the energy supply and demand of the Sino-Singapore Tianjin Eco-City, combining the renewable energy resource conditions of the eco-city, urban development goals and the actual situation of the eco-city.

2.2. Calculation Method of Urban Carbon Emission

2.2.1. Computational Boundary

The calculation of urban carbon emissions should take the spatial range of urban development and public service facilities as the calculation boundary. The carbon emissions of buildings, industries and transportation were taken as calculation objects.

2.2.2. Carbon Emission Calculation Model

Carbon emission calculation methods mainly include the emission factor method and the measurement method. Among them, the measured method is the continuous measurement of greenhouse gas emission concentration, which has a large workload and high equipment cost. The emission factor method mainly relies on calculation, that is, emissions are calculated through activity level data and related parameters. Now, there are mature calculation formulas and complete data sources of various energy emission factors, which are widely used in various countries. In this paper, the emission factor method is chosen to calculate the carbon emissions in urban areas. The specific formula is as follows [31,32,33]:
E T = E B + E M + E I
where ET is the total carbon emission in urban areas, tCO2; EB is the urban building carbon emissions, tCO2; EM is the urban transport carbon emissions, tCO2; and EI is the urban industrial carbon emissions, tCO2.
4.
Calculation of building carbon emissions
E B = i = 1 n F i × U i
where EB represents the building carbon emissions, tCO2; n stands for the type of energy consumed; Ui is the energy consumption, kWh, Nm3 or GJ; and Fi is the carbon emission coefficient of energy, tCO2/kWh, tCO2/Nm3 or tCO2/GJ.
5.
Calculation of transportation carbon emissions
E M = i = 1 n M i × e i × k × P
where EM represents the transport carbon emissions, tCO2; Mi is the mileage, km; ei is the fuel consumption per mile, t or kWh; k is the carbon emission coefficient of fuel, tCO2/t or tCO2/kWh; and P represents the number of vehicles.
6.
Calculation of industrial carbon emissions
E I = i = 1 n L i × l i
where EI represents the industrial carbon emissions, tCO2; Li is the industrial process, kWh or GJ; and li represents the carbon emission factor of industry, tCO2/kWh or tCO2/GJ.
7.
Calculation of carbon sink
E G = i = 1 n A i × a i
where EG represents the carbon sink of green space, tCO2; Ai is the different types of green space, m2; and ai represents the carbon sink factors of different types of green space, tCO2/m2.

2.2.3. Emission Factor

Emission factor data are mainly obtained from default emission factors recommended in IPCC guidelines, the international emission factor database, urban greenhouse gas emission tool guide, actual survey data or measured data, published literature, etc. [34,35,36]. The carbon emission coefficient adopted in this paper is shown in Table 2.

2.3. Prediction Methods of Urban Energy Consumption and Carbon Emissions

Scenario analysis is a method used to predict the possible situation or consequences of the predicted object under the premise that a certain phenomenon or a certain trend will continue into the future. It was adopted to forecast the energy consumption and carbon emissions of the Sino-Singapore Tianjin Eco-City from 2021 to 2050 [15]. Based on local planning, promotion intensity and expected goals, different low-carbon development scenarios and indicators are set, such as baseline scenario, low-carbon scenario and enhanced low-carbon scenario, etc., and long-term carbon emissions are calculated according to the method presented in Section 2.1.

2.3.1. Baseline Scenario

In accordance with the usual economic growth rate, population development scale, resource consumption and energy demand of the eco-city in recent years, the inertia development is maintained, the construction volume is maintained in a high-speed development mode, and the implementation of low-carbon building development policies is consistent with the national and Tianjin policies.

2.3.2. Low-Carbon Scenario

Considering the social conditions of resources, the construction field should gradually control the amount of construction, further strengthen building energy conservation, promote the construction of ultra-low energy consumption, near-zero energy consumption and zero energy consumption buildings; improve the energy efficiency of energy using equipment through technological progress; promote the popularization of building energy management; and promote an energy-saving and low-carbon lifestyle.

2.3.3. Enhanced Low-Carbon Scenario

On the basis of the low-carbon scenario, the application of municipal renewable energy projects will be greatly increased, the adjustment of energy use structure will be intensified, and the carbon emission factors of electricity and heat will be further reduced.

2.4. Calculation of Renewable Energy Utilization Rate

The renewable energy utilization rate is calculated by Equation (6):
R E P p = E P h + E P c + E P w + E r , i × f i Q h + Q c + Q w + E l × f + E e × f
where REPP is the renewable energy utilization rate,%; EPh is the amount of renewable energy used in heating systems, kWh; EPc is the renewable energy utilization in cooling system, kWh; EPw is the renewable energy utilization in domestic hot water systems, kWh; Er,i is the renewable energy generation in urban areas, kWh; fi is the conversion factor of energy; Qh is the annual heating energy consumption, kWh; Qc is the annual cooling consumption, kWh; Qw is the annual heat consumption of domestic hot water, kWh; El is the annual energy consumption of lighting system, kWh; and Ee is the annual energy consumption of elevator system, kWh [37].

3. Results

3.1. Carbon Emission Status and Scenario Analysis of Sino-Singapore Tianjin Eco-City

3.1.1. Carbon Emission Status in 2020

According to the statistics presented in Table 1, the Sino-Singapore Tianjin Eco-City had an annual energy consumption of about 1.33 billion kWh and carbon emissions of 6.07 × 10⁵ tCO2 in 2020. Among them, the calculated carbon emission in the building field is about 5.17 × 10⁵ tCO2. The direct carbon emission of the building is mainly generated by the use of municipal natural gas, while the indirect carbon emission is generated by the electricity and heat consumed by the building. The carbon emission of the eco-city’s industry is about 5.56 × 10⁴ tCO2. The main land properties of industrial buildings are first-class industrial land (M1) and second-class industrial land (M2). Industrial energy consumption mainly includes thermal energy consumption and power energy consumption. Transportation energy consumption mainly comes from the use of sanitation vehicles, taxis, private cars, buses, electric bicycles, etc., and the total carbon emission is 3.46 × 10⁴ tCO2.

3.1.2. Carbon Emission Prediction for Baseline Scenario

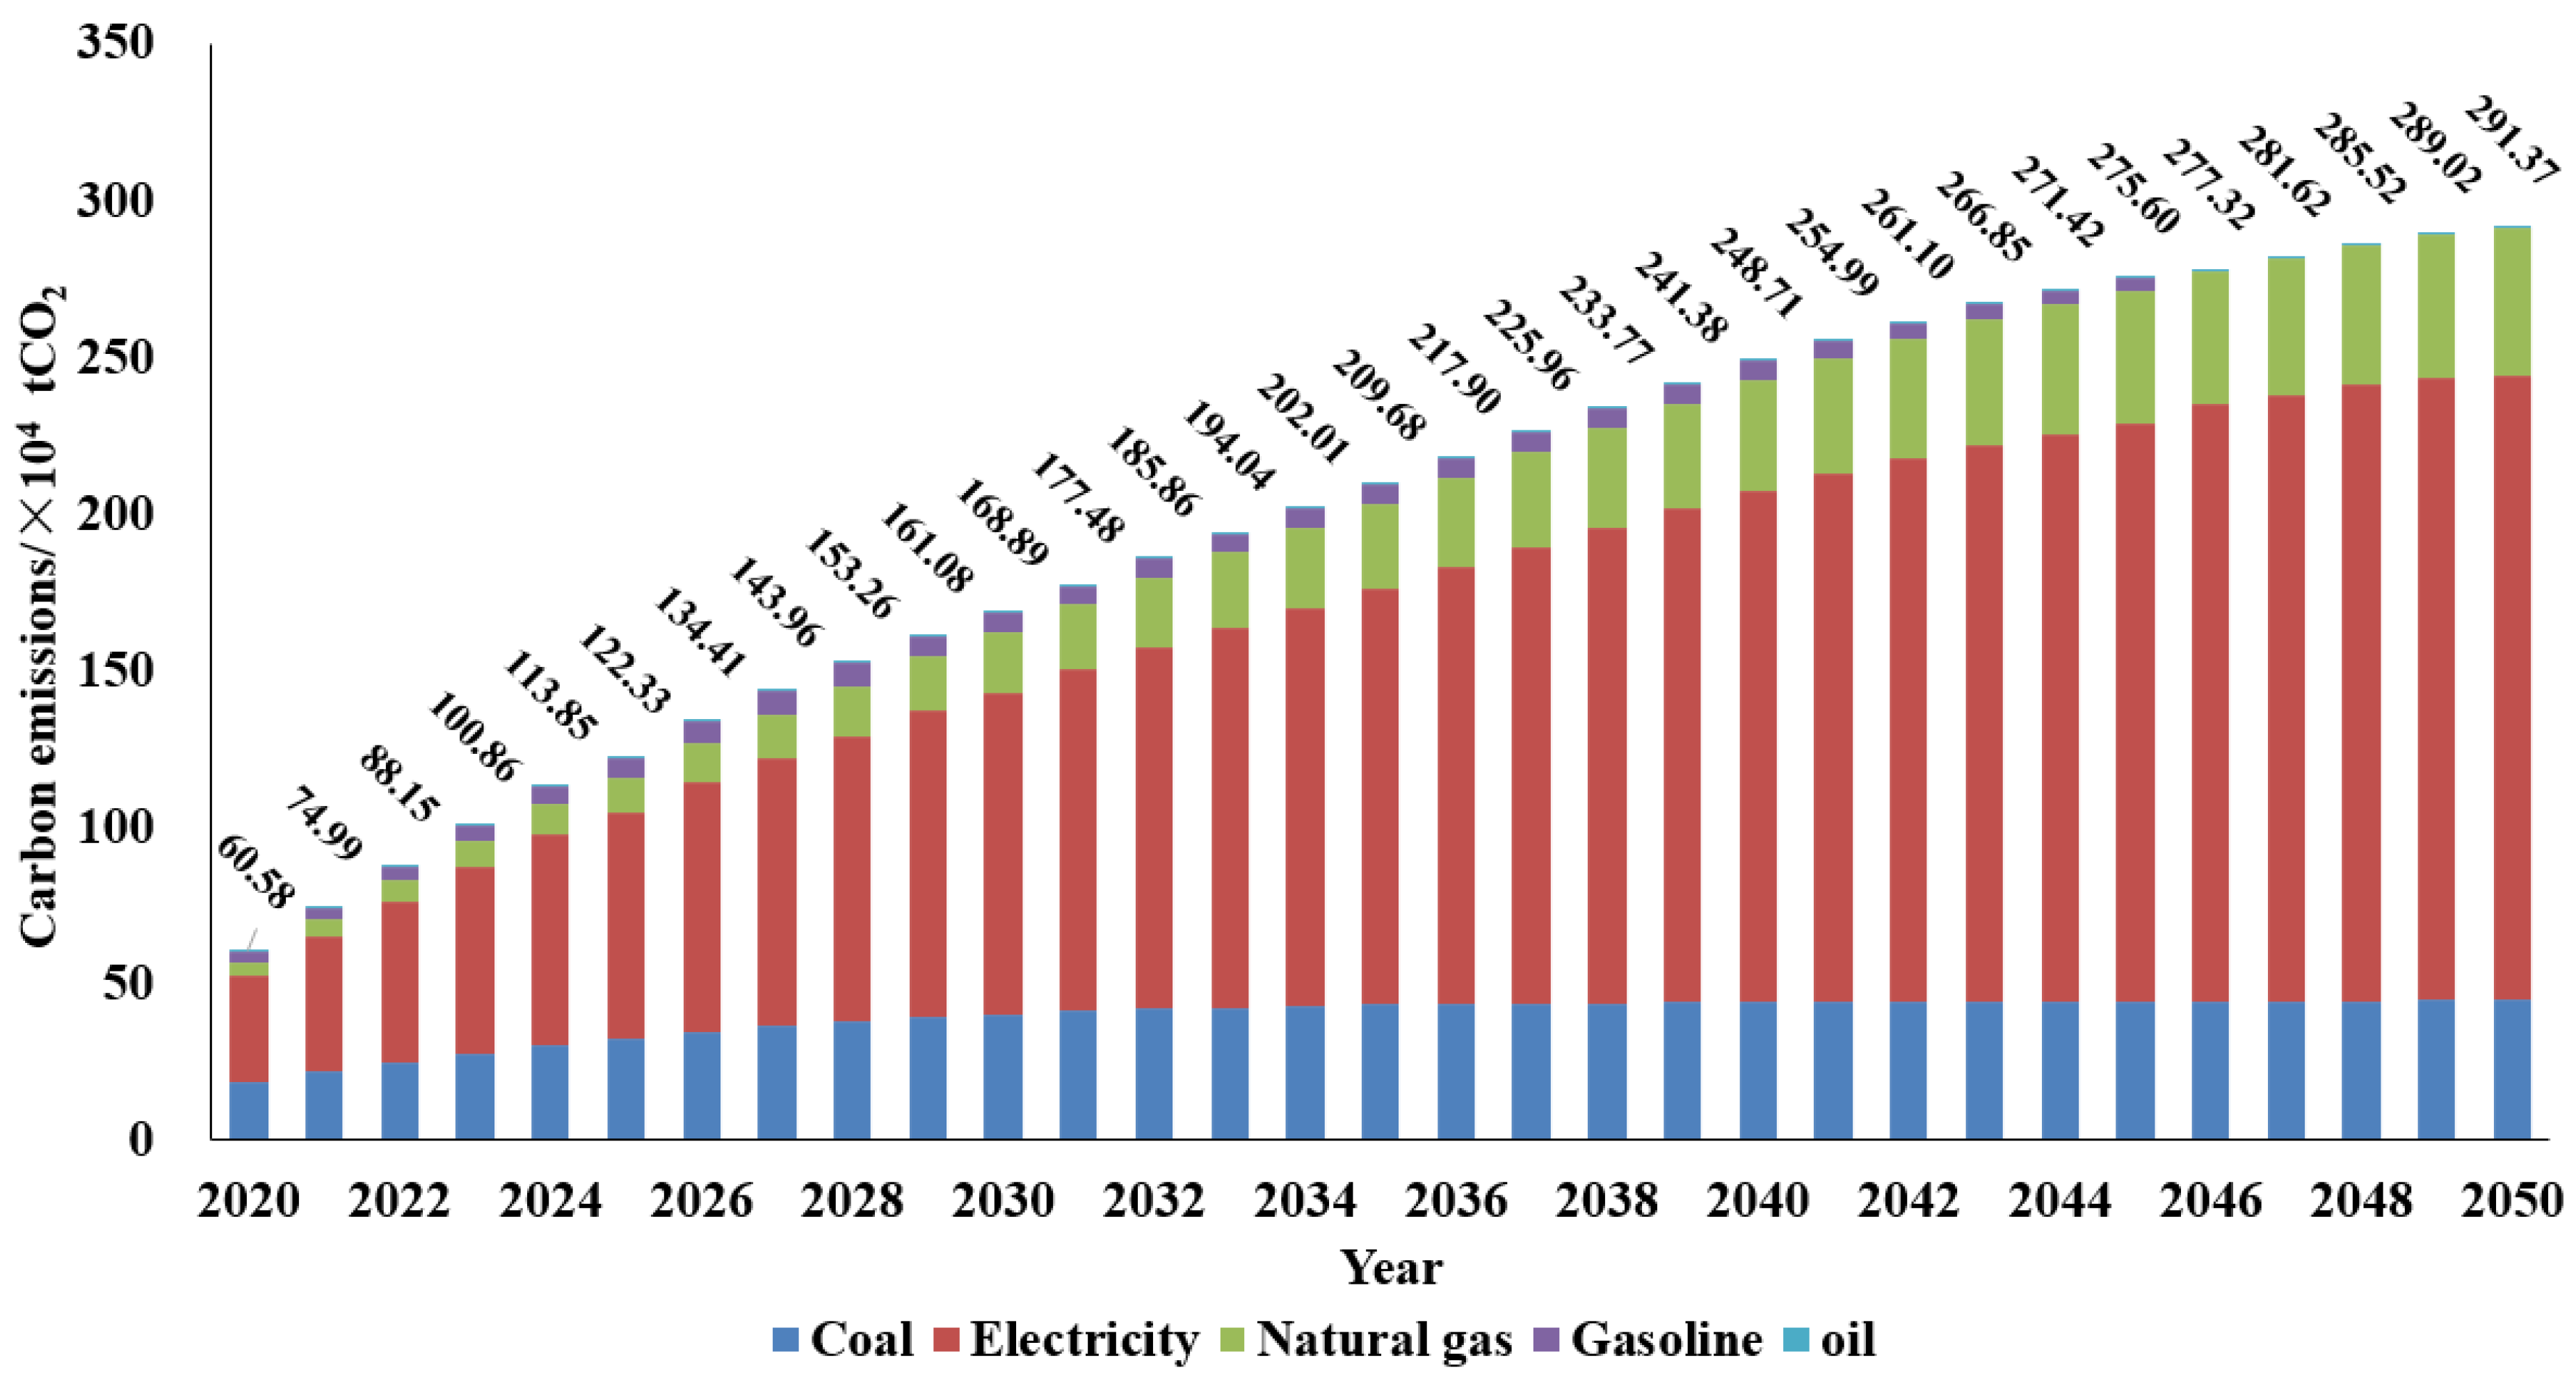
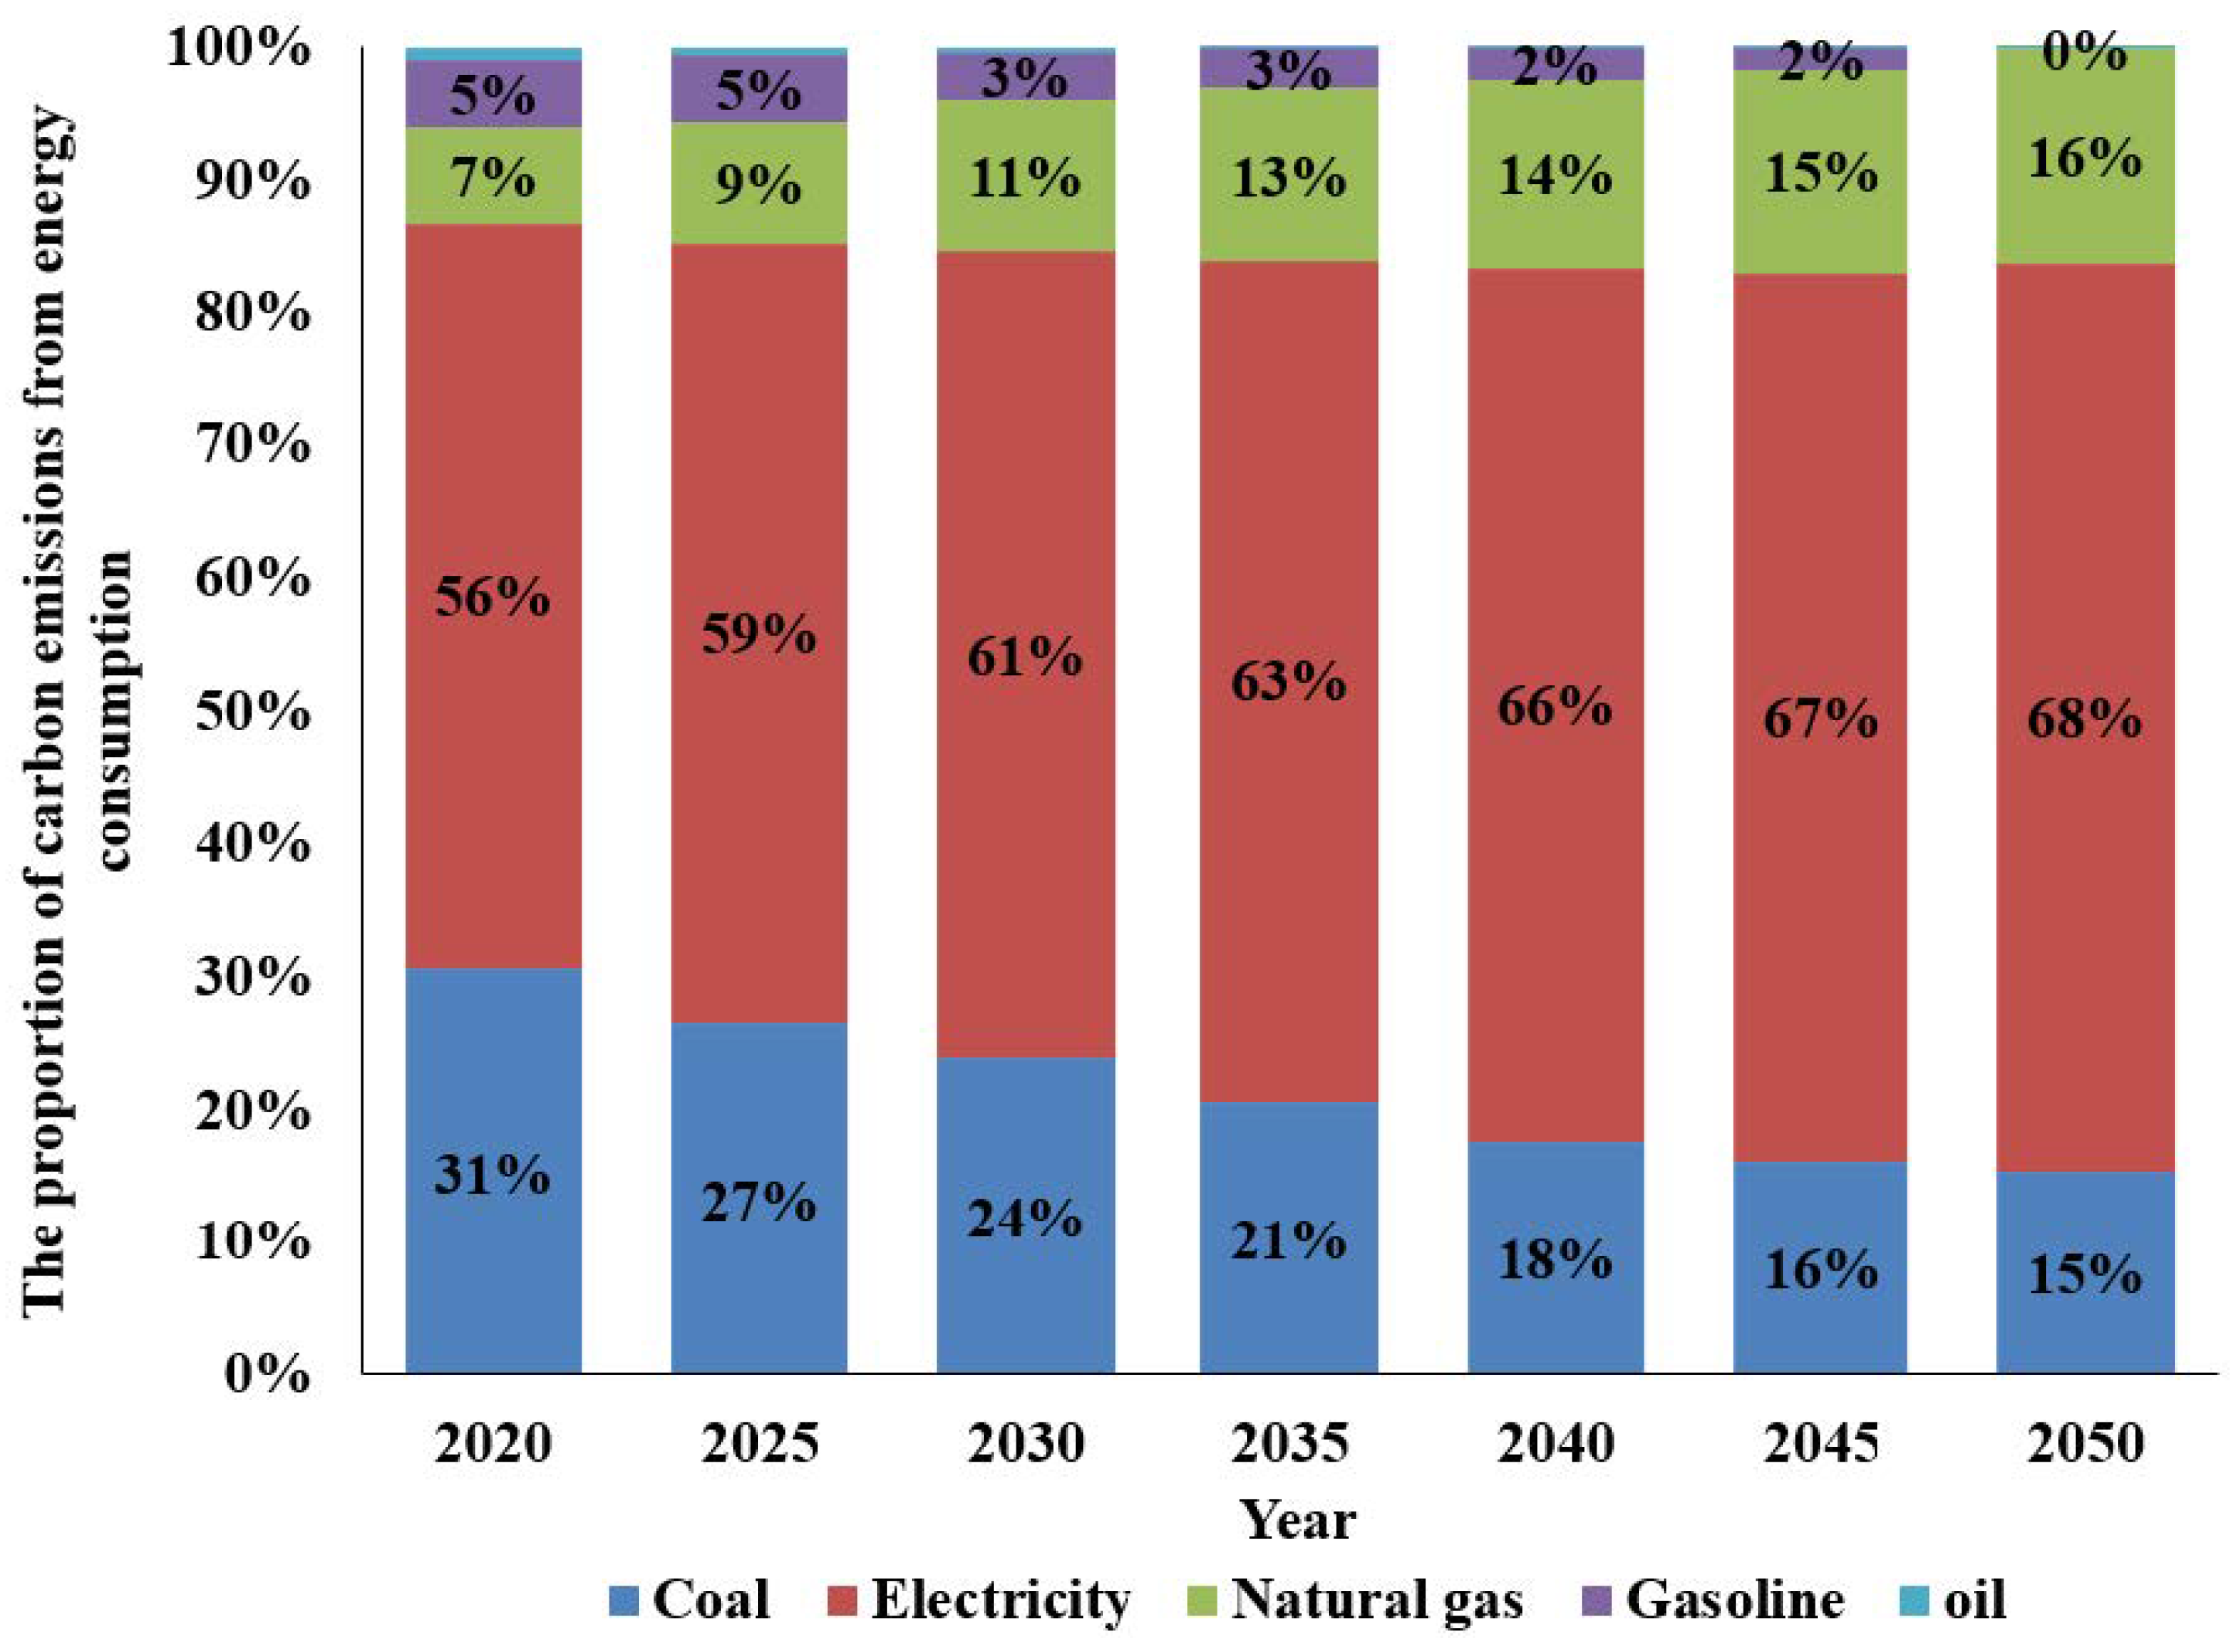
Under the baseline scenario, the current situation of economic growth rate, population development scale, resource consumption and energy demand of the Sino-Singapore Tianjin Eco-City in recent years is continued, and the low-carbon building policy follows the national and Tianjin policies. The carbon emission prediction of the Sino-Singapore Tianjin Eco-City under baseline scenario is shown in Figure 2. The proportion of carbon emissions from energy consumption under baseline scenario is shown in Figure 3. The total energy consumption of the Sino-Singapore Tianjin Eco-City is forecast to increase from 1.33 billion kWh/a to 8.97 billion kWh/a. Among them, the growth of coal consumption is relatively stable and will essentially no longer increase after 2035. The electricity consumption and gas consumption will increase year by year, and the fuel consumption will first increase and then decrease.

3.1.3. Carbon Emission Prediction for Low-Carbon Scenario

Under the low-carbon scenario, the construction sector should gradually control the amount of construction, further strengthen the building energy conservation, promote the construction of ultra-low energy consumption, near-zero energy consumption and zero energy consumption buildings, improve the energy efficiency of energy using equipment through technological progress, promote the building energy management, and promote and energy-saving and low-carbon lifestyle. As shown in Figure 4 and Figure 5, the total energy consumption of Sino-Singapore Tianjin Eco-City is forecast to grow to 7.73 billion kWh/a in 2050, 11.4% lower than the baseline scenario of 8.97 billion kWh/a. Among them, the coal consumption increases steadily and decreases year by year after 2040 to 16,200 tce/a in 2050. Electricity consumption is growing rapidly and will dominate energy consumption after 2030. Natural gas and gasoline consumption rose and then fell. However, the results show that even under the low-carbon scenario, there is still a carbon emission gap of 2.301 million tCO2/a to achieve carbon neutrality by 2050.

3.2. Renewable Energy Planning for Sino-Singapore Tianjin Eco-City

The use of renewable energy can significantly reduce energy consumption and carbon emission levels in urban areas. After discussions with relevant government departments, the enhanced low-carbon scenario was selected as the future development mode. In this section, a renewable energy planning scheme for the Sino-Singapore Tianjin Eco-City from 2021 to 2050 will be formulated according to the enhanced low-carbon scenario, including the promotion of energy-efficient buildings, the utilization of renewable energy in buildings, the electrification of terminal energy use, and the application of large-scale municipal renewable energy.

3.2.1. Renewable Energy Planning Program

1.
Energy-Efficient buildings
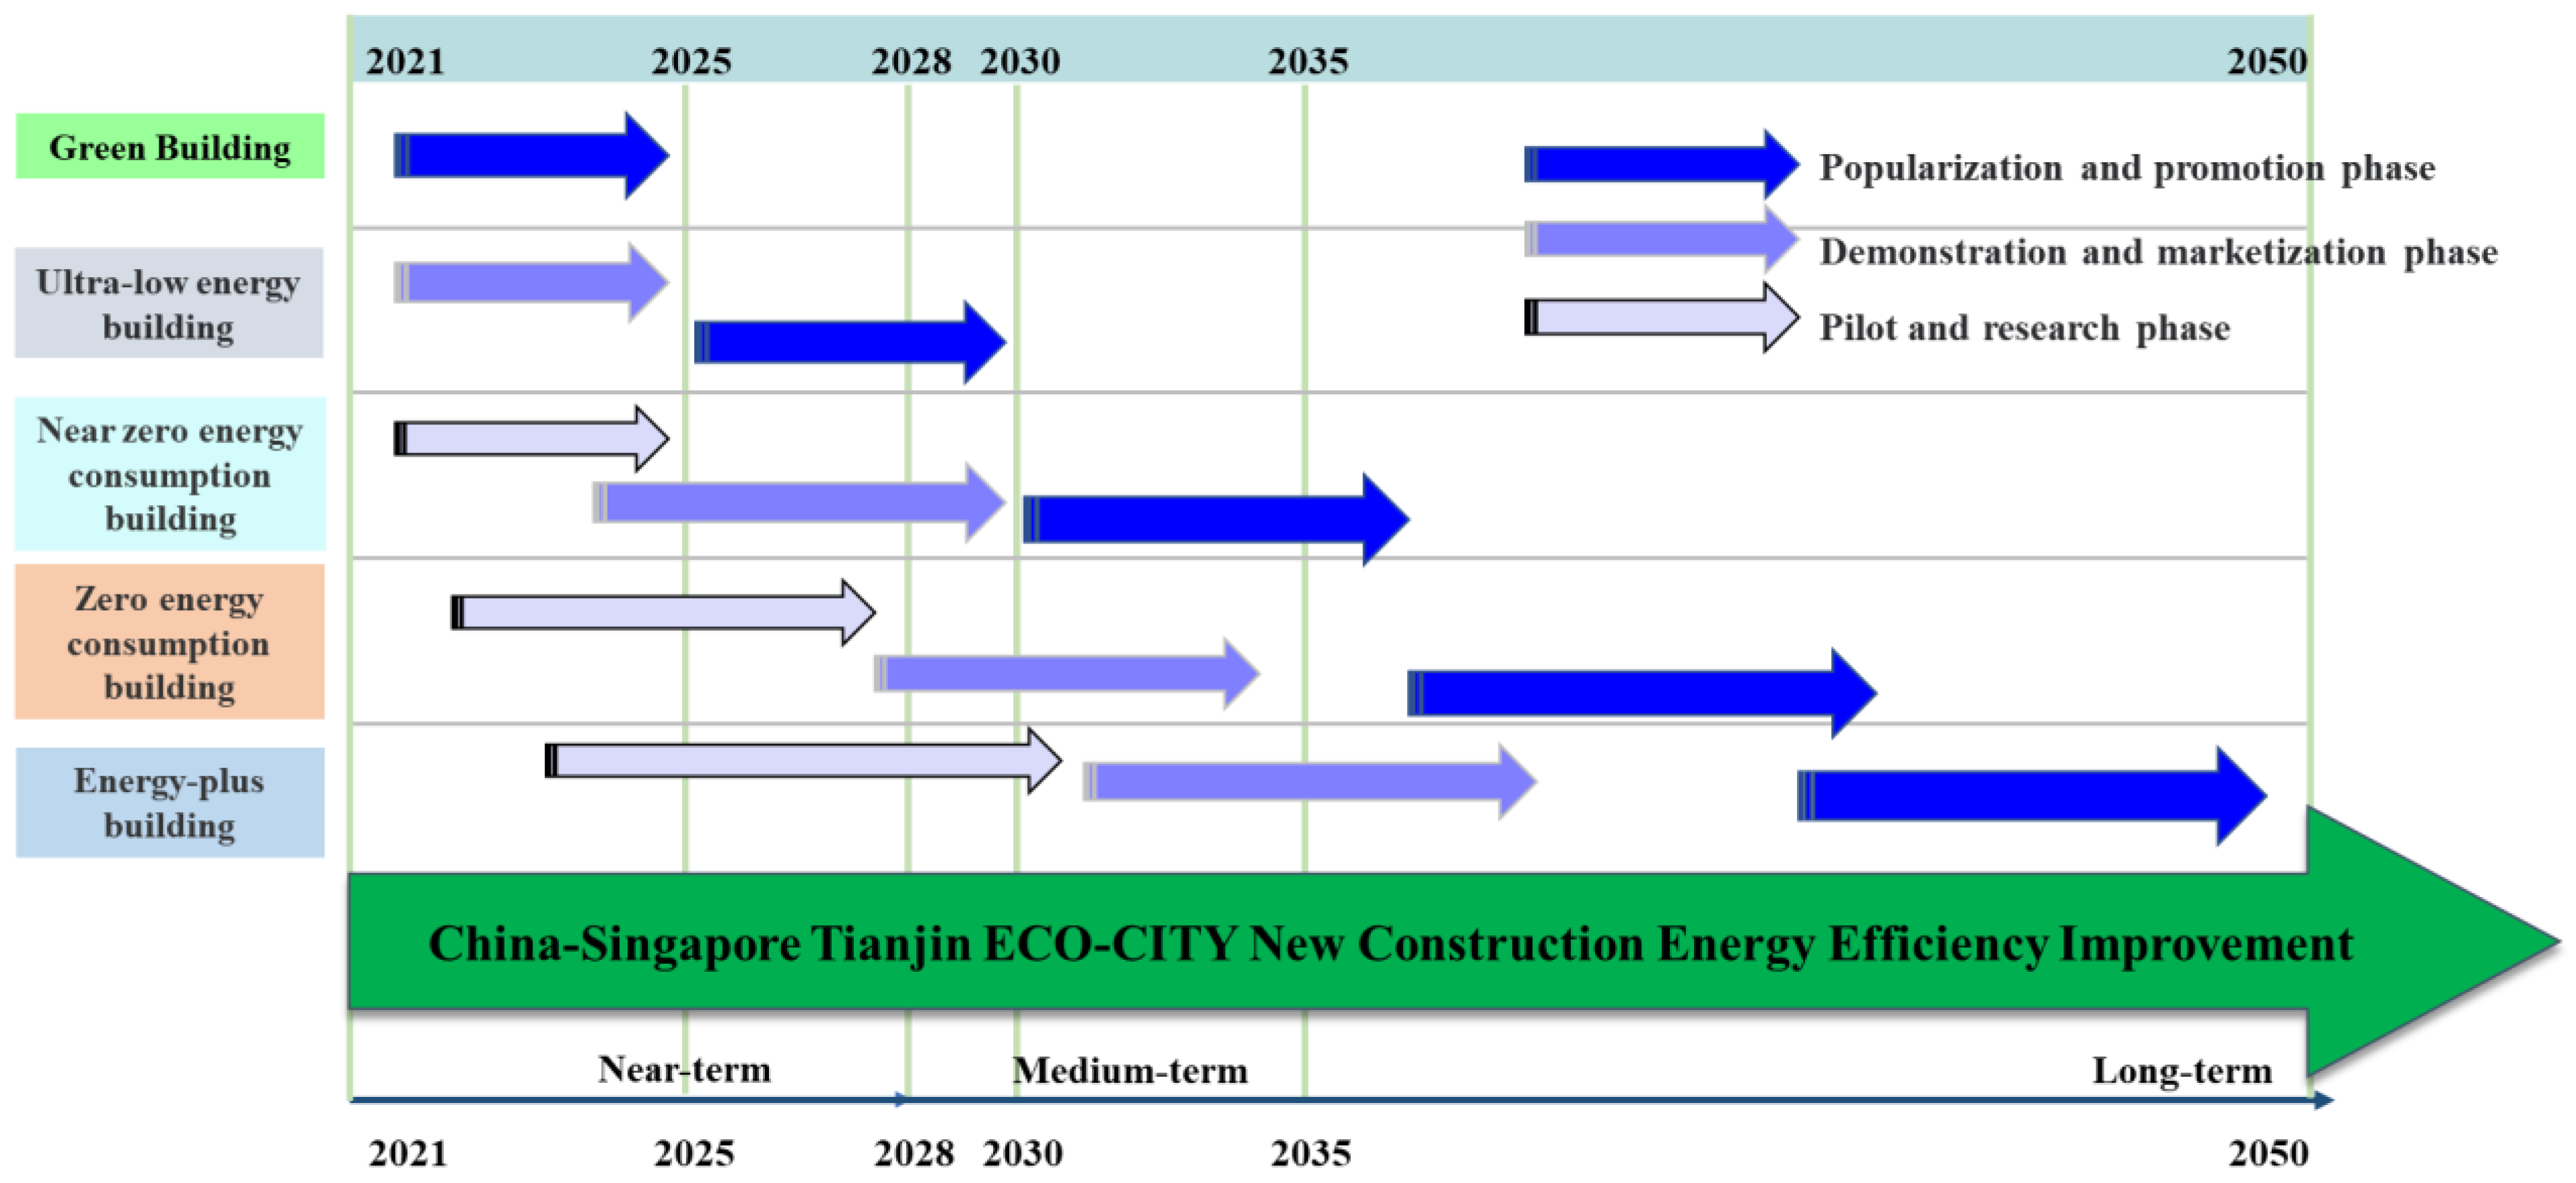
The planning of energy-efficient buildings in Sino-Singapore Tianjin Eco-City is shown in Figure 6. From 2021 to 2025, the total construction of ultra-low energy consumption buildings, near-zero energy consumption buildings and zero-energy-consumption buildings in Sino-Singapore Tianjin Eco-City will be no less than 0.5 million m2, and the total new construction area from 2026 to 2030 will be no less than 2 million m2.
From 2031 to 2050, the construction of ultra-low energy consumption residential buildings is expected to reach more than 3 million m2, and public buildings will reach more than 8 million m2. The area of newly built residential buildings with near-zero energy consumption is expected to reach over 7 million m2, public buildings to reach over 3 million m2, and government-invested buildings for people’s livelihood to reach over 0.6 million m2. A total of 4 million m2 of new zero-energy residential buildings will be built, over 0.3 million m2 of public buildings will be built, and over 0.05 million m2 of buildings will be invested in by the government.
2.
Renewable energy utilization in buildings
From 2021 to 2025, the new installed capacity of solar photovoltaic in public buildings will reach more than 3 MW, and the use of solar thermal for domestic hot water in residential buildings will reach 8.3 × 10⁶ kWh/a.
From 2026 to 2030, the installed solar rooftop photovoltaic capacity of public buildings will reach more than 55 MW, and the utilization of solar thermal for domestic hot water in residential buildings will reach more than 1.06 × 10⁷ kWh/a.
From 2031 to 2050, the installed rooftop solar photovoltaic capacity of public buildings will reach more than 300 MW, with an average increase of 15 M per year. The utilization of solar heat for domestic hot water in residential buildings will reach more than 4.28 × 10⁷ kWh/a.
3.
Renewable energy for heating
From 2021 to 2025, a total of 7.78 × 10⁶ kWh of heat pump renewable energy will be used in new residential buildings and public buildings.
From 2026 to 2030, new residential buildings and public buildings will add 4.72 × 10⁷ kWh of heat pump heating.
From 2031 to 2050, the cumulative increase in heat pump heat supply in new residential buildings and public buildings will reach 2.78 × 10⁸ kWh. In existing residential buildings and public buildings, through the heating transformation, the cumulative increase in heat pump heating capacity is expected to reach 1.11 × 10⁹ kWh/a.
4.
Terminal energy-using electrification
From 2021 to 2025, the electrification of cooking in new buildings to reduce gas consumption will be encouraged.
From 2026 to 2030, the electrification of new buildings, cooking, industries and transportation will be encouraged.
From 2031 to 2050, more efforts will be made to promote the electrification of new buildings, cooking, industries and transportation. It is planned that by 2050, 100 percent of new buildings and cooking will be electrified, more than 90 percent of industrial energy will be electrified, and 100 percent of transportation will be electrified.
5.
Large and medium-sized municipal renewable energy sources
From 2021 to 2025, the installed capacity of large- and medium-sized municipal photovoltaic construction will reach 161 MW.
From 2026 to 2030, the installed capacity of large- and medium-sized municipal photovoltaic construction will reach 43 MW.
From 2031 to 2050, the installed capacity of large- and medium-sized municipal photovoltaic construction is planned to reach 62 MW.

3.2.2. Planning Indicators for Renewable Energy

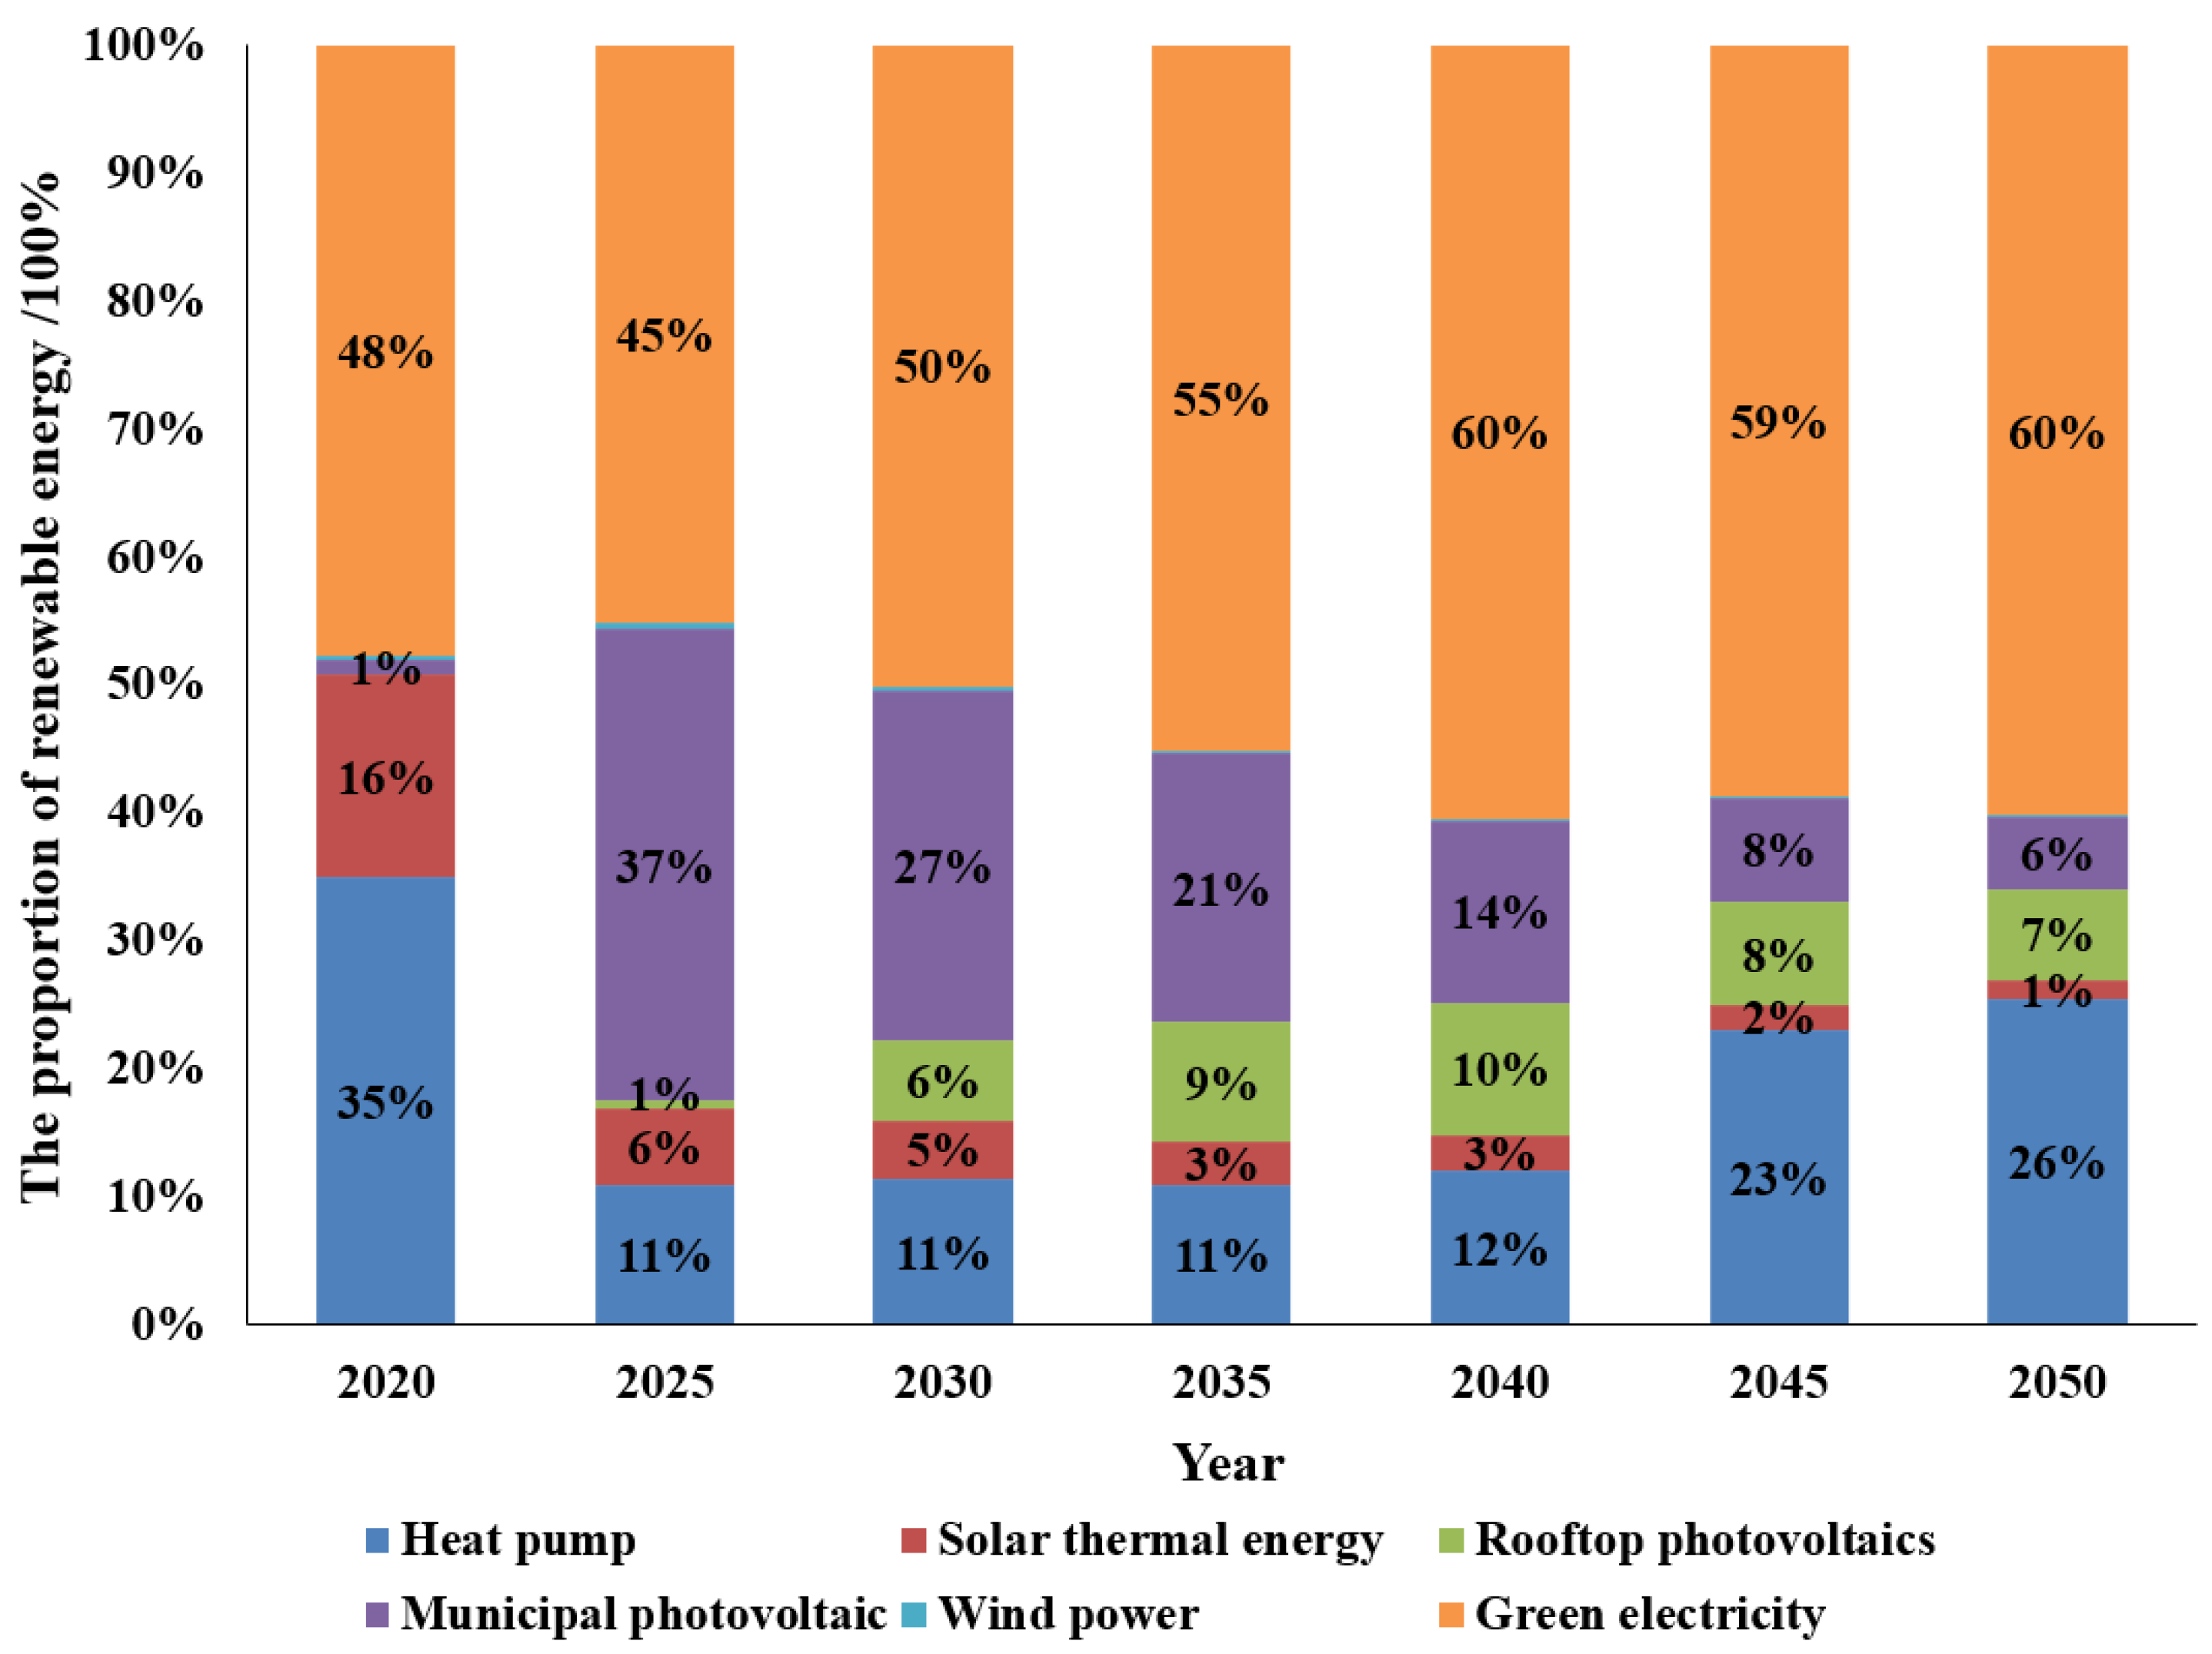
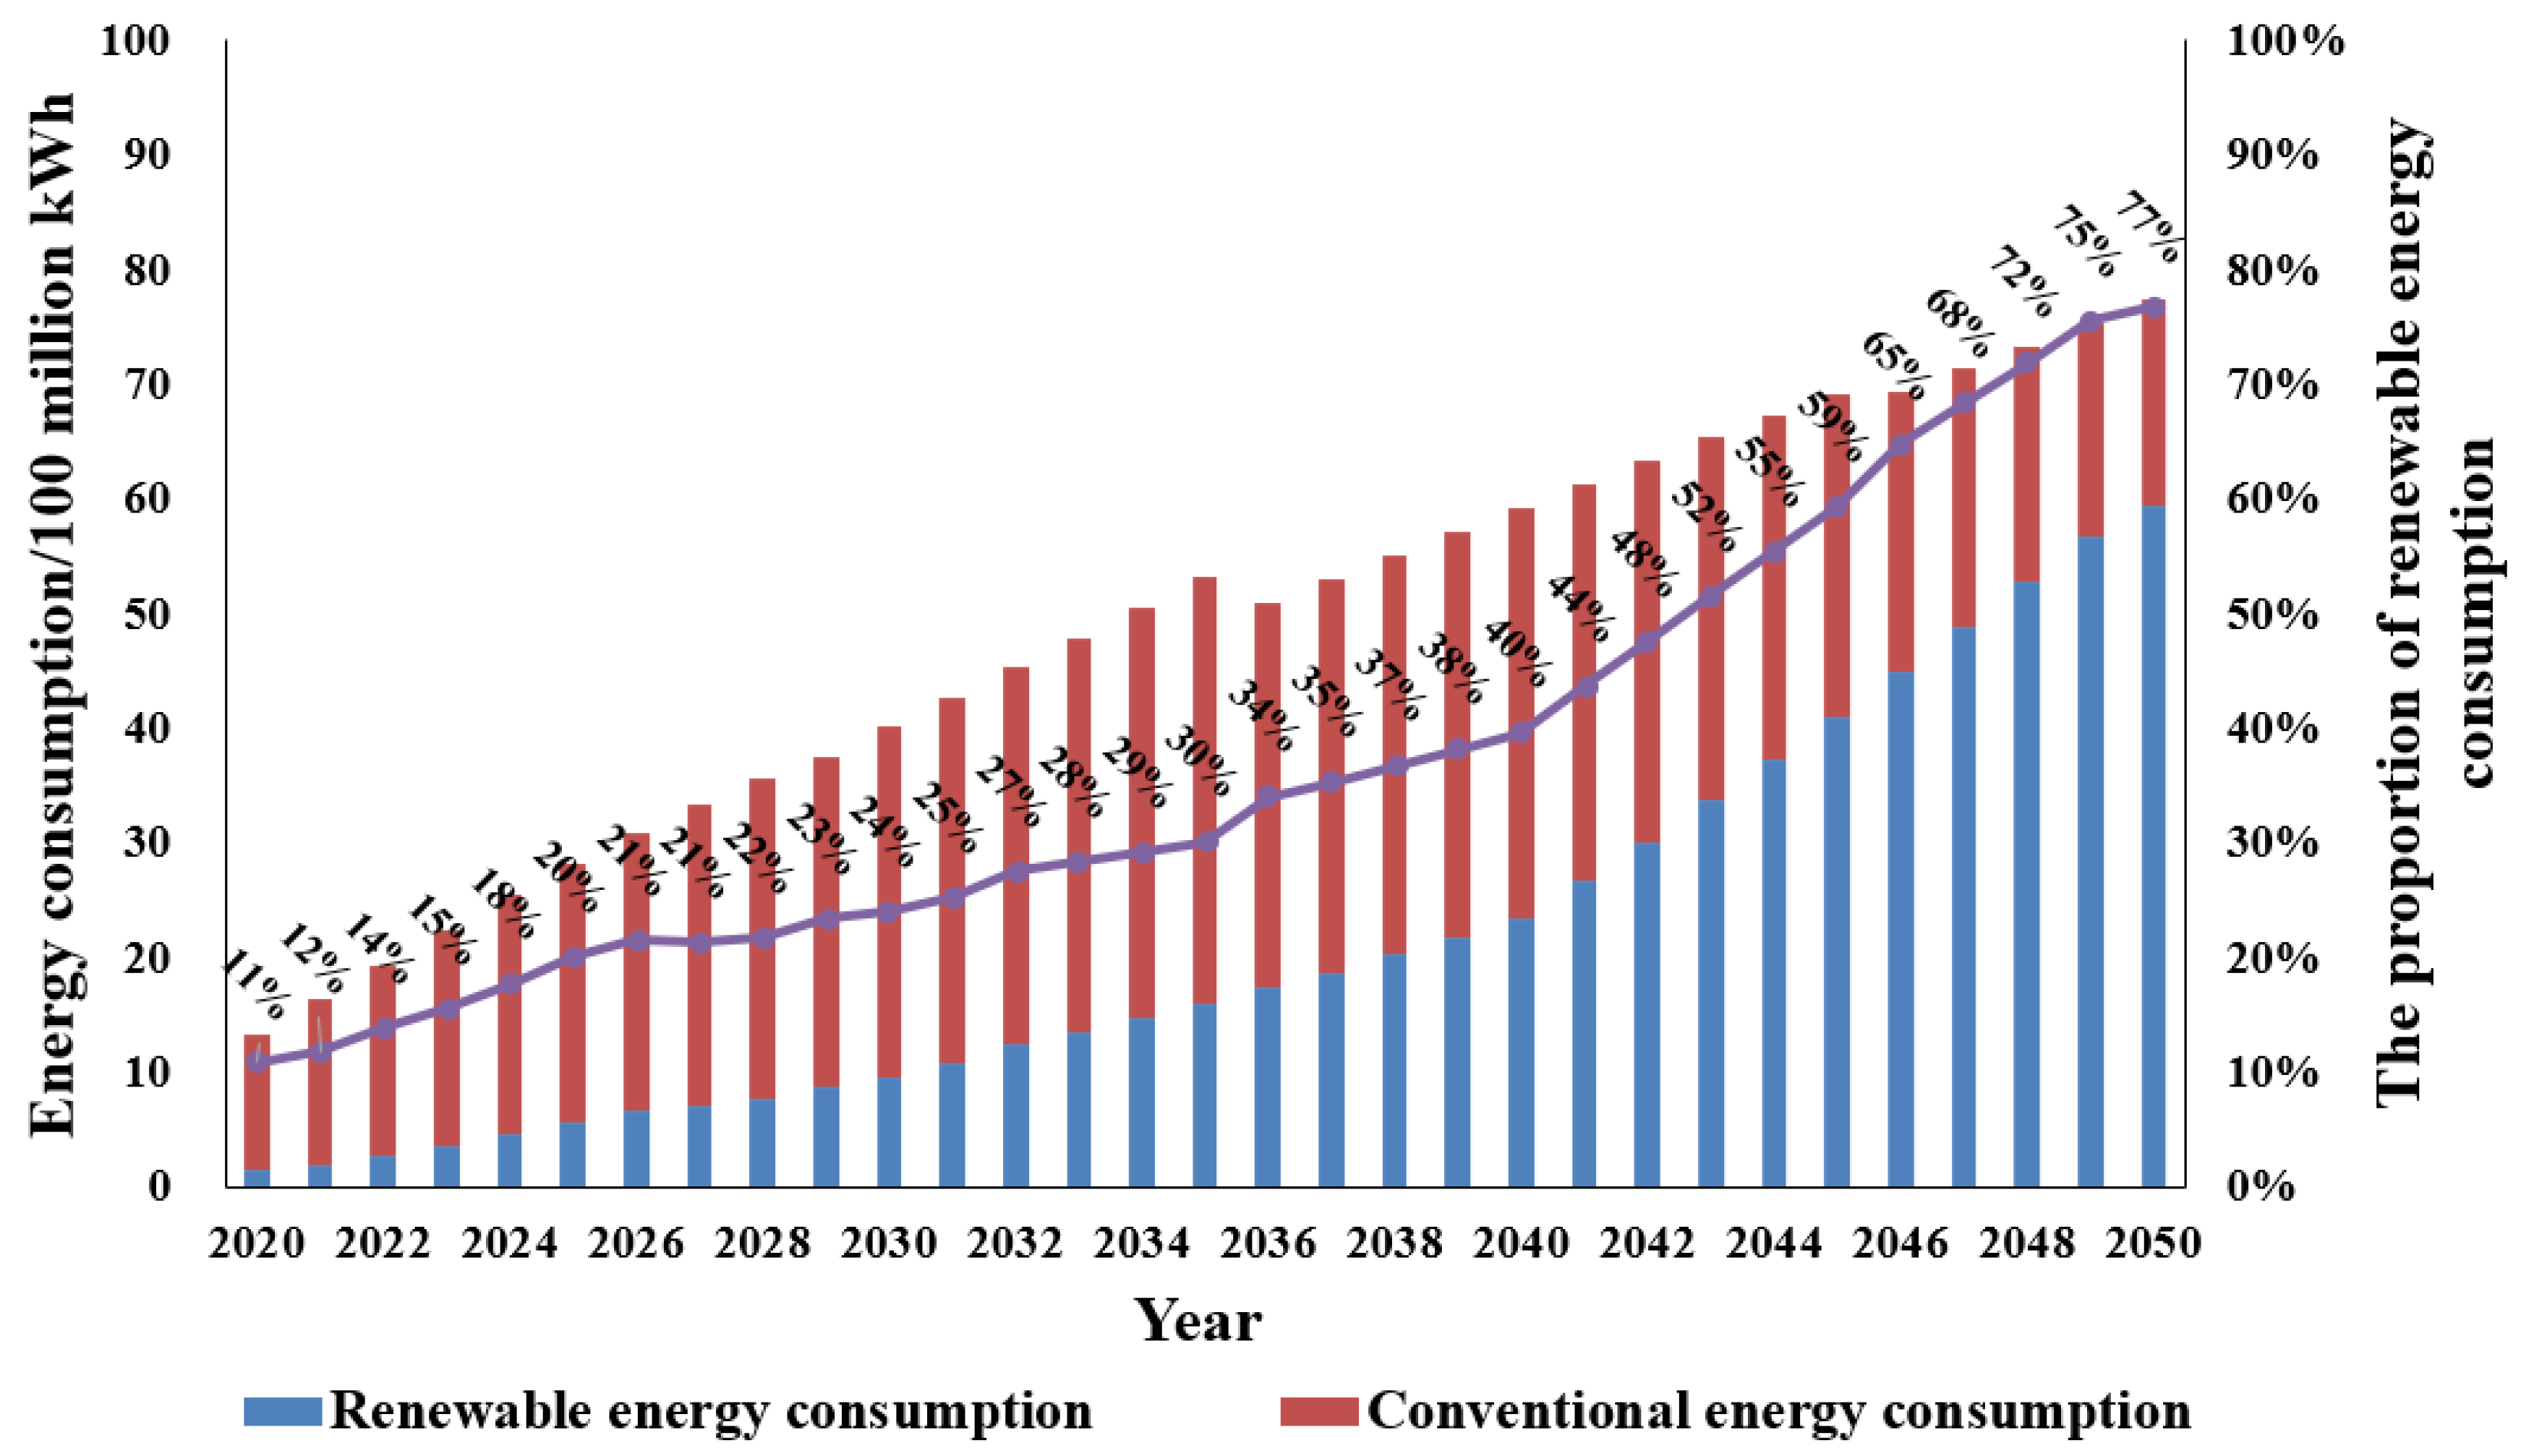
As shown in Figure 7 and Figure 8, it is predicted that by 2050, the amount of renewable energy comprehensively applied in the eco-city will be 5.8~6 billion kWh/a. Among them, the solar energy application of buildings is 87 million kWh/a, accounting for 1.5%. The renewable energy consumption of building heat pump heating is expected to be 1.515 billion kWh/a, accounting for 27.2%. Solar photovoltaics are expected to generate 766 million kWh/a, accounting for 13.1% of the total, of which rooftop photovoltaics for buildings are expected to generate 420 million kWh/a and municipal photovoltaics 336 million kWh/a. Wind power consumption will be 300 million kWh/a, accounting for 0.05% of the total renewable energy. Green electricity consumption will be 3.4~3.5 billion kWh/a, accounting for 58.1% of the total renewable energy.
The prediction of the utilization rate of renewable energy in Sino-Singapore Tianjin Eco-City is shown in Figure 9. In 2050, the comprehensive renewable energy utilization rate of Sino-Singapore Tianjin Eco-City will reach more than 75%, of which the renewable energy utilization rate will reach more than 20% in 2025, and the renewable energy utilization rate will reach 24% to 25% in 2030. The predicted value takes into account energy-saving renovation of buildings, solar thermal or photovoltaic integration construction with buildings, energy-saving renovation of heating system, electrification of heating system, electrification of transportation, electrification of industry and increasing proportion of green electricity, and does not consider the introduction of renewable energy outside the district.

3.2.3. Calculation of Carbon Sink

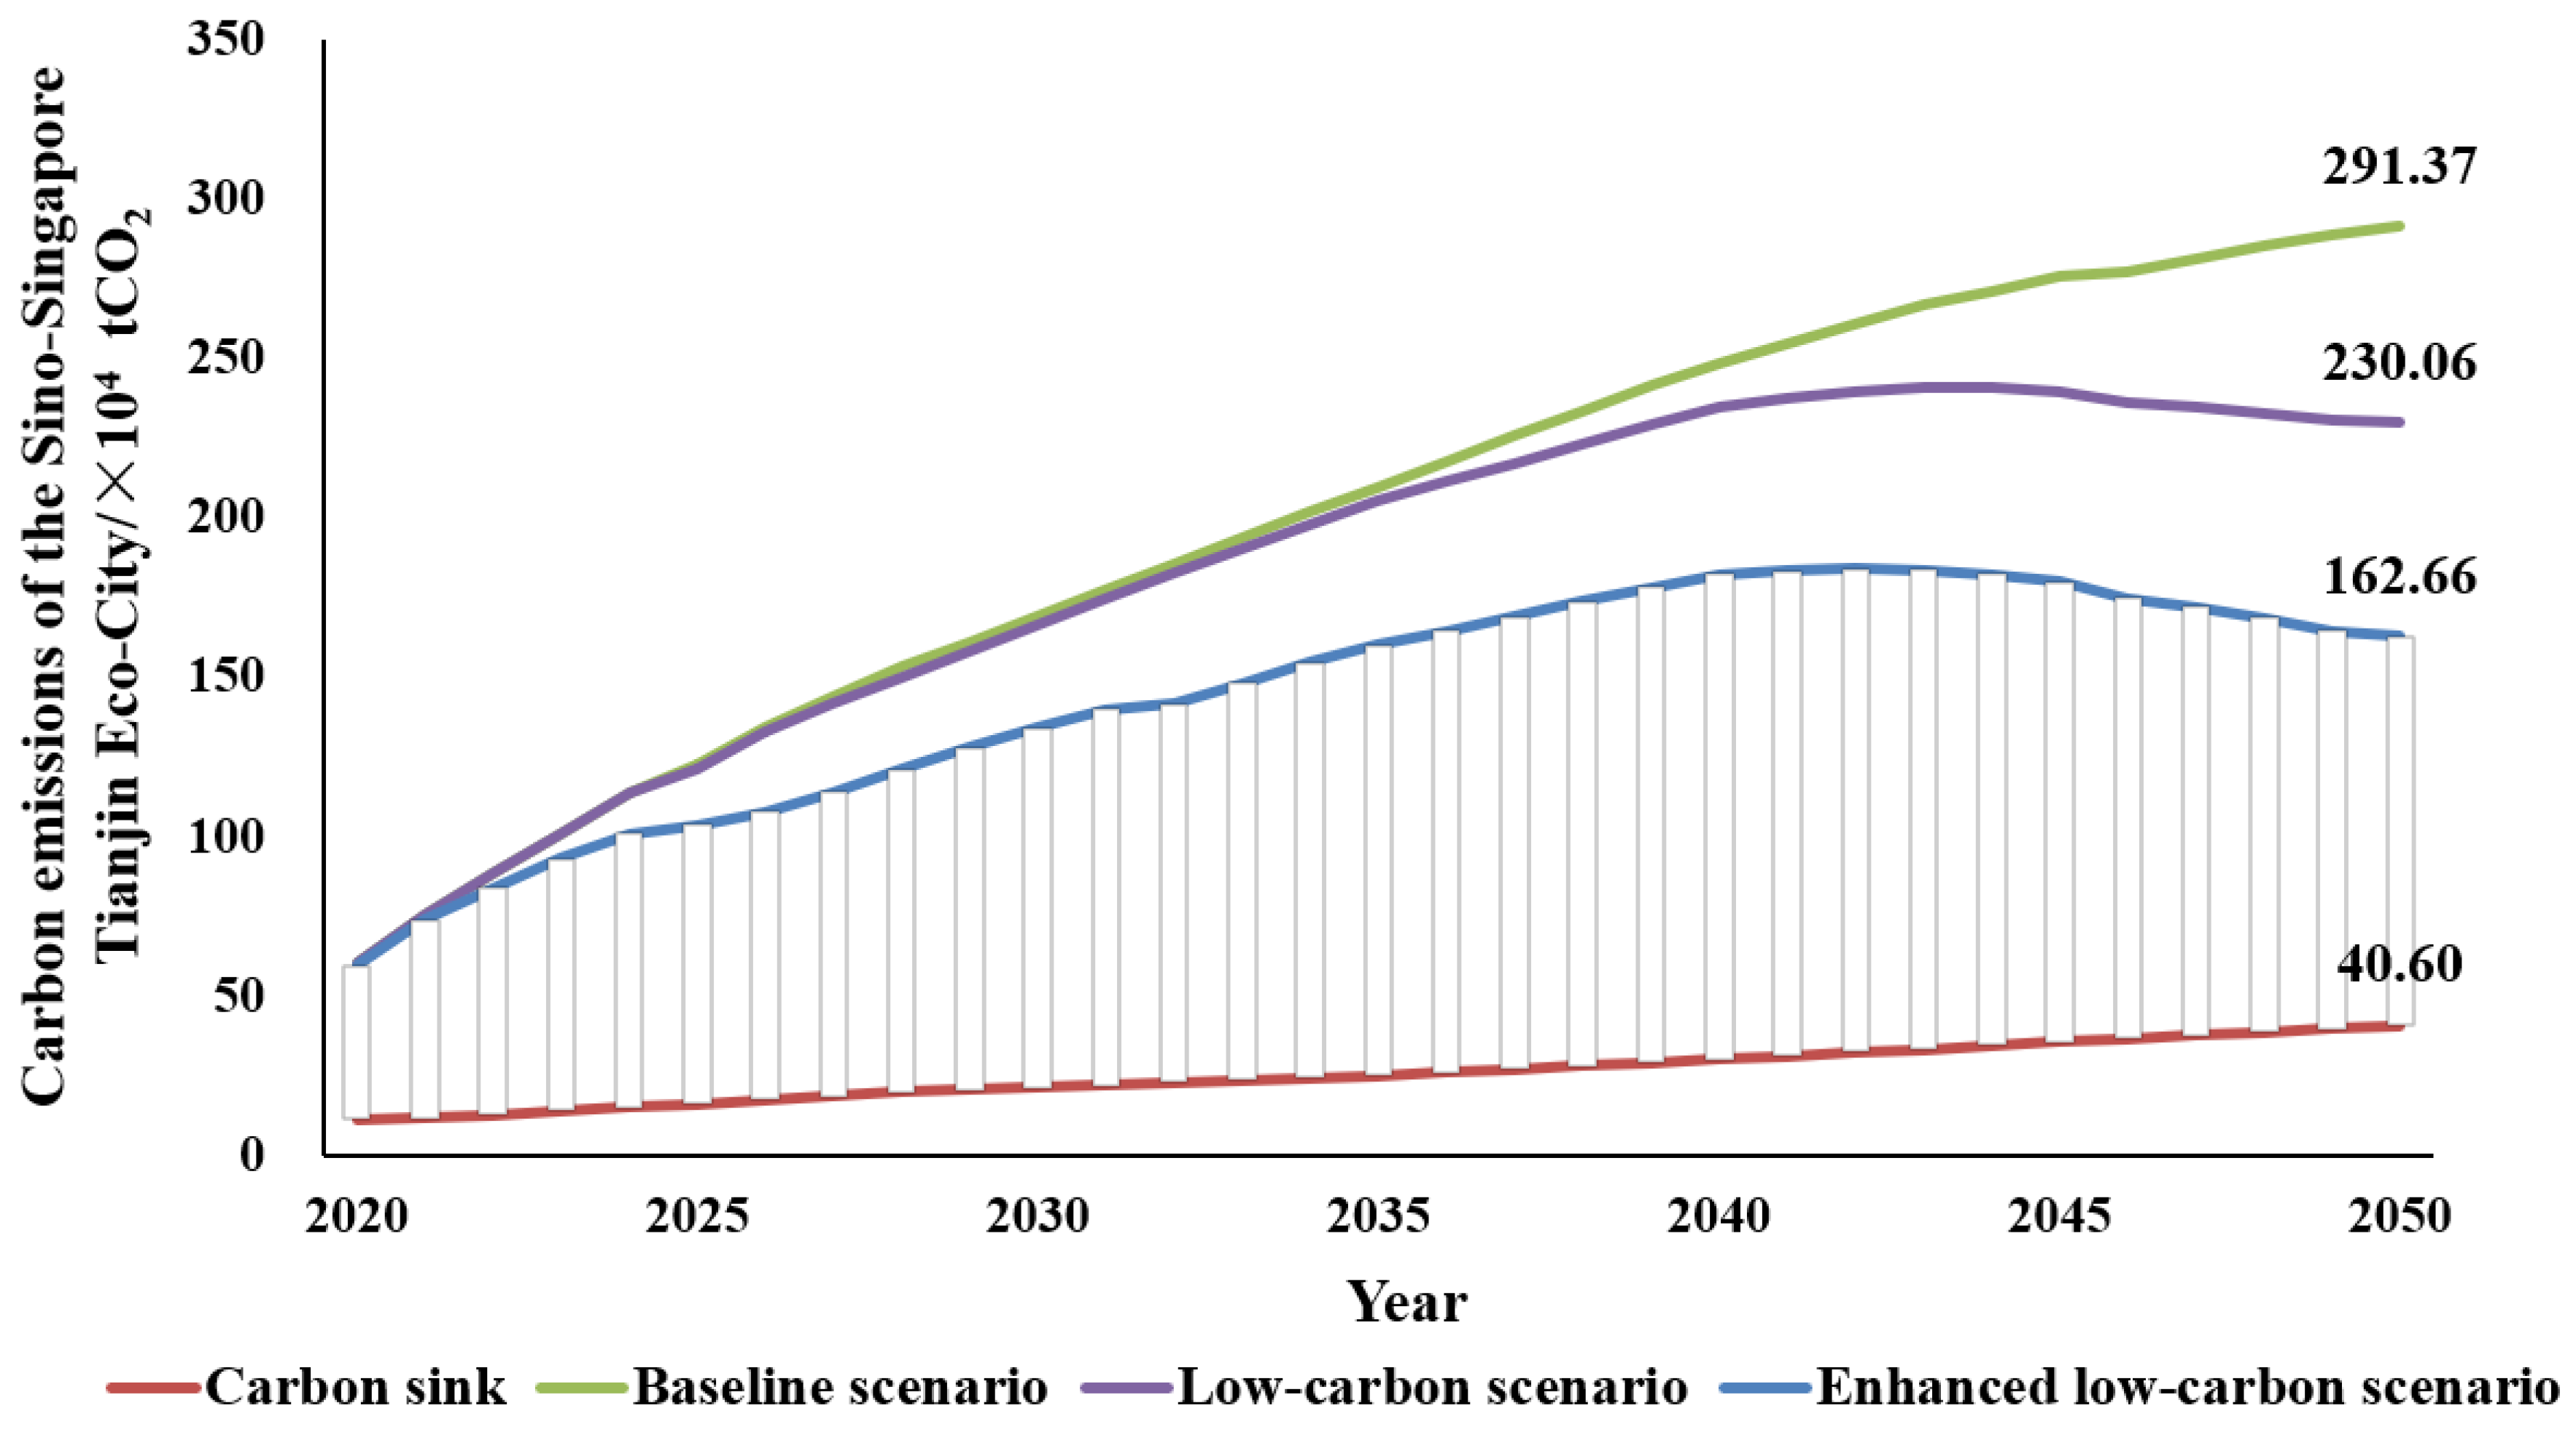
Green space is the only system in the city with self-purification function and automatic regulation ability. Plants in green space absorb CO2 from the atmosphere and fix it in the vegetation and soil through photosynthesis, playing an important role in urban carbon sink. With the development and construction of eco-city land, green space is gradually expanded. The performance of eco-city green space and its carbon sink is shown in Table 3. By 2050, the carbon sink of eco-city will be about 40.6 × 10⁴ tCO2.

3.2.4. Carbon Emission Prediction for Enhanced Low-Carbon Scenario

The total carbon emissions and sinks of the Sino-Singapore Tianjin Eco-City are shown in Figure 10. Under the baseline scenario, the Eco-City peaks at 2.914 million tCO2 in 2050. Under the low-carbon scenario, the Eco-City will peak at 2.408 million tCO2 in 2043 and reduce its carbon emissions to 2.301 million tCO2 by 2050, a decrease of 0.613 million tCO2 compared with the baseline scenario. Under the low-carbon scenario, the Eco-City’s carbon emissions have been reduced, but there is still a big gap between the Sino-Singapore Tianjin Eco-City’s carbon neutrality target by 2050.
The enhanced low-carbon scenario is expected to increase the application of municipal renewable energy projects substantially, strengthen the adjustment of energy use structure, and further reduce the carbon emission factors of power and heat. By 2050, carbon emissions will only be 1.627 million tCO2, of which 1.442 million tCO2 will be emitted in buildings, 0.781 million tCO2 in industry, 0.078 million tCO2 in transportation, and 0.674 million tCO2 in renewable energy. Further deducting the carbon sink reduction of 0.406 million tCO2, under the enhanced low-carbon scenario, there is only a carbon emission gap of 1.221 million tCO2 from achieving the carbon neutrality target in 2050.
In order to achieve the Eco-City’s carbon neutrality by 2050, corresponding measures still need to be implemented to further improve the application level of renewable energy. Therefore, under the enhanced low-carbon scenario, we can further learn from the advanced experience and practices of carbon emission trading, establish an emission trading mechanism in the Eco-City, and participate in the carbon emission trading market. At the same time, in terms of cross-regional renewable energy utilization, we will optimize and increase the scale of external green power transfer, increase the degree of purchased green electricity, promote the proportion of green power traded across provinces year by year, and promote the steady realization of the Eco-City’s carbon neutrality goal.

3.3. Evaluation of Renewable Energy Planning

The initial investment of the underground pipe ground source heat pump system in Tianjin is 350~450 CNY/m2, the average direct operating cost of heating in winter is 23.04 CNY/m2, and the average direct operating cost in summer is 13.4 CNY/m2 [38]. The investment cost of photovoltaic power generation is about 4 CNY/W. Green electricity costs about 0.55 CNY/kWh. According to the statistics, the energy demand and renewable energy investment of the Sino-Singapore Tianjin Eco-City in the three scenarios are shown in Table 4.
In the enhanced low-carbon scenario, it is estimated that by 2050, renewable energy consumption will reach about 5.8~6 billion kWh, an increase of about 5.6~5.8 billion kWh compared with the current renewable energy consumption. Green power consumption will reach 3.9~4.2 billion kWh, including 766 million kWh of self-produced green electricity in the Eco-City and 3.2~3.5 billion kWh of green electricity consumption in large power grid. Green thermal consumption will reach 1.687 billion kWh, including 1.515 billion kWh for heating and 87 million kWh for domestic hot water. It can save about 723,000 tons of standard coal and 1.287 million tons of CO2 every year. It is planned that, by 2050, renewable energy can provide heating of about 60 million m2 per year and generate 766 million kWh/a of electricity, with good environmental and economic benefits.
In the process of replacing traditional energy with renewable energy, technical input will lead to additional expenditure, but the use of renewable energy is conducive to reducing carbon emissions and reducing environmental governance costs. For example, in Tianjin, the available resources of shallow geothermal energy in rock and soil below the surface (within 200 m) and underground water (up to 400 m shallow, with a temperature below 25 °C) are 1748 trillion kilojoules, with a heating area of 1.34 billion square meters in winter and a cooling area of 1.26 billion square meters in summer. The development and utilization of shallow geothermal energy resources, after deducting the energy consumption caused by mining, can save 44.8 million tons of standard coal every year, reduce the emission of carbon dioxide, sulfur dioxide, nitrogen oxides, coal ash and other pollutants into the atmosphere 117 million tons, and reduce environmental treatment costs by CNY1.532 billion. In addition, the local government has issued a series of incentive policies to encourage the application and promotion of low-carbon technologies. For example, Tianjin Binhai New Area Green Building and passive Building Incentive Measures (Trial) states that green building projects and passive building projects will be rewarded, as 2~9% of the ground floor area will not be included in the project plot ratio [39].
Nowadays, heat pump technology, solar thermal technology, rooftop photovoltaic technology, green electricity technology, municipal photovoltaic technology and wind power technology are mature in China. After planning, the Sino-Singapore Tianjin Eco-City gives full play to the local resource advantages. Through rational allocation of renewable energy, the Sino-Singapore Tianjin Eco-City will significantly improve the energy utilization efficiency, optimize the energy consumption structure, realize energy conservation and carbon emission reduction, and lay a good energy foundation for the Sino-Singapore Tianjin Eco-City to achieve the goal of carbon neutrality.

4. Discussion

Based on the analysis of available resources and the prediction of energy consumption in the Sino-Singapore Tianjin Eco-City, and combined with the applicable conditions of various energy utilization technologies, a preliminary green energy planning scheme is formulated in this paper. It is calculated that the Singapore-Singapore Tianjin Eco-City can save about 0.723 million tons of standard coal and reduce 1.287 million tons of carbon dioxide by using renewable energy every year. It shows that the development and utilization of local renewable resources is an effective means to reduce energy consumption in urban areas. Meanwhile, the following thoughts and suggestions can be summarized for urban renewable energy planning.

4.1. Demand-Oriented Renewable Energy Planning

Energy planning in the new era has changed [23,40,41,42]: it is no longer used simply to increase the supply of resources to meet the growing demand, but to improve the utilization rate of resources so as to save resources as an alternative resource. Demand-oriented urban renewable energy planning is conducive to the transformation of supply into total energy consumption control and supply side management into demand-side management (Table 5).

4.2. Promote the Development and Utilization of Solar Energy Resources

Make full use of the roof space of the building and other external surfaces that can receive solar radiation to install photovoltaic cells, through the form of distributed photovoltaic power generation, to solve the problem of insufficient space resources in the large-scale development of photovoltaic. Accelerate the development and construction of distributed photovoltaic on the roofs of public buildings and industrial buildings, adhere to the principle of “construction should be done as much as possible and application should be done as much as possible” under the premise of protecting the ecological environment, and accelerate the construction of a new green power support system featuring municipal photovoltaic based on key fields such as infrastructure and municipal green space [43].

4.3. Develop Renewable Energy for Heating

Vigorously promote the shallow ground source heat pump for heating and cooling, and integrate with the conventional energy heating system. Encourage the preferential use of shallow geothermal energy in new low-density residential buildings, kindergartens, commercial buildings, recreational buildings, office buildings, hospital buildings, municipal yards and industrial buildings. It is encouraged to embed the buried pipe before the development to create the application conditions of the ground source heat pump. Strengthen the promotion of the application of air source heat pump in new buildings, highlighting the complementary role of air source heat pump to other restrictive renewable energy. In addition, urban sewage treatment plants should be coordinated to supply energy to the surrounding land using sewage sources.

4.4. Innovative Development of Other Renewable Energy Sources

Actively develop and utilize other renewable energy sources, such as wind power, sewage water source heat pump, sea water source heat pump, hydrogen energy, energy storage and energy Internet, light storage, direct and flexible renewable energy regional micro-grid, etc. [44]. For urban areas with insufficient resources, a variety of renewable energy sources can be used for complementary energy supply.

5. Conclusions

5.1. Contribution and Significance

Taking the Sino-Singapore Tianjin Eco-City Renewable Energy Planning Project as an example, measures such as promoting energy-efficient buildings, improving equipment energy efficiency, increasing the utilization rate of renewable energy, and increasing greening and carbon sequestration can effectively reduce carbon emissions in urban areas. Among them, the enhanced low-carbon scenario can reduce carbon emissions by 1.287 million tons compared with the baseline scenario, a reduction ratio of about 44.17%.
With the increasing frequency of extreme weather, both the government and people should pay more attention to environmental protection. Replacing traditional energy with renewable energy is conducive to technological innovation, economic growth and carbon emission reduction. This paper proposes a carbon constraint-oriented urban renewable energy planning method. Firstly, the current situation of energy consumption and carbon emissions in urban areas is reasonably evaluated, and on this basis, low-carbon development scenarios of different intensities are set in combination with existing policies and plans, so as to predict future carbon emission trends and carbon emissions. Subsequently, the appropriate low-carbon scenario is selected and a renewable energy promotion plan for that scenario is developed. Finally, net carbon emissions are accounted for and renewable energy planning is adjusted accordingly. In addition to following the general renewable energy planning ideas of structural optimization and adaptation to local conditions, this method is combined with specific carbon targets and carbon emission reductions, which is conducive to achieving a win–win situation between renewable energy planning and environmental benefits.

5.2. Deficiency and Prospect

This study is supported by the Sino-Singapore Tianjin Eco-City Renewable Energy Planning Project, which has been underway since 2021 and completed in 2023. The plan has passed an expert review organized by the local government and will provide a basis for the government to formulate a series of renewable energy development plans and policies. At present, it has not been applied in engineering practice, and the planning effect needs to be verified. It is recommended to follow up with the project, and periodically check the effect of renewable energy applications every 5 years.
In addition, with the continuous improvement of science and technology, there may be more efficient and economical renewable energy technologies, such as carbon storage– utilization technology, hydrogen technology. Policies related to renewable energy planning need to be constantly adjusted.

Author Contributions

Conceptualization, Q.W.; methodology, Q.W. and X.S.; validation, Y.D. and H.Z.; investigation, Q.Z. and L.Z.; formal analysis, L.Z.; writing—original draft preparation, Y.L. and R.W.; writing—review and editing, R.W. and L.Z.; project administration, H.Z. All authors have read and agreed to the published version of the manuscript.

Funding

This research is supported by the National Key R&D plan Joint Research and Demonstration for “Carbon Reduction Key Technologies in Urban Areas and Neighborhoods” (NO. 2022YFE0208700) and the Research Fund of China Academy of Building Research Co., Ltd. for “Urban Low Carbon, Carbon Neutral Planning and Design Technology Research and Engineering Demonstration” (NO. 20221201330730001).

Institutional Review Board Statement

Not applicable.

Informed Consent Statement

Not applicable.

Data Availability Statement

The data that support the findings of this study are available from the corresponding author.

Acknowledgments

The authors are grateful for the support from the Sino-Singapore Tianjin Eco-City Administrative Committee, China.

Conflicts of Interest

The authors declare that they have no known competing financial interest or personal relationship that could have appeared to influence the work reported in this paper.

References

  1. Perkins, J.H. The Dilemmas of Energy: Essential energy services and potentially fatal risks. IOP Conf. Ser. Earth Environ. Sci. 2018, 107, 012087. [Google Scholar] [CrossRef]
  2. Lee, J.; Park, J.; Jung, H.-J.; Park, J. Renewable Energy Potential by the Application of a Building Integrated Photovoltaic and Wind Turbine System in Global Urban Areas. Energies 2017, 10, 2158. [Google Scholar] [CrossRef]
  3. Hernandez-Escobedo, Q. Wind Energy Assessment for Small Urban Communities in the Baja California Peninsula, Mexico. Energies 2016, 9, 805. [Google Scholar] [CrossRef]
  4. Perea-Moreno, A.-J.; García-Cruz, A.; Novas, N.; Manzano-Agugliaro, F. Rooftop analysis for solar flat plate collector assessment to achieving sustainability energy. J. Clean. Prod. 2017, 148, 545–554. [Google Scholar] [CrossRef]
  5. National Bureau of Statistics of China. China Statistical Yearbook; China Statistical Publishing House: Beijing, China, 2022. (In Chinese)
  6. Perea-Moreno, A.-J.; Aguilera-Ureña, M.-J.; Manzano-Agugliaro, F. Fuel properties of avocado stone. Fuel 2016, 186, 358–364. [Google Scholar] [CrossRef]
  7. Icaza, D.; Borge-Diez, D.; Galindo, S.P. Proposal of 100% renewable energy production for the City of Cuenca—Ecuador by 2050. Renew. Energy 2021, 170, 1324–1341. [Google Scholar] [CrossRef]
  8. Deakin, M.; Reid, A. Smart cities: Under-gridding the sustainability of city-districts as energy efficient-low carbon zones. J. Clean. Prod. 2018, 173, 39–48. [Google Scholar] [CrossRef]
  9. Timilsina, G.R.; Shrestha, A. Transport sector CO2 emissions growth in Asia: Underlying factors and policy options. Energy Policy 2009, 37, 4523–4539. [Google Scholar] [CrossRef]
  10. Zhang, J.; Xie, Y.; Luan, B.; Chen, X. Urban macro-level impact factors on Direct CO2 Emissions of urban residents in China. Energy Build. 2015, 107, 131–143. [Google Scholar] [CrossRef]
  11. Wang, H.; Zeng, W. Revealing urban carbon dioxide (CO2) emission characteristics and influencing mechanisms from the perspective of commuting. Sustainability 2019, 11, 385. [Google Scholar] [CrossRef]
  12. Yu, J.; Da, Y.; Ou, Y. Spatio-temporal difference of transportation greenhouse gas emissions and its influencing factors in China. China J. Highw. Transp. 2015, 28, 112–119. [Google Scholar]
  13. Posso, F.; Espinoza, J.L.; Sánchez, J.; Zalamea, J. Hydrogen from hydropower in Ecuador: Use and impacts in the transport sector. Int. J. Hydrogen Energy 2015, 40, 15432–15447. [Google Scholar] [CrossRef]
  14. Karin, R. Hannover Kronsberg Handbook; Stadt Hannover: Hannover, Germany, 2001. [Google Scholar]
  15. Feng, H.; Wang, R.; Zhang, H. Research on Carbon Emission Characteristics of Rural Buildings Based on LMDI-LEAP Model. Energies 2022, 15, 9269. [Google Scholar] [CrossRef]
  16. Fang, G.; Wang, C.; Zhang, S. Cluster analysis of greenhouse gas emissions peaking trends in Chinese cities. China Envion. Manag. 2021, 13, 40–48. [Google Scholar]
  17. Dong, Y.; Zhong, H.; Lu, Z.; Xu, B.; Zou, S. Cluster analysis of prefecture-level cities in Gansu Province for low carbon transformation. J. Desert. Res. 2020, 40, 25–31. [Google Scholar]
  18. Bin, Z.; Yao, N.; Liu, X. Preliminary fuzzy clustering analysis on greenhouse gas emissions in Different Province of China. China Popul. Resour. Environ. 2011, 21, 53–56. [Google Scholar]
  19. Saldivar-Sali, A.N.D. A Global Typology of Cities: Classification Tree Analysis of Urban Resource Consumption; Massachusetts Institute of Technology: Cambridge, MA, USA, 2010. [Google Scholar]
  20. Hu, Y.; Peng, L.; Li, X.; Yao, X.; Lin, H.; Chi, T. A novel evolution tree for analyzing the global energy consumption structure. Energy 2018, 147, 1177–1187. [Google Scholar] [CrossRef]
  21. Creutzig, F.; Baiocchi, G.; Bierkandt, R.; Pichler, P.-P.; Seto, K.C. Global typology of urban energy use and potentials for an urbanization mitigation wedge. Proc. Natl. Acad. Sci. USA 2015, 112, 6283–6288. [Google Scholar] [CrossRef]
  22. GB/T 51255-2017; Ministry of Housing and Urban-Rural Development of the People’s Republic of China. Assessment Standard for Green Eco-District. China Architecture & Building Press: Beijing, China, 2018. (In Chinese)
  23. Elliston, B.; MacGill, I.; Diesendorf, M. Comparing least cost scenarios for 100% renewable electricity with low emission fossil fuel scenarios in the Australian National Electricity Market. Renew. Energy 2014, 66, 196–204. [Google Scholar] [CrossRef]
  24. Glasnovic, Z.; Margeta, J. Vision of total renewable electricity scenario. Renew. Sustain. Energy Rev. 2011, 15, 1873–1884. [Google Scholar] [CrossRef]
  25. Spiecker, S.; Weber, C. The future of the European electricity system and the impact of fluctuating renewable energy e a scenario analysis. Energy Pol. 2014, 65, 185–197. [Google Scholar] [CrossRef]
  26. Mathiesen, B.V.; Lund, H.; Connolly, D.; Wenzel, H.; Østergaard, P.A.; Möller, B.; Nielsen, S.; Ridjan, I.; Karnøe, P.; Sperling, K.; et al. Smart Energy Systems for coherent 100% renewable energy and transport solutions. Appl. Energy 2015, 145, 139–154. [Google Scholar] [CrossRef]
  27. Calle, P.A.; Fajardo, N.M.A.; Reinoso, A.C.A. Polucion Atmosferica por Automotores y Enfermedad Respiratoria. Bachelor’s Thesis, Universidad de Cuenca, Cuenca, Ecuador, 1998. [Google Scholar]
  28. Borja, M.O.; Aragon-Osejo, J.; Josse, C. EJE 02-04 Contaminacion por ruido en centros urbanos. Mem. Univ. Azuay 2017, XVI, 77–80. [Google Scholar]
  29. Sun, X.; Song, K. Exploration and Practice of Green Building Management in Sino-Singapore Tianjin Eco-City. China City Plan. Rev. 2016, 25, 50–57. [Google Scholar]
  30. Tianjin Municipal Burcau of Statistics & Survey Office of the National Bureau of Statistics in Tianjin. Tianjin Statistical Yearbook; China Statistical Publishing House: Beijing, China, 2022. (In Chinese)
  31. He, K.; Huo, H.; Zhang, Q.; He, D.; An, F.; Wang, M.; Walsh, M.P. Oil consumption and CO2 emissions in China’s road transport: Current status, future trendsand policy implications. Energy Policy 2005, 33, 1499–1507. [Google Scholar] [CrossRef]
  32. Huo, H.; Zhang, Q.; Wang, M.Q.; Streets, D.G.; He, K. Environmental Implication of Electric Vehicles in China. Environ. Sci. Technol. 2010, 44, 4856–4861. [Google Scholar] [CrossRef]
  33. Li, L.; Chen, C.; Xie, S.; Huang, C.; Cheng, Z.; Wang, H.; Wang, Y.; Huang, H.; Lu, J.; Dhakal, S. Energy demand and carbon emissions under different development scenarios for Shanghai, China. Energy Policy 2010, 38, 4797–4807. [Google Scholar] [CrossRef]
  34. IPCC. Revised 1996 IPCC Guidelines for National Greenhouse Gas Inventories. In Intergovernmental Panel on Climate Change; IPCC: London, UK, 1996. [Google Scholar]
  35. Bao, L.; Zhang, H. Study on influencing factors of construction industry carbon emissions in Jiangsu Province based on LMDI model. Environ. Sci. Technol. 2021, 44, 202–212. [Google Scholar]
  36. Department of Energy Statistics. National Bureau of Statistics. China Energy Statistical Yearbook 2020; China Statistics Press: Beijing, China, 2021. (In Chinese)
  37. Niu, L.; Pan, M.; Zhou, Y. Evaluation method for urban renewable energy tilization efficiency based on DEA model. Int. J. Glob. Energy Issues 2020, 42, 127–143. [Google Scholar] [CrossRef]
  38. Tianjin Municipal Bureau of Planning and Natural Resources. Tianjin Land Resources and Housing Administration on the Answer to the 5th Session of the 13th CPPCC Proposal No. 0173. Available online: https://ghhzrzy.tj.gov.cn/zwgk_143/jyta/zxtabljggk/202012/t20201205_4485057.html (accessed on 14 November 2017).
  39. The People’s Government of Tianjin Binhai New Area. Notice on Expanding the Scope of Pilot Implementation of the “Tianjin Binhai New Area Green Building and Passive Building Incentive Measures (Trial)”. Available online: https://zjw.tjbh.gov.cn/contents/9782/269564.html (accessed on 21 December 2021).
  40. Gutiérrez, R.; Marlene, E.; Iddar, I.P.; Jarrin, M.E. Política económica de la Unión Europea en la disminución del consumo de hidrocarburos desde el 2020. Rev. Univ. Soc. 2019, 11, 15–30. [Google Scholar]
  41. Wang, M.; Li, T.; Yuan, C.; Tian, H.; Tian, S. Research on vehicle renewable energy use in cities with different carbon emission characteristics. Energy Rep. 2022, 8, 343–352. [Google Scholar] [CrossRef]
  42. Kellogg, W.D.; Nehrir, M.H. Generation unit sizing and cost analysis for stand-alone wind, photovoltaic, and hybrid wind/PV systems. IEEE Trans. Energy Convers 1998, 13, 70–75. [Google Scholar] [CrossRef]
  43. Curreli, A.; Serra-Coch, G.; Isalgue, A.; Crespo, I.; Coch, H. Solar Energy as a Form Giver for Future Cities. Energies 2016, 9, 544. [Google Scholar] [CrossRef]
  44. Miguel-Angel, P.; Quetzalcoatl, H.; Alberto-Jesus, P. Renewable Energy in Urban Areas: Worldwide Research Trends. Energies 2018, 11, 577. [Google Scholar]
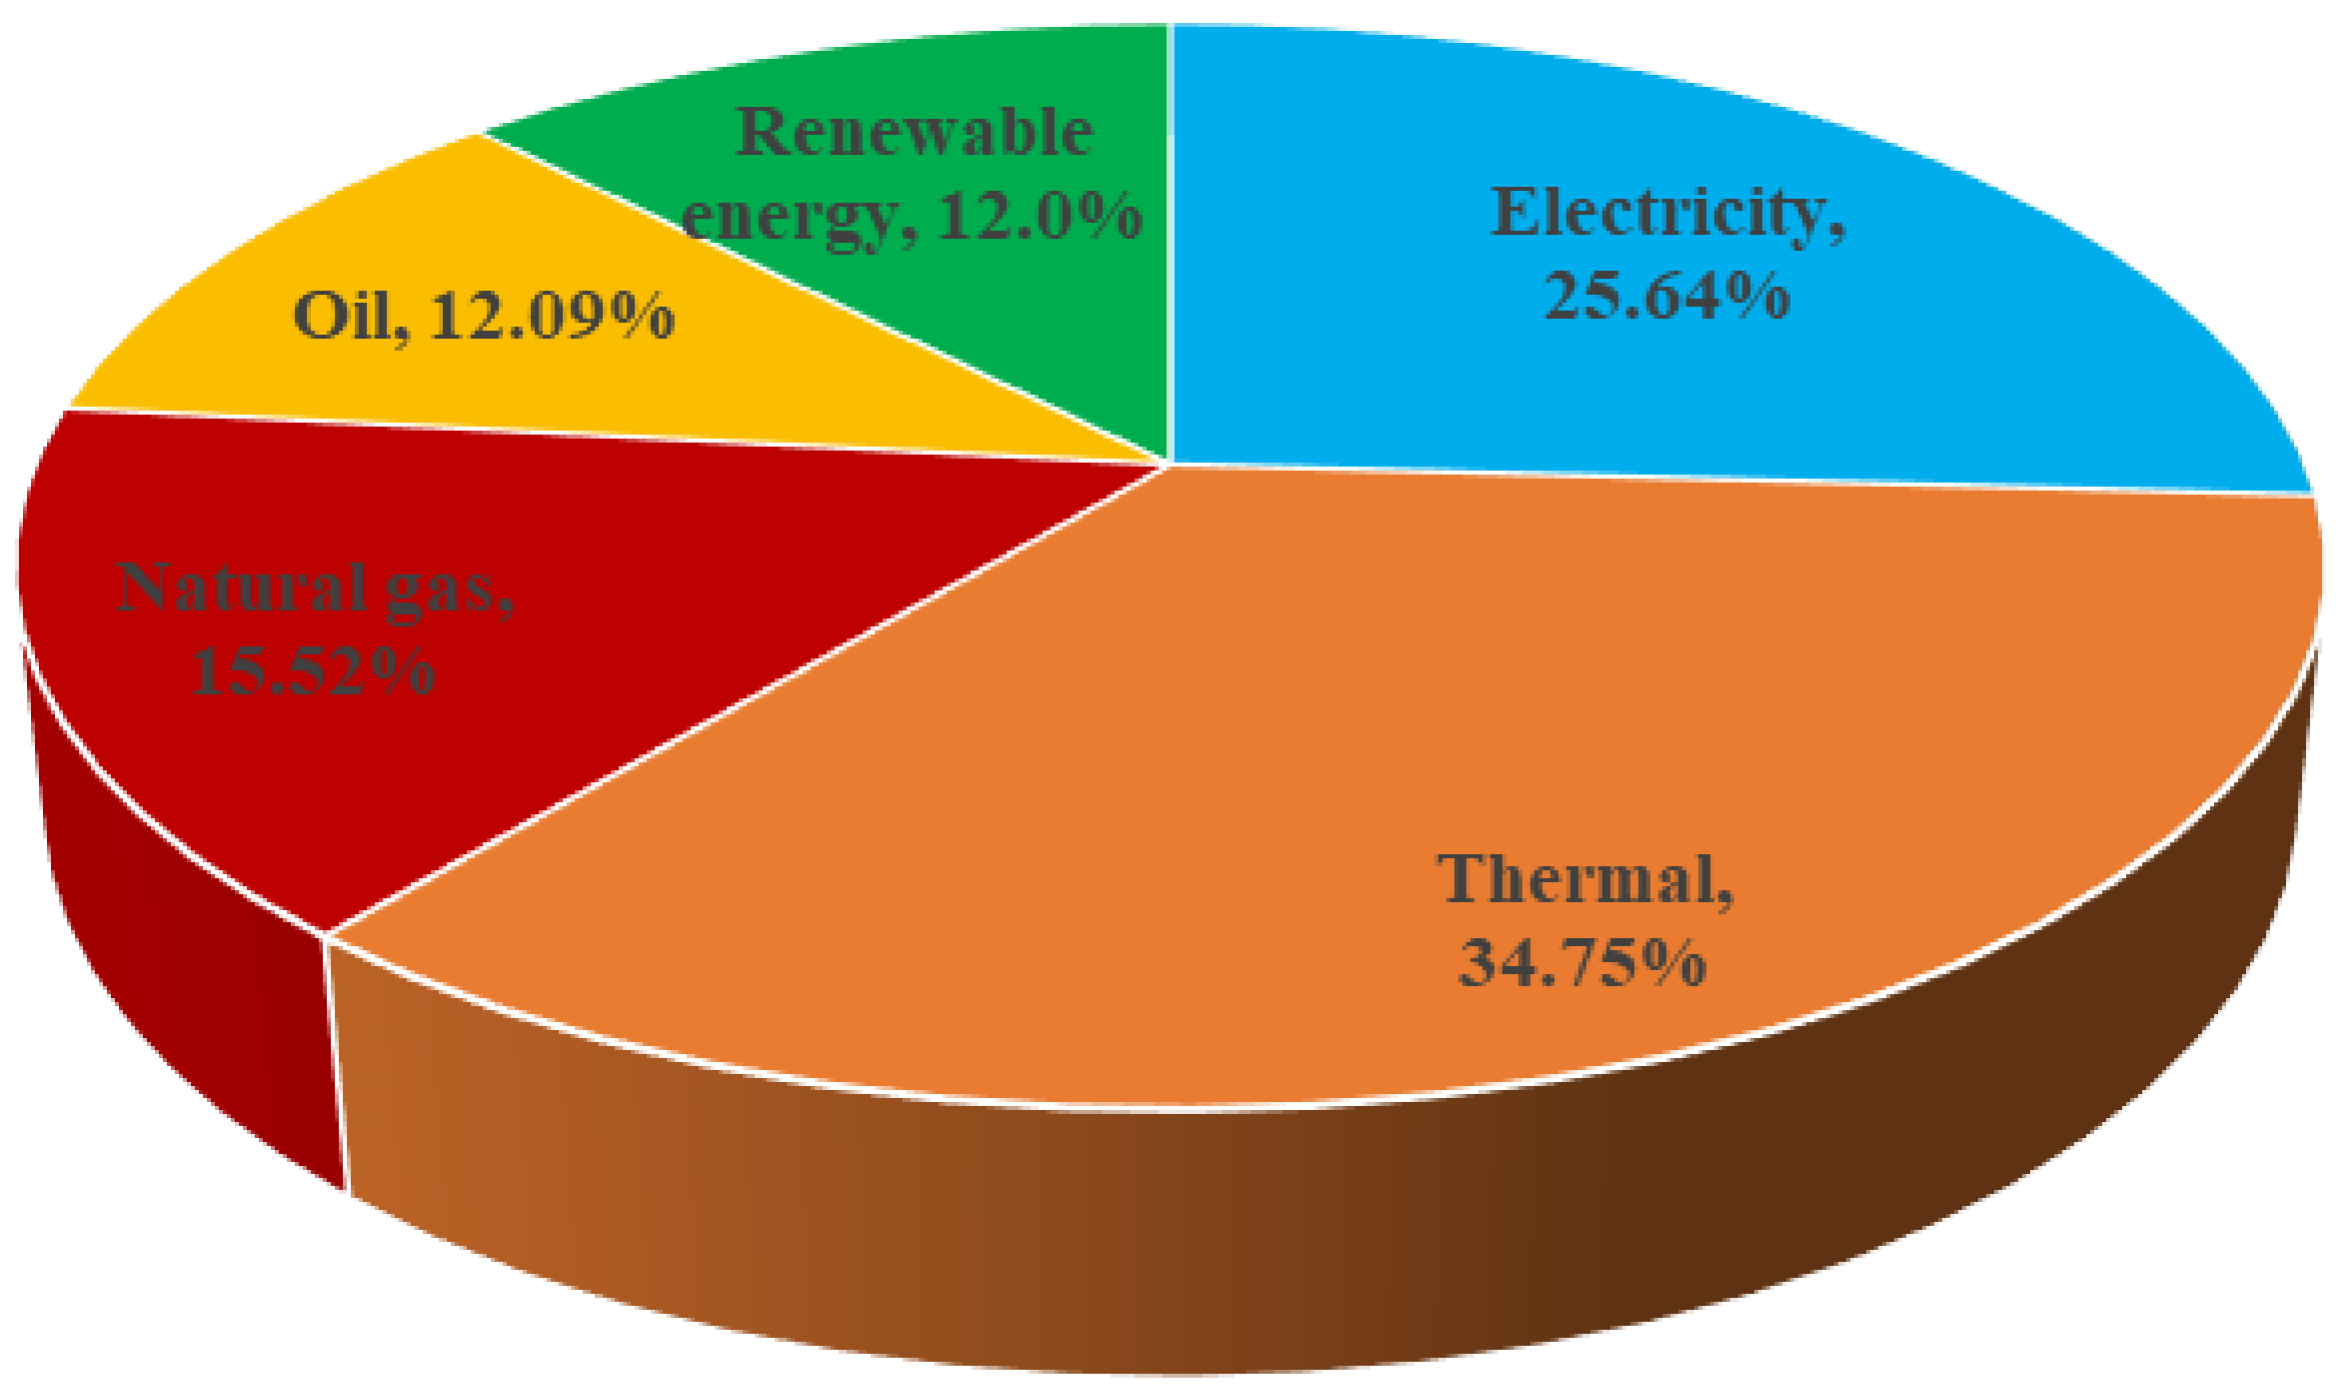
Figure 1. Energy consumption of Sino-Singapore Tianjin Eco-City in 2021.
Sustainability 15 14206 g001
Figure 2. Carbon emission prediction of Sino-Singapore Tianjin Eco-City under baseline scenario.
Sustainability 15 14206 g002
Figure 3. The proportion of carbon emissions from energy consumption under baseline scenario.
Sustainability 15 14206 g003
Figure 4. Carbon emission prediction of Sino-Singapore Tianjin Eco-City under low-carbon scenario.
Sustainability 15 14206 g004
Figure 5. The proportion of carbon emissions from energy consumption under low-carbon scenario.
Sustainability 15 14206 g005
Figure 6. Planning of energy-efficient buildings in Sino-Singapore Tianjin Eco-City.
Sustainability 15 14206 g006
Figure 7. Forecast of renewable energy in Sino-Singapore Tianjin Eco-City.
Sustainability 15 14206 g007
Figure 8. Renewable energy planning for Sino-Singapore Tianjin Eco-City.
Sustainability 15 14206 g008
Figure 9. Prediction of the utilization rate of renewable energy in Sino-Singapore Tianjin Eco-City.
Sustainability 15 14206 g009
Figure 10. Carbon emission prediction of Sino-Singapore Tianjin Eco-City.
Sustainability 15 14206 g010
Table 1. Energy consumption of Sino-Singapore Tianjin Eco-City in 2020.
Carbon Emission SourceCoal
×108 kWh/a
Power
×107 kWh/a
Gas
×105 Nm3/a
Oil
×106 L/a
BuildingResidence4.6719.9144.40/
Business10.4518.51/
Office0.680.08/
Education0.871.66/
Public facilities0.84//
Hospital0.48//
IndustryM10.8010.10//
M20.076.80//
TrafficSanitation truck/0.040.13/
Taxi/0.4414.602.56
Electric bicycle/8.69//
Car/2.30/12.26
Bus/0.3310.91/
Table 2. List of emission factors.
Type of EnergyEmission FactorUnitData Source
Electricity0.8733kgCO2/kWhAverage carbon emission factor of Tianjin power grid, which was consulted from local authorities.
gasoline2.9267tCO2/tIPCC Guidelines for national greenhouse gas emission inventories [34].
Diesel oil3.0938tCO2/tIPCC Guidelines for national greenhouse gas emission inventories [34].
Natural gas21.6072tCO2/104m3IPCC Guidelines for national greenhouse gas emission inventories [34].
Heat3.96 × 10−4tCO2/kWhChina energy statistical yearbook 2021 [36].
greenbelt2.71kg CO2/m2Average carbon sink factor per unit green area in North China [35].
Table 3. Prediction of carbon sink in the Sino-Singapore Tianjin Eco-City.
Type2021202820352050
Ratio of green space/%11.319.624.840.6
Green area/km211.4119.8325.0740.84
Carbon sink/tCO211.319.624.840.6
Table 4. Comparison of renewable energy planning schemes in different scenarios (2050).
TypeEnergy ConsumptionCarbon Emission
×104 tCO2
Greed Space
km2
Leading TechnologyInvestment Budget
×108 CNY
Traditional EnergyRenewable EnergyTotal
×108 kWh/a
Baseline scenario88%12%89.66291.3740.841. Solar thermal energy
2. Rooftop photovoltaics
6.24
Low-carbon scenario74%26%77.33230.0640.841.Heat pump
2. Solar thermal energy
3. Rooftop photovoltaics
13.54
Enhanced low-carbon scenario23%77%77.33162.6640.841.Heat pump
2. Solar thermal energy
3. Rooftop photovoltaics
4. Green electricity
5. Municipal photovoltaic
6. Wind power
40.08
Table 5. Comparison of supply side and demand-side energy planning.
Supply Side Energy PlanningDemand-Side Energy Planning
Technical routeConsumption of high-temperature, high-pressure and high-grade energy.Emphasize the step use of energy. Low-temperature, low-pressure and low-grade energy.
It is dominated by fossil energy.Multi-source coupled system.
Centralized system.Energy networking.
Meet the needs of the industrial era. Meet the needs of the post-industrial era.
Steady load.Variable load.
Centralized production capacity. Distributed capacity.
Remote transmission.Nearby transportation.
One-way supply.Two-way supply.
methodologyLoad forecasting: focus on peak load forecasting under extreme energy use.Load forecasting: focus on user energy reduction forecasting.
Use energy extensively, intensively and uniformly.Use energy delicately, scatteringly, individualistically.
Centralized operation.Flexible operation.
The system runs under low load for a long time.The system runs under high load for a long time.
Electricity is uniformly distributed by the grid.Electricity is self-used, and excess electricity is incorporated into the grid or used for cooling and heating systems.
Disclaimer/Publisher’s Note: The statements, opinions and data contained in all publications are solely those of the individual author(s) and contributor(s) and not of MDPI and/or the editor(s). MDPI and/or the editor(s) disclaim responsibility for any injury to people or property resulting from any ideas, methods, instructions or products referred to in the content.