1. Introduction
Pivotal in the modern economic framework, the banking sector operates as a crucial conduit for financial activity and growth. Beyond the conventional roles of capital distribution and credit facilitation, banks hold a foundational position in preserving financial stability and fostering trust within the larger financial system. Yet, their significance extends beyond these economic functions—they bear the responsibility of safeguarding the financial welfare of individuals, businesses, and communities. This entrusted role as guardians of public funds underscores the severe repercussions that a banking system failure can elicit, potentially setting off a chain reaction of economic disruptions that reverberate through both financial markets and real-world economic activities. In recent years, there has been a significant rise in the academic interest centered around sustainable development within the banking system. This heightened focus is evident through the increasing volume of publications in this field [
1,
2]. In addition, throughout history, both the financial and real markets have witnessed the emergence of bubbles [
3,
4,
5,
6,
7]. Such bubbles eventually burst, leading to a rapid and sharp decline in asset prices, often resulting in financial losses for those who invested at the peak of the bubble. These events also can trigger a widespread and severe disruption to the entire financial system or economy.
Against this backdrop, this study embarks on an exploration of the systemically important banks within the Turkish banking system and their consequential impact on sustainable economic growth. With a dual objective, the study aims to pinpoint and analyze these banks wielding systemic importance within the Turkish banking system, while also deciphering the intricate interplay between their influence and the trajectory of sustainable economic growth. In doing so, this study aims to contribute to a holistic understanding of these banks’ pivotal role in shaping the financial landscape and their contribution to Turkey’s long-term economic prosperity.
The significance of the banking sector and its impact on sustainable economic development has garnered renewed attention in 2023. The persistence of systemic crises in 2023, following the events of the 2008 crisis, highlights the following concerning reality: there remains a notable gap in fully absorbing the lessons from past crises. Following the 2008 global financial crisis, the failure of three American banks in March 2023, then their effect on the First Republic Bank and other regional banks of this wave, and the troubles of Credit Suisse, the second largest bank base of Switzerland in Europe, once again revealed the importance of financial stability and systemic risk.
In the 2008 global financial crisis, the world witnessed a very serious crisis. The crisis that started to take effect in late 2007 resulted in the bankruptcy of nearly 500 banks. A major government aid program for the financial sector was launched [
8]. One of the factors of the 2008 global financial crisis that emerged in the USA and spread rapidly to other financial institutions and countries was a huge real estate and credit bubble. In the beginning, most mortgage loans were given to people with high repayment power, but in a period when interest rates were low these loans began to be extended to people with weak repayment capacity; however, when FED increased interest rates, these borrowers with weak solvency began to have problems repaying their mortgage loans. The conversion of mortgage loans into derivative instruments through securitization and the financial institutions’ investment in these products without paying attention to risk management has further increased the extent of the crisis. The buying and selling of these derivative products all over the world turned the crisis into a global crisis [
9]. Global imbalances, and the lack of an effective risk management system, financial regulations, and supervision, in addition to the large investments made by many global banks in mortgage-backed securities, are among the other factors that caused the 2008 global financial crisis [
8,
10,
11].
In March 2023, a series of bank failures occurred in the United States, starting with Silvergate Capital, which suffered losses mainly due to its investments in the cryptocurrency market and US Treasury bonds affected by the Federal Reserve’s interest rate increases. Silicon Valley Bank (SVB), heavily invested in Treasury bonds, faced a loss of
$1.8 billion, leading to a failed capital raise attempt and subsequent failure. Signature Bank, heavily involved in the cryptocurrency market and affected by the collapse of FTX, also failed. The failures triggered panic, affecting the share prices of other banks on a global scale [
12]. Financial crises, like the 2008 global financial crisis, tend to be prolonged and cause significant losses, with the full effects of these recent bank failures yet to be seen [
11,
13,
14,
15].
Both the 2008 global financial crisis and the banking failures crisis of March 2023 show that a lack of risk management is at the root of those failures, and it revealed the paramount importance of systemic risk within the financial system. This naturally led to the importance of systemic risk measurement as well. Systemic risk is a broad concept that includes all events that undermine the constancy of the local and global financial system, including macro-economic turbulences that influence all corporations simultaneously, or contagion situations where the failure of one financial corporation can extend to a substantial number of other corporations. More simply, systemic risk means the probability that turmoil originating from one financial institution will transmit to and significantly influence other financial institutions and markets [
16,
17].
Turkey has also experienced several severe banking crises throughout its history, such as the 1994 crisis and the 2000–2001 crisis. In 1994, a sharp depreciation of the Turkish lira led to a banking crisis that resulted in the collapse of many private banks. It depreciated by almost 70% against the US dollar in 1994. The government was forced to intervene and take over many of these banks. The crisis deepened when the central bank allowed the lira to float freely, causing it to lose value rapidly. Before this, a fixed exchange rate system was valid in Turkey, which was called the crawling peg regime. This created a significant problem for the banking sector, which had borrowed heavily in foreign currencies but had most of its assets in lira-denominated loans. As the value of the lira fell, many banks became insolvent [
18].
In the 1980s, economic growth was rocked by recurrent crises as a result of inadequate macroeconomic policies and financial opening in a weak institutional and regulatory environment. The fluctuating growth pattern culminated in the 2000/2001 crisis, which led to the breakage of the currency peg to the USA dollar, the sharp depreciation of the Turkish lira, and the real GDP contraction of 5.7% in 2001 [
19,
20]. After concerns about the health of the banking sector escalated rapidly, banks began closing their interbank lines of credit to vulnerable Turkish banks in November 2000. It also drove foreign investors to withdraw their funds by selling treasury bills and stocks [
21]. At the end, the crisis affected about a quarter of the 81 banks in Turkey and caused a budget loss of about 30% of GDP. Between 1999 and 2003, the Savings Deposit Insurance Fund (SDIF) took over 20 banks, eight banks closed and eleven banks merged with other banks [
6]. The government implemented a comprehensive banking reform program, which included new regulations to strengthen the sector and measures to reduce the risk of future crises, and these reforms led to five years of economic recovery in 2002–2007 [
20].
For Turkey, the significance of sustainability and the management of systemic risk within the banking sector takes on even greater importance. This is due to the substantial role that the banking sector occupies within the broader financial system of the country. According to the Banks Association of Türkiye Report, banks are the largest financial corporations in Turkey, accounting for about 82% of the total assets of the financial sector as of September 2021 [
22]; therefore, banks are the most significant players in Turkey’s financial system. There are 57 banks operating in Turkey as of 2021, including state-owned, private, and foreign banks [
22]. The main aim of the article is to investigate systemically significant banks in Turkey. The “Too Big to Fail” theory refers to the perception that certain financial institutions are so large and interconnected that their failure could have severe systemic consequences, necessitating government intervention to prevent their collapse. This theory underscores the importance of identifying and monitoring systemically significant banks, also known as systemically important financial institutions (SIFIs). The designation of SIFIs recognizes that the failure of these institutions could lead to widespread financial disruptions and pose systemic risks to the entire financial system and economy [
23]. Thus, the first hypotheses to test if there are systemically significant banks in Turkey, so we can utilize the “Too Big to Fail” concept and the SIFI framework as theoretical underpinnings. To this end, the stock returns and market values of the publicly traded 13 banks are analyzed. To define the systemically leading banks of Turkey, the Component Expected Shortfall (CES) approach is applied for the period 2007–2022 in this study.
We also conduct a quantile spillover analysis to uncover the relationships among banks during periods of unexpected losses; therefore, our second aim is to assess systemic risk by examining how shocks or losses propagate across the banking network. Financial network theory offers a theoretical framework to understand how shocks and losses propagate across interconnected financial institutions. Connectedness is a quantitative indicator that measures the connectivity of market elements, which is influenced by changes in fiscal and monetary policies, wars, and regime transitions [
24].
This theory posits that the interdependencies among banks create a complex web of relationships through which disturbances can spread, potentially amplifying systemic risk [
25]. Based on financial network theory, we test if there is a significant relationship among banks’ unexpected losses, indicating that shocks do propagate across the banking network, contributing to systemic risk.
Once the dynamics and systemically important banks are identified using these methods, the study proceeds to analyze the impact of systemic risk on sustainable economic growth. The third aim of this study is to investigate the relationship between economic growth and systemic risk levels. To achieve this, we employ a Markov switching VAR (MS-VAR) model with a systemic risk index and industrial production growth rate that allows for regime-dependent relationships between the variables. Additionally, the study likely employs regime-dependent impulse response analysis to understand how the systemically important banks’ risk profile affects the industrial production growth rate during different economic regimes.
The financial accelerator theory offers a theoretical lens through which one can explore the potential relationship between systemic risk and economic growth, specifically represented by industrial production. This theory, initially developed by [
26], highlights the interplay between financial conditions and the real economy. It posits that fluctuations in the financial sector can amplify the impact of shocks on real economic activity. Based on the theoretical framework of the financial accelerator theory and its application to the relationship between systemic risk and economic growth (industrial production), our hypothesis is to test is if there is a significant relationship between systemic risk and industrial production growth in the Turkish banking system.
The paper aims to contribute to the existing literature in several ways. Firstly, we make extensive use of data set for the Turkish banking system to examine systemically important banks. Secondly, we employ the quantile spillover analysis to determine the network topology among the banks under the downside market conditions. Finally, the MS-VAR is employed to determine regime-dependent Granger causality and impulse-responses analysis between systemic risk and economic growth. To the best of our knowledge, the paper is the first attempt to use the quantile spillover analysis and regime-dependent analysis for banks in Turkey. Therefore, the primary motivation for this study unfolds along three pivotal dimensions that collectively extend the boundaries of knowledge. Ultimately, our research aspires to illuminate uncharted dimensions in the intricate web of financial stability, forging a path for more informed decision-making by regulators, policymakers, and stakeholders navigating the complexities of the Turkish banking landscape.
The remainder of the paper is organized as follows:
Section 2 presents a literature survey on measuring systemic risk and empirical works. The author presents the methodology in
Section 3. Then,
Section 4 provides a data explanation and empirical results followed by conclusions. Lastly,
Section 6 contains the discussion of the paper.
2. Literature Review
There are various measures that are used to assess and monitor systemic risk in financial systems and markets in the world. These measures can be used by regulators, policymakers, and financial institutions to identify, monitor, and manage systemic risks in the financial system. Here, it is attempted to provide mostly employed systemic risk measures in the literature.
2.1. Methods for Estimating Systemic Risk
One approach is to calculate default probabilities using Merton’s option pricing model, which estimates the likelihood of a bank’s default over time. Ref. [
27] used Merton’s option pricing model to calculate financial institutions’ default probabilities and measure the systemic risk. The study estimated the default probabilities of 149 banks from North America, Europe, Japan, and other regions from 1988 to 2002. The estimated probability of default of several banks was decrescent over time for the banks in North America and was growing for banks in Japan. Another method, known as the Shapley value, allocates the total systemic risk of the financial system among individual institutions based on their unique contributions. Ref. [
28] applied the Shapley value method to forecast the systemic risk of financial institutions. The Shapley value is a concept from cooperative game theory that is used to allocate the total payoff of a cooperative game among its players. In the context of systemic risk, the Shapley value is used to allocate the total systemic risk of the financial system among its individual institutions. The basic idea is that each institution contributes to the overall systemic risk of the system in a unique way, and the Shapley value is used to quantify each institution’s contribution. Ref. [
29] proposed a method for measuring systemic risk that combines the Shapley value approach with the multi-CoVaR method, which is a measure of the value-at-risk of one financial institution conditional on the VaR of other institutions. This approach involves calculating the Shapley value of each institution’s contribution to systemic risk based on the multi-CoVaR measure. Granger causality tests are employed to examine the direction and strength of causal relationships among different financial institutions or sectors. This provides insights into the interconnectedness among institutions. Ref. [
30] employed principal component analysis (PCA) and Granger causality tests to comprehensively analyze connectedness and systemic risks for the finance and insurance industries. PCA is a statistical technique that can be used to identify the underlying factors that drive the co-movements among a set of financial assets. In the context of systemic risk measurement, PCA can be used to identify the common sources of risk that affect the financial system as a whole. Granger causality can be used to identify the direction and strength of the causal relationships among different financial institutions or sectors. Granger causality is used to estimate the degree of interconnectedness among financial institutions or sectors by testing for the presence of causal relationships in their returns.
One notable contribution to the systemic risk estimating literature is made by [
31,
32], who introduced the following two innovative methods: Systemic Expected Shortfall (
SES) and Marginal Expected Shortfall (
MES). These methods aim to evaluate the systemic risk contribution of individual financial institutions by focusing on their undercapitalization tendencies within the broader context of the overall system undercapitalization. The conditional value-at-risk (CoVaR) method was used by [
33,
34]. The CoVaR measure is based on the idea that the risk of an institution cannot be fully captured by its own VaR (value-at-risk) alone, but also depends on the risk of the system as a whole. The CoVaR measure captures this systemic risk by estimating the VaR of the entire financial system conditional on the institution being in distress. The CoVaR measure proposed by [
33,
34] focuses on capturing tail dependence, which measures the extent to which the risk of a financial institution depends on extreme events that are likely to affect other institutions as well [
33]; however, it does not explicitly capture the spillover effects of extremely interconnected systems or system connectedness [
35].
MES is like an extension of CoVaR that considers the joint distribution of the asset returns of a financial institution and the system and measures the expected shortfall of the system when the institution is in distress, conditional on the institution’s contribution to the total risk of the system.
MES captures the spillover effects of the institution’s distress on the overall system, taking into account the institution’s level of interconnectedness and contribution to systemic risk [
32]. These methods provide insights into the undercapitalization risk of individual institutions and their potential impact on the overall stability of the financial system.
Ref. [
36] proposed a systemic risk index (SRISK—A Conditional Capital Shortfall Measure of Systemic Risk) to measure systemic risk. SRISK evaluates the capital shortages of a financial institution that would be required to return it to its pre-distress level in the event of a market-wide crisis while taking into account the institution’s degree of interconnectedness with the rest of the financial system. In other words, SRISK estimates the potential amount of capital that would need to be injected into a financial institution to stabilize the entire financial system if that institution were to experience distress. Therefore, SRISK is a measure of systemic risk that captures the potential impact of a single institution’s failure on the stability of the entire financial system [
36]. The author tried to provide a brief overview of some of the most commonly used methods in the literature.
These methods aim to model the relationships between different financial variables and estimate the potential losses or capital shortfalls that could arise from a shock event. The methods are mainly based on the assumption that there are interdependencies and linkages among different financial institutions and sectors that can amplify the effects of a shock event and potentially lead to a systemic crisis. These various measures and methods provide valuable insights into systemic risk in financial systems. They consider factors such as default probabilities, co-movements among assets, causal relationships, undercapitalization tendencies, and interconnectedness among the institutions.
2.2. Literature on Analyzing Systemic Risk of the Turkish Financial System
Researchers in the field of systemic risk analysis have widely adopted these methods to various financial systems and markets, both globally and in specific countries. Although there are many studies that investigate systematically important banks and measure systematic risk studies through many different methods in the banking sector and financial institutions around the globe, there are not that many in Turkey. Ref. [
37] aim to define systemically significant banks domestically (D-SIB) in the Turkish banking sector. They adopted an indicator with the cluster analysis application in 2012 as part of this aim. In the study, it was observed that there were 7 banks of the highest systemic importance among 28 banks according to the D-SIBs. These banks are Garanti, Akbank, Ziraat, Yapi Kredi, Vakifbank, and Halkbank, in descending order of their systematic importance. The seven banks defined as D-SIB in the study constitute 70.6% of the banking sector’s active at the end of 2013, and this bank also has an important role in the loan and deposit markets. The banks accounted for 71% of the sectoral total loan size, and it constituted 78.5% of the total deposits. All seven banks defined as D-SIB are deposit banks, three of these banks are commercial banks, and the other four are private banks. It also owns the entire group structure of these banks, and currently and/or its affiliates operate in the company’s capital markets and insurance sector. Ref. [
38] estimated the systemic risk for Turkish financial institutions by using the ESE method with the data of their share returns, market beta, leverage, and annual volatility of share returns for the period 1999–2009. The empirical results concluded that the Systemic Expected Shortfall method is useful as an alternative approach to following financial institutions’ potential systemic risk for Turkey’s financial system. Ref. [
39] analyzed the progress of the Turkish banking sector’s systemic risk by using the behavior of the banks’ share returns, which was taken as an indicator of systemic risk. The study also explored the primary factors of systemic risk. The market share of banks, the poor-performing loan level, the banks’ herd behavior, and the volatilities of macro variables were found to be the main determinants of systemic risk. Ref. [
40] used the approaches and models used by [
41] to estimate the Turkish banks’ systemic risk level. Thus, they used linear panel data analysis according to the systemic risk index approach called SRISK to estimate the systemic risk of Turkish banks for the period between 2003 and 2013. They concluded that single risks of a large-scale commercial bank in Turkey are influenced by their sizes, such as capital adequacy ratios, leverage ratios, and total assets. Ref. [
42] analyzed the systemic risk of the banking sector in Turkey by estimating two important measures of CoVaR and
MES methods for the period 2000–2016 by using their stock loss. The analyzed banks were Akbank, Finansbank, Garanti Bank, Tekstilbank, Işbank, and Yapı Kredi, which are listed in the Borsa Istanbul. Finansbank is the first and İşbank is the last systemic risk contributor based on both
MES and CoVAR measures. Tekstilbank is the second, Akbank is the third, and Garanti is the fifth contributor based on both
MES and CoVAR measures; however, the third and the fourth systemic risk contributors changed regarding the measures. Akbank is the third and Yapıkredi is the fourth based on the
MES measure, while Yapıkredi is the third and Akbank is the fourth based on the CoVAR measure. Ref. [
43] measured the Turkish banks’ systemic risk contributions and identified the systemically significant Turkish banks between 2005 and 2016 by applying the CoVaR method. The banks analyzed in the study were for which Ziraat, Halkbank, Vakıfbank, İşbank, Akbank, Garanti, Yapıkredi, Denizbank, Finansbank, TEB, Şekerbank, TSKB, and Kalkınma Bankası. Banks are ordered according to their systemic risk contributions to the Turkish financial system in terms of asset returns, macro-economic factors, and bank-specific factors. The empirical results of the study demonstrated that Akbank, Garanti, Yapı Kredi, and İşbank have the highest systemic risk contribution to the financial system when macro-economic factors are taken into account. Considering the bank-specific factors, this ordering was changed to Yapı Kredi, Garanti, TEB, Şekerbank, and Akbank. Another result was that the risk and spillover risks alone were lower for public banks than for large private banks. In addition, the marginal systemic risk contributions of public banks are smaller than those of private banks. Ref. [
44] analyzed the systemic risk of financial institutions in Turkey. They used the Component Expected Shortfall (
CES) method to do the related analysis, covering the period of 2005–2018 for 54 financial firms, among which there are 11 banks of Akbank, Albarak, Garanti, Halkbank, İşbank, Şekerbank, TSKB, Vakıfbank, Yapıkredi, Finansbank, and Tekstilbank. The empirical results demonstrated that the systemic risk weight is in large commercial banks. The top 10 systemically important financial institutions account for more than 90% of the total risk in the sample. As a result, the risk in the Turkish financial system was concentrated in certain financial institutions. The historical incidence of systemic risk in the sample shows a high level of systemic risk corresponding to well-known external events. Finally, a bivariate VAR model indicated that systemic risk is associated with the measures of global financial risks and has significant adverse effects on the real economy, particularly industrial production. The historical incidence of systemic risk in the sample shows a high level of systemic risk corresponding to well-known external events. Finally, a bivariate VAR model showed that systemic risk is associated with measures of global financial risks and has significant adverse effects on the real economy, particularly industrial production.
The studies indicate that the identified systemically important banks can vary; however, common contributors include Garanti, Akbank, Yapi Kredi, and İşbank. These banks were found to have the highest systemic importance in terms of their size, capital adequacy ratios, leverage ratios, and total assets. They play a significant role in the loan and deposit markets, accounting for a large portion of the sector’s total loan size and total deposits. The ranking of these contributors may change depending on the measurement method used and the factors considered. Some studies also suggest that public banks have lower risk and spillover risks compared to large private banks. The empirical results highlight that systemic risk in the Turkish financial system is concentrated in a few major financial institutions, particularly large commercial banks. The top 10 systemically important financial institutions account for a significant portion of the total systemic risk in the sample. This concentration of risk emphasizes the importance of regular monitoring and evaluation of the systemic importance of banks. Systemic risk in the Turkish financial system has been found to have considerable adverse effects on the real economy, particularly on the industrial production. Measures of global financial risks are associated with systemic risk, indicating the interconnectedness of the Turkish financial system with the global financial environment.
Considering that the growth of the banks operating in the sector continues within the framework of the growth potential of the Turkish economy, it is likely that there will be some changes in the systemic importance of these banks over time. Therefore, periodic evaluation of the systemic importance of banks is important in terms of monitoring the change in the sector and ensuring the effectiveness of the measures to be taken.
3. Methodology
3.1. Component Expected Shortfall (CES)
One of the methods that are used in this study is the Component Expected Shortfall (CES) method to determine a bank’s contribution to the overall systemic risk of the banking system in Turkey. The CES approach extends the traditional Expected Shortfall (ES) approach, measuring the expected loss that exceeds a given threshold, to the case where the loss is composed of multiple components.
The measure
CES, it is supposed the financial system composes of
n companies. Then, value-weighted return (
) for the Turkish financial system is defined as follows:
where
is the weight of the
ith company in the banking system related to a market capitalization of banks and
is the company i return.
If it is assumed that the whole risk of the banking sector is calculated by the conditional
ES, by actuarial rules, the
ES is the expected market loss provided the return according to VaR is less than quantile α. The distressing case is specified by C as a threshold, the conditional ES is calculated as follows:
where
is the expected value based on information present at time t, and C is a critical threshold that is equivalent of VaR (5 percent). The Marginal Expected Shortfall (
MES) represents the additional contribution of a company to the overall risk of the banking system, beyond what would be expected based on its weight in the system. A positive
MES indicates that the company increases the overall risk of the system, while a negative
MES indicates that the company decreases the overall risk of the system [
45]. To identify the marginal contribution of a company to the risk of the whole banking sector by ES, calculated the
MES by the following:
where
wit states the weights of companies regarding their market capitalization ratio. The
CES is an exact measure of systemic risk, as opposed to a marginal measure.
MES captures the additional contribution of a specific component to the whole risk of the financial system, beyond what would be expected based on its weight in the system. However, the
CES measures the total expected loss that exceeds a given threshold for the entire system, by aggregating the Expected Shortfall of all individual components. This provides a more comprehensive view of systemic risk, as it takes into account the interdependencies and interactions between different components, and captures the potential for systemic failures that cannot be attributed to individual components alone. The
CES is determined as the component of the ES of the whole banking sector owing to the
ith company:
where
. The addition of
ith company to systemic risk is expressed as the percentage of ES:
The calculation of
CES requires the estimation of time-varying correlations between different components. The reason for this is that the
CES measure aims to capture the potential for systemic risk that arises from the interdependencies and interactions between different components in the banking system. Thus, the bivariate GARCH model put forward by [
46] is employed by the following:
where
refers the vector of companies and market returns,
represents the vector of i.i.d shocks with zero mean and identity matrix. The bivariate GARCH model assumes that the returns of two assets are jointly normal, and the conditional covariance matrix of the returns follows a GARCH process. The model involves estimating a number of parameters, such as the conditional mean, the conditional variances, and the conditional covariance. The time-varying conditional covariance matrix
Ht is defined by the following:
where
σmt and
σit refer to conditional standard deviation for the whole sector and the specific company, respectively, and ρ
it is a time-varying conditional correlation. The time-varying standard deviation captures the idea that the volatility of an asset is not constant over time but rather varies depending on past returns. For example, if a stock has a high standard deviation in the past, it is likely to continue to have a high standard deviation in the future. On the other hand, if a stock has a low standard deviation in the past, it is likely to continue to have a low standard deviation in the future. Ref. [
47] indicated the
CES as follows:
Three steps are followed to obtain CES value:
S1. We model the time-varying correlations of individuals by using a DCC (dynamic conditional correlation) method [
46]. The DCC model allows for the correlation between the series to vary over time and is thus able to capture changes in the correlation structure that occur in response to various economic or financial shocks. According to this, it is obtained standardized residuals and conditional volatilities for individuals by setting volatilities in a GJR-GARCH (1,1) structure [
48].
S2. Based on the i. i. d. feature of the changes, it is formed a non-parametric kernel estimation of the queue expectancie
and
where
is the threshold,
refers the normal c.d.f. and h equals T
1/5, which is the bandwidth.
S3. Then we obtain a daily Component Expected Shortfall systemic risk measure by using Equations (6) and (9).
3.2. The Quantile Connectedness Method
We also employ quantile connectedness method proposed by [
49] in which the connectedness between the variables is examined at different quantiles. Note that the quantile spillover analysis depends on estimation of the quantile vector autoregression (QVAR). A quantile vector autoregression is an extension of the traditional vector autoregression (VAR) model that allows for the analysis of relationships between variables at different quantiles of their conditional distribution. While a traditional VAR model estimates the conditional mean of the variables, a QVAR estimates the conditional quantiles [
50]. QVAR model can be shown as below:
where
is
dimensional vector of the endogenous variable, τ is the quantile and lies between [0, 1] and
p is the lag length of the QVAR model. In Equation (10),
shows conditional means,
shows coefficients and
is residuals with a
dimensional variance-covariance matrix,
. The moving average representation of the QVAR(
p) model is written as follows using Wold’s theorem also known as the Wold representation theorem. The theorem is a fundamental result in time series analyses. It provides a way to represent a stationary stochastic process as a linear combination of past values of the process and uncorrelated random variables [
51].
We estimate the H-step forward GFEVD (Generalized Estimation Error Variance Decomposition) proposed by [
52,
53] to define the impact of a sudden shock in variable
jth on variable
ith in Equations (12) and (13).
The GFEVD is a statistical technique used to decompose the forecast error variance of a model into the contributions from different sources. It provides a way to understand the relative importance of different factors or variables in explaining the forecast error variance. In Equation (12),
is a zero vector with unity on the
ith position. The normalization results in the two equations indicated by the following:
The total spillover index at the
τ-th quantile is estimated by the following:
Ref. [
54] suggested the adjusted total spillover index by the following:
The ATSI ranges from 0 to 1 and it is an augmented version of TSI in terms of interpretability of the results.
The total directional connectedness “
TO” that indicates the directional spillover from the
ith variable to the all-other variables
j is represented as follows:
The total directional connectedness “
FROM” that demonstrates the directional spillover from the all-other variables
j to the
ith variable is represented as follows:
The net total directional spillover is calculated as the difference between the directional spillovers of
TO and
FROM as follows:
The positive value for the net total directional spillover indicates that ith variable is spillover transmitter otherwise it is called as spillover receiver.
4. Data and Empirical Results
4.1. Details of the Data
The main aim of the study is to identify the systematically important banks and interrelationships among banks in the banking system of Turkey, and hence, we use a total of 13 banks that operated continuously in the stock market between 2007 and 2022. The chosen sample period of 2007–2022 for examining systemic risk in the Turkish banking system is underpinned by its alignment with significant events and contextual shifts that exert substantial influence on the banking sector’s dynamics. Beginning in 2007, this period encapsulates the 2008 global financial crisis, affording an opportunity to assess pre-crisis conditions and subsequent regulatory reforms. The timeframe also encompasses pivotal junctures in Turkey’s history, including the constitutional referendum of 2010, the 2011 European debt crisis, the Gezi Park protests of 2013, the 2016 coup attempt, and the onset of the COVID-19 pandemic in 2020. In addition, it encompasses the 2018 and 2021 currency shocks, which further contribute to the diverse array of economic challenges impacting the banking sector. By analyzing this comprehensive span of events, this study aims to elucidate how the Turkish banking system navigated through economic volatility, geopolitical upheavals, and global uncertainties, thereby facilitating a comprehensive evaluation of systemic risk spillovers and its intricate interplay with transformative events. Thereby facilitating a comprehensive evaluation of systemic risk and its intricate interplay with transformative events. In addition to these aims, the study also seeks to investigate the interrelationships among banks during periods of unexpected losses, as well as the relationships between economic growth and systemic risk.
We use logarithmic return series that are calculated from daily stock prices in the empirical analysis. The market capitalization of each bank is used as the weight when constructing the portfolio. All data are obtained from the Refinitiv Eikon database. The names and codes of the banks used in the study are shown in
Table 1. In the database, GSD Holding has been taken into the Turkish banking system.
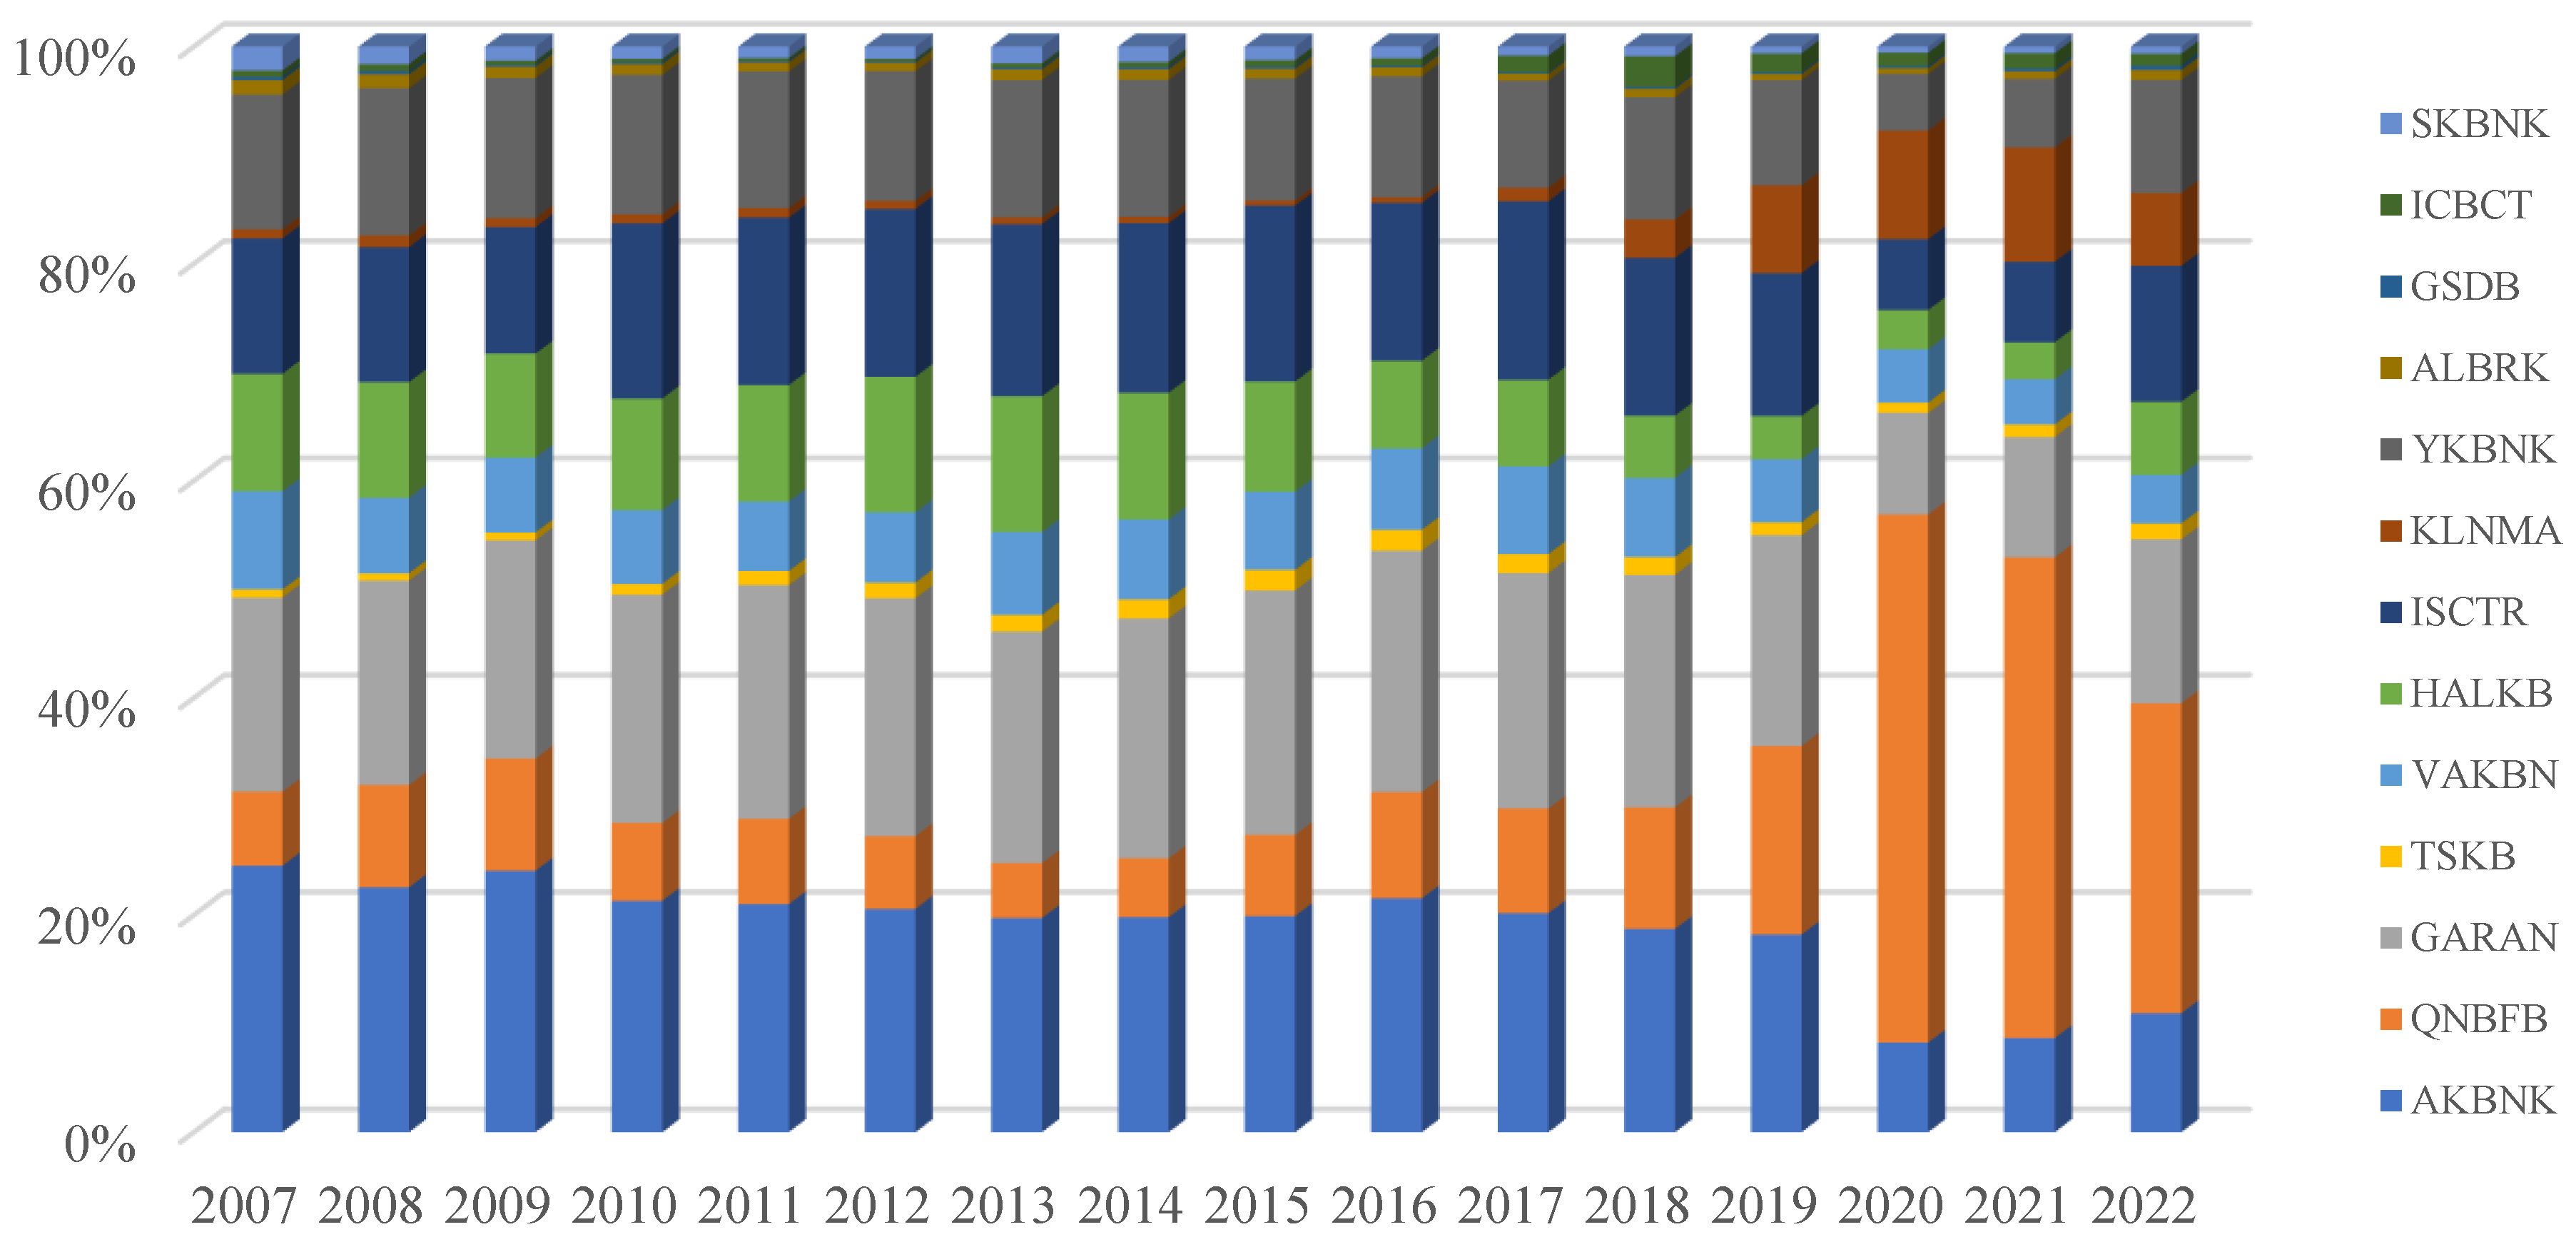
Figure 1 shows the yearly average weights of the banks in the portfolio. According to the results in
Figure 1, AKBNK, GARAN, ISCTR, and YKBNK are among the top five banks in terms of market capitalization. On the other hand, especially since 2019, the weight of QNBFB in the portfolio has significantly increased. This result is in line with theoretical expectations because, in 2018, Finansbank was acquired by Qatar National Bank, and since that date, the bank’s market value has significantly risen.
The descriptive statistics for the return series are given in
Table 2. During the sample period, the daily mean return is determined to be positive for all banks, with TSKB yielding the highest mean return, while HALKBK has the lowest mean return. Skewness and kurtosis statistics indicate that the distribution of the return series is not normal, and this result is confirmed by the Jarque–Bera normality test. The degree of integration of the series is examined using the ADF and PP unit root tests, and all return series are found to be stationary at the level according to both unit root tests.
4.2. MES Results and Systematically Important Banks
To calculate the daily
MES, first, a bivariate DCC-GARCH model is estimated using the return series of banks and the portfolio. Then,
CES for the specific dates is calculated to identify systematically important banks in the Turkish banking sector, and the results are shown in
Table 3. According to the results in
Table 3, AKBNK, GARAN, YKBNK, ISCTR, and HALKB were identified as the top five systematically important banks between 2008 and 2014; however, the ranking of banks may vary over the years. For example, AKBNK ranked first among systematically important banks in 2008 and 2012, with its contribution to portfolio risk calculated as 24% and 21%, respectively. On the other hand, GARAN ranked first among systematically important banks between 2009 and 2014 except for 2013, and its contribution to portfolio risk varies from 24% to 28% during those years.
Since 2015, QNBFB had started to rank high among the systematically important banks and was calculated as the first-ranked bank between 2018 and 2021. Particularly in 2019, QNBFB’s contribution to portfolio risk was calculated as 80%. This outcome is in line with the theoretical expectations because QNBFB’s market capitalization significantly increased following Qatar National Bank’s acquisition of Finansbank in 2018. This outcome indicates that QNBFB can be considered “too big to fail” in the Turkish banking sector according to the results in 2019.
On the other hand, KLNMA ranked third in 2018 and 2019, and second in 2020 among the systematically important banks. This finding is noteworthy because compared to other banks, the market capitalization of KLNMA is limited; however, KLNMA’s contribution to portfolio risk was calculated as 14% in 2018 and 10% in 2020. In 2022, ISCTR, GARAN, QNBFB, YKBNK, and AKBNK have been identified as the top five systematically important banks, and their total contribution to portfolio risk has been calculated as 75%.
In conclusion, private banks stand out in terms of systemic risk in the Turkish banking system, and among these banks, GARAN, AKBNK, ISCTR, and YKBNK consistently rank at the top throughout the sample period. These results are parallel with the studies of [
37,
42,
43,
44]. All these studies found these banks are the highest systematic risk contributor within the Turkish banking system. The empirical results of all these studies show that the systemically important banks are large banks.
The daily
MES (Marginal Expected Shortfall) values for AKBNK, GARAN, ISCTR, and YKBNK are shown in
Figure 2. The results in
Figure 2 indicate that the
MES values of banks have significantly increased in 2008–2009, 2013, 2018, and 2022.
The results in
Table 3 indicate the contribution of banks to portfolio risk during extreme downside market conditions. This result is particularly useful for identifying important banks in terms of a portfolio approach in the Turkish banking sector. However, it is also crucial to uncover the relationships among banks during periods of extreme losses to assess systemic risk; therefore, in this section of the study, quantile spillover analysis has been conducted to reveal the network among the banks during periods of unexpected losses. In this vein, we first estimate the quantile VAR model, and the optimal lag length is determined as two based on the Akaike information criterion. We use the Generalized Error Variance Decomposition for a 30-day forecasting horizon. We also considered different forecasting horizons (such as 60 and 90 days) for the robustness of the results and obtained similar findings. The results are available upon request.
4.3. Results of the Spillover Analysis
The results of the spillover analysis, calculated for the 5% quantile level (indicating downside market conditions), are shown in
Table 4. According to these results, it has been determined that there is a high level of connectedness among banks during downside market periods (total connectedness index of 97%). Based on the net spillover results, TSKB, VAKBNK, ISCTR, HALKB, AKBNK, YKBNK, and GARAN are identified as net risk transmitters, while QNBFB, ICBCT, SKBNK, GSDB, and ALBRK are found to be net risk receivers. To the best of our knowledge, the paper is the first attempt to use the quantile spillover analysis and regime-dependent analysis for banks in Turkey; therefore, we can not find the supportive literature on the Turkish banking system.
These results are consistent with the findings in
Table 3, except for empirical findings for TSKB and QNBFB. In this context, according to the
CES analysis results, especially in recent years, QNBFB is identified as a systematically important bank, but the spillover analysis results show that it is a net risk receiver. Specifically, QNBFB is determined to receive the highest level of risk spillover among the banks in the sample. On the other hand, as per the results in
Table 3, TSKB ranks lower in terms of systemic risk, but according to the spillover analysis results, it is identified as a net risk transmitter. Furthermore, ISCTR, AKBNK, YKBNK, and GARAN are identified as net risk transmitters, and this outcome is consistent with the
CES analysis findings.
In
Figure 3, the time-varying total connectedness index is presented. The results are obtained by employing a rolling window approach with a window size of 252. The findings in
Figure 3 indicate that the downside connectedness among banks is significantly high in all subsamples. According to the results in
Figure 3, during heightened financial distress periods (such as 2009, 2013, and 2018), the downside total connectedness among banks decreases, while in normal periods, the downside total connectedness increases.
The time-varying net total directional spillover analysis results are presented in
Figure 4. Note that the positive values in
Figure 4 represent the periods in which the bank is a net spillover transmitter, while the negative values indicate the periods in which it is a net spillover receiver. The results in
Figure 4 indicate that the spillover connectedness among banks varies across subsamples. For instance, while QNBFB was the net spillover transmitter in 2014 and 2020, it is determined as the net spillover receiver in other subsamples.
We present the downside spillover network results in
Figure 5. While the blue circles indicate that the bank is a net spillover transmitter, the yellow circles imply that the bank is a net spillover receiver. The results in
Figure 5 are obtained from the findings in
Table 3 and it is presented to provide a visual perspective. The results in
Figure 5 indicate that ISCTR, GARAN, YKBK, and AKBNK are the most important spillover transmitters in the Turkish banking system.
4.4. The Relationship between Systemic Risk and Economic Growth
After identifying the systemically important banks within the Turkish banking system, we examine the impact of systemic risk on sustainable economic growth. Since it necessitates the examination of the dynamic relationship between systemic risk and economic growth, as in [
44], we calculate the systemic risk index (
SRI) using the daily
MES as follows:
where
wit is the weights that are calculated according to market capitalization. Note that the
MESit indicates a marginal expected shortfall of
i. bank and
SRI is the weighted total amount of expected shortfall in the banking system; therefore, an upward trend in the SRI shows that the expected shortfall in the banking system increases. We consider the industrial production index as a proxy for economic growth. We collect the industrial production index from the World Bank Global Economic Monitor. To ensure stationarity, we calculate the yearly growth rate of industrial production (
GIP). Since the industrial production index is measured on a monthly frequency, the systemic risk index (
SRI) has been converted to a monthly frequency as well by taking the maximum value of
SRI in each month. We present the SRI and GIP in
Figure 6. Note that the
SRI was significantly increased during financial distress periods, such as the 2008–2009 global financial crisis, the 2011 European debt crisis, the 2013 Gezi Park protests, the 2018 speculative attacks on the exchange rate in Turkey, and the 2020 global COVID-19.
Next, we employ the Markov switching VAR (MS-VAR) model suggested by [
55] with systemic risk index and industrial production growth rate to determine regime-dependent causal links between the variables as well as regime-dependent impulse responses analysis. The optimal lag length is determined as one, according to the Bayesian information criteria (
SIC). We present the MS-VAR results in
Table 5 and the smoothed transition probabilities for regime 2 are given in
Figure 7. As in the common approach in the literature, we consider both the smoothed transition probabilities and the estimated coefficients in identifying the regimes. The results in
Figure 7 correspond to financially distressed periods in Turkey. Furthermore, the constant term of the first regime is lower than the second regime and hence we identify the first regime as “normal”, whereas the second regime is called the “distressed” regime. The likelihood ratio (LR) test results and Davies
p-value indicate that the MS-VAR model better characterizes the data than the linear VAR model because we can reject the null hypothesis of the linear VAR model at a 1% significance level.
We conduct a regime-dependent Granger causality test from the
SRI to the
GIP by imposing restrictions on the autoregressive coefficients in the MS-VAR model. We present the test results in
Table 6, which indicates the Granger causality from the
SRI to the
GIP, at a 10% significance level in the normal regime. On the other hand, the
SRI is found to be the Granger cause of the
GIP at a 5% significance level in the distressed regime. This finding indicates that the SRI can be considered as a leading indicator for the economic downturn in Turkey and this is consistent with the empirical results of [
44,
56]. They found causality from systemic risk to industrial production.
Finally, we employ the regime-dependent impulse responses analysis suggested by [
57] in which the Cholesky decompositions are used to identify the shocks. The results in
Figure 8 emphasize that the impact of an unexpected shock in the
SRI on the
GIP is not statistically significant in the normal regime. On the other hand, the responses of the
GIP to an unexpected shock in the SRI are negative and statistically significant for up to twelve months. These results suggest that an increase in the systemic risk in the Turkish banking sector decreases economic growth significantly during the financial heightened periods. Therefore, to ensure sustainable economic growth, market regulators and policymakers need to closely monitor systemic risks in the banking sector and take proactive measures to mitigate them. Regulators may detect weaknesses and imbalances in the financial system that might jeopardize general stability by keeping a close watch on systemic risks. This enables them to put in place suitable policies and rules to stop the accumulation of systemic risks and promptly resolve any existing hazards. Preventative steps can assist the protection of the banking sector’s stability and reduce any potential negative effects on the larger economy.
5. Conclusions
The banking sector is a pivotal cornerstone of the financial system, facilitating capital allocation, credit provision, and economic stability essential for sustainable growth. The banking crisis that unfolded at the beginning of 2023, following the 2008 global financial crisis across the USA, served as a powerful reminder of the criticality of systemic risk. This period underscored the vulnerabilities and interconnections inherent in the financial system one more time, ultimately resulting in severe repercussions for the global economy. Despite the significant measures taken in the aftermath of 2008 to strengthen financial regulations and enhance risk management practices, the occurrence of subsequent banking failures in 2023 indicates that more needs to be performed.
The growing importance of systemic risk on a global scale has prompted us to analyze this issue, specifically within the banking sector of Turkey. Recognizing the potential consequences and vulnerabilities associated with systemic risk, we sought to assess its impact and implications within the Turkish banking system. By conducting an in-depth analysis, we aim to shed light on the extent of systemic risk and its potential ramifications for the stability and sustainability of the financial system and economic growth in Turkey.
The objective of this study is twofold, as follows: to identify systematically important banks and spillovers within the Turkish banking system from 2007 to 2022 and to uncover the regime-dependent causal links between systemic risk and economic growth. To achieve these, the study focused on 13 banks that operated continuously in the stock market during the specified period. These banks included Akbank (AKBNK), QNB Finansbank (QNBFB), Garanti Bankası (GARAN), Sinai Kalkınma Bankası (TSKB), Vakıflar Bankası (VAKBN), Turkiye Halk Bankası (HALKB), Turkiye Is Bankası (ISCTR), Turkiye Kalkınma ve Yatırım Bankası (KLNMA), Yapı ve Kredi Bankası (YKBNK), Albaraka Türk (ALBRK), GSD Holding (GSDB), ICBC Turkey Bank Anonim (ICBCT), and Şekerbank (SKBNK). Through our analysis, we aim to provide insights into the relative importance of these banks in the overall systemic risk of the Turkish banking system. By employing methodologies such as the Component Expected Shortfall (CES) method and quantile spillover analysis, it is assessed the interconnectedness and vulnerability of these banks during periods of unexpected losses.
The findings reveal that private banks, particularly Akbank, Garanti Bank, Iş Bank, and Yapı ve Kredi Bank, consistently ranked among the top banks in terms of systemic risks throughout the sample period. These banks are also rank among the top 10 banks based on asset size; however, the ranking of banks may vary over the years. For example, Akbank ranked first among systematically important banks in 2008 and 2012; on the other hand, Garanti Bank ranked first among systematically important banks between 2009 and 2014, except for 2013.
Since 2015, QNB Finansbank has started to rank high among systematically important banks and was calculated as the first-ranked bank between 2018 and 2021. Particularly in 2019, QNB Finans Bank’s contribution to portfolio risk was calculated as 80%. This outcome is in line with the theoretical expectations because QNB Finansbank’s market capitalization significantly increased following Qatar National Bank’s acquisition of Finansbank in 2018. This outcome indicates that, QNB Finansbank can be considered “too big to fail” in the Turkish banking sector according to the results in 2019.
On the other hand, Turkiye Kalkınma & Yatırım Bankası (KLNMA) ranked third in 2018 and 2019, and second in 2020 among systematically important banks. This finding is noteworthy because compared to other banks, the market capitalization of KLNMA is limited; however, KLNMA’s contribution to portfolio risk was calculated as 14% in 2018 and 10% in 2020. In 2022, Iş bank, Garanti Bank, QNB Finansbank, Yapı & Kredi Bank, and Akbank have been identified as the top five systematically important banks, and their total contribution to portfolio risk has been calculated as 75%. In conclusion, private banks stand out in terms of systemic risk in the Turkish banking system, and among these banks, Garanti Bank, Akbank, Iş Bank, and Yapı & Kredi Bank consistently rank at the top throughout the sample period. These top four banks MES values have significantly increased in 2008–2009, 2013, 2018, and 2022.
Moreover, the spillover analysis indicates a high level of connectedness among the banks during downside market periods. The total connectedness index estimated as 97%. Sinai Kalkınma Bankası, Vakıfbank, Iş Bank, Halkbank, Akbank, Yapı & Kredi Bank, and Garanti Bank are identified as net risk transmitters, while QNB Finansbank, ICBC Turkey Bank, Şekerbank, GSD Holding, and Albaraka Türk are found to be net risk receivers. QNB Finansbank is identified as a systematically important bank, but the spillover analysis results show that it is a net risk receiver. Specifically, QNB Finansbank is determined to receive the highest level of risk spillover among the banks in the sample. On the other hand, Sinai Kalkınma Bankası ranks lower in terms of systemic risk, but according to the spillover analysis results, it is identified as a net risk transmitter. The results indicate that İş Bank, Garanti Bank, Yapı ve Kredi Bank, and Akbank are the most important spillover transmitter in the Turkish banking system.
Lastly, this study investigates the impact of systemic risk on sustainable economic growth. By calculating the systemic risk index (SRI) using the daily Marginal Expected Shortfall (MES) and considering the industrial production index as a proxy for economic growth, it is employed the Markov switching VAR (MS-VAR) model to determine regime-dependent causal links and impulse responses. The results demonstrate that an increase in systemic risk within the Turkish banking system significantly decreases economic growth during periods of financial stress. In addition, SRI was significantly increased during financial distress periods such as the 2008–2009 global financial crisis, the 2011 European debt crisis, the 2013 Gezi Park protests, the 2018 speculative attacks to exchange rate in Turkey, and the 2020 global COVID-19.
In conclusion, this study provides valuable insights into the identification of systemically important banks in Turkey’s banking system and highlights the crucial link between systemic risk and economic growth. These findings underscore the importance of effective risk management and proactive regulatory measures to ensure sustainable economic development and financial stability.
6. Discussion and Implications
This study delves into the identification of systematically important banks within Turkey’s banking system and elucidates the intricate connection between systemic risk and economic growth. Based on our findings, several key policy implications emerge for regulators and policymakers in Turkey. These findings emphasize the need for market regulators and policymakers to closely monitor systemic risks in the banking sector and implement proactive measures to mitigate them. By addressing the weaknesses and imbalances in the financial system, regulators can safeguard stability, protect the banking sector, and reduce potential adverse effects on the broader economy.
It should be regulatory frameworks designed to dynamically respond to varying levels of systemic risk. By fostering transparency in risk assessment methodologies, stakeholders can attain a clearer understanding of potential vulnerabilities. Additionally, encouraging collaborative efforts among financial institutions can amplify the overall system resilience, thereby mitigating the impact of systemic shocks. The findings underscore the pressing need for robust risk management practices and proactive regulatory measures to uphold sustainable economic development and ensure financial stability.
Furthermore, it is crucial to extrapolate the insights garnered from this analysis to the broader context of Turkey’s financial landscape. The examined events during the study period, such as the 2008 global financial crisis, the European debt crisis of 2011, the Gezi Park protests of 2013, speculative attacks on the exchange rate in 2018, and the global COVID-19 pandemic in 2020, offer valuable lessons for stakeholders. Policymakers and regulators can leverage these historical instances to implement measures that mitigate the impact of systemic risk during similar stressors in the future.
Turkish regulators and policymakers can enhance oversight and stress testing for major systemic risk contributors, promoting collaboration among banks to prevent risk amplification, establishing contingency plans and liquidity buffers with risk-transmitting banks, implementing targeted measures for risk-receiving banks, prioritizing countercyclical policies and prudent risk management to counter adverse systemic risk effects on economic growth, developing robust resolution plans for larger banks to minimize contagion risk, and maintaining a balanced approach between economic growth and a stable financial system. These strategies, informed by the insight that larger banks contribute more to systemic risk, can proactively manage threats to financial stability while fostering a resilient and prosperous financial environment.
In summary, while this study makes considerable advancements in uncovering the intricate interplay between systemic risk and economic growth within Turkey’s banking sector, it prominently underscores the significance of drawing well-defined conclusions. By embedding the empirical findings within the unique context of the Turkish banking landscape and offering pragmatic applications, this study stands poised to offer actionable insights. These insights can serve as a comprehensive guide for regulators, financial institutions, and policymakers, presenting a clear pathway to bolster the financial system’s fortitude and foster a sustainable trajectory of economic progress.


