Article

Investigating the Mutual Feedback between Wind–Sand Fields and a Running Train on the Bridge–Road Transition Section of a Railway

1
School of Mechanical Engineering, Lanzhou Jiaotong University, Lanzhou 730070, China
2
Key Laboratory of Ministry for Education on Western Disaster and Environment, Lanzhou University, Lanzhou 730000, China
3
Xinjiang Railway Survey and Design Institute Co., Ltd., Urumqi 830011, China
4
CRRC Zhuzhou Locomotive Co., Ltd., Zhuzhou 412001, China
5
School of Civil Engineering, Lanzhou Jiaotong University, Lanzhou 730070, China
*
Author to whom correspondence should be addressed.
Sustainability 2023, 15(19), 14210; https://doi.org/10.3390/su151914210
Submission received: 17 May 2023 / Revised: 2 July 2023 / Accepted: 11 July 2023 / Published: 26 September 2023

Abstract

:
Strong wind–sand flow exerts great potential safety hazards for high-speed train operations. In this paper, we investigate the aerodynamic characteristics of high-speed trains passing through the bridge–road transition section under a wind-blown sand environment. In particular, we adopt the sliding grid method to simulate the changes in aerodynamic pressure on the train surface when the train passes the bridge transition at different speeds and bridge heights. The variation in the aerodynamic lateral force borne by the vehicle body at various times is then obtained. The results reveal that in the wind–sand environment, when a train drives from the bridge to the embankment, the pressure values on both the windward and leeward sides of the train change abruptly, with the most obvious increase in the lateral force of the head car. Moreover, the abrupt change in pressure increases with the speed of the lateral wind–sand flow. The differential pressure force of the train on the embankment is larger where the differential pressure force on both sides of the head train is the largest. When the train is running in the opposite direction, the differential pressure force on both sides of the train decreases. Compared with the lateral wind condition, the lateral force at different positions of the train under the wind–sand condition exceeds that under the non-sand condition. The average increases in the train body are approximately 17.6% (10 m/s), 10.5% (20 m/s) and 9.5% (30 m/s), which will cause passengers to experience an obvious “shaking” phenomenon.

1. Introduction

The large area of the Gobi Desert in Northwest China has a serious impact on the high-speed railway passing through it [1,2,3]. For example, the Lanzhou–Urumqi Railway exhibits large “ups” and “downs” along the railway line and suffers from serious wind–sand hazards. The impact of sand on high-speed trains is twofold: (i) sand particles bury the subgrade and (ii) wind and sand affect the aerodynamic characteristics of trains during their operation [4,5].
In order to reduce the erosion and burying of the railway subgrade by wind–sand flow, sand prevention measures are often arranged on both sides of the subgrade. Furthermore, the subgrade form is generally dominated by high embankments and bridges (Figure 1). Different subgrade structures will have different effects on the aerodynamic force and overturning resistance of high-speed trains. Adopting embankments and bridges is equivalent to raising the height of the train operation. The crosswind speed at different heights differs according to the characteristics of the atmospheric bottom boundary velocity wind field, making the train more sensitive to changes in aerodynamic forces for different embankment and bridge heights [6,7]. With the continuous increase in the railway construction scale in sand areas, the problems related to subgrade sand prevention and train aerodynamic effects under wind–sand environments have become increasingly prominent. Thus, there is an urgent need for relevant research to address these problems [8,9,10].
The aerodynamic characteristics of high-speed trains with different subgrade structures under wind–sand environments are typically evaluated by wind tunnel tests, real vehicle tests, numerical simulations, and theoretical analysis. Suzuki et al. suggested that the aerodynamic characteristics of a train under crosswind are not only related to the shape of the vehicle but also to the cross-sectional structure of the railway line (e.g., bridges, embankments, and ground structures) [11]. Mei et al. took the ICE2 high-speed train as the research object and analyzed the influence of structured and unstructured grids on the aerodynamic characteristics of the train. The results showed that it is more feasible for high-speed trains with complex shapes to adopt a tetrahedral unstructured grid [12]. Wang et al. applied uniform and exponential wind, respectively, to simulate a high-speed train running on flat ground and an embankment. The authors revealed that the lateral force and overturning moment of the train under uniform wind conditions exceeded those under the exponential wind condition, and the aerodynamic characteristics of the train under exponential wind were in stronger agreement with the actual situation [13]. Xiong et al. adopted a numerical calculation method and a Euler–Euler two-fluid model to analyze the changes in the aerodynamic load of a high-speed train in non-sand and wind–sand environments, respectively, and determined the limitation velocity for safe train operations in crosswind [14]. Li et al. suggested that when a high-speed train passes through the transition section of a wind protection project, the phenomenon of “shaking” occurs due to the sudden change of the aerodynamic load [15]. Xu et al. determined that the wind speed suddenly changes at some road cutting–road embankment–road cutting positions in the high-wind area of the Second Double-Track Line of the Lanzhou–Urumqi Railway. The authors proposed to address the sudden change in the aerodynamic load of the train by increasing the wind-break wall or optimizing the train structure [16]. Shakibayifar M. found that the failure to implement relevant wind prevention and sand fixation measures in the bridge–road embankment transition sections of wind–sand areas can seriously affect the operation efficiency of high-speed trains and reduce the economy of railroad transportation [17].
The aforementioned studies focus on the changes in the aerodynamic load on the train under non-sand and wind–sand environments in a static state. However, research on the changes in the aerodynamic load when the train passes through the particular structure of a bridge–road transition section in a moving state is limited.
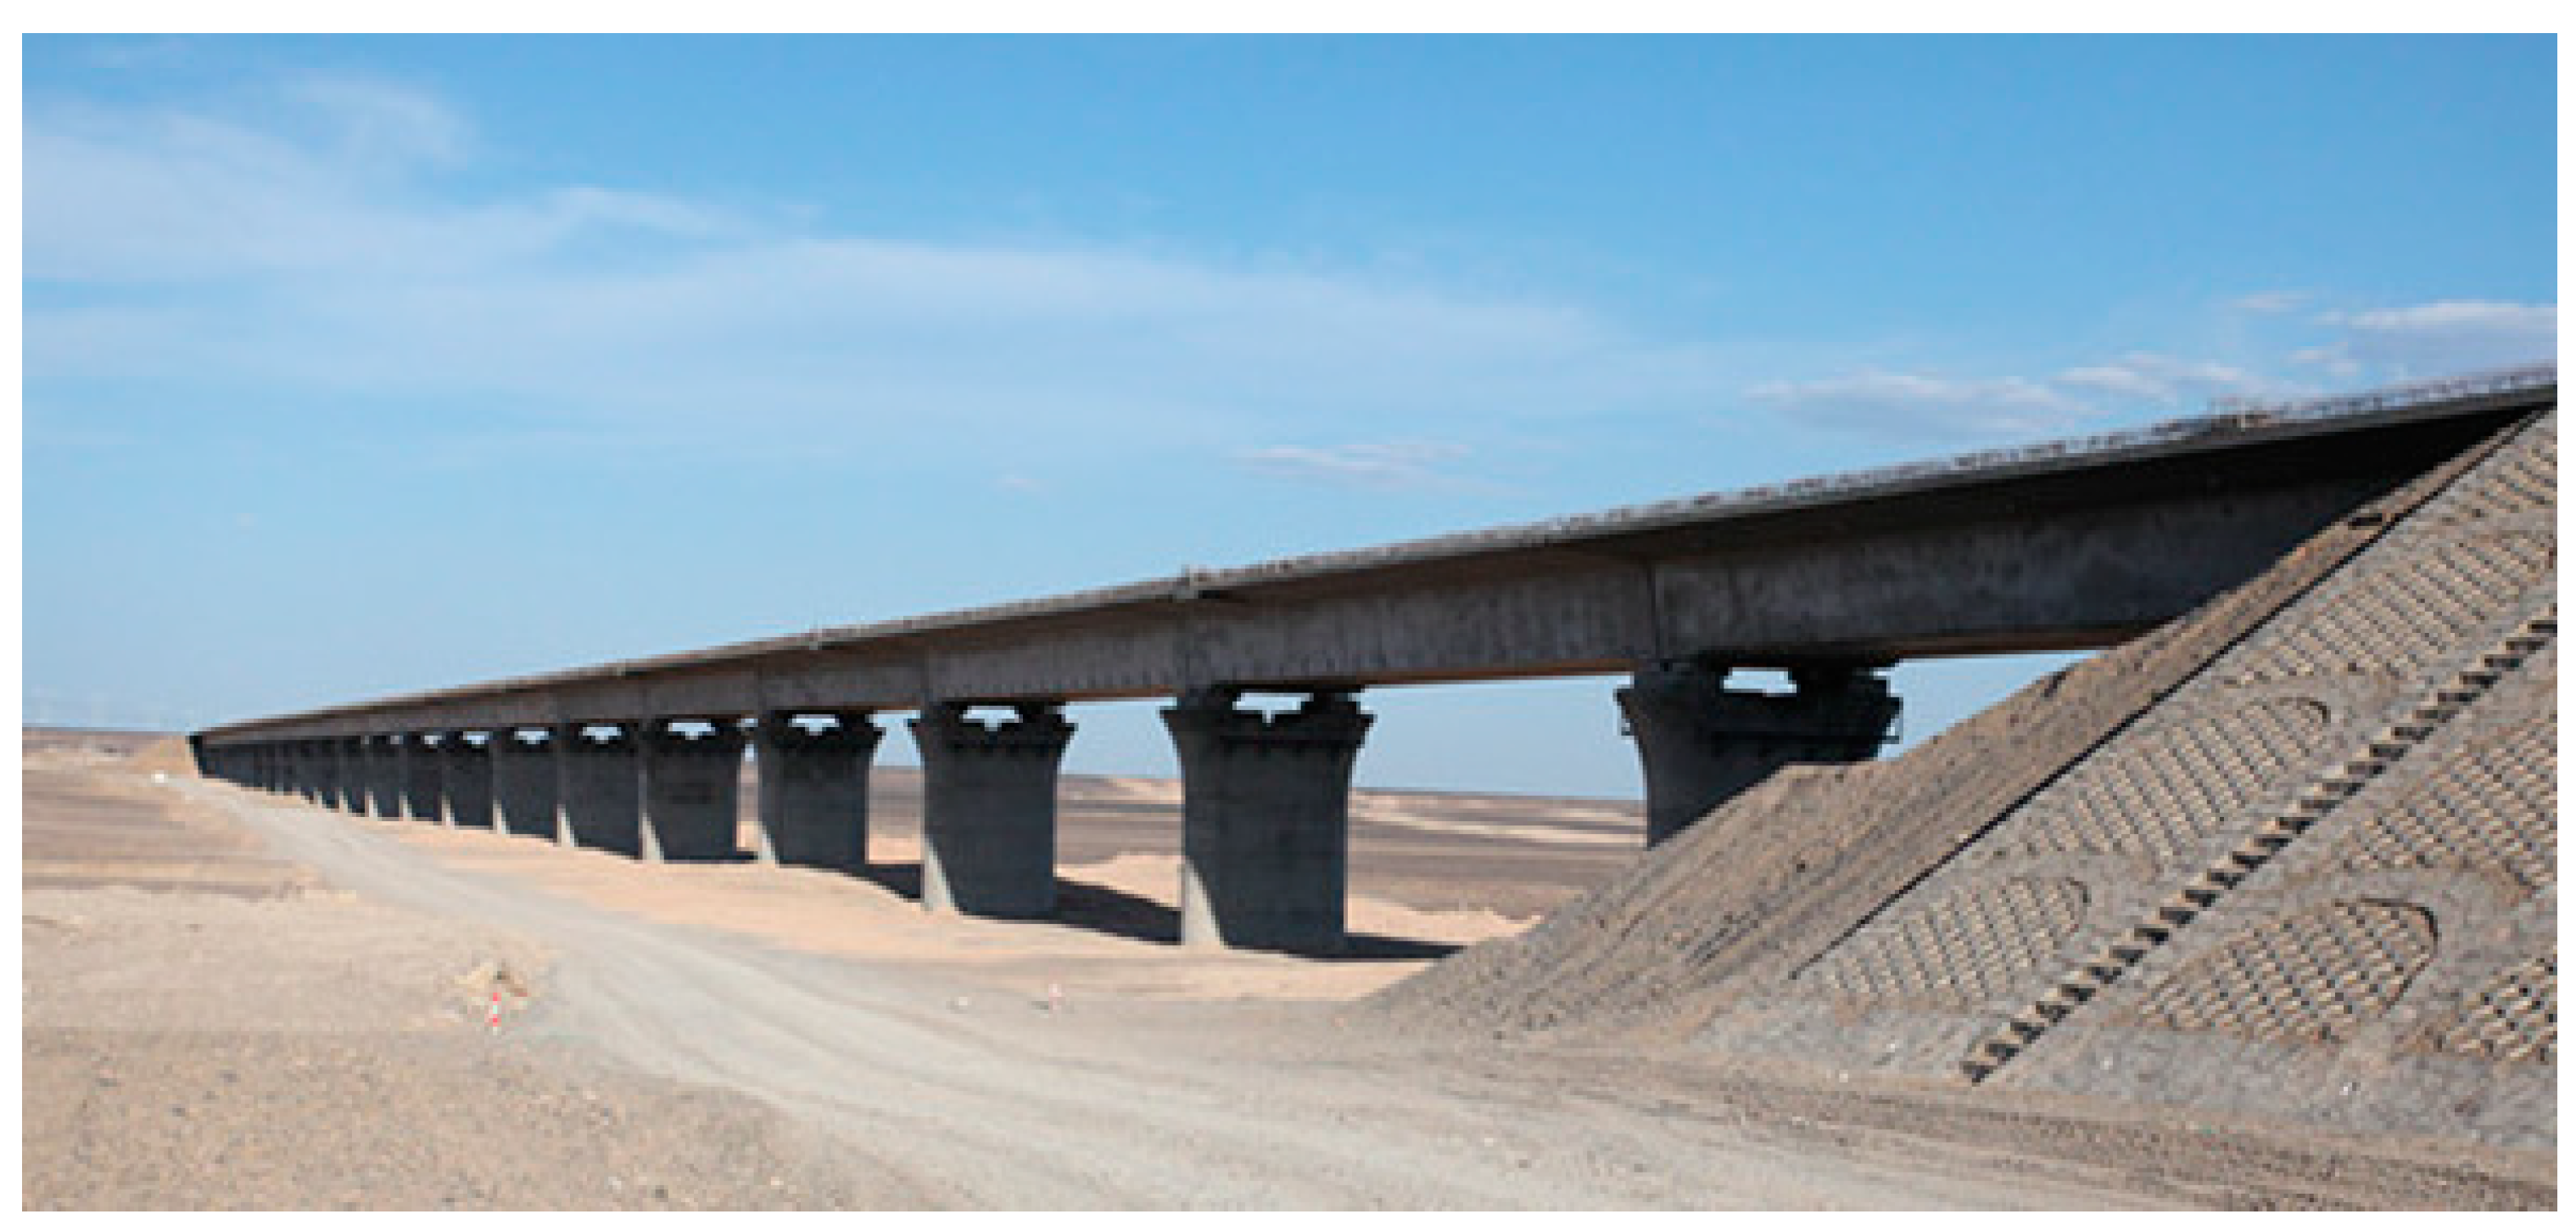
The bridge–road transition section is the junction area between the subgrade and bridge (Figure 2). When the wind–sand flow passes through this area, the flow field structure will change, which will have an impact on the aerodynamic effect of the passing high-speed train. This paper analyzes the aerodynamic performance of a high-speed train moving in the road–bridge transition section under the wind–sand environment. We adopt the sliding grid method for numerical simulations and an original scale train dynamic model as the test method. This study presents further innovations by adopting the slip-grid method to further explore the aerodynamic characteristics of high-speed trains passing through the bridge–embankment transition section under a transient state, and it comparatively investigates the differences in the pneumatic pressure and pneumatic load on high-speed trains passing through the bridge–embankment transition section under wind–sand and no sand environments. Moreover, the real cause of the “shaking” phenomenon of high-speed trains in the bridge–embankment transition section is further analyzed based on the actual situation.
Research on the aerodynamic characteristics of high-speed trains running in the bridge–embankment transition section under wind–sand environments is crucial for the safe operation of trains. The “shaking” phenomenon often occurs in the bridge–embankment transition section in high-speed trains in strong wind environments. This paper takes the Lanzhou–Urumqi Railway as the research object to investigate the influence of a wind–sand two-phase flow in a wind–sand area on the aerodynamic characteristics of a high-speed train running in the bridge–embankment transition section. The results reveal the “sudden change” influence of sand particles and different subgrade cross-section structures on the lateral loads of trains. This work can provide a theoretical basis for the stable operation of high-speed trains in the transition sections between bridges and embankments.

2. Numerical Simulation Method

2.1. Mathematical Model

Wind–sand flow is a typical gas–solid two-phase flow that describes the movement of sand particles on the surface under the driving force of the atmosphere. In this work, the train speed was set as 250 km/h, the maximum crosswind speed was 40 m/s, and the Mach number was less than 0.3, indicating that the fluid can be regarded as an incompressible fluid [18]. The wind–sand flow was simulated by the Euler–Euler two-phase flow model. The continuity equation is described as follows:
t ( α q ρ q ) + ( α q ρ q v q ) = p = 1 n ( m p q m q p )
and the momentum equation is expressed as
t ( q ρ q v q ) + ( α q ρ q v q 2 ) = α q P + τ q + α q ρ q g + p = 1 n ( R p q + m p q v p q m q p v q p ) + F q
where t is the time; g is the acceleration of gravity; P is the same pressure shared by all items; Fq is the external force; αq, ρq, and vq are the volume fraction, density, and velocity of the first phase, respectively; mpq is the mass transfer from phase q to phase p; mqp is the mass transfer from phase p to phase q; τq is the stress–strain tensor of phase q; vpq is the mass transfer rate from phase q to phase p; vpq is the mass transfer rate from phase p to phase qi; and Rpq is the interaction force between phases.
The flow phenomena related to the wind–sand two-phase flow and train are mainly turbulent flows. Therefore, in order to simulate the turbulence of the air flow field around the train, the SST k-ε two-equation model is used, which does not depend on the wall function. This ensures the reasonable transition of the boundary layer from the near-wall region of the model to the far-field region of the flow field through the mixing function. As a consequence, the accuracy and stability of the boundary layer calculation is improved.
D ρ k D t = τ i j u i x j β * ρ ω k + x j [ ( μ + σ k μ t ) k x j ]
D ρ ω D t = γ v t τ i j u i x j β μ ω 2 + x j [ ( μ + σ ω μ t ) ω x j ] + 2 ρ ( 1 F 1 ) σ ω 2 1 ω k x j ω x j
where the turbulent viscosity coefficient μ t is expressed as follows
μ t = ρ α 1 k max ( α 1 ω ;   Ω F 2 )
where α1 = 0.31; Ω is the mean angular velocity tensor; σk1 = 0.85; σω1 = 0.85; β1 = 0.075; β*= 0.09; κ = 0.41; and γ 1 = β 1 / β * σ ω 1 κ 2 / β * .

2.2. Sliding Mesh Method

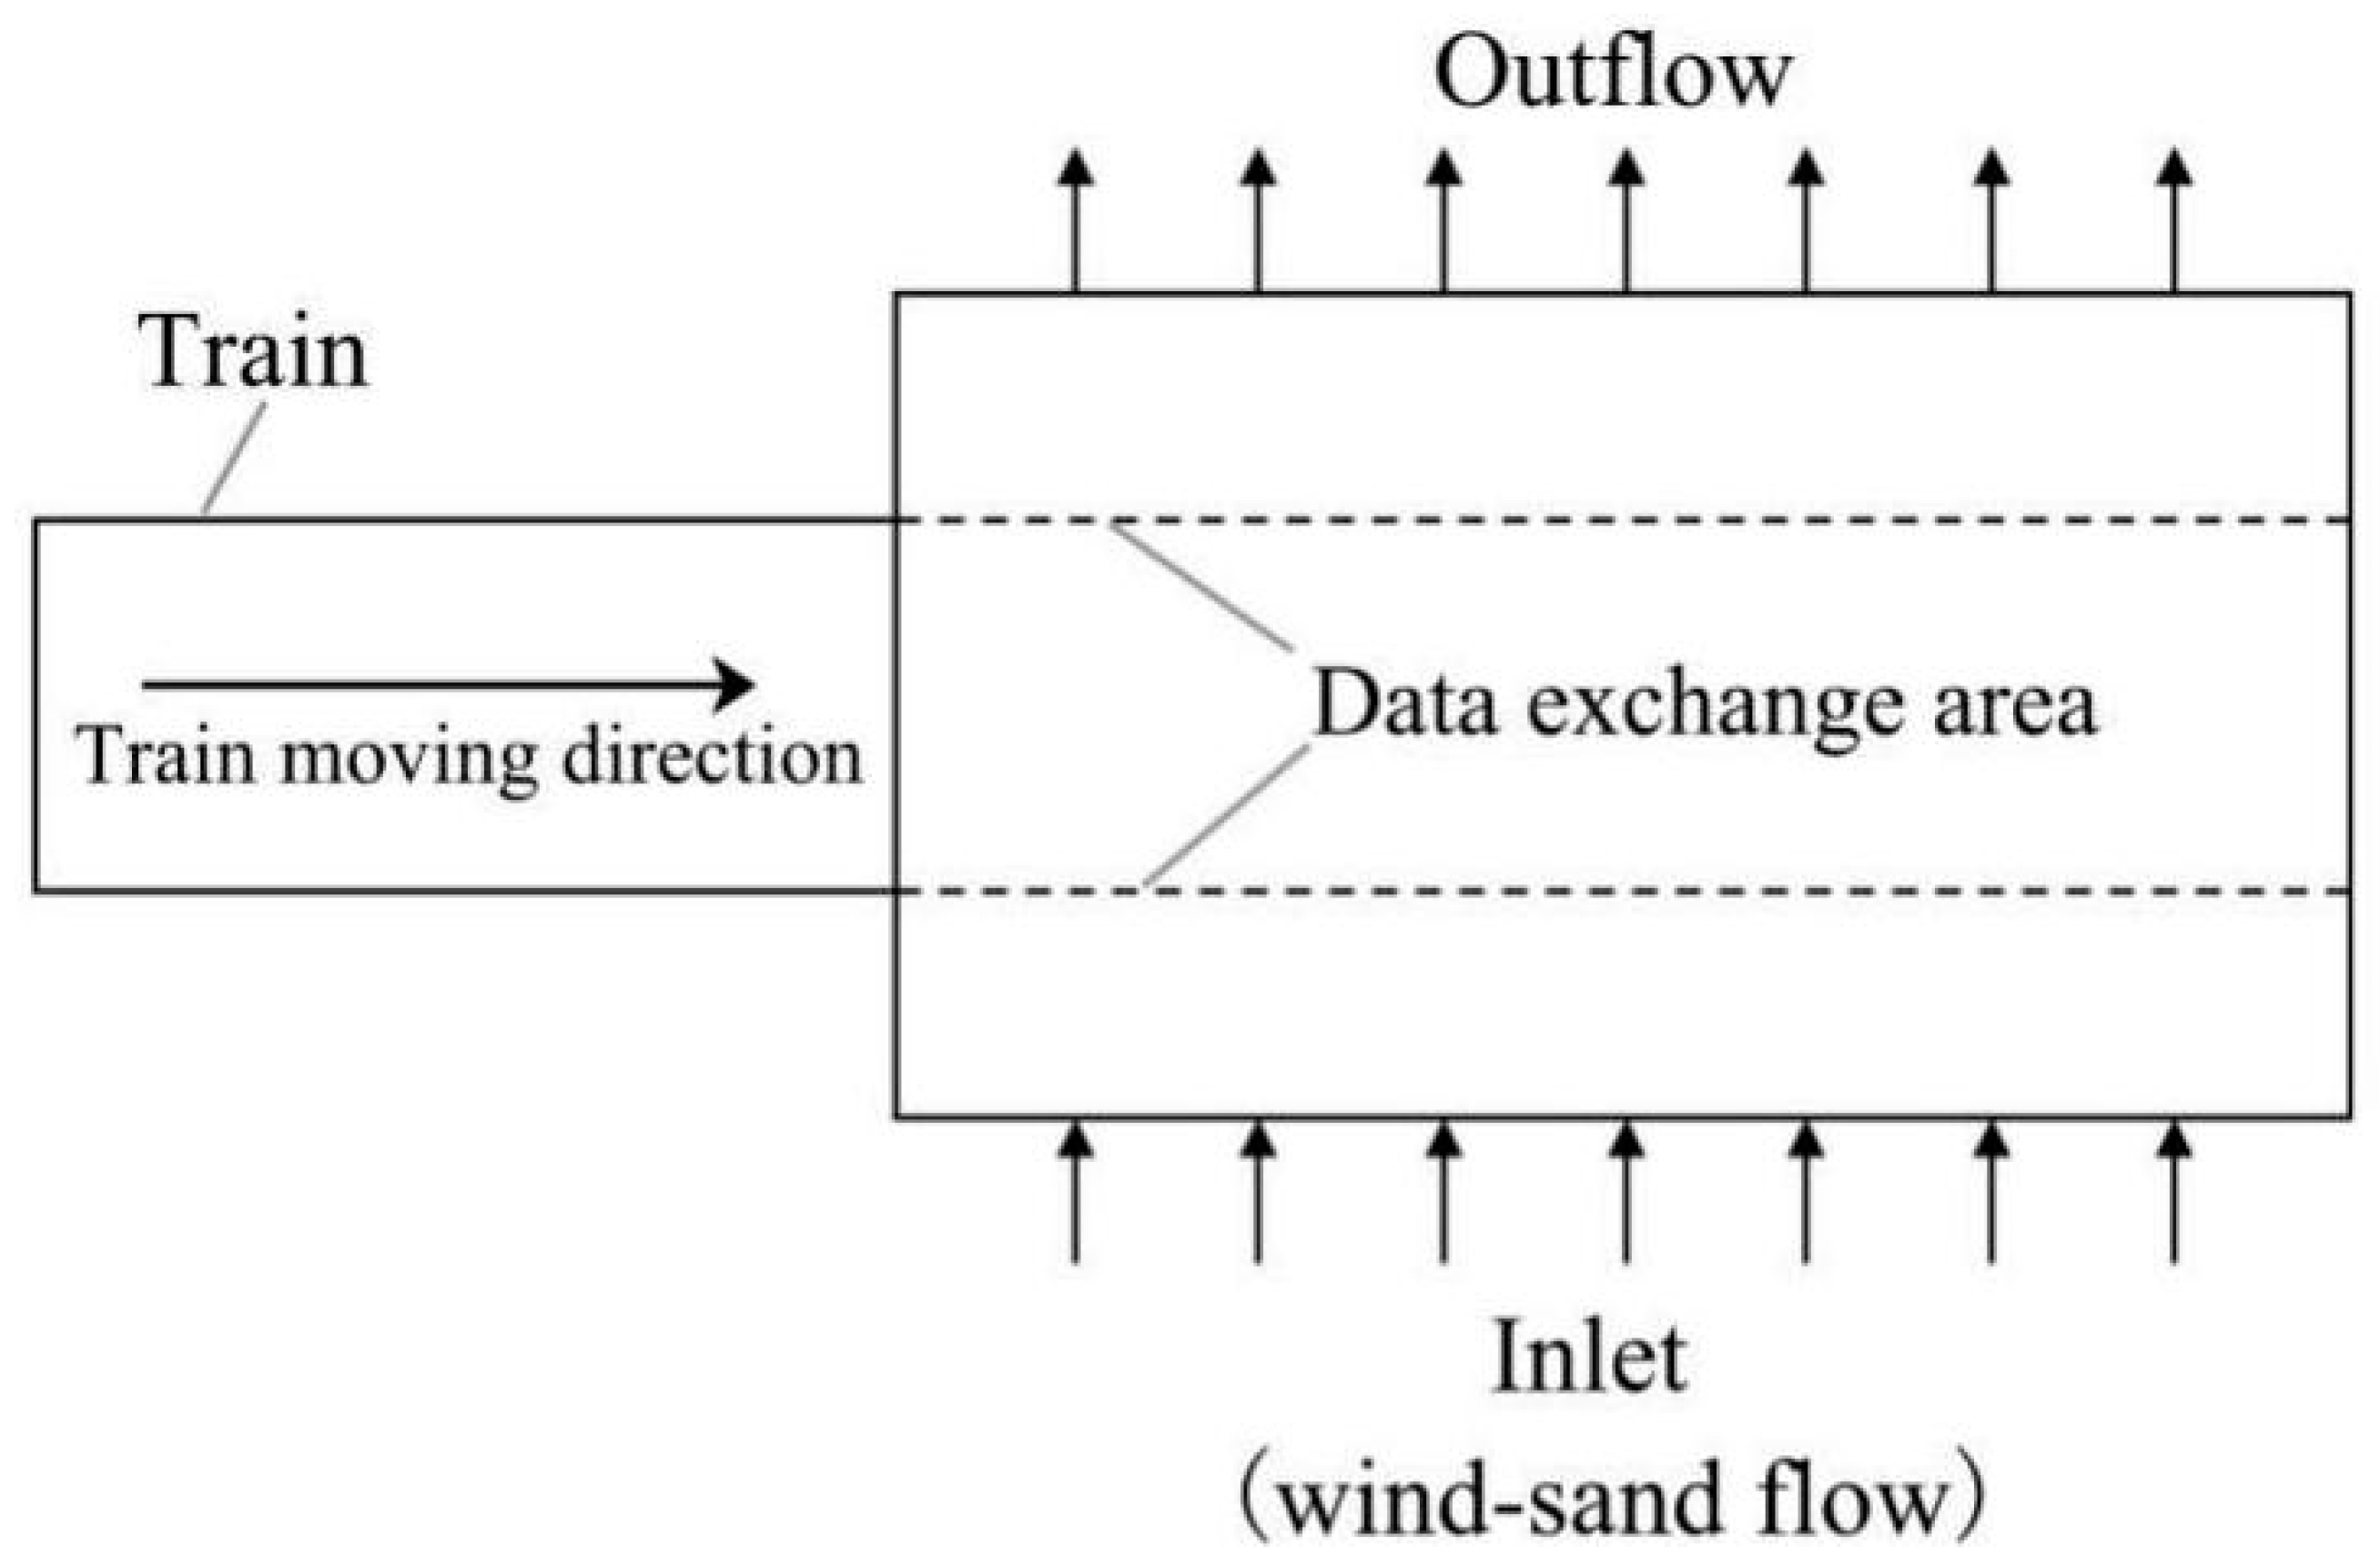
The aerodynamic characteristics of trains are generally investigated based on two methods, namely the train stationary and train motion methods. The train motion simulation method has relatively poor timeliness, but it can accurately reflect the real operation of the train under crosswind. In this paper, the sliding grid method is adopted to simulate the aerodynamic performance of trains in transverse wind–sand flow. The areas used for the calculation of the train sliding motion are the train area, transverse wind–sand flow area, and data exchange area. The train area moves from left to right at a constant speed. The train area and transverse wind–sand flow area can exchange data through the data exchange area. Compared with the moving mesh technology, the sliding grid does not need mesh reconstruction and also improves the computational efficiency when solving the relative motion of the trains. Figure 3 presents the schematic diagram of the train motion calculation area.

2.3. Wind Speed Profile and Sand Volume Fraction

The roughness near the ground in wind–sand areas is large, and thus the wind speed near the ground has a logarithmic distribution. In this paper, the crosswind velocity is calculated using the Prandtl–Karman logarithmic equation and is loaded into Fluent through the user-defined function (UDF) program. The equation is described as follows:
u y = u * k ln y y 0
where uy is the wind speed; y is the distance from the ground, m/s; u* is the friction wind speed, m/s; k is the Karman constant, taking the value of 0.4; y0 = d/30; and d is the diameter of the sand particles, which is set as 0.1 mm in this paper.
The volume fractions of sand particles in the air vary with the crosswind speed. Previous work has calculated the volume fractions of sand particles with a density of 2650 kg/m3 at different crosswind speeds using field measurements [14]. Table 1 presents the volume fractions of sand particles at different crosswind speeds.

2.4. Simulation Parameters

Table 2 presents the simulation parameters used in this paper.

2.5. Verification of Numerical Simulation Results

Numerical simulations can be used to investigate the aerodynamic characteristics of high-speed trains. However, in order to ensure the rationality and accuracy of the numerical calculation results, the feasibility of the numerical calculation method needs to be verified.
In this paper, the simulation test results are compared with those in the literature [14]. The turbulence model (SST κ-ω), multiphase flow model (Euler–Euler), train model, crosswind loading method, and the loading settings of the sand velocity and sand volume fraction used here are essentially consistent with those in the literature. The road condition used for the verification of the numerical simulation method is flat ground, and the resistance and side force characteristics of the high-speed train under the non-sand and wind–sand conditions are compared and verified.
Figure 4 presents the train resistance coefficient curves under different working conditions. The drag coefficient of the train initially increases and subsequently decreases gradually as the wind speed increases. When the wind speed is 10 m/s, the error between the calculated train drag coefficient and the test data from the literature is maximized, with errors of 5.25% and 4.91% under the wind–sand and non-sand conditions, respectively. In engineering, the calculation error is generally required to be less than 10% [15]. Therefore, the numerical calculation method and model grid quality used in this paper are determined to be reasonable and feasible.

3. Model and Calculation Domain

3.1. Train and Bridge–Road Transition Section Model

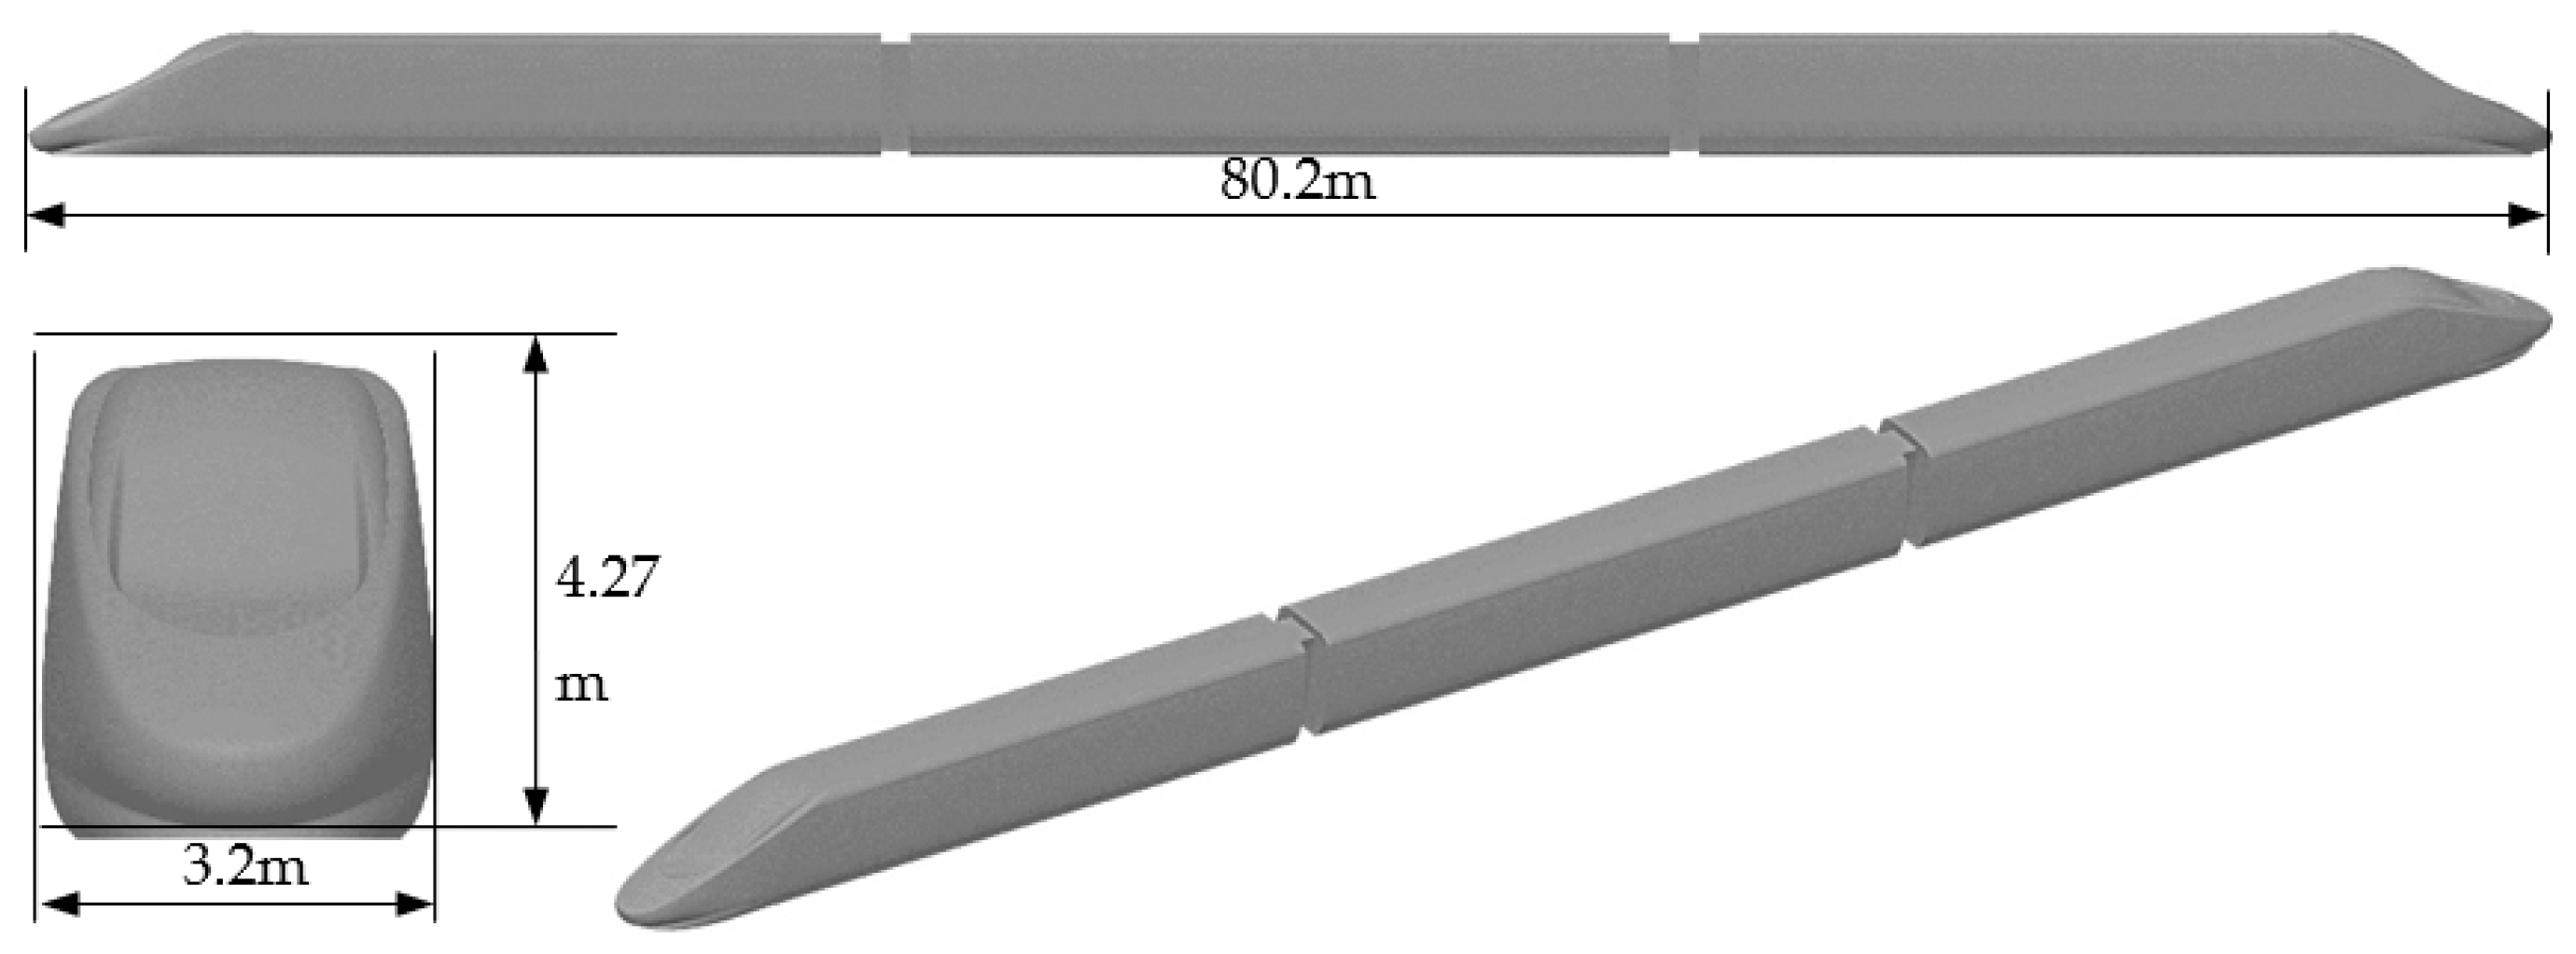
Three car formations (head car/head train + middle car/middle train + tail car/tail train) were selected to establish the three-dimensional model. The lights, windows, door handles, and windshields of the EMU were simplified appropriately, ignoring pantographs, wipers, and bogies. The lengths of the head train and tail train were both 27.6 m, the length of the middle train was 25 m, the total length of the train was 80.2 m, the height of the train was 4.27 m, and the width of the train was 3.2 m. Figure 5 presents the three-dimensional solid model of the train.
Through the three-dimensional design of the bridge–embankment transition area, the relevant simplification principles of the model were used to appropriately simplify the high-speed train and bridge–road transition section. Figure 6 presents the three-dimensional model and location coordinates of the train running in the bridge–embankment transition section.

3.2. Computational Domain and Boundary Conditions

In order to accurately describe the aerodynamic characteristics of the train running in the bridge–embankment transition section, the sliding grid method is used for the numerical simulations. The computational domain is composed of two fluid domains. Fluid Domain 1 contains the train and moves at a speed of 250 km/h in the opposite direction of the x-axis. Fluid Domain 2 is the crosswind data exchange area. The boundary surface between the two fluid domains is denoted as the data exchange surface for the data exchange.
The boundary conditions of the fluid domain in the x-axis direction are the pressure inlet and pressure outlet, respectively. Fluid Domain 2 in the y-axis direction is the crosswind boundary. The crosswind inlet and outlet boundaries are the velocity inlet and pressure outlet, respectively. The velocity inlet boundary conditions include both the air phase and sand phase. The air phase adopts the velocity type wind field at the bottom of the atmosphere, and the initial velocity of the sand phase is 1/5 of the velocity of the air phase. The change in air phase and sand phase velocity in the vertical height is compiled into Fluent using the UDF function. The trains, embankments, bridges, and the ground are non-slip walls. Fluid Domain 1 is initially static at the beginning of the computation, and the wind–sand two-phase flow is loaded at the velocity inlet boundary of Fluid Domain 2. Once the flow field has stabilized, the slip velocity of Fluid Domain 1 is obtained, and the velocity value is the train velocity. The time step of the numerical calculation is set as 0.005 s and the common total time is 1.7 s.

3.3. Grid Division

High-quality grids are key to the convergence and accuracy of the results. Due to the complex structure of the embankment, bridge, and streamline position of the train, the unstructured grid was adopted in the computational domain, and the grid was dandified in a certain area around the head train and body. The boundary layer grid near the wall of the train has 10 layers. The height of the first layer grid is 0.2 mm, the growth rate is 1.25, and the total number of grids is 1.5 × 10⁷. Figure 7 presents the schematic diagram of the computational domain grid division.

4. Results and Discussion

4.1. Variation Characteristics of Wind–Sand Flow Velocity around Different Lines

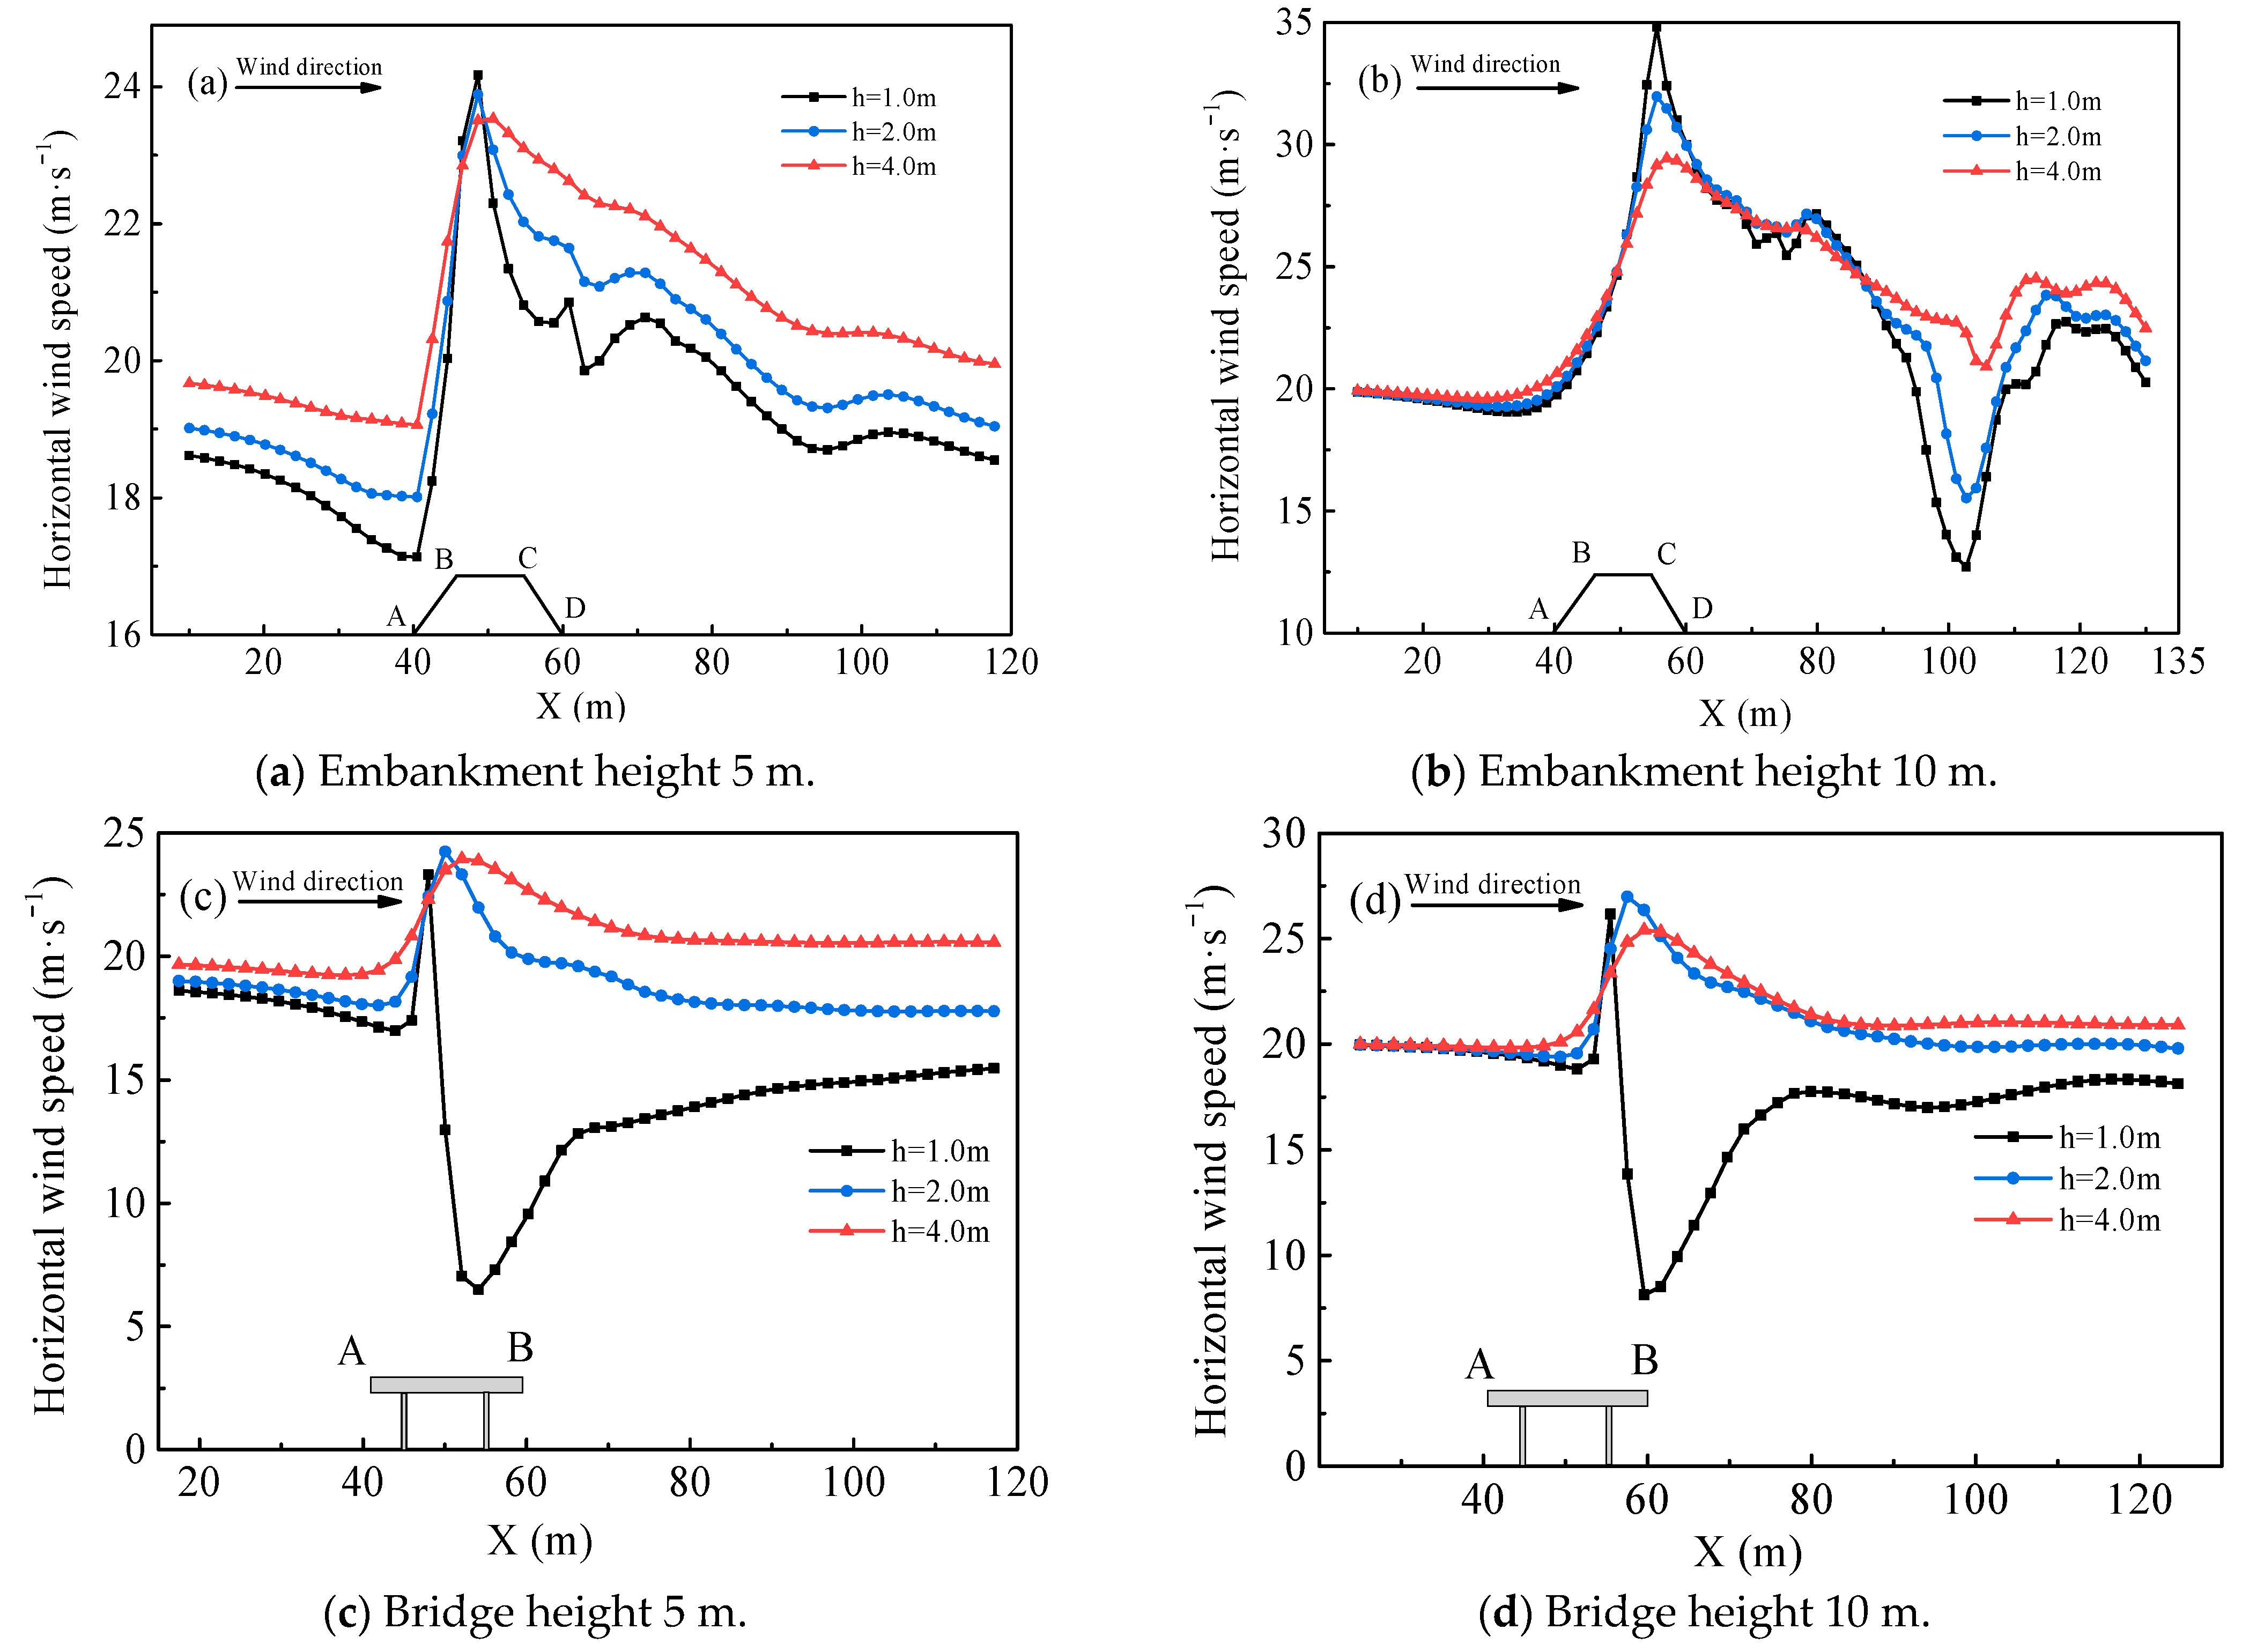
The velocity variation of the transverse wind–sand flow around different lines was observed to vary greatly. The crosswind speed was selected as 20 m/s. Taking embankments and bridges of different heights as the research objects, the variation characteristics of the horizontal wind speed at different heights from the top of the embankments and bridges were analyzed. Figure 8 presents the variation curves of the horizontal wind speed around different lines.
Figure 8 shows that when the embankment heights are 5 m and 10 m, respectively, the horizontal wind speed of the windward slope (section AB) increases rapidly due to the blocking of the transverse wind–sand flow, and the horizontal wind speed at the top of the windward slope (point B) is the largest. The wind speed is maximized at point B of the embankment, 1 m away from the top of the embankment. When the heights of the bridge are 5 m and 10 m, respectively, the crosswind speed at point A at the windward end is the largest, and there is no obvious difference in the peak speed at point A at different heights from the top of the bridge. At the same height, the wind speeds of section BC on the top of the embankment and section AB of the bridge gradually decrease, and the wind speed appears at a 1 m height from the bridge deck under the bridge structure. When both the embankment and bridge heights are 5 m or 10 m, the crosswind speed of section BC of the embankment is greater than that of section AB of the bridge at the same height from the top surface. This indicates that the acceleration effect of the embankment on the transverse wind–sand flow is more obvious than that of the bridge. The is because the embankment is a solid structure and has an acceleration effect on the wind speed at the top surface, while the bridge has large wind permeability and a small acceleration effect on the wind speed.

4.2. Pressure Distribution around and on the Surfaces of High-Speed Trains

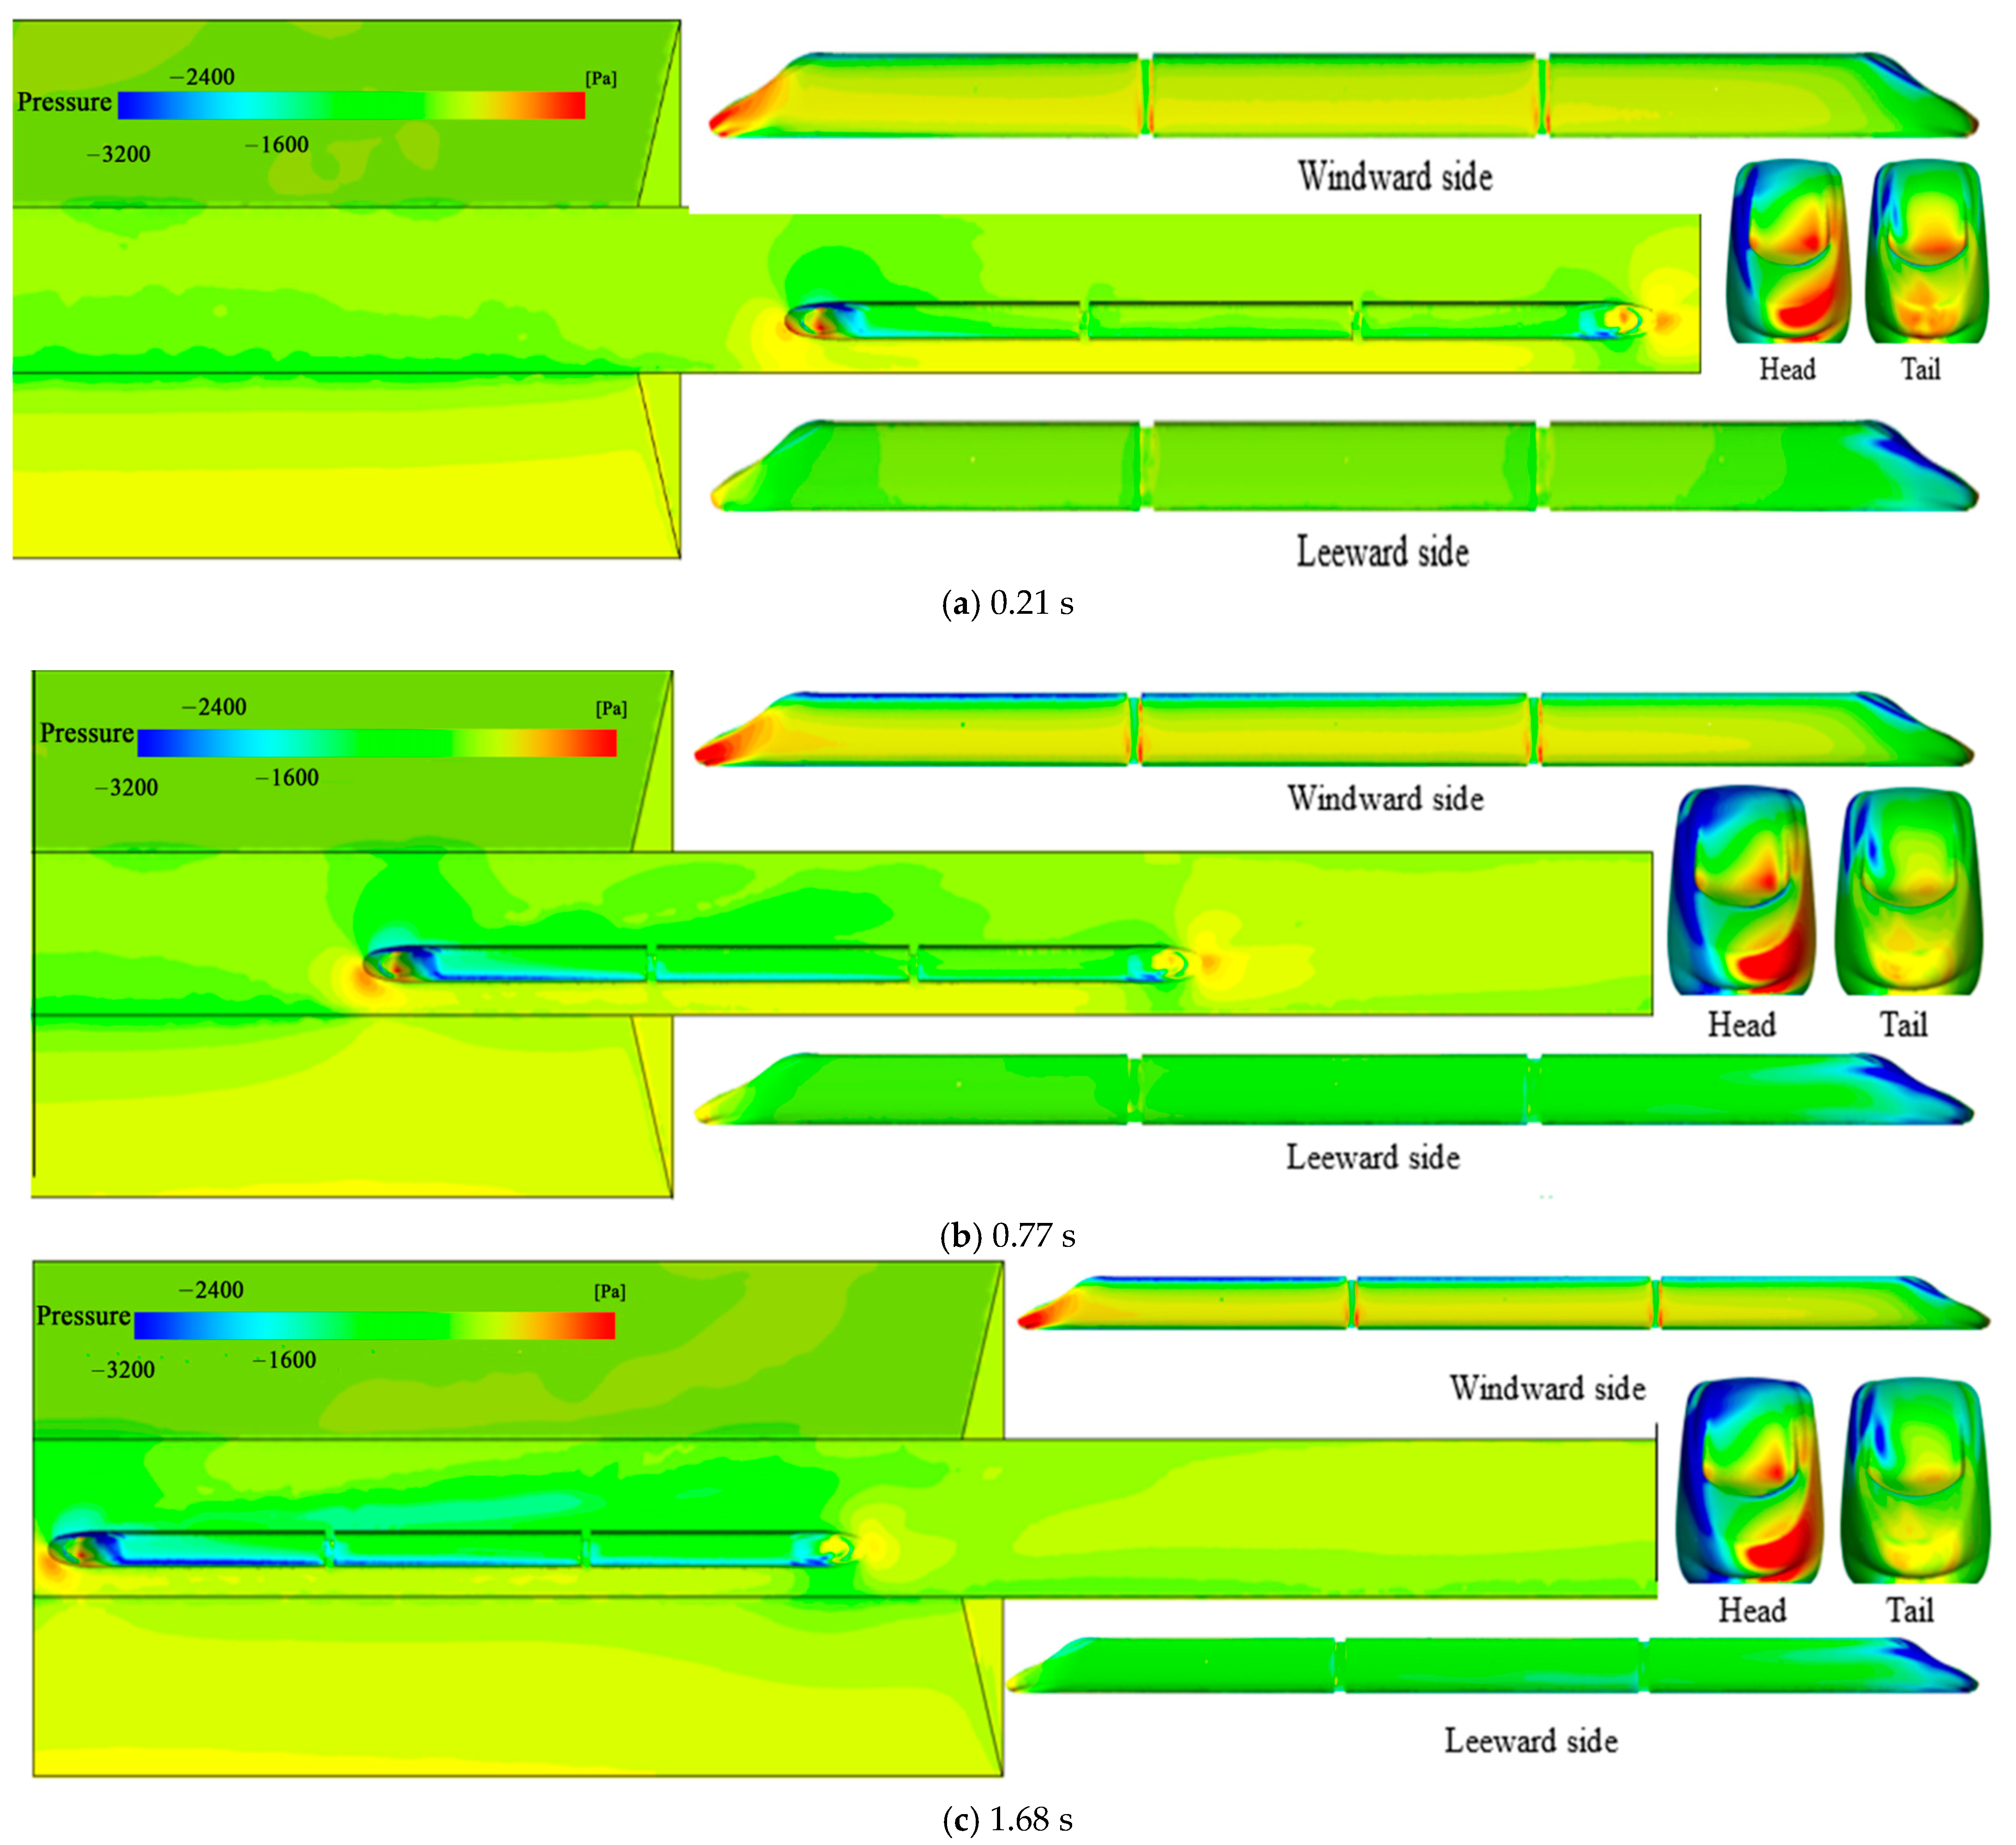
In this section, the vehicle speed and wind speed are selected as 250 km/h and 20 m/s, respectively. We perform numerical simulations of the aerodynamic characteristics of the high-speed train passing through the 10 m bridge–embankment transition section. The nephograms of the surrounding and surface pressure distribution of the train at t = 0.21 s, t = 0.77 s, and t = 1.68 s are then compared and analyzed. Figure 9 presents the nephograms of the surrounding and surface pressure changes of the high-speed train at the bridge–embankment transition section.
When the high-speed train is driving from the bridge to the embankment, due to the differences between the bridge and embankment structures, the wind–sand flow velocity obviously varies with the different lines. This results in huge differences in the flow field around the bridge and embankment, and thus the pressure around and on the surface of the train at different running moments is also distinct.
At time t = 0.21 s, the train is running smoothly on the bridge, and the positive pressure zone area on the windward side of the head train is relatively large and gradually decreases along the opposite direction of the train operation (Figure 9). In addition, the leeward side of the head train exhibits negative pressure, yet the area of the negative pressure zone is relatively small. At time t = 0.77 s, the head train has completely driven into the embankment, and the ground effect at its nose cone is further strengthened. The positive pressure zone area at the front windshield of the head train is reduced, while the negative pressure intensity and negative pressure zone area at the leeward side of the driver’s cab increase. Moreover, the positive pressure zone area at the windward side of the head train is obviously enhanced and a strong negative pressure zone appears at the connection area between the windward side wall and head train roof. This is due to the windward slope of the embankment, which changes the direction of the lateral wind–sand flow to be parallel to the windward slope. As a consequence, the air flow and collision of the windward side wall surface of the train are separated at the connection between the top of the side wall and the roof, while the negative pressure zone area on the roof of the head car also further increases. At time t = 1.68 s, the train has completely driven into the embankment from the bridge, and the positive pressure area on the windward side of the train and negative pressure area on the leeward side of the train are maximized and maintained at this level. In general, as the train drives from the bridge into the embankment, the pressure difference between the two sides of the train will change abruptly, with the pressure change on the surface of the head car as the most obvious.

4.3. Pressure Variation of Measuring Points on the Surface of the High-Speed Train

We arranged several measuring points on the train body in order to evaluate the pressure changes on both sides of the body of the high-speed train operating from the bridge to the embankment. Among the measuring points, P1, P3, P5, P7, P9, P11, and P13 were on the windward side of the train, while the remaining measuring points were on the leeward side. The measuring points were symmetrically arranged (Figure 10).
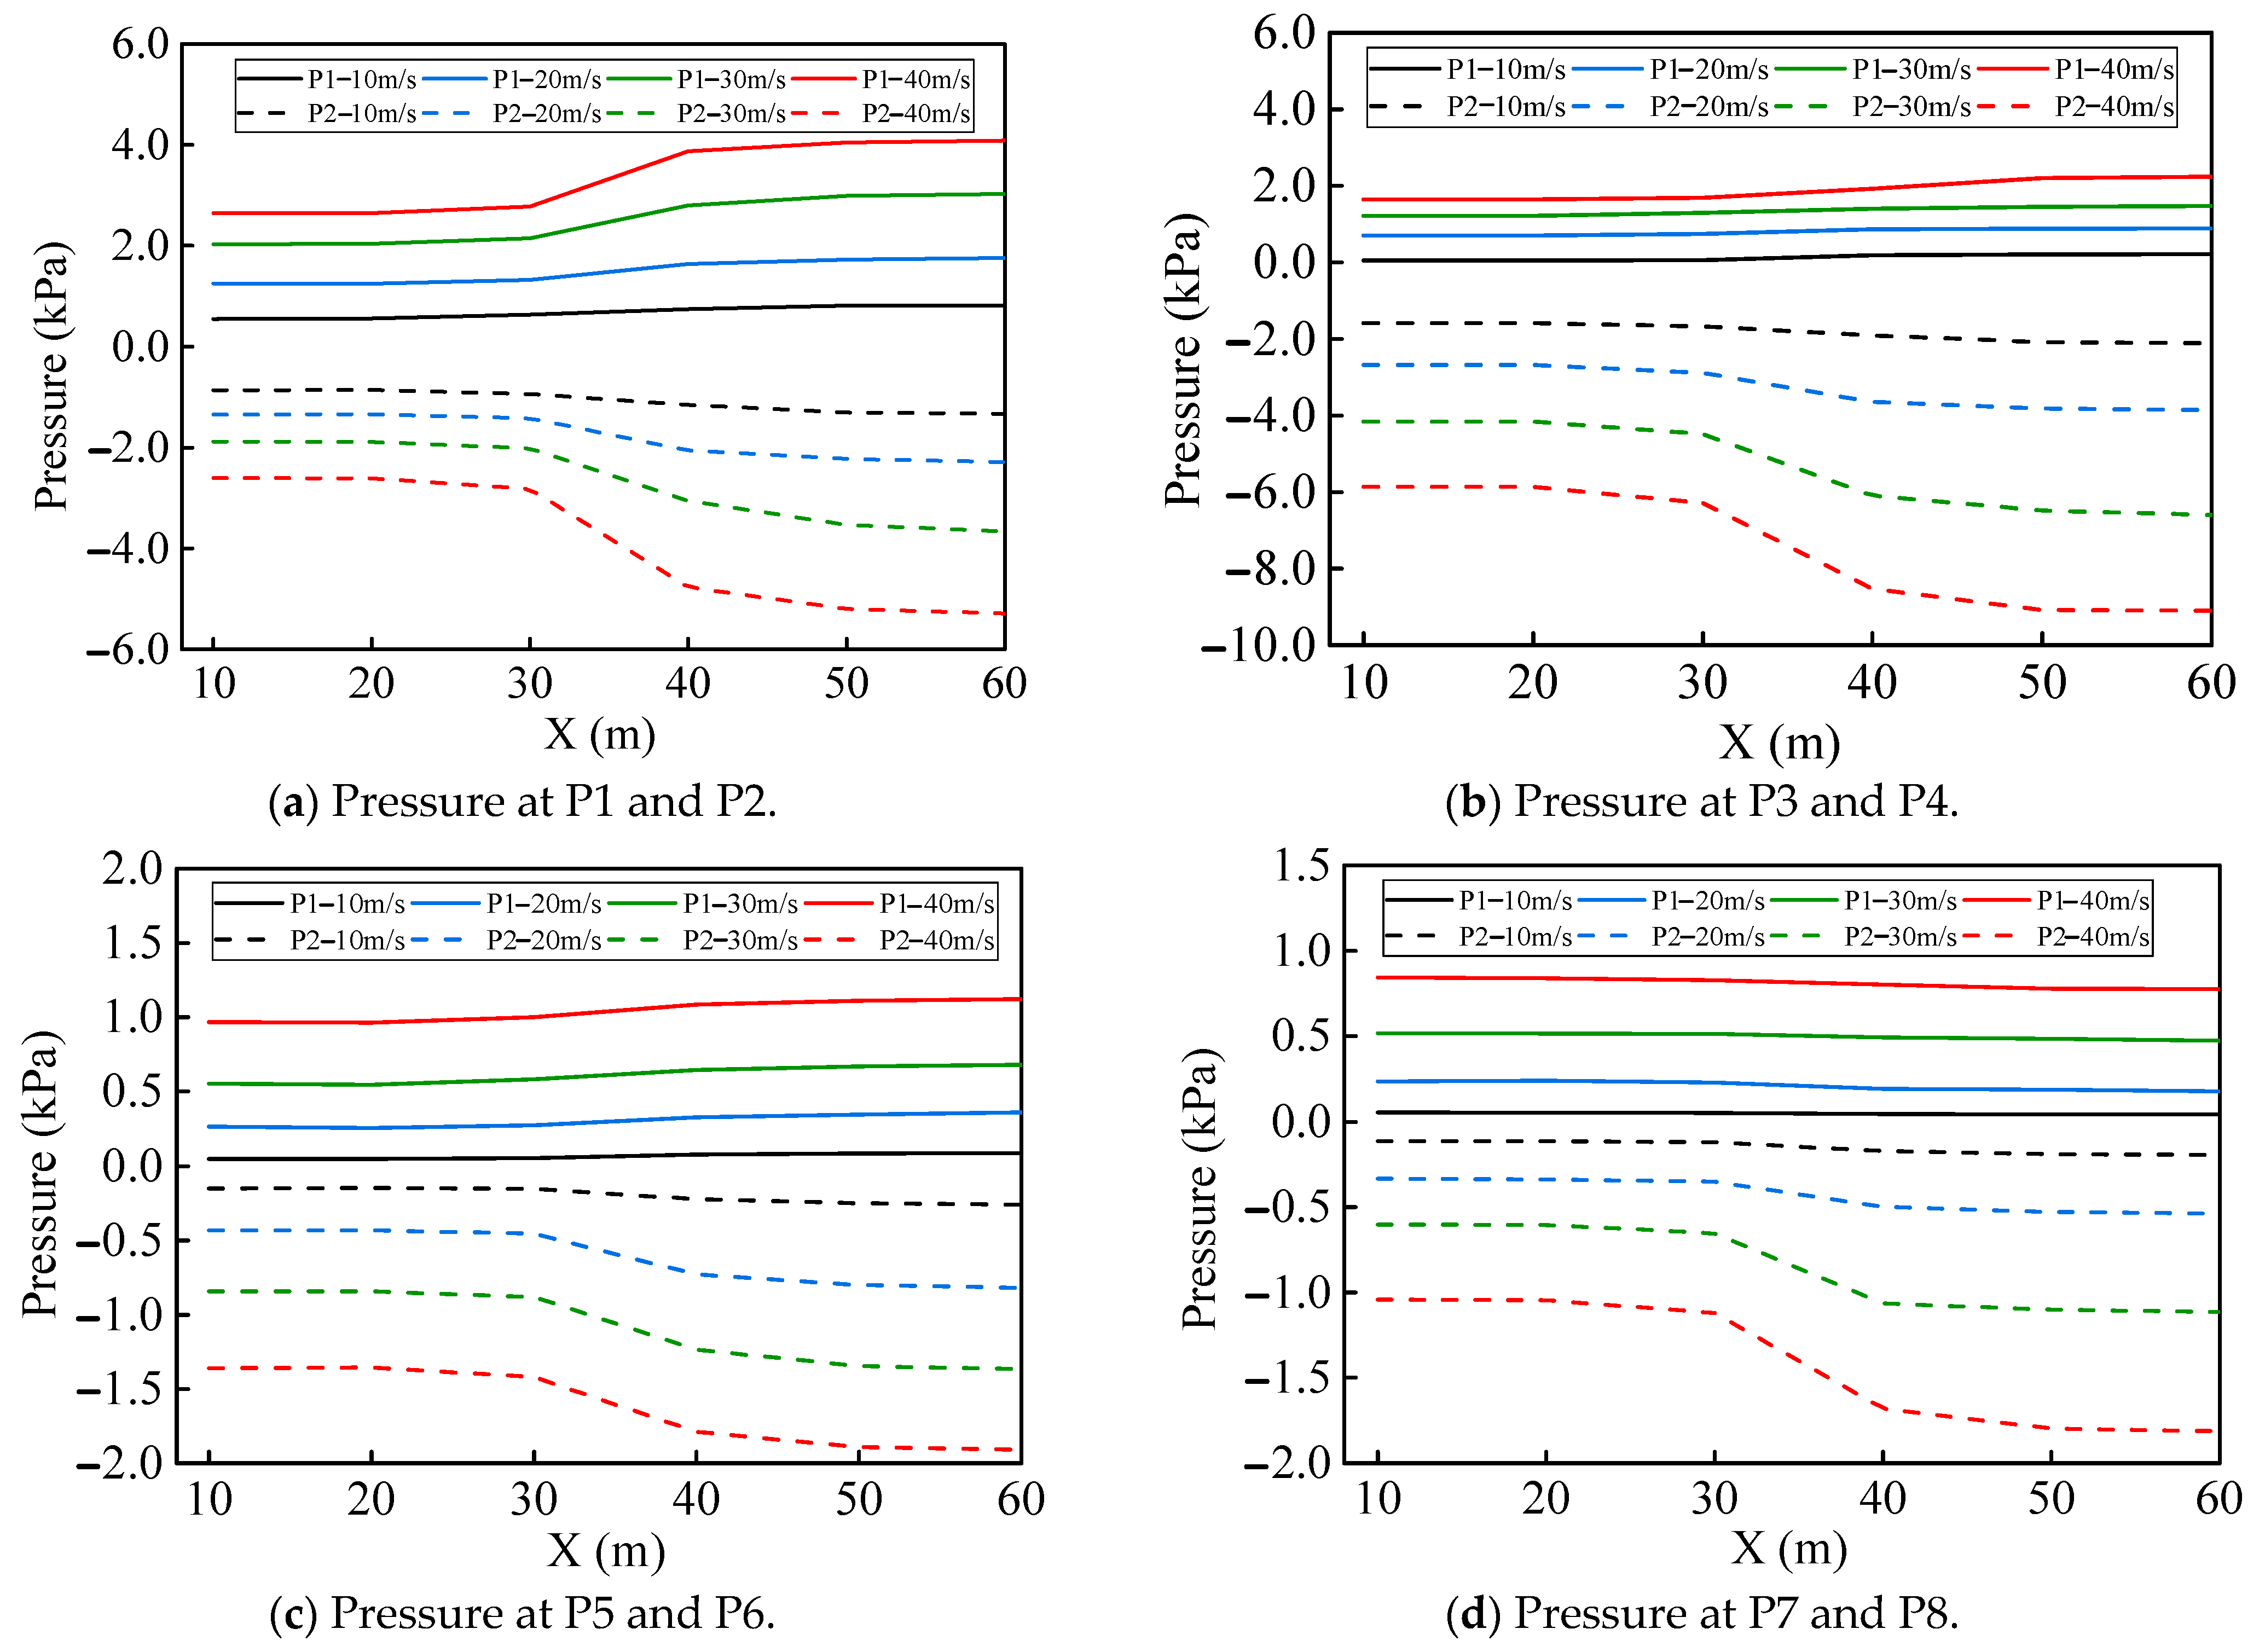
The pressure at each measuring point of the high-speed train body varies with the position of the bridge–embankment transition section. Figure 11 presents the pressure curves of each measuring point of the high-speed train under wind–sand conditions.
When the train travels from the bridge to the embankment, measuring points P1, P3, and P5 on the windward side of the head train have positive pressure and exhibit a growing trend, with P1 presenting the largest pressure increase. Measuring points P2, P4, and P6 on the leeward side of the head train have negative pressure and exhibit a decreasing trend, with the pressure at P4 presenting the greatest reduction. As the transverse wind–sand flow velocity increases, the pressure change trend of each measuring point is essentially equal, yet the pressure of the measuring points on the windward side of the head train at the same position increases, while the pressure of the measuring points on the leeward side decreases. The pressure difference between the symmetrical measuring points on both sides of the train body under the embankment is larger than that under the bridge. Moreover, the pressure difference between measuring points P3 and P4 of the head train is the largest. The pressure at P7 on the windward side of the train middle is positive, while the pressure at P8 on the leeward side is negative. In addition, the pressure at these two points exhibits a decreasing trend, in which the pressure reduction at measuring point P8 is much greater than that at measuring point P7.
Measuring point P9 on the windward side of the tail train has positive pressure, while both P11 and P13 have negative pressure. P9 has the largest pressure, followed by P11, while the pressure of P13 is the smallest. Measuring points P10 and P12 on the leeward side have negative pressure, and point P14 has positive pressure when the wind speed is small. P14 has the largest pressure, followed by P12, and the pressure of P10 is the smallest. Under the same wind speed, the pressure at measuring points P12 and P14 on the leeward side of the tail train is greater than that at the measuring points on the windward side. This indicates that the directions of the pressure differential force at both ends of the tail train are opposite.
The pressure differential force of the train running on the embankment is generally greater than that on the bridge, and the pressure differential force on both sides of the head train is the largest. When the train runs in the reverse direction, the pressure differential force on both sides of the train gradually decreases. The pressure differential force direction at the front of the head, middle, and tail train goes from the windward side to the leeward side, while the pressure differential force direction at the driver’s cab of the tail train goes from the leeward side to the windward side. According to the Bernoulli Principle, this is consistent with the above wind speed analysis.

4.4. Aerodynamic Load Variation of the High-Speed Train

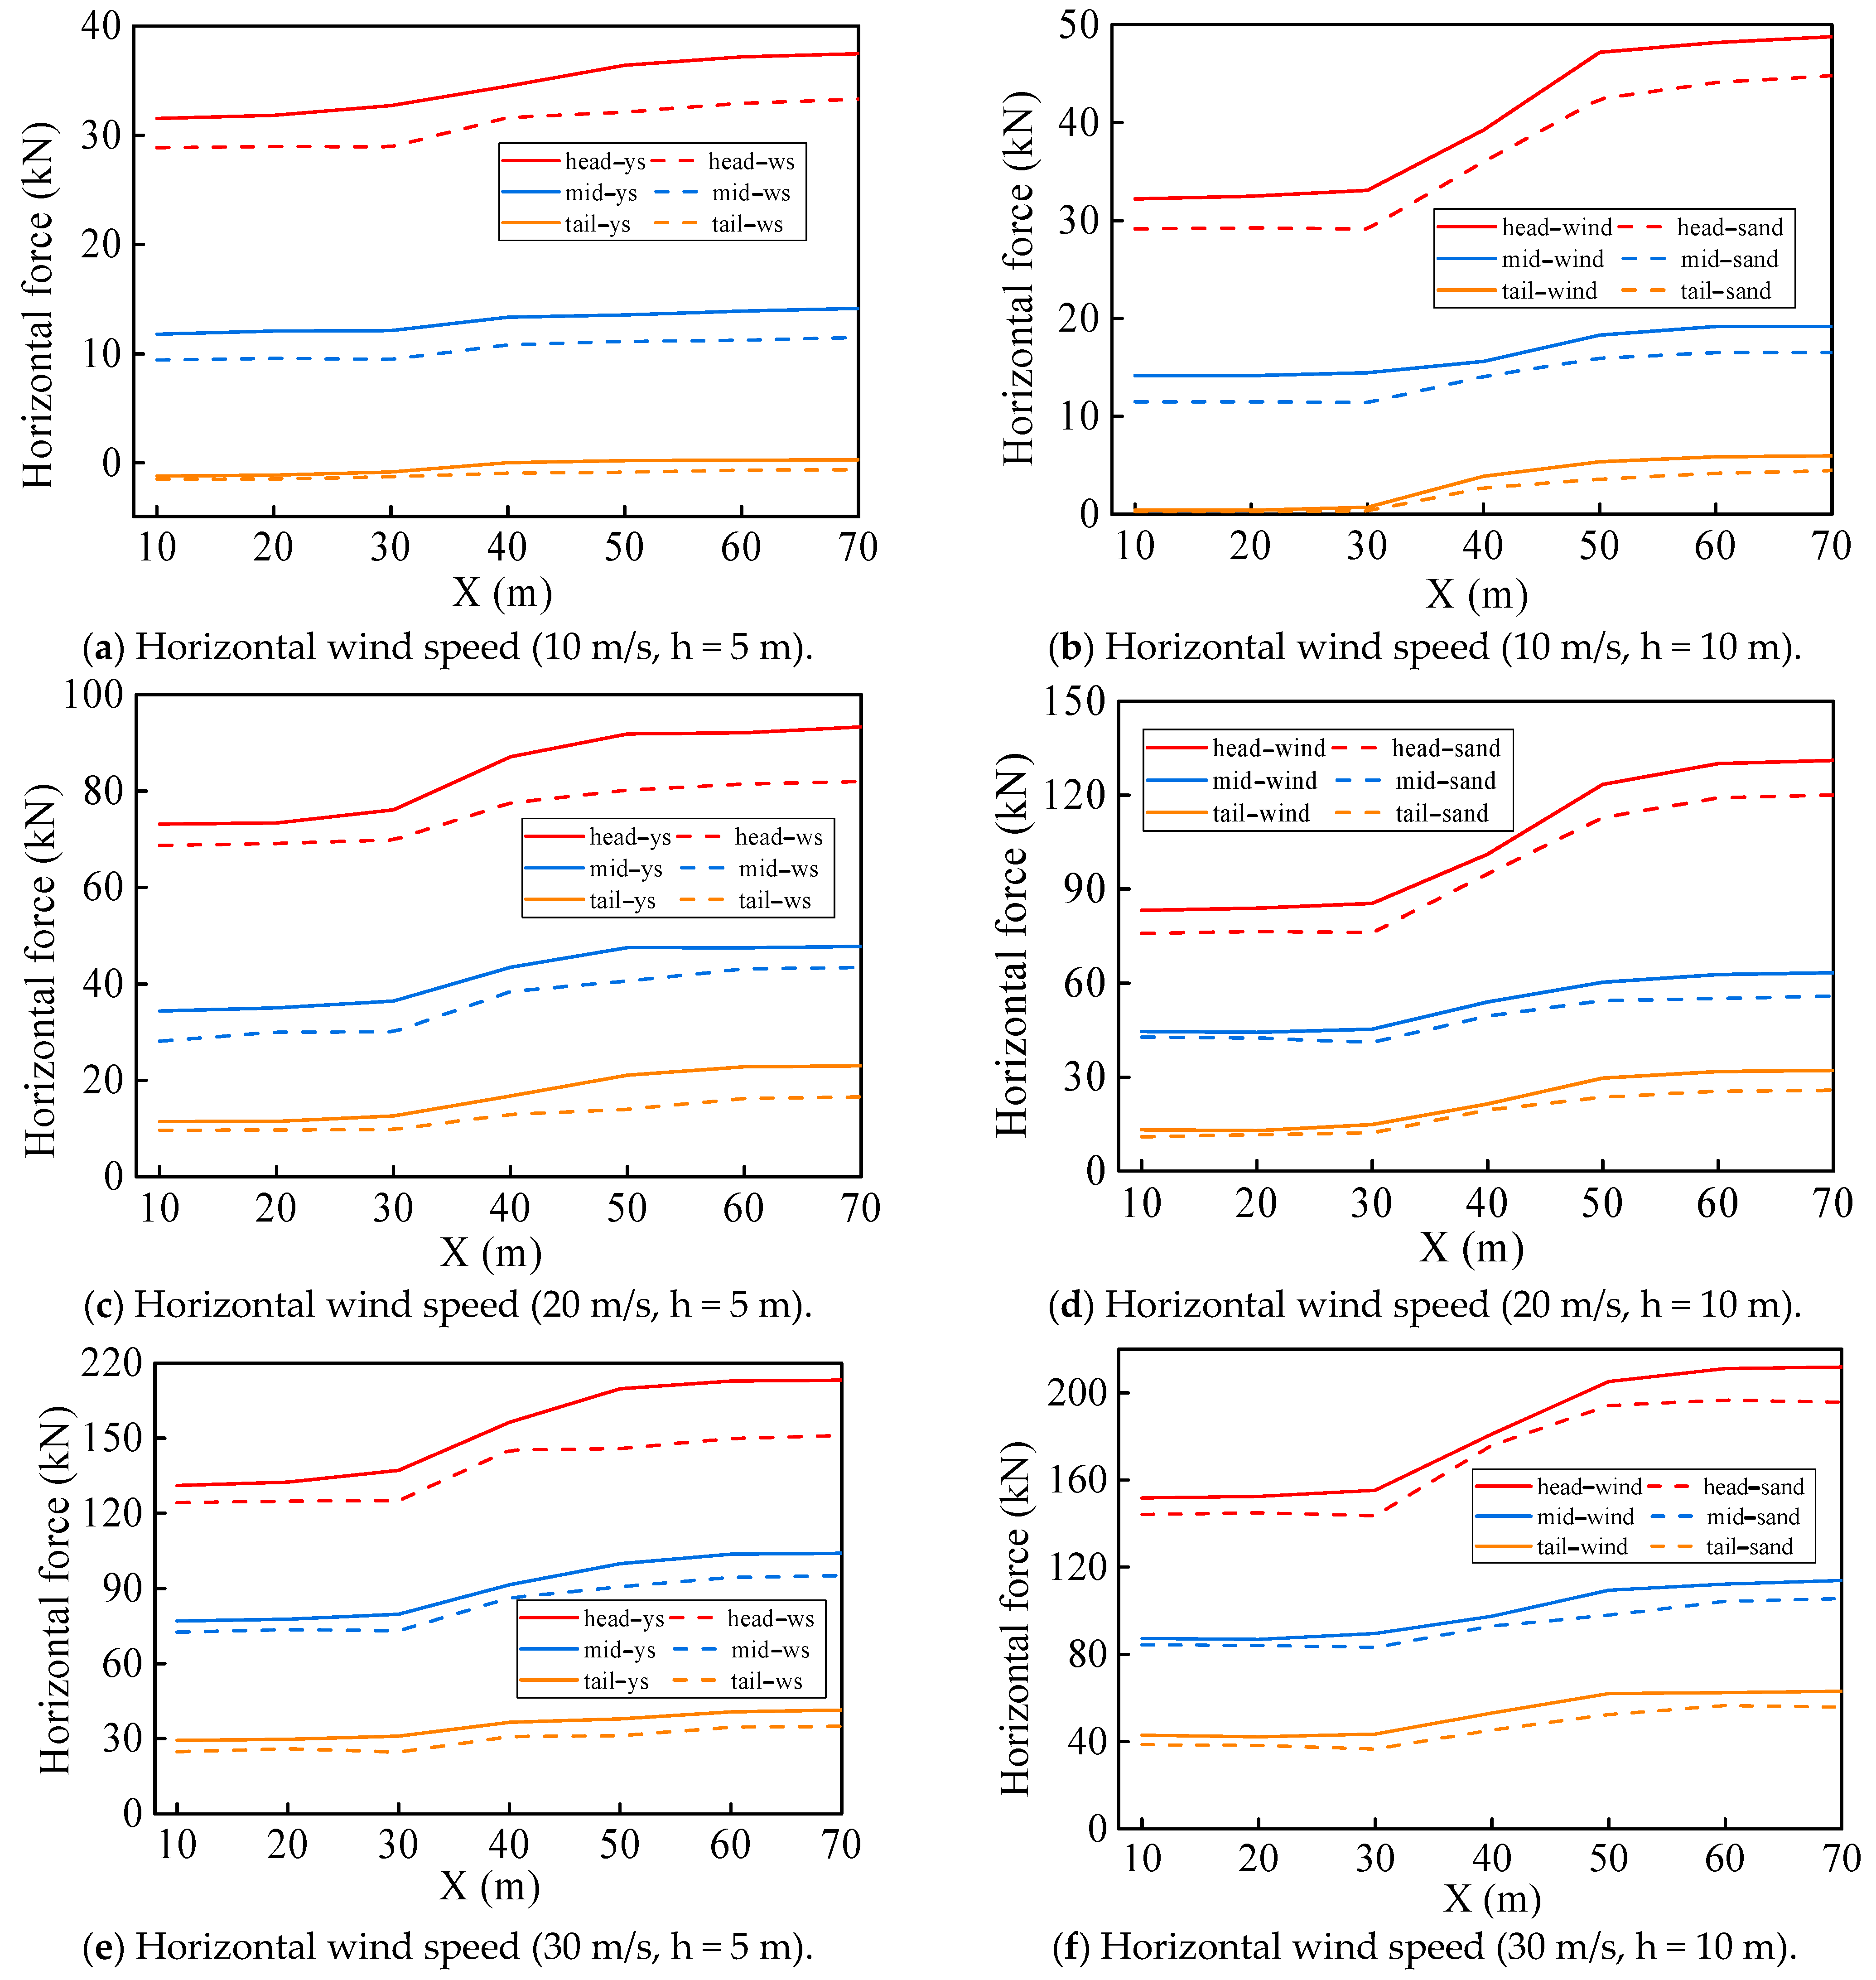
We subsequently investigated the cross aerodynamic load change laws of train operations under non-sand and wind–sand conditions, based on different bridge–embankment transition section heights and crosswind speeds. Under non-sand conditions, when the high-speed train travels from the bridge to the embankment, the lateral force on the train suddenly increases (Figure 12). For the same wind speed, the increase in the lateral force of the train running at the 10 m transition section generally exceeds that at the 5 m transition section. The lateral force increase of the head train is greater than that of the middle and tail trains. Moreover, the increase in the lateral force of the train also varies in the transition section, with the head train exhibiting the largest increase, followed by the middle train, and the tail train presents the smallest increase.
Under the wind–sand condition, at the wind speed of 10 m/s, the average lateral force increases of the head, middle, and tail trains were approximately 12.1%, 31.6%, and 9.2%, respectively, compared with the non-sand condition, when passing through the 5-m-high embankment–bridge transition section. At the wind speed of 20 m/s, the corresponding average increases were 10.5%, 15.0%, and 6.1%, respectively, compared with the non-sand condition, when passing through the 5-m-high embankment–bridge transition section. At the wind speed of 30 m/s, the corresponding average increases were 10.9%, 8.1%, and 9.4%, respectively, compared with the non-sand condition, when passing through the 5-m-high embankment–bridge transition section. The change trend at the 10-m-high embankment–bridge transition section was similar to that at 5 m. The lateral force on different positions of the train under the wind–sand condition increased compared with that under the non-sand condition, with the average increases of the train body determined as 17.6% (10 m/s), 10.5% (20 m/s), and 9.5% (30 m/s). In general, when the train travels from the bridge to the embankment under the same wind speed, the lateral force will suddenly increase, with the increase for the 10 m transition section observed to be greater than that for the 5 m transition section.

4.5. Variations in the Aerodynamic Lateral Force Differences of the High-Speed Train

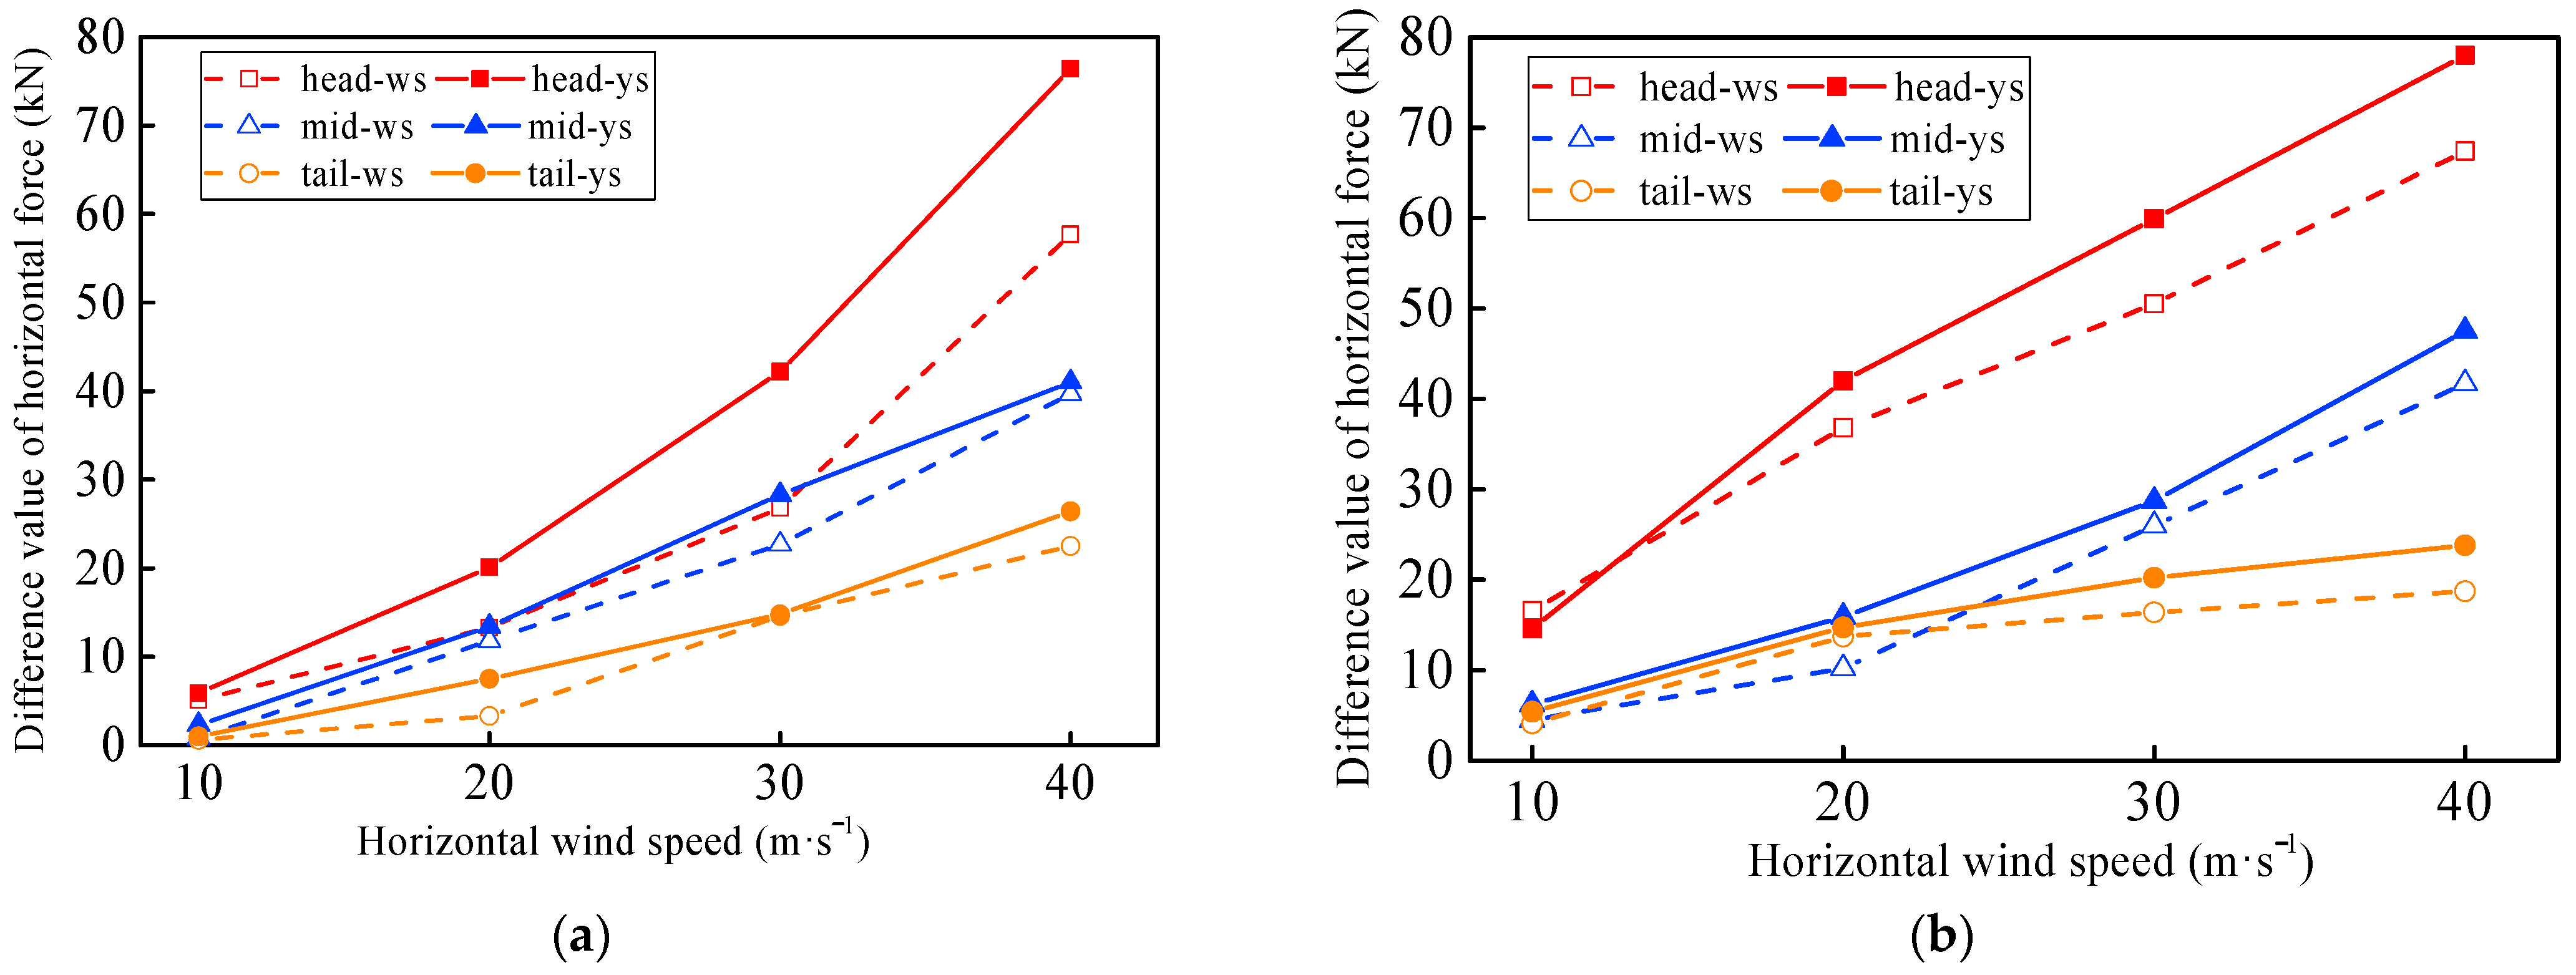
Under different working conditions, the difference in the lateral force of the train is equal to the lateral force of the train under the embankment working condition minus the lateral force of the train under the bridge working condition. Figure 13 depicts the variation curve of the train lateral force difference with the wind speed at transition sections of different heights.
The change trend in the lateral force of the train passing through the bridge–embankment transition section varies with the wind speed, and the lateral force difference of the train increases with the wind speed (Figure 13). In particular, the head train exhibits the largest difference in the lateral force under the same wind speed, with an obvious increase in amplitude with the increasing wind speed. Moreover, the lateral force difference of the head train running in the 10-m-high transition section exceeds that in the 5-m-high transition section under the same wind speed. The lateral force differences of the middle and the tail trains running at the transition section at different heights exhibit similar change trends, but the lateral force difference of the middle train is greater than that of the tail train.
Compared with the non-sand condition, the lateral force difference of the train under the wind–sand condition increases, with the middle and tail trains exhibiting minimal changes. However, under different conditions, the increase in the lateral force difference of the head train continues to increase with the wind speed. For example, when the wind speed increases from 20 to 30 m/s, the lateral force difference of the head train running in the 5-m- and 10-m-high transition sections increases from 6.8 to 15.4 kN (126.5% increase) and from 5.2 to 9.4 kN (80.8% increase), respectively. Thus, the increase in the lateral force difference of the head train running in the 5 m transition section is greater than that in the 10 m transition section. This indicates that the influence of the wind–sand flow on the train running in the 5-m-high transition section is more obvious than that in the 10-m-high transition section.

5. Conclusions

In this paper, the aerodynamic response law of a train running in the bridge–embankment transition section is investigated under the wind–sand environment. The main conclusions are as follows:
(1)
As the train drives from the bridge to the embankment, the pressure values on the windward and leeward sides of the train change abruptly, with the head train exhibiting the largest change. Moreover, the sudden change in pressure on the train increases with the transverse wind–sand flow speed. As the cross-section structures of the bridge and embankment are different, the transverse wind–sand flow produces different subgrade flows around different lines. The embankment slope blocks the incoming flow near the ground, which enhances the speed of the air flow on the windward side of the embankment, and thus the body pressure on the windward side increases rapidly. Moreover, on the leeward side of the train, the generation, development, and shedding of a large number of vortices rapidly reduce the pressure, resulting in a sharp increase in the lateral force of the train. When the train runs on the bridge, the transverse air flow can pass above the bridge floor and between the piers, and the transverse flow will not be blocked and accelerated. Therefore, the train will suffer less transverse force under the same wind–sand flow speed compared to running on the embankment.
(2)
The differential pressure force of the train running on the embankment is greater than that on the bridge, and the pressure differential force on both sides of the train is the largest. When the train runs in the reverse direction, the pressure differential force on both sides of the train gradually decreases, and the direction of the pressure differential force at the front of the head, middle, and tail trains is exactly the opposite to that of the driver’s cab at the tail train. In the wind–sand environment, when the high-speed train passes through the transition section between the bridge and embankment, the pressure difference between the two sides of the body obviously increases, and the surface pressure change at the front of the train is the most evident. This indicates that the front experiences the largest lateral force, and the risk of overturning is higher here compared to the middle and rear of the train.
(3)
When the train is running in the bridge–embankment transition section, the lateral force on the train will suddenly increase. Under the wind–sand condition, the lateral force on different positions of the train will increase compared with the non-sand condition. The average increase of the train body is approximately 17.6% (10 m/s), 10.5% (20 m/s), and 9.5% (30 m/s), respectively. This will cause passengers to feel the “shaking” of the train.
(4)
The lateral force difference of the train increases with the wind speed, and the lateral force difference of the head train at the 10 m transition section is the largest. The lateral force difference of the train under the wind–sand condition is higher than that under the non-sand condition. In addition, the influence of the wind–sand flow on the train running in the 5-m-high transition section is greater than that in the 10-m-high transition section.
(5)
Based on to the research results of this paper, future work will explore the following points. (1) Due to the “sudden change” in the aerodynamic transverse force of the train in the transition section between the bridge and embankment under the wind–sand environment, appropriate wind walls can be set up in the transition section in the wind–sand area to reduce the direct impact of the wind–sand flow on the high-speed train. The walls can also block the accumulation of sand particles on the track, effectively reducing the economic costs of manual sand clearing on the track. (2) In view of the “sudden change” in the aerodynamic lateral force of the train, the running speed of the train in the transition section can also be further optimized, the amplitude of the swing can be effectively reduced, and the smoothness of the train running in the bridge–embankment transition section can be improved.

Author Contributions

Conceptualization, P.W. and N.H.; methodology, P.W. and G.X.; software, P.W. and W.L.; validation, W.L.; formal analysis, P.W.; investigation, W.L.; resources, P.W.; data curation, P.W.; writing—original draft preparation, P.W.; writing—reviewing and editing, Y.Q. and W.L.; funding acquisition, P.W. All authors have read and agreed to the published version of the manuscript.

Funding

This work was supported by the Gansu Provincial University Innovation Foundation with grant number 2021B-104, the Gansu Provincial Natural Science Foundation with grant number 21JR11RA063, and the Science and Technology Research Project of China National Railway Group Co., Ltd. with grant number N2022G068.

Institutional Review Board Statement

This study did not involve humans or animals.

Informed Consent Statement

This study did not involve humans.

Data Availability Statement

This study did not report any data.

Conflicts of Interest

The authors declare no conflict of interest.

References

  1. Zhang, K.; Qu, J.; An, Z. Characteristics of wind-blown sand and near-surface wind regime in the Tengger Desert, China. Aeolian Res. 2012, 6, 83–88. [Google Scholar] [CrossRef]
  2. Lei, J.; Wang, X.; Wang, D.; Zhou, C.; Xia, X. The blown sand disaster to the Tarim Desert Highway in Xinjiang, China. Sci. China Ser. D Earth Sci. 2002, 45, 165–173. [Google Scholar] [CrossRef]
  3. Chen, B.; Cheng, J.; Xin, L.; Wang, R. Effectiveness of hole plate-type sand barriers in reducing aeolian sediment flux: Evaluation of effect of hole size. Aeolian Res. 2019, 38, 1–12. [Google Scholar] [CrossRef]
  4. Bitog, J.; Lee, I.-B.; Shin, M.-H.; Hong, S.-W.; Hwang, H.-S.; Seo, I.-H.; Yoo, J.-I.; Kwon, K.-S.; Kim, Y.-H.; Han, J.-W. Numerical simulation of an array of fences in Saemangeum reclaimed land. Atmos. Environ. 2009, 43, 4612–4621. [Google Scholar] [CrossRef]
  5. Cheng, J.-J.; Xue, C.-X. The sand-damage–prevention engineering system for the railway in the desert region of the Qinghai-Tibet plateau. J. Wind. Eng. Ind. Aerodyn. 2014, 125, 30–37. [Google Scholar] [CrossRef]
  6. Zhang, X.; Xie, S.; Pang, Y. Numerical simulation on wind-sand flow field around railway embankment with different wind angles. Front. Environ. Sci. 2023, 10, 1073257. [Google Scholar] [CrossRef]
  7. Xie, S.; Zhang, X.; Pang, Y. Wind Dynamic Characteristics and Wind Tunnel Simulation of Subgrade Sand Hazard in the Shannan Wide Valley of the Sichuan–Tibet Railway. Int. J. Environ. Res. Public Health 2022, 19, 8341. [Google Scholar] [CrossRef] [PubMed]
  8. Hu, G.; Dong, Z.; Zhang, Z.; Yang, L.; Hao, L.; Hesp, P.; da Silva, G.M. Wind regime and aeolian landforms on the eastern shore of Qinghai Lake, Northeastern Tibetan Plateau, China. J. Arid. Environ. 2021, 188, 104451. [Google Scholar] [CrossRef]
  9. Wang, T.; Qu, J.; Niu, Q. Comparative study of the shelter efficacy of straw checkerboard barriers and rocky checkerboard barriers in a wind tunnel. Aeolian Res. 2020, 43, 100575. [Google Scholar] [CrossRef]
  10. Vercauteren, K.C.; Lavelle, M.J.; Hygnstrom, S. From the field: Fences and deer damage management: A review of designs and efficacy. Wildl. Soc. Bull. 2006, 34, 191–200. [Google Scholar] [CrossRef]
  11. Suzuki, M.; Tanemoto, K.; Maeda, T. Aerodynamic characteristics of train/vehicles under cross winds. J. Wind. Eng. Ind. Aerodyn. 2003, 91, 209–218. [Google Scholar] [CrossRef]
  12. Mei, Y.G.; Xu, J.L.; Zhao, H.Q.; Shen, Y. A research on numerical method of air flow around the high-speed train under crosswind. Eng. Mech. 2012, 29, 253–258+278. [Google Scholar]
  13. Wang, Z.; Li, T.; Zhang, J.Y. Research on aerodynamic performance of high-speed train subjected to different types of crosswind. J. Mech. Eng. 2018, 54, 203–211. [Google Scholar] [CrossRef]
  14. Xiong, H.B.; Yu, W.G.; Chen, D.W.; Shao, X.M. Numerical study on the aerodynamic performance and safe running of high-speed trains in sandstorms. J. Zhejiang Univ. A 2011, 12, 971–978. [Google Scholar] [CrossRef]
  15. Li, P.; Liang, X.F.; Niu, J.Q. Numerical simulation of the flow around a high-speed train moving through a crosswind flow. J. Railw. Sci. Eng. 2017, 14, 1113–1121. [Google Scholar]
  16. Xu, J.; Liu, T.H.; Liang, X.F. Optimal study on windproof facilities transition section for improving emus’ operational safety in strong wind conditions. Electr. Drive Locomot. 2017, 6, 11–16. [Google Scholar]
  17. Shakibayifar, M.; Hassannayebi, E.; Mirzahossein, H.; Zohrabnia, S.; Shahabi, A. An integrated train scheduling and infrastructure development model in railway networks. Sci. Iran 2017, 24, 3409–3422. [Google Scholar] [CrossRef]
  18. Cheng, J.J.; Pang, Q.D. Analysis on train aerodynamics characteristics under different types of windbreak structures at strong wind zone in gobi. Railw. Stand. Des. 2013, 1, 1–4. [Google Scholar]
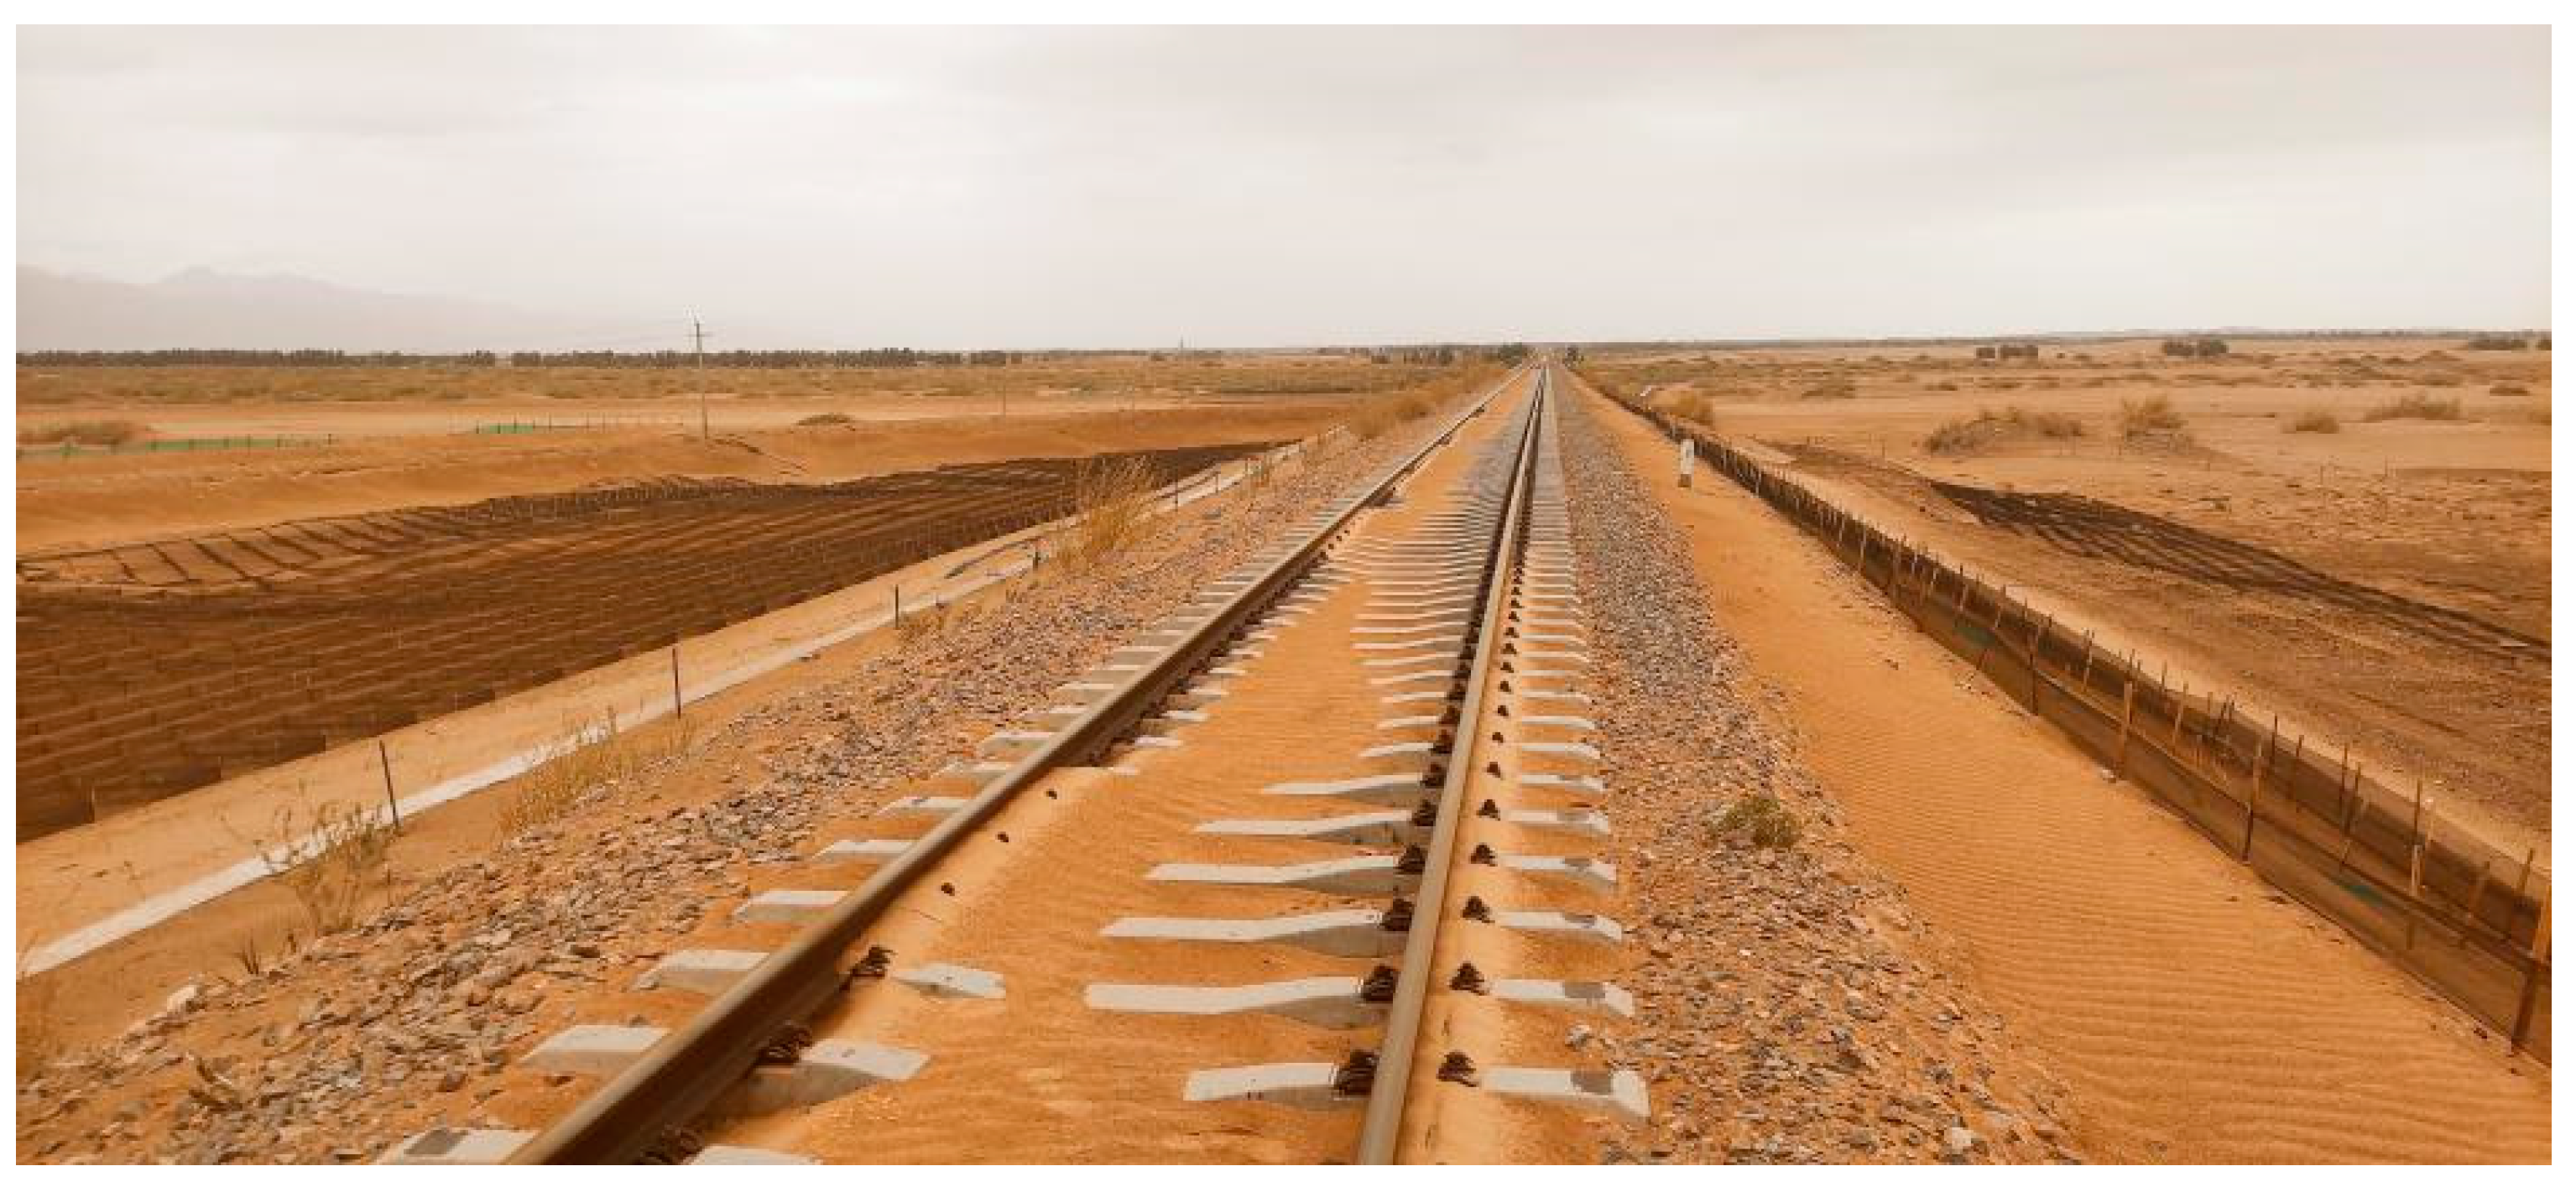
Figure 1. Wind–sand railway with sand control measures on both sides.
Sustainability 15 14210 g001
Figure 2. Bridge–embankment transition section of the Lanzhou–Urumqi Railway.
Sustainability 15 14210 g002
Figure 3. Schematic diagram of the calculation area of the train sliding movement.
Sustainability 15 14210 g003
Figure 4. Comparison of the drag coefficients of the train.
Sustainability 15 14210 g004
Figure 5. Three-dimensional model of the high-speed train.
Sustainability 15 14210 g005
Figure 6. Three-dimensional model and location coordinate diagram of the bridge–embankment transition section.
Sustainability 15 14210 g006
Figure 7. Schematic diagram of the grid division in the computational domain.
Sustainability 15 14210 g007
Figure 8. Curves of horizontal wind speed around different subgrade forms.
Sustainability 15 14210 g008
Figure 9. Cloud map of pressure changes around and on the surfaces of high-speed trains in the bridge–embankment transition section.
Sustainability 15 14210 g009
Figure 10. Layout of the measuring points of the high-speed train body.
Sustainability 15 14210 g010
Figure 11. Pressure at each measuring point of the high-speed train under wind–sand conditions (road–bridge transition section H = 10 m).
Sustainability 15 14210 g011aSustainability 15 14210 g011b
Figure 12. Horizontal force variation curves of the train running in the bridge–embankment transition section.
Sustainability 15 14210 g012
Figure 13. Variation curves of different lateral force values: (a) 5 m, (b) 10 m.
Sustainability 15 14210 g013
Table 1. Sand volume fractions at different crosswind speeds.
Crosswind Speed/(m·s−1)Sand Volume Fraction
104.8 × 10⁻¹⁰
201.2 × 10⁻⁸
301.08 × 10⁻⁷
408.22 × 10⁻⁷
503.96 × 10⁻⁶
Table 2. Parameters used for the numerical simulation.
ParameterValue
EnvironmentNo sand, wind–sand
Transition height5 m, 10 m
Crosswind speed10 m/s, 20 m/s, 30 m/s, 40 m/s
Train speed250 km/h
Sand density2650 kg/m3
Sand diameter0.1 mm
Air/sand viscosity coefficient1.785/0.047 kg/(m·s)
Air density1.225 kg/m3
Disclaimer/Publisher’s Note: The statements, opinions and data contained in all publications are solely those of the individual author(s) and contributor(s) and not of MDPI and/or the editor(s). MDPI and/or the editor(s) disclaim responsibility for any injury to people or property resulting from any ideas, methods, instructions or products referred to in the content.