Abstract
The objective of carbon peaking and carbon neutralization put forward higher requirements for the intensive use of energy and resources, and green and efficient development has become an essential part of high-quality development. Ecological innovation focuses on resource preservation and application and the improvement of the ecological environment while driving economic development through innovation; therefore, ecological innovation has become a solution to balance resource conservation, environmental protection, and efficient development effectively and has received widespread attention. This research takes 30 cities of the Zhongyuan Urban Agglomeration as research subjects and constructs an urban agglomeration’s evaluation index system to measure ecological innovation efficiency. By utilizing the entropy-weight TOPSIS model and super-efficiency SBM-DEA model, the ecological innovation performance of the Zhongyuan Urban Agglomeration is measured and evaluated from 2006 to 2020; then, redundancy analysis is applied to analyze the correlation between ecological innovation inputs and outputs. The final results illustrate that: (1) The overall ecological innovation performance level of the Zhongyuan urban agglomeration is relatively low, and the ecological innovation ability of some cities is inadequate; (2) From the temporal perspective, the temporal evolution of the Zhongyuan urban agglomeration showed a less obvious U-shaped trend, and the innovation output benefits of the core development region are considerably superior to those of the co-development region, and the ecological innovation transformation efficiency of the Zhongyuan urban agglomeration shows a fluctuating trend; (3) From the spatial perspective, there are eight cities at the “high output and high efficiency” level but 19 cities at the “low output and low efficiency” level, and the ecological innovation performance of most cities in the north is obviously better than that in the south from the perspective of spatial distribution. Therefore, to further improve the ecological innovation ability and performance of the Zhongyuan urban agglomeration, relevant policies should be fully practiced and implemented, such as building Nanyang as a sub-central city, constructing an efficient ecological economy demonstration area in the south of Henan province, effectively integrating Zhengzhou and Kaifeng, and the innovative radiation of Zhengzhou as a national central city to other cities.
1. Introduction
1.1. Background
China has made significant achievements in economic development, and China’s national strength has improved significantly. However, with the continuous economic growth, the downward pressure on the economy continues to grow. On the other hand, the economic development has been accompanied by massive energy consumption, environmental damage, and a certain degree of resource waste [1].
The environmental issue has become more severe and has attracted more attention from society. In particular, “carbon peak and carbon neutralization” have been promulgated as major strategies to achieve sustainable development; meanwhile, reducing energy consumption has become an essential development measurement and core goal in the future. In addition, “Eco-conservation and the high-quality development of the Yellow River basin” has been announced as a substantial national program for accelerating the development of Midwest China; this strategy placed the protection of ecological environment and the high-quality development of regional economy in the same important position [2]. Moreover, in 2021, the Chinese government announced that innovation would be the primary driving force for leading development, leading industrial development with scientific and technological creation, and forming a new inland senior opening-up system [3]. All these require us to stick to the innovative route of green and low-carbon development, reinforce the economic and intensive utilization of energy and resources, improve ecological construction and governance, and realize the green rise of the central region of China.
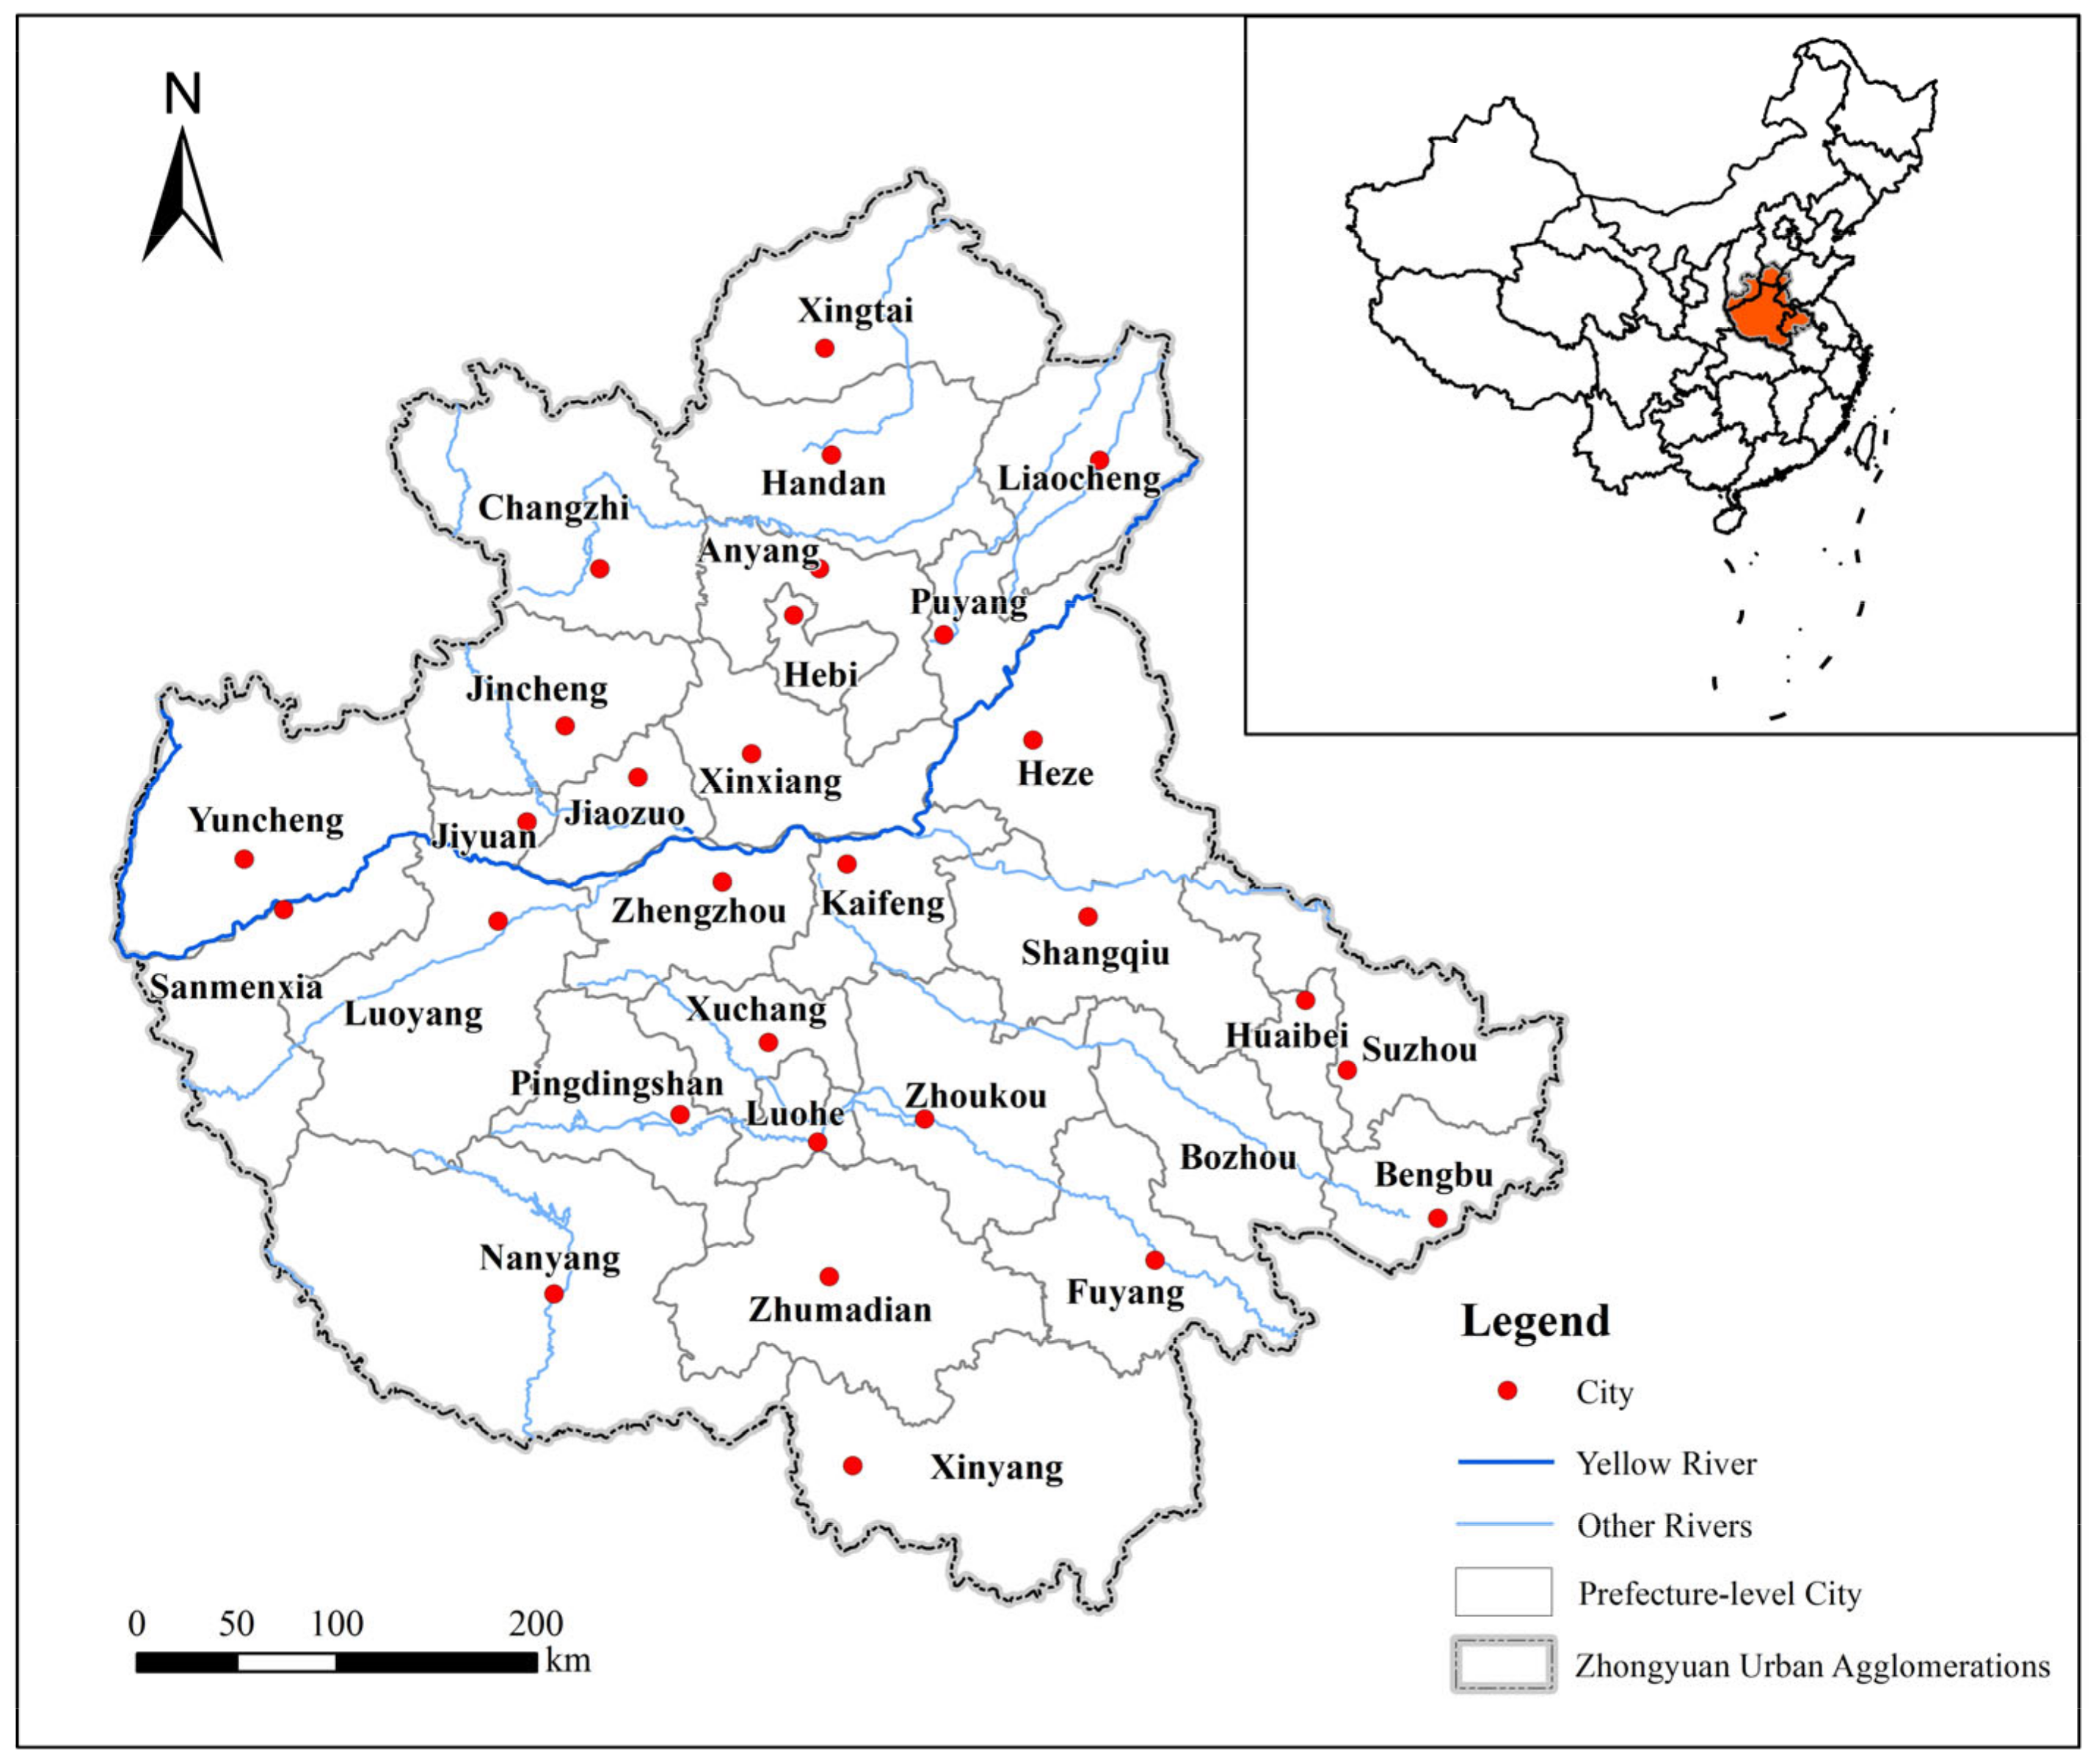
The Zhongyuan urban agglomeration is the fifth national urban agglomeration after the middle reaches of the Yangtze River, Harbin-Changchun, Chengdu-Chongqing, and the Yangtze River Delta urban agglomeration. It includes 30 cities in five provinces (Henan, Shanxi, Hebei, Shandong and Anhui), 287,000 square kilometers of land and more than 16 million people; the location map is shown in Figure 1. As a new engine and growth pole for the central area of the region, the Zhongyuan urban agglomeration is not only rich in natural resources and raw materials but is also a transportation hub extending in all directions. At same time, it is also an essential part of the Yellow River Basin that needs an accelerating process of high-quality development [4].
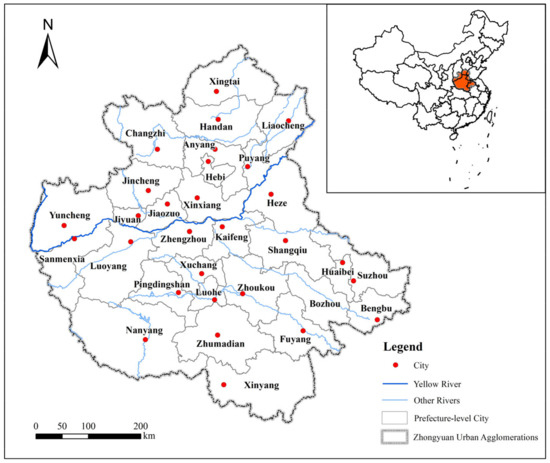
Figure 1.
The location map of Zhongyuan Urban Agglomeration.
At present, the development quality of the Zhongyuan urban agglomeration shows a great disparity with the southeast coastal region of China; the coordination degree among economic development, resource endowment and ecological environment is low, and the internal competition of the urban agglomeration outweighs collaboration, which hinders the high-quality and sustainable development of the urban agglomeration [4]. Moreover, the Zhongyuan urban agglomeration carries the expectation of the green rise and of central China [2]. Therefore, around the significant national development strategy and in combination with the urban agglomeration’s development status, we should take ecological innovation as the essential theme of high-quality development, give full play to the core radiation effect of Zhengzhou as the growth pole of the Zhongyuan urban agglomeration, and realize the comprehensive, coordinated, efficient, sustainable and high-quality development of all 30 cities in the Zhongyuan urban agglomeration.
Although some domestic scholars have researched the evaluation of ecological innovation performance or green innovation performance, such research mainly focuses on the provincial level, mostly takes provincial capital cities as examples, and primarily analyzes the differences in performance levels in the western, central and eastern regions [5,6,7]. Similar research has yet to be carried out in the central region of China. Otherwise, relevant studies about green innovation efficiency focused on the traditional industrial waste indicators when considering the undesirable output and did not select the indicators related to air pollution and carbon emissions according to relevant national strategies and policies. The existing evaluation index system needs to be improved to improve its rationality. Moreover, facing the prominent contradiction between economic development and environmental protection, ecological innovation has become an effective way of green and sustainable development. Therefore, starting from defining the connotation of ecological innovation performance, we should construct an ecological innovation performance evaluation index system that conforms to the characteristics of the Zhongyuan urban agglomeration development and the guidance of national strategies. Based on the super-efficiency SBM-DEA model, the Zhongyuan urban agglomeration’s ecological innovation output benefits are calculated, in order to comprehensively evaluate the ecological innovation performance of all 30 cities in the Zhongyuan urban agglomeration.
1.2. The Concept of Ecological Innovation Efficiency
Ecological innovation is mainly equivalent to green, environmental, and sustainable innovation [8,9]. Fussler and James were the first to carry out research on ecological innovations [10], which in their description are the fresh products and processes providing economic advantages to consumers with noticeably less environmental influence. In the terms of the Organization for Economic Co-operation and Development (OECD), green innovation (ecological innovation) is expressed as the invention or fulfillment of new or considerably green-innovation-enhanced products or services), procedures, marketing strategies, organizational frameworks and institutional plans which intentionally or casually lead to improvements in the ecological environment compared with relative alternatives [11].
Previous research on ecological innovation mainly focused on enterprise or industrial levels [12]. The research on ecological innovation at the enterprise level was mainly directed at process improvement or technology creation to diminish power consumption and environmental contamination, which creates new production processes or new products [13]. However, ecological innovation at the industrial level pays more attention to industrial efficiency, takes energy conservation, emission reduction and green innovation as the core concepts, and realizes the industry’s sustainable development [10]. Since our research object is prefecture-level cities in the Zhongyuan urban agglomeration, this study concentrates more on ecological innovation within the industrial hierarchy.
Oduro et al., conducted a detailed review of green innovation, which reveals that green innovation has aroused the enthusiasm of researchers in the last decade, and scholars generally use empirical research to conduct research [14]. To measure the balance of economic development, resource utilization and the natural environment, scholars have an interest in ecological innovation efficiency or green innovation efficiency. Ecological innovation was thought to be a dynamic and complex process and reduced environmental pressure to a certain extent [15]. Using the research of Alegre and Wang for reference [16,17], this study comprehensively considered the process and results of ecological innovation and concluded that the ecological innovation performance is a collection of the output benefit of the ecological innovation input and the transformation efficiency between input and output under the impact of the innovation milieu and the constraints of innovation resources within a specific period. Based on this, the ecological innovation performance was divided into four levels, including high output and high efficiency, low output and high efficiency, low output and low efficiency, high output and low efficiency. Using the mean value of ecological innovation output benefits and transformation efficiency of all 30 cities in the sample data as the benchmark, values above the benchmark are defined as high levels, and values below the benchmark are defined as low levels, thereby achieving the classification of urban ecological innovation performance levels in urban agglomerations.
1.3. The Measurement and Evaluation of Ecological Innovation Efficiency
Bai [18] points out that innovation efficiency should be considered more than focusing on the amount of R&D investment needed for a country’s comprehensive innovation development. Scholars mainly evaluate the efficiency of ecological innovation from two perspectives: ecological innovation inputs and outputs. Ecological innovation input generally includes human and capital input, R&D input, energy input, etc. Ecological innovation outputs include innovation output and environmental output, in which environmental output is divided into desirable and undesirable environmental output; typical innovation output indicators include the number of invention patent authorizations, technology market transactions, etc. Common desirable environmental output indicators include the green coverage rate in built-up areas, per capita park and green areas, etc. Undesirable environmental output indicators mainly select industrial wastewater emissions and industrial exhaust emissions, PM2.5 density, etc. [17,19,20].
The commonly used research methods for evaluating ecological innovation efficiency can be separated into stochastic frontier analysis (SFA) and data envelopment analysis (DEA). To compare these two methods comprehensively, SFA is a parameter analysis that prefers to the specific pre-set form of the production function according to the characteristics of the input–output data and to obtain the efficiency level through the efficiency measurement of multiple inputs and outputs. It is a specification to position the precise form of the production function in advance according to the characteristics of the input–output data. The SFA method has advantages compared with the DEA method; it not only considers random error terms (price, etc.), but also considers technical inefficiency terms (influencing factors), and the impact factors of innovation efficiency are decomposed under the influence of random errors. Otherwise, based on the linear programming theory, the DEA method is widely used as a standard non-parametric method which can be used to measure the efficiency of multi-input and multi-output indicators. It can set the specific form of production function in a timely manner and directly constructs the production frontier according to the sample data to avoid not achieving the expected measurement results. Moreover, it can accomplish the evaluation of innovation efficiency with multi-input and multi-output indicators [21,22].
After consulting related studies, data envelopment analysis (DEA) and its derivative methods are mainly used to evaluate the ecological innovation performance of different cities, provinces or regions [12,20,23,24,25,26]. For example, Li and Du took PM2.5 as undesirable and applied the Super-SBM model and entropy method to estimate environmental regulation’s spatial effect on the green innovation efficiency (GIE) of 281 China prefecture-level cities [20]. Du et al., estimated the productiveness of industrial corporations in different regions in China from 2009–2016 by utilizing a two-stage network DEA model [23]. Bai et al., chose 108 cities in the Yangtze River Economic Belt as a research object and appraised their ecological welfare performance by applying the super-efficiency SBM model [24]. Zhao et al., explored how green finance and environment regulations affect the GIE of 31 provinces and cities by utilizing the DEA-Malmquist index model [25]. Wu et al., utilized the SBM-DEA efficiency model, which includes undesirable outputs, to analyze the GIE of the Yangtze River Economic Belt in China from 2005–2018 [26]. From relevant studies, the SBM-DEA model, which directly puts relaxation variables into the objective function and considers inefficiency from the perspective of input and output, has better solved the relaxation problem of innovation input and output. This method has therefore gained the favor of scholars and has been widely used to measure and evaluate ecological innovation efficiency or green innovation efficiency [20,26,27].
Furthermore, the entropy method can be applied to give weight to objective evaluation indicators according to the amount of information that each indicator provides. It is also an evaluation method to synthesize all evaluation indicators into a comprehensive indicator. The greater the amount of information the evaluation index provides, the smaller the indicator entropy value. As the ecological innovation evaluation index system is a comprehensive system that includes multi-indicators from innovation inputs and innovation outputs, the application of the entropy method can transform the ecological innovation output benefit into a comprehensive evaluation index for measurement; this can not only avoid the impact of subjective evaluation but also evaluate the ecological innovation efficiency more intuitively. Therefore, when evaluating ecological innovation efficiency, the entropy method is often used together with DEA and its derivative methods to ensure the objectivity and accuracy of the evaluation [17,20].
Moreover, previous studies have fully drawn elaborations of environmental regulation (ER) and green innovation efficiency (GIE) with their relationship. Some studies observed that environmental regulation applies a U-shaped influence on GIE [22,24]. Numerous recent studies have combined ecological innovation performance evaluation with spatial econometric analysis, using interdisciplinary research to interpret and analyze ecological innovation performance’s temporal and spatial effects [20,22,27,28,29].
Based on the comprehensive analysis above, our research intends to use the entropy-weight TOPSIS model to analyze ecological innovation output benefits and apply the super-efficiency SBM-DEA model which takes the undesirable output into account to evaluate the ecological innovation transformation efficiency of 30 cities of the Zhongyuan urban agglomeration, on the basis of the applicability of the research methods. On account of the measurement values of two kinds of efficiency, all 30 cities were divided into four different performance levels as constructed above. Furthermore, our research analyzed the evolution of ecological innovation performance from the temporal perspective and the analysis of regional differences in ecological innovation performance from the spatial perspective.
2. Materials and Methods
2.1. An Ecological Innovation Efficiency Evaluation Index System for Urban Agglomerations
As a necessary means to measure the benefits of ecological innovation inputs and outputs, ecological innovation efficiency is an important index to evaluate China’s synergistic relationship between the innovation outputs, resource utilization, and environmental protection. The core—to estimate regional green innovation performance—is creating a scientific and achievable evaluation index approach; many academic papers have researched the evaluation index system of green innovation performance [17,22,30]. However, up to now, the academic community has not formed a unified evaluation standard when selecting performance evaluation indicators, and scholars generally select from two aspects: ecological innovation input and ecological innovation output [17].
The existing research into the performance evaluation of green innovation has mainly been carried out along the construction and extension of the object level of the evaluation index system. In the field of building the evaluation index system, a few scholars, such as García-Graner [31], from the output perspective, agree that green innovation performance evaluation indicators combine four categories: product, process, organization and marketing [13]. Some scholars mainly use DEA and its derivative methods to establish an evaluation index system for measuring green innovation efficiency which includes four aspects: resource and non-resource inputs, and desirable and undesirable outputs [7,17].
According to the analysis of critical innovative development elements of urban agglomerations and previous research literature, we select appropriate indicators from the ecological innovation input and output perspective, and construct a reasonable and comprehensive ecological innovation efficiency evaluation index system which is shown in Table 1.

Table 1.
Evaluation index system of ecological innovation performance.
Based on the concept of ecological innovation, ecological innovation performance is separated into two dimensions: ecological innovation input and ecological innovation output. The former is mainly analyzed from the human, capital, and energy input required for innovation. On the other hand, ecological innovation output focuses on analyzing economic and environmental benefits (including desirable output and undesirable output). In order to clearly express the relationship between the above indicators, a schematic diagram of evaluation indicators is shown in Figure 2.
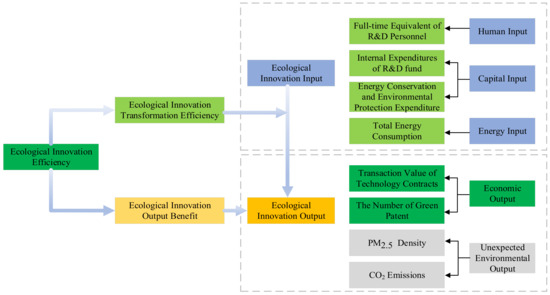
Figure 2.
The schema for ecological innovation efficiency evaluation index system of urban agglomeration.
The primary input indicators of innovation activities involve human resources, capital and energy. The human resource input variables usually use the full-time equivalent of R&D personnel, the calculation of R&D personnel input, and the internal expenditure on R&D funds to reflect the enterprise’s capital investment for innovation activities [20,25]. Therefore, the full-time equivalent of R&D personnel was chosen as human input and the internal expenditure on the R&D fund was chosen as capital input in this research.
Resource conservation and environmental protection expenditure: this indicator reflects the administrative and economic measures taken by the Zhongyuan urban agglomeration to protect the environment and reduce pollution in ecological innovation activities. Specifically, the expenditure on energy conservation and environmental protection can be seen as the economic policy of supply-side management, such as supporting the comprehensive utilization of resources, energy management and pollution control through special funds, or subsidizing green production of enterprises, reflecting the reliance of the government on energy conservation and environmental protection expenditure to promote energy conservation and emission decrease in the sense of the total amount, to strengthen energy conservation and environmental protection [17].
Energy input: Energy factors are significant for measuring ecological innovation efficiency, as they are the energy base of ecological innovation activities. Generally, total energy consumption is always used as a commonly used resource input indicator to measure energy consumption in the statistical yearbook [17,32]. Therefore, the total energy consumption (unit: 10,000 tons of SCE) is used to measure the energy input in this research.
The index to impartially reflect the degree of innovation is number of patents, which are broadly applied in innovation activities. A large number of scholars selected the patent application and authorization as the ideal output of ecological innovation; patent authorization lags but reflects better quality [33]. Some studies have also selected the number of green patents (the sum of green invention patents and green utility) as one kind of innovation output indicator, which can better reflect the level of green innovation [34]. After data collection and collation, this study uses the number of green patents as the evaluation index of ecological innovation output.
Transaction value of technology contracts: technology contract registration is a unique way of science and technology management in China, and the transaction volume reflects the status of scientific and technological innovation and technology transfer in China to a certain extent. As our research object is prefecture-level cities, and the market contract turnover is an essential indicator of the city’s technological innovation ability, this study takes it as one of the economic benefit indicators of ecological innovation.
Undesirable output: With a series of social and economic problems caused by air pollution, especially the significant negative impression on the health of residents, the Chinese government has included haze control in the focus of governance. All parts of the country, especially some regions with severe haze, have formulated particular policies to control particle emissions, such as vehicle restrictions, factory shutdowns, etc. These have shown the effectiveness of governance in recent years. Recently, air pollution has been one of the concerns among researchers [20,35]. The research focuses on complex and new pollutants such as PM2.5, ozone, etc. Because PM2.5 has a significant negative impact on residents’ health and climate change, this study will include urban PM2.5 density as an undesirable output in the evaluation index system.
CO2 emissions: with the intensification of the greenhouse effect, as a major greenhouse gas, CO2 emission reduction has become a common task for all countries. The Chinese government declared that its carbon peak would be reached in 2030 and carbon neutrality in 2060. Against this background, reducing CO2 emissions and green innovation development have become important research topics. The “double carbon” targets, such as energy structure adjustment and resource utilization efficiency improvement, have effectively promoted the development of green innovation technology, so CO2 emissions as an undesirable output have become an important evaluation indicator of ecological innovation efficiency [36].
2.2. Methodology
2.2.1. Super-Efficiency SBM-DEA Model
Since the slack-based measure (SBM) data envelopment analysis (DEA) model was proposed by Tone [37], as a mature and effective measurement method, it has been widely applied in the field of measurement and evaluation of green innovation efficiency or ecological innovation efficiency [20,21,22,27,38]. So our research attempted to use the SBM-DEA model, which considers undesirable output to estimate the ecological innovation transformation efficiency of all 30 cities from 2006–2020. The specific model settings of the super-efficiency SBM-DEA model are as follows:
Assume that there are n homogeneous decision-making units (DMUs); represents the inputs, denotes the desirable outputs, and denotes the undesirable outputs; each DMU includes m ecological innovation inputs, desirable ecological innovation output and undesirable ecological innovation output.
In the above formula, is the super-efficiency value; , and represent the slack variable of the innovation input, desirable innovation output and undesirable innovation output, respectively. , , and are, respectively, representing input value, desirable output value and undesirable output value of the city in the year , and refers to the weight coefficient of DMU, which is to be estimated.
As optimal objective value represents the ecological innovation transform efficiency, when using the ordinary SBM model, the value of about , and is strictly monotonically decreasing, and its values range from 0 to 1. When and , the DMU is efficient [39]. However, the SBM model considering undesirable output may have multiple decisions that are effective at the same time (which means the efficiency value is all equal to 1), so it cannot effectively distinguish among and rank these decision units [40]. Therefore, this study uses the super-efficiency SBM–DEA model to allow the value of efficiency to exceed 1, so as to solve the above problems and effectively distinguish the ecological innovation efficiency of each city.
2.2.2. Entropy-Weight TOPSIS Model
As the evaluation index system of ecological innovation performance includes positive indicators (such as energy conservation and environment protection expenditure) and negative indicators (such as PM2.5 Density), all these indicators were objective indicators; otherwise, different evaluation indicators need to be weighted to reflect the different impact of indicators on evaluation results [41]. As a common method in the study of environmental analysis [42], the entropy-weight model was applied to give weight to the ecological innovation output benefit index of an urban agglomeration.
- (a)
- Normalization of indicators
The first step in using the entropy-weight TOPSIS model is to perform dimensionless processing on the data of various evaluation indicators, and the specific calculation process is as follows:
Positive Index:
Negative Index:
where is the primary data value of the th city under the th indicator, represents the maximum values and represents the minimum values under the same indicator . is the value of the th city under the th indicator after the normalization. For the normalization Formula (2) for positive indicators, a higher value in the indicator represents better performance; for the normalization Formula (3) for negative indicators, a lower value in the indicator represents better performance.
- (b)
- Calculation of the indicator weight
Firstly, calculate the characteristic proportion of indicators.
Secondly, calculate the entropy value of indicators.
Finally, calculate the entropy weight of indicators.
- (c)
- TOPSIS method
After being put forward by Hwang and Yoon [42], the Technique for Order Preference by Similarity to Ideal Solution (TOPSIS) model has unique advantages in solving multi-objective decision-making issues [43]. This model tries to reach the optimal value of each measurement variable by estimating the distance between the measurement DMU and the optimal solution and the worst solution, then ensures that the value of each measurement index is in the most appropriate and optimal state. Based on the weight of each measurement index calculated through the entropy-weight method, the TOPSIS method is then applied to calculate the relative proximity C value of each evaluation object and then judges and measures the ranking of evaluation objects [44].
Firstly, we establish the weighted decision matrix V.
Secondly, we determine the positive and negative ideal solutions and of the index.
Thirdly, we estimate the distance from the decision plan to the positive ideal solutions and virtual worst solutions .
Finally, we measure the degree of relative closeness.
The proximity coefficient of each city (which is more than 0 and less than 1) could be measured by using the above TOPSIS method. Our study applied the SPASSAU online software to calculate the ecological innovation transformation efficiency values of each city in different years, thus obtaining a clear understanding of the ecological innovation transformation level of each city.
2.3. Data Source
Since the object of this study involved multiple innovation input and output indicators of 30 cities from 2006 to 2020, we have extensively consulted the China City Statistical Yearbook (2007–2021), provincial and local statistical yearbooks, statistical bulletins of social development, and annual work reports of local governments, and partial missing data are supplemented by interpolation. Furthermore, the PM2.5 Density data were collected from the atmospheric composition analysis group of Dalhousie University, and the CO2 emissions data were collected from the China Emission Accounts and Datasets (CEADs). After searching, summarizing, and processing the data, we obtained a total of 3600 pieces of data; the variable descriptive statistics are shown in Table 2.
Table 2.
Variable descriptive statistics.
3. Results
3.1. The Measurement of the Ecological Innovation Efficiency from 2006–2020
All indicators of ecological innovation output of the Zhongyuan urban agglomeration were dimensionless, to eliminate the differences in indicator dimensions and properties, and some indicators, such as the number of internal expenditures on R&D and the number of green patents, were positively treated; at the same time, the undesirable output of PM2.5 concentration was negatively treated, and then the entropy weight of the three innovation output indicators was calculated. Then, the TOPSIS method was used to calculate each city’s ecological innovation output benefit score in the Zhongyuan urban agglomeration. Otherwise, as established in the data obtained, the ecological innovation transformation efficiency of all 30 cities in the Zhongyuan urban agglomeration was measured by using the MAX DEA Ultra software 9.1. The results of the ecological innovation output benefit score (IOB) and ecological innovation transformation efficiency score (ITE) from 2006–2020 are shown in Table 3, Table 4 and Table 5. On the basis of the development plan of the Zhongyuan urban agglomeration, all 30 cities were divided into the core development region, which includes Zhengzhou (ZZ), Kaifeng (KF), Luoyang (LY), Pingdingshan (PDS), Hebi (HEB), Xinxiang (XX), Jiaozuo (JZ), Xuchang (XC), Luohe (LH), Shangqiu (SQ), Zhoukou (ZK), Jiyaun (JY), Jincheng (JC) and Bozhou (BZ), and the co-development region, which includes Anyang (AY), Puyang (PY), Sanmenxia (SMX), Nanyang (NY), Xinyang (XY), Zhumadian (ZMD), Yuncheng (YC), Changzhi (CZ), Handan (HD), Xingtai (XT), Heze (HZ), Liaochenng (LC), Fuyang (FY), Huaibei (HB), Suzhou (SZ) and Bengbu (BB); the corresponding mean values of the different regions were also calculated and are included in Table 3, Table 4 and Table 5.
Table 3.
Results for valuation of the Zhongyuan urban agglomeration ecological innovation performance (2006–2010).
Table 4.
Results for valuation of Zhongyuan urban agglomeration ecological innovation performance (2011–2015).
Table 5.
Results for valuation of Zhongyuan urban agglomeration ecological innovation performance (2016–2020).
It can be seen from the above tables that there are apparent differences in the output benefits and transformation efficiency of ecological innovation among all 30 cities in the Zhongyuan Urban Agglomeration. Through comparative analysis for the ecological innovation output benefits average value of all 30 cities from 2006 to 2020, Zhengzhou ranked the highest, with an average value of 0.97; Hebi ranked the lowest, with an average value of 0.021. The mean value of the ecological innovation output benefit of the entire Central Plains urban agglomeration is 0.129; 22 cities are lower than the overall average, accounting for two-thirds of the 30 cities. In addition, the mean value of the cities in the core development region is 0.158, and the mean value of cities in the co-development region is 0.103, which conforms to the positioning and ecological innovation development status quo of these two regions. Comparing and analyzing the mean value of ecological innovation transformation efficiency of all 30 cities from 2006 to 2020, due to the application of the super-efficiency SBM-DEA model, the result is that the transformation efficiency of some cities is greater than 1. Zhengzhou has the highest transformation efficiency, with an average value of 1.384; the transformation efficiency of Jiyuan is the lowest, with an average value of 0.068. The mean value of ecological innovation transformation efficiency of the entire Zhongyuan Urban Agglomeration is 0.457; 18 cities are lower than the overall average, accounting for nearly two-thirds of the total 30 cities. In addition, the average value of the core development region of the urban agglomeration is 0.357, and the average value of the co-development region is 0.502. The results indicate that average level of ecological innovation transformation efficiency of core development regions is slightly better than that in co-development regions.
3.2. The Redundancy Analysis of the Ecological Innovation Inputs-Outputs
To explore the optimization path of ecological innovation efficiency, a redundancy analysis model between the ecological innovation input variables and the ecological innovation output variables was constructed. Redundancy analysis (RDA) is the PCA analysis of the fitting value matrix of multiple linear regression between the response variable matrix and the explanatory variable, and this method was applied in the research into environmental quality and its affecting factors, or the redundancy of input–output indicators in the process of some kinds of efficiency evaluation [45,46].
In our research, the ecological innovation input indices were set as the interpretation variables and the ecological innovation output indices were set as the response variables; the RDA was applied to test the correlation relationship between ecological innovation inputs and outputs, and the canocoso5.0 software is applied to obtain the result. Firstly, as shown in Figure 3, the total cumulative interpretation rate of the interpretation variable (the ecological innovation input variables) to the response variable (the ecological innovation output variables) was 98.32%. Moreover, red arrows represent all ecological innovation input variables, and black arrows represent all ecological innovation output variables. The correlation between the variables that the vectors represent can be obtained by analyzing the angle cosine between vectors. The detailed analysis results include: (1) The main economic outputs (the transaction value of technology contracts and the number of green patents) are strongly related to the other three indicators of the ecological innovation inputs, which include the full-time equivalent of R&D personnel, the internal expenditure on the R&D fund and the resource conservation and environmental protection expenditure. This indicates that the desirable output of ecological innovation cannot be separated from the human and financial input of innovation. The energy conservation and environmental protection expenditure of local government departments has promoted the number of green patents authorized. (2) The growth of energy conservation and environmental protection expenditure can reduce the PM2.5 density as some more environmentally friendly production processes are adopted and air pollution gas emissions are controlled. (3) The analysis results show that the undesirable outputs including PM2.5 density and CO2 emissions are highly correlated with the total energy consumption. Energy consumption is an important driver of economic development, but it inevitably brings some undesirable outputs that are harmful to the environment. In order to achieve green, energy-saving and innovative development, we should continue to reduce the consumption of all kinds of energy.
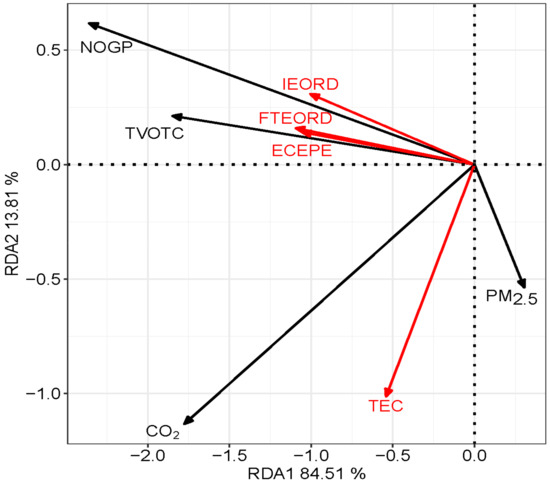
Figure 3.
Correlation of ecological innovation inputs and outputs. Note: FTEORD, IEORD, ECEPE, TEC, TOOTC, NOGP, CO2, and PM2.5, respectively, represent full-time equivalents of R&D personnel, internal expenditure on the R&D fund, resource conservation and environmental protection expenditure, total energy consumption, CO2 emissions and PM2.5 density; TVOTC, NOGP, CO2 and PM2.5 are response variables, and the rest are interpretation variables.
3.3. Evolution Analysis of Innovation Performance from Temporal Perspective
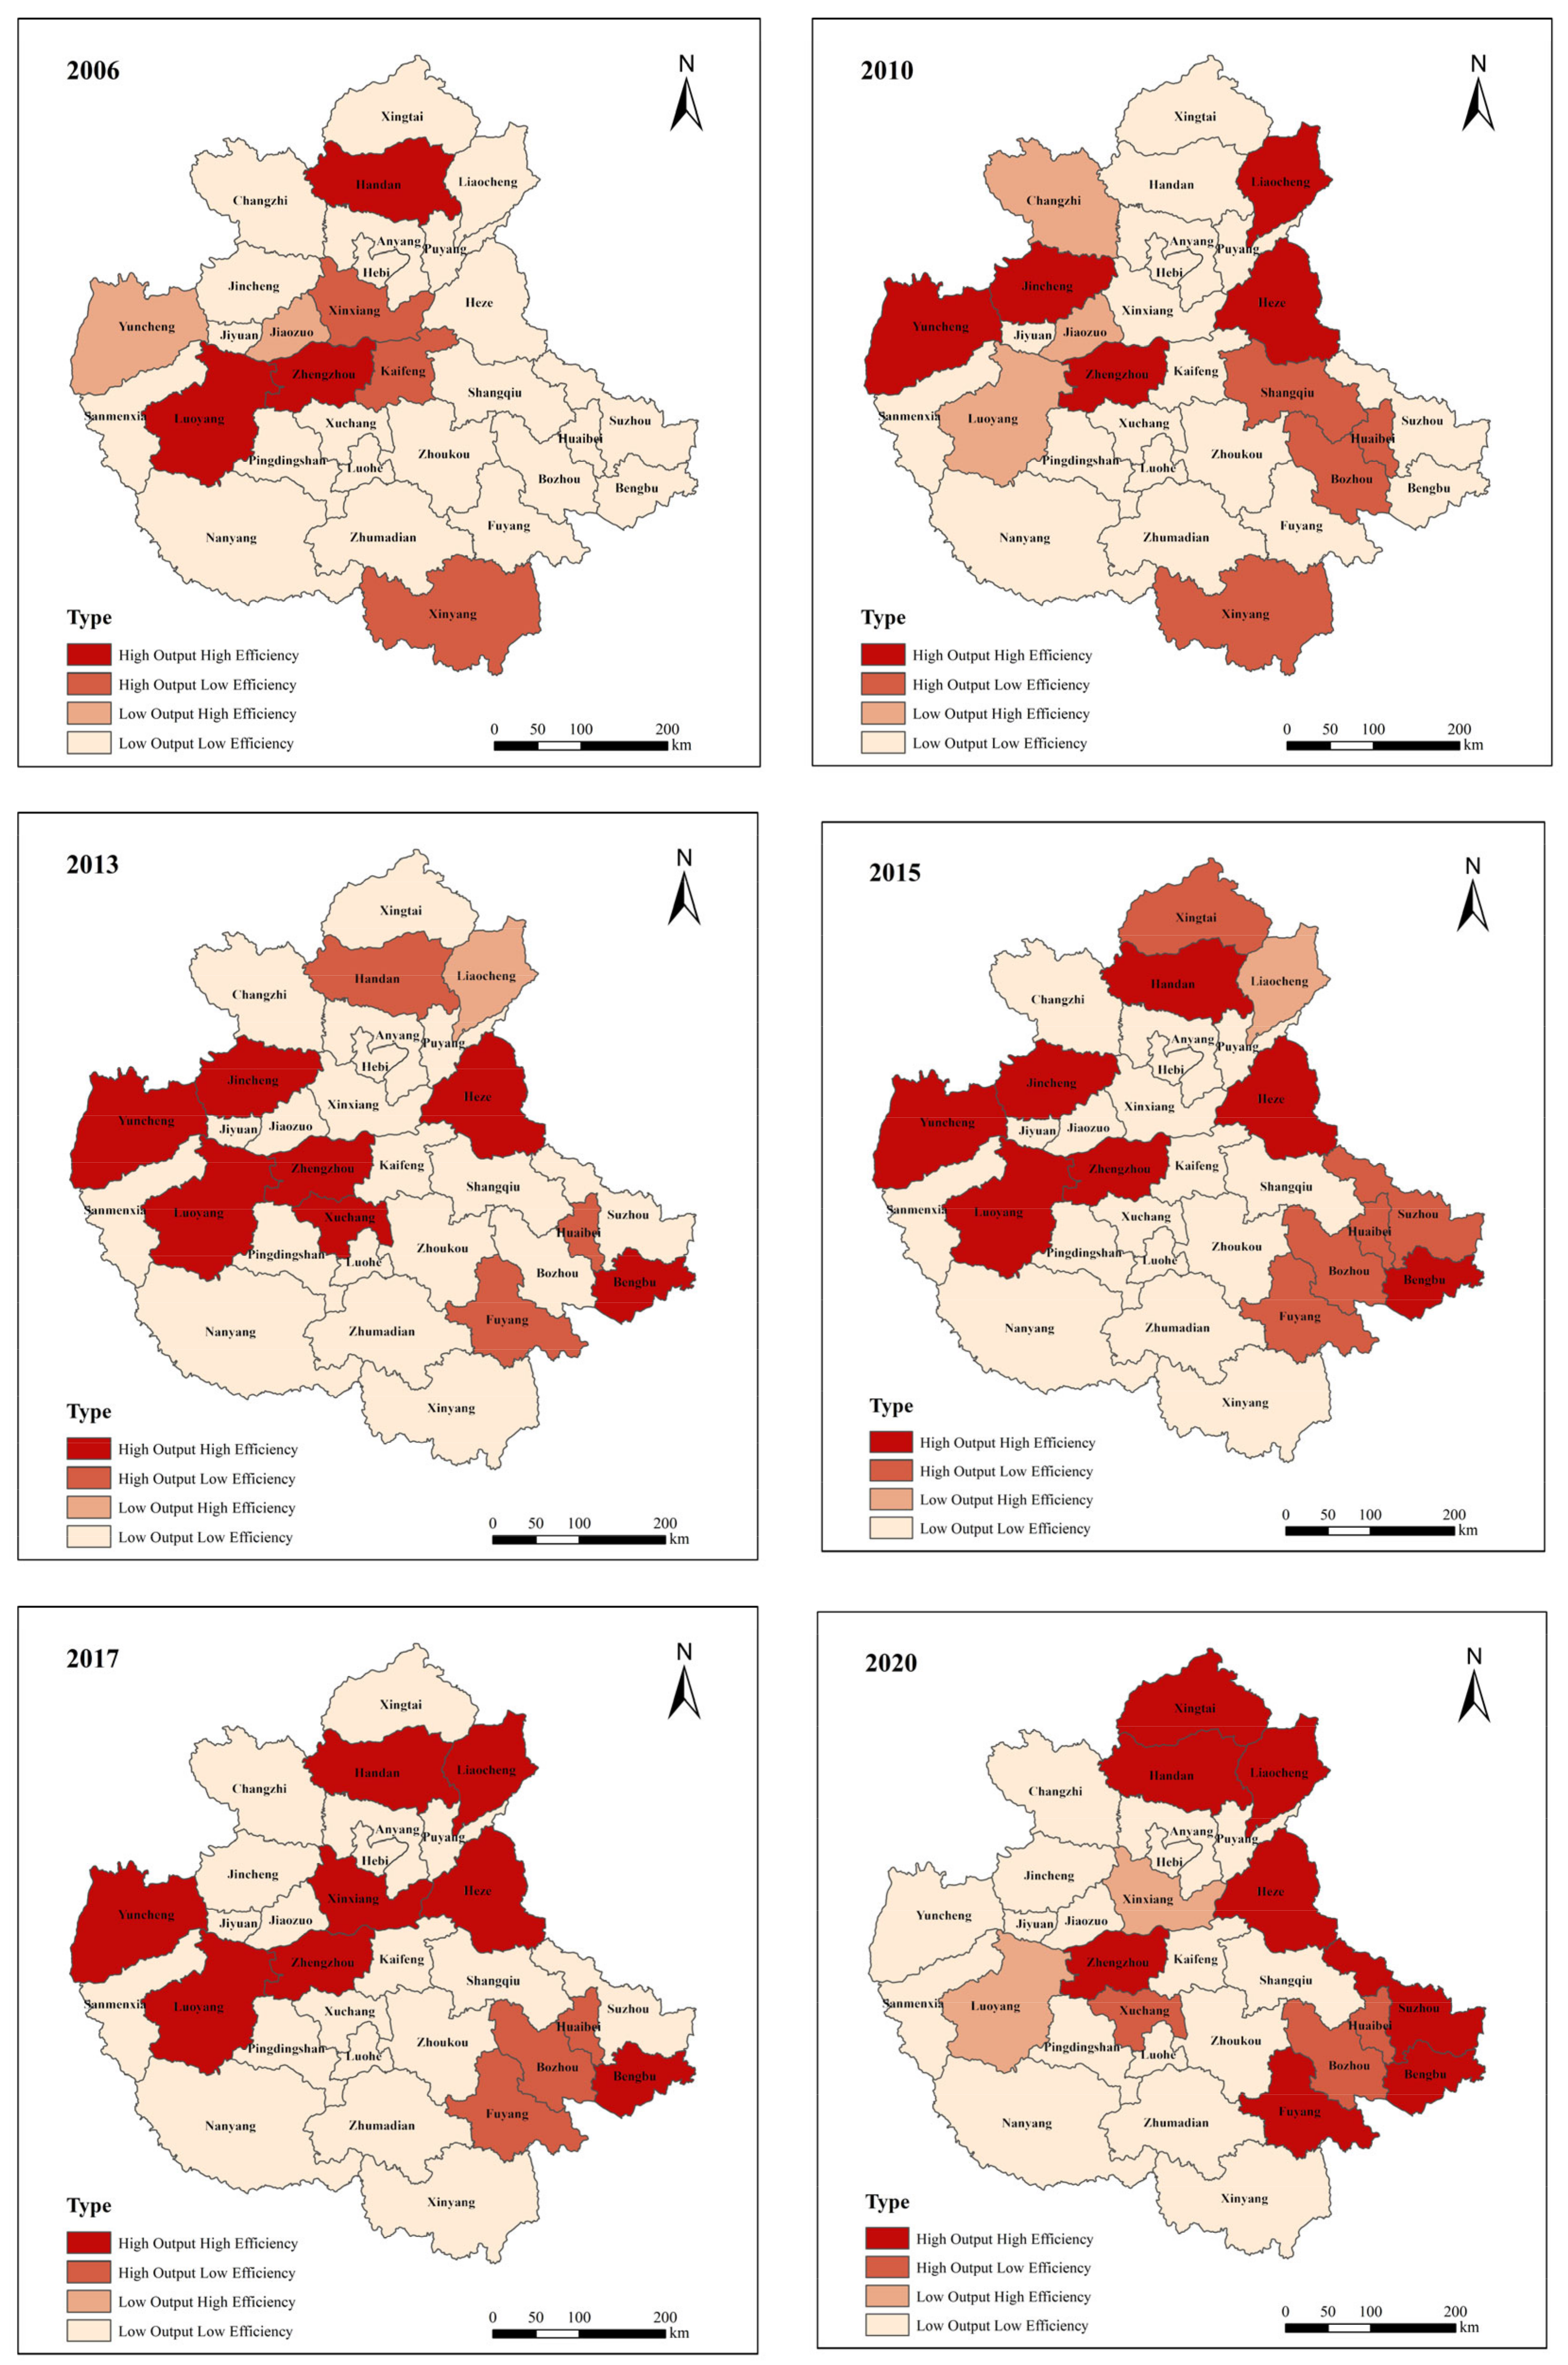
After measuring the output benefit and transformation efficiency of ecological innovation, 30 cities in the Zhongyuan urban agglomeration in 2006, 2010, 2013, 2015, 2017 and 2020 were classified according to the level of ecological innovation performance, taking the average value of the urban agglomeration in each year as the benchmark, respectively, and defining those above the average value as “high level” and those below the average value as “low level”. Finally, the ArcGIS 10.8 software was adapted to draw the spatial distribution evolution of ecological efficiency performance of 30 cities in the Zhongyuan urban agglomeration from 2006 to 2020, and the results are shown in Figure 4.
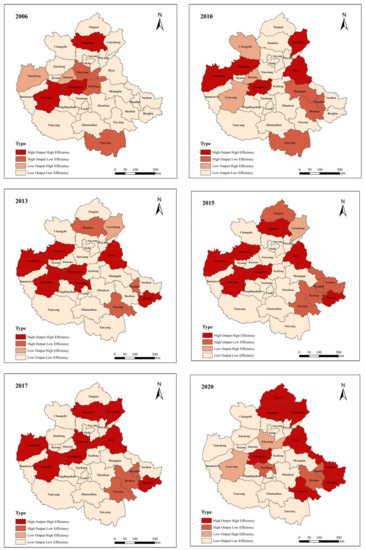
Figure 4.
The spatial distribution evolution of ecological efficiency performance in Zhongyuan urban agglomeration (2006–2020).
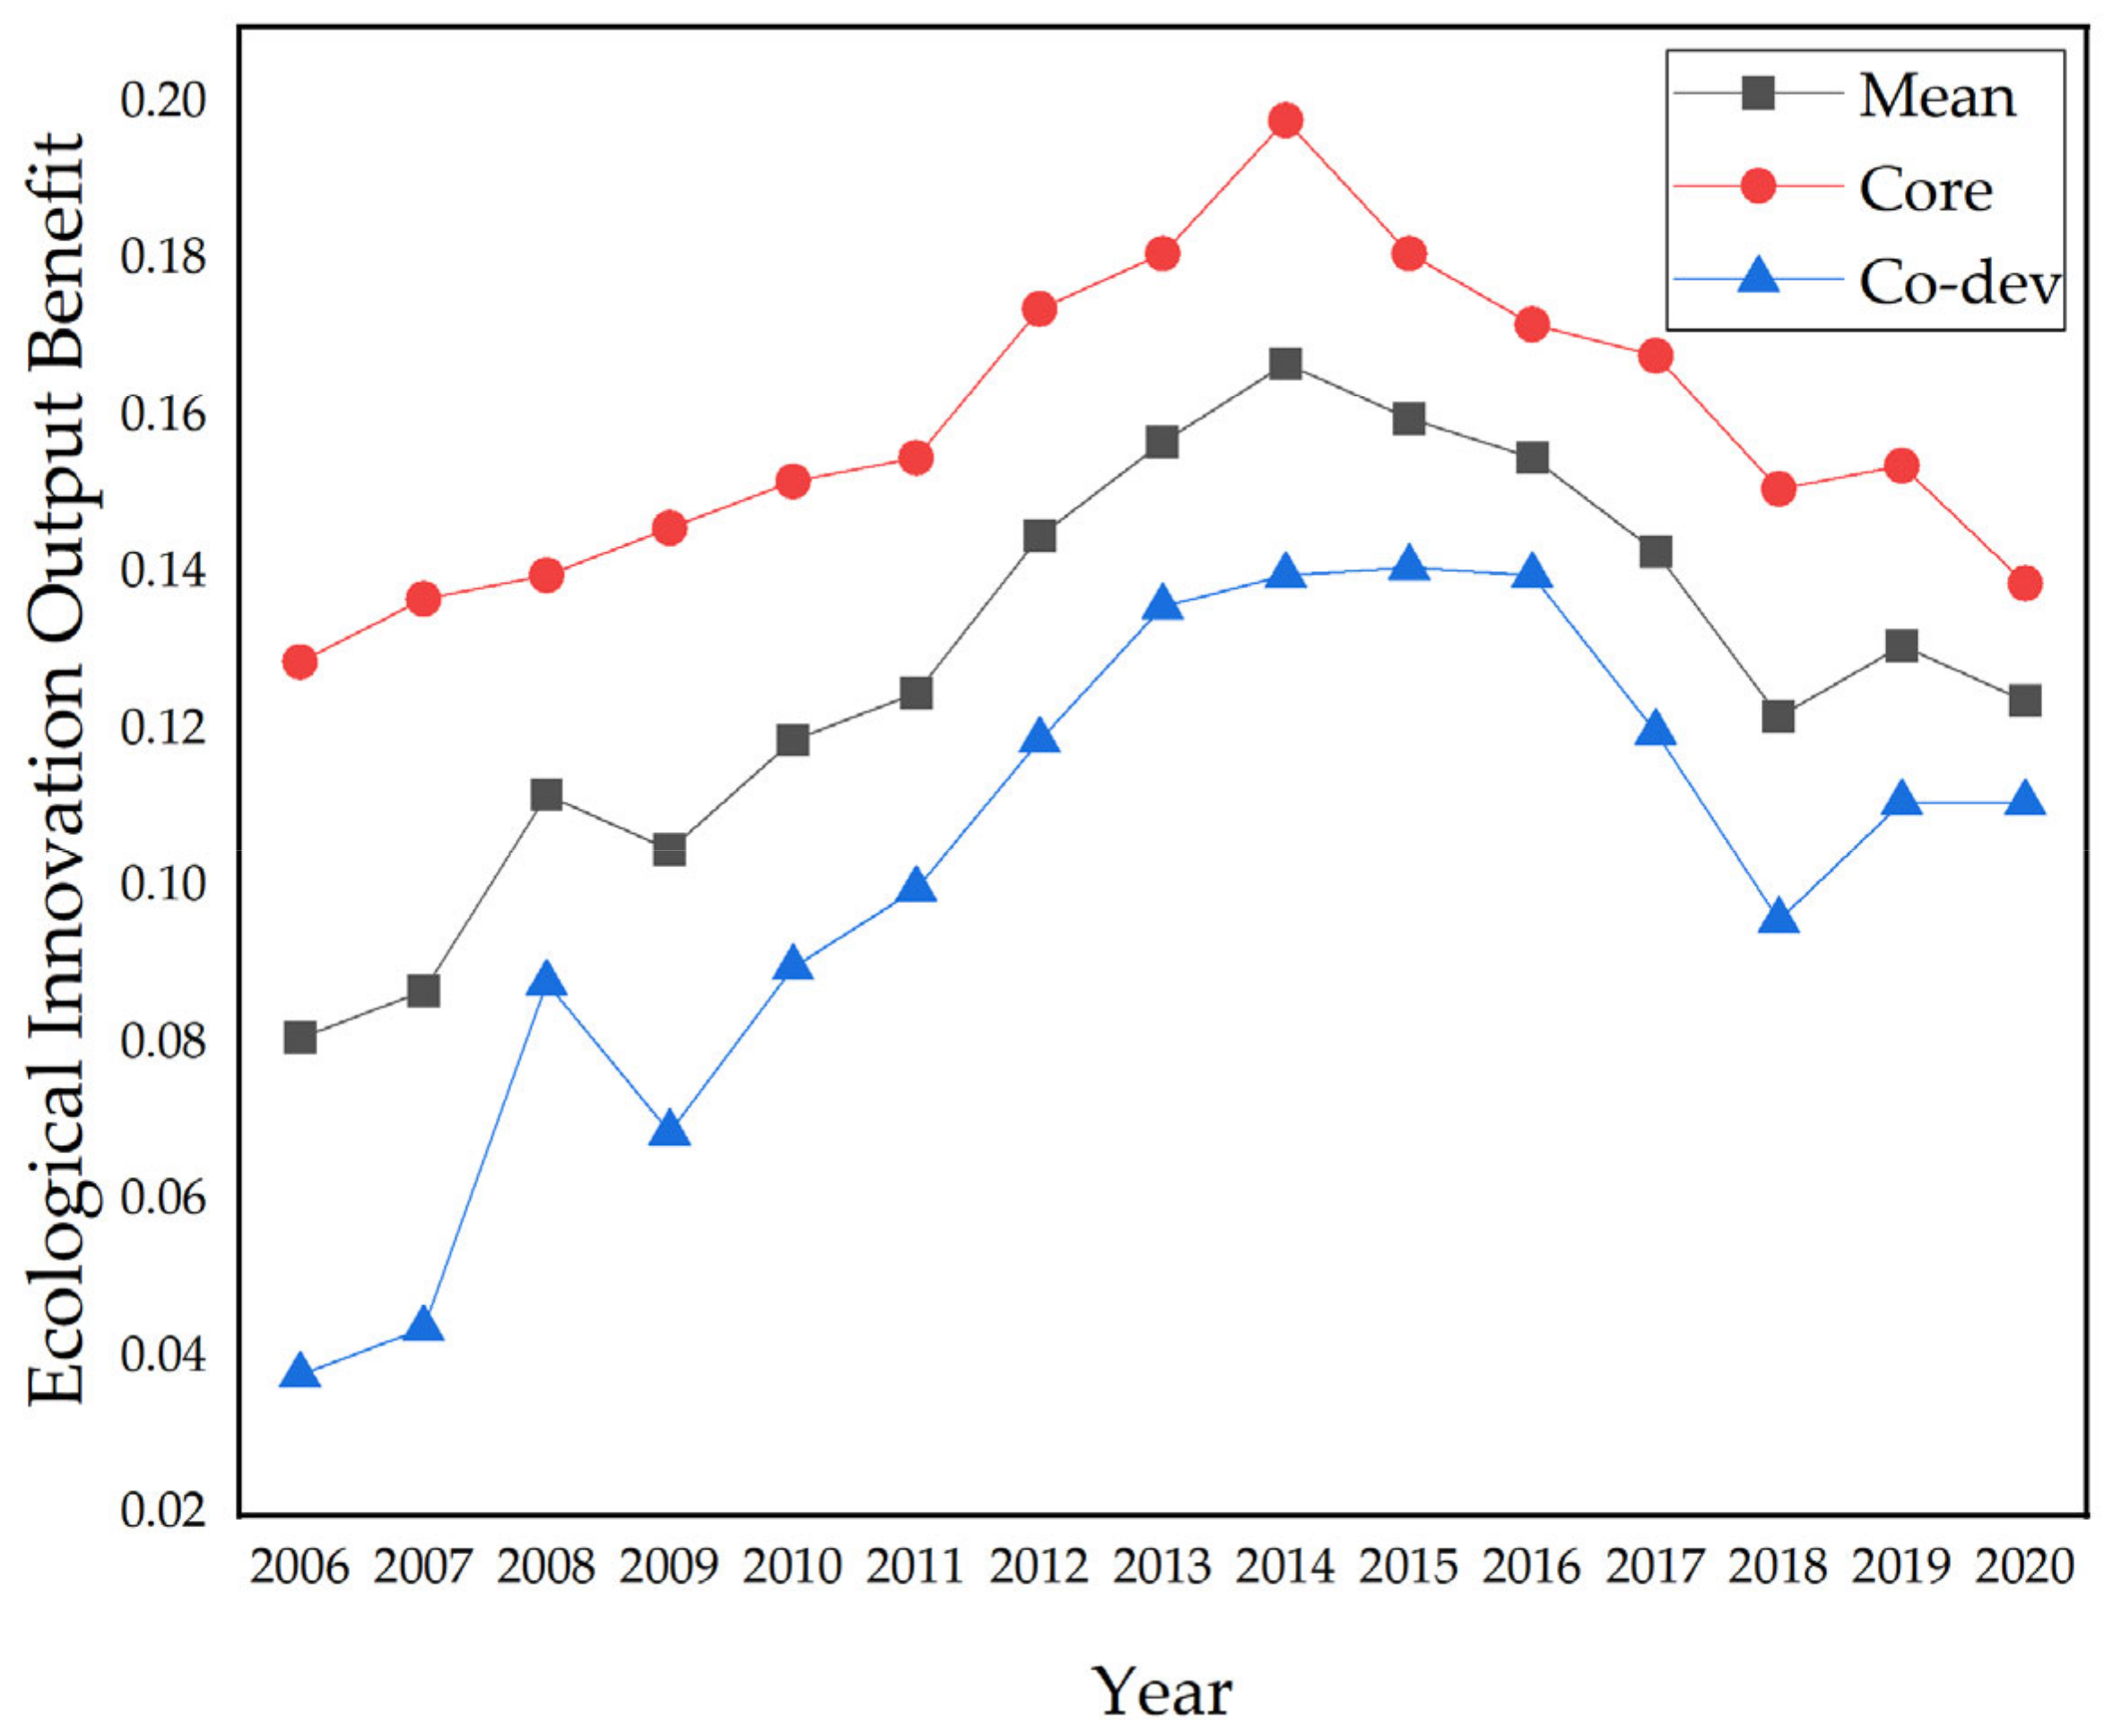
On the basis of the measurement results of the ecological innovation output benefits and ecological innovation transformation efficiency in the evaluation cycle from 2006 to 2020, the evolution trend of these two was analyzed from the temporal perspective and is shown in Figure 5. Firstly, from 2006 to 2020, the ecological innovation output benefits of the Zhongyuan Urban Agglomeration core development region (including 14 cities) and the co-development region (including 16 cities) showed a relatively consistent evolution trend, and the innovation output benefits of the core development region were significantly higher than those of the co-development region. However, from 2016, it can be seen that this gap was narrowing year by year, and the calculated data also confirmed this point. Yuncheng, Handan, Heze, Liaocheng and Bengbu in the co-development region were better than Kaifeng, Pingdingshan, Hebi, Jiaozuo and Bozhou in the core development region in terms of ecological innovation output benefits.

Figure 5.
Temporal evolution of ecological innovation output benefit of Zhongyuan urban agglomeration.
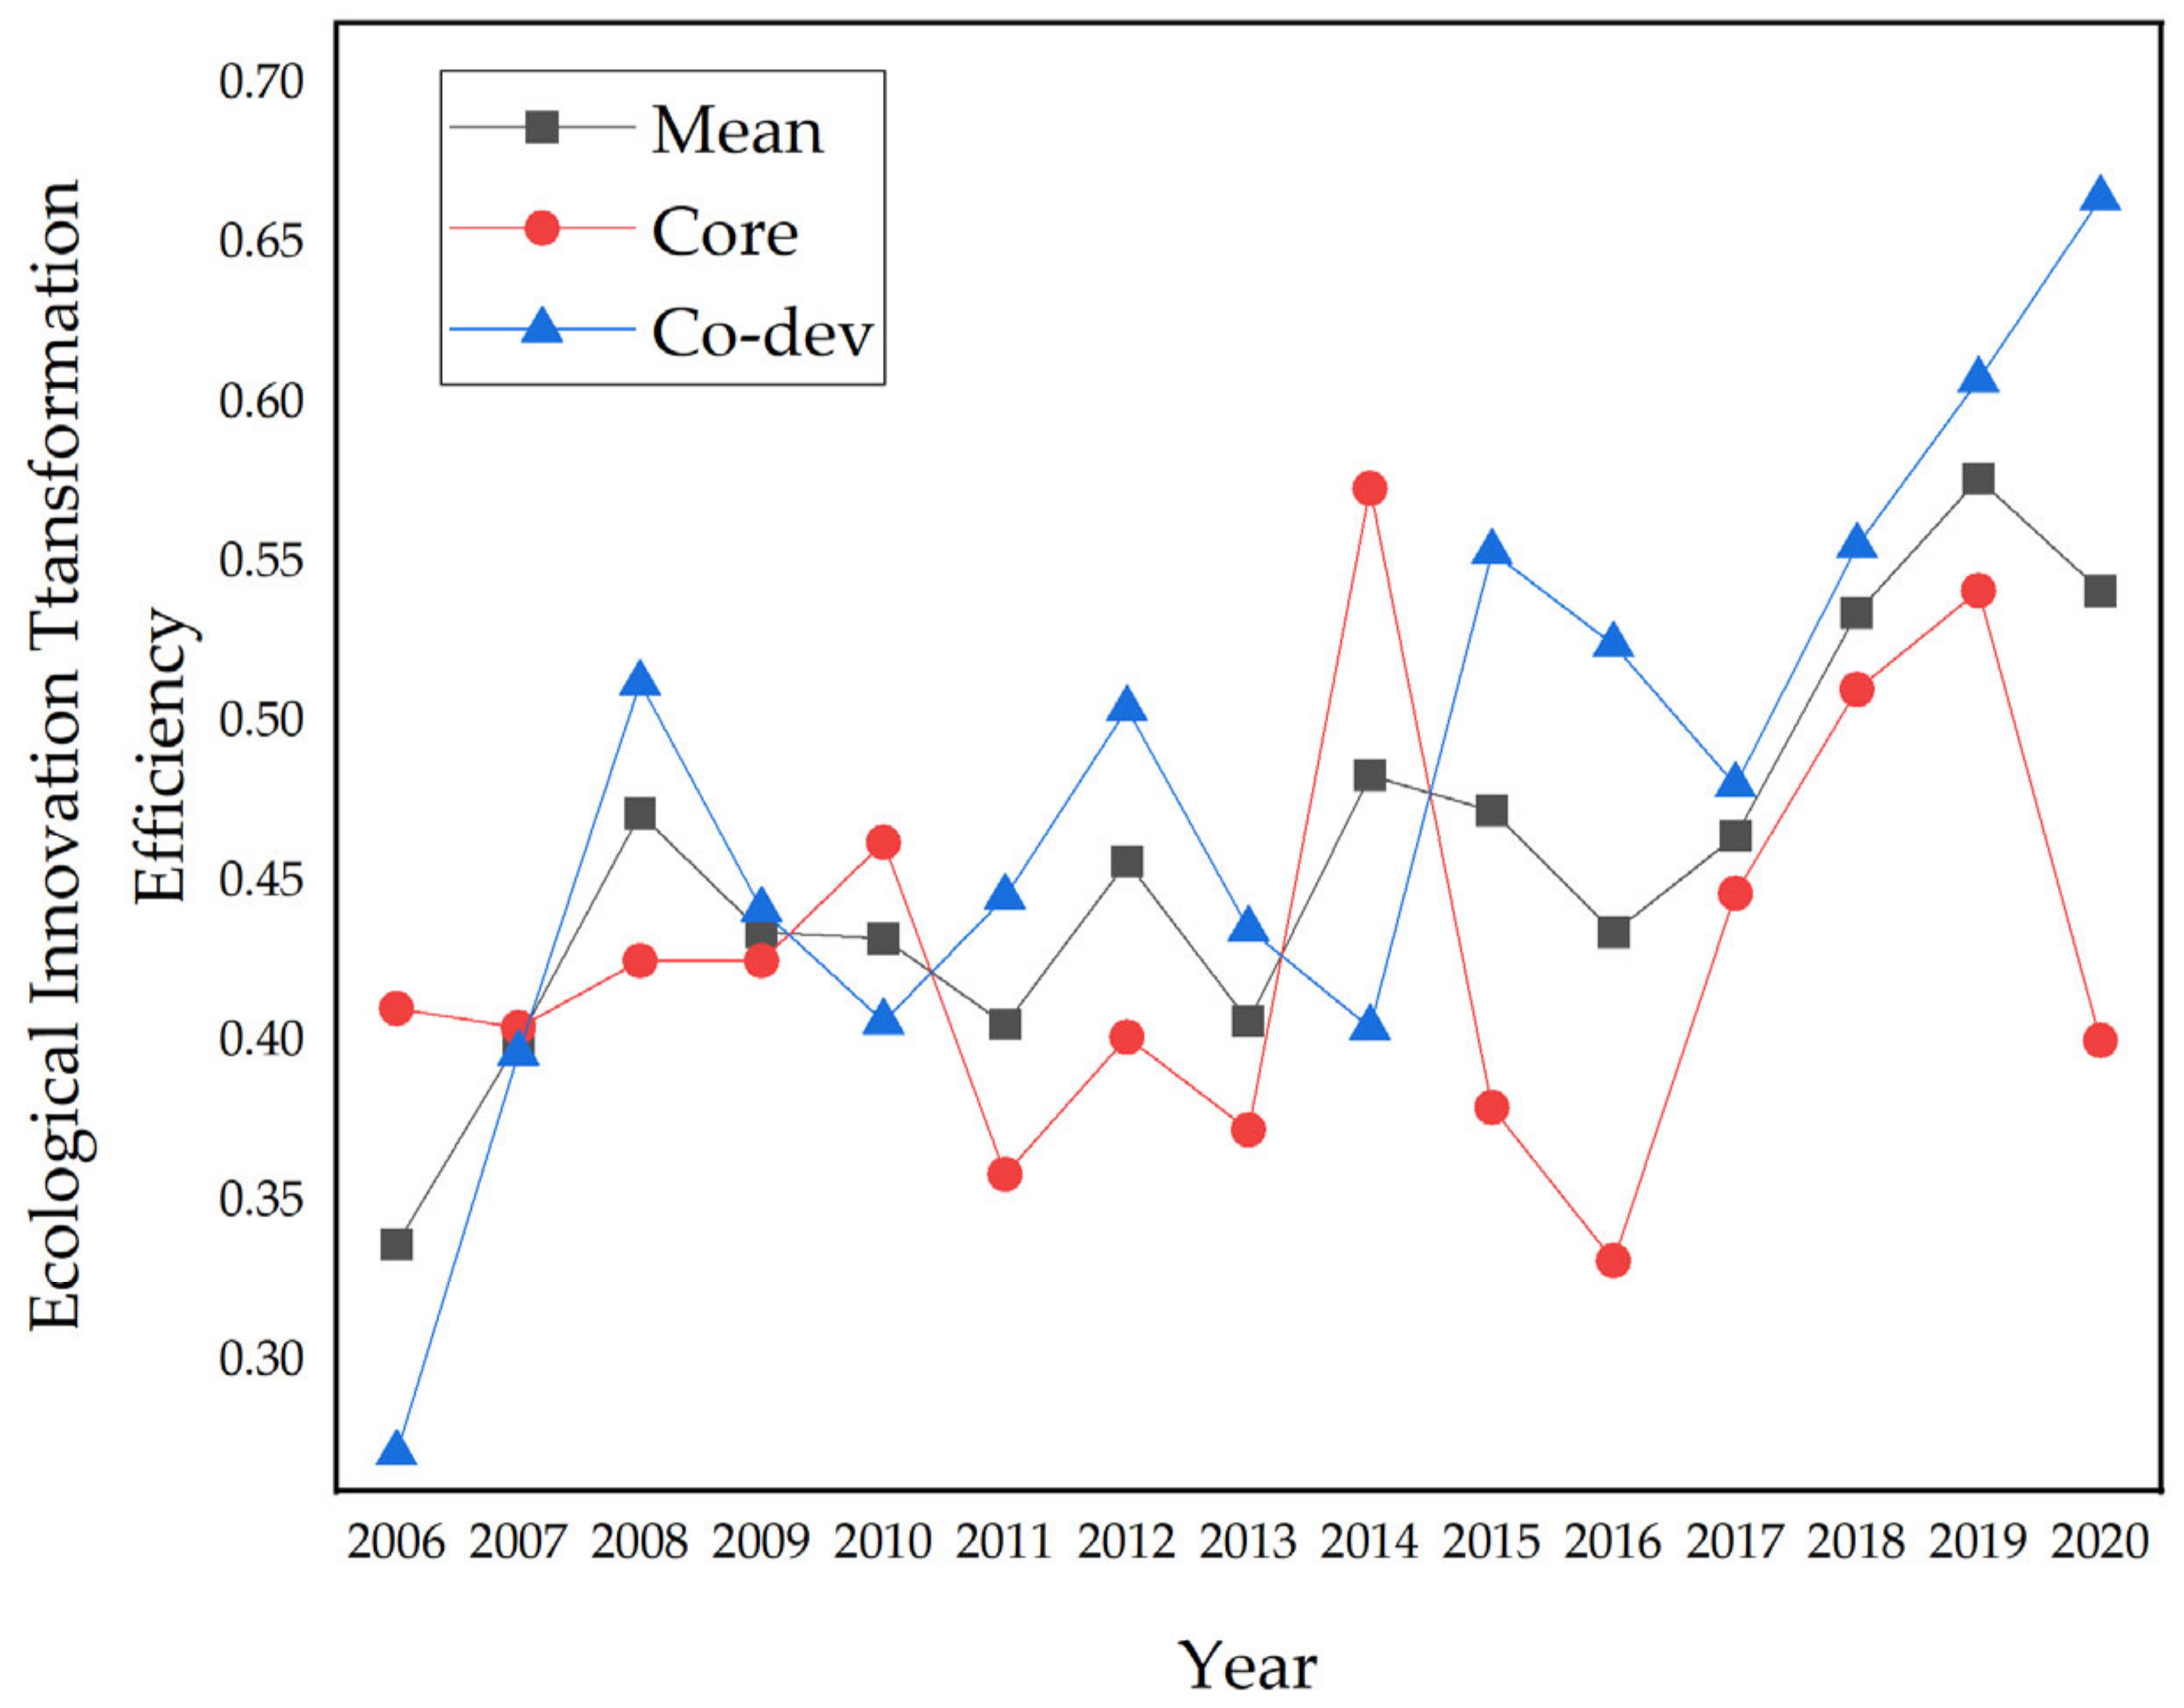
Moreover, the measurement of the ecological innovation transformation efficiency showed more interesting results (shown in Figure 6). In the years 2006, 2010 and 2014, the measurement results indicated that the innovation transformation efficiency of the core development region was significantly higher than that of the co-development region. However, since 2015, the transformation efficiency of the co-development region has been much higher than that of the core development region. The reason may be that most of the cities in the core development region had a lack of innovation and transformation, especially since there was a big gap between them and the cities in the co-development region in terms of crucial output indicators such as the turnover of technology market contracts. First, by analyzing the data of the starting year 2006, it can be seen that the average change range of the transformation efficiency of the core development region compared with the co-development region was 34%, and the average change range of the output benefit was 70%. In December 2016, the National Development and Reform Commission of China issued the Zhongyuan Urban Agglomeration Development Plan, so 2017 was selected as the representative year for analysis. The calculation results showed that the average change in innovation transformation efficiency was −7%, and the average change in output benefit was 48%. Finally, the calculation results of 2020, the year at the end of the evaluation cycle, indicated that the average change in innovation transformation efficiency was −30%, and the average change in output benefit was 29%.
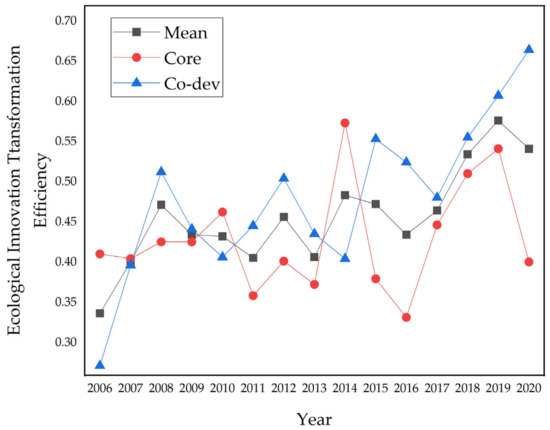
Figure 6.
Temporal evolution of ecological innovation transformation efficiency of Zhongyuan urban agglomeration.
From the analysis results, the ecological innovation output benefits of the core development region were higher than the average value of the urban agglomeration year by year. Still, the ecological innovation transformation efficiency was lower than the average value of the co-development region in some specific years. Especially in 2015–2020, although the ecological innovation transformation efficiency of the two regions had shown the same fluctuation trend, the fluctuation trend of the core development region was more significant. On the basis of the development plan of the Zhongyuan urban agglomeration, except Zhengzhou, Luoyang and Xinxiang, other regions with innovative advantages include Nanyang, Bengbu, Liaocheng, Handan, Xingtai, Yuncheng and Changzhi, all of which are located in the co-development region, resulting in meaningful diversities between the two regions in the field of innovative resource endowment, innovative human resources and high-tech industrial clusters. On the other hand, as a national central city and the core of urban agglomeration development, Zhengzhou’s radiation effect on surrounding cities, including Kaifeng, Xinxiang, Jiaozuo and Xuchang, had yet to reach the expectation. In particular, after many years of implementation of the Zhengzhou–Kaifeng integration policy, Kaifeng had failed to show beneficial results in terms of ecological innovation output benefits or ecological innovation transformation efficiency in this measurement, and it was classified as one of the cities which achieved a low level in output and efficiency.
To analyze the performance level of ecological innovation from the temporal dimension, Figure 7 reveals that the number of cities with different ecological innovation performance levels showed a slight fluctuation trend. It should be noted that the number of cities with a “low output and high efficiency” level fluctuated the most, basically showing an inverted U-shaped trend. In addition, it is noteworthy that the number of cities with a “low output and low efficiency” level fluctuated between 15 and 21, accounting for more than half of all the cities in the urban agglomeration, which indicates that the Zhongyuan urban agglomeration is still in the development stage of high input and low efficiency; environmental pollution and energy consumption are still being maintained at a relatively high level; the transformation efficiency of ecological innovation in particular is far from meeting expectations, and the evolution of the urban agglomeration is still facing the dilemma of high energy consumption and low output benefits. Therefore, the relationship between the ecological environment, energy consumption and innovation-driven development has yet to be effectively improved. At the same time, we can recognize that the number of cities with “high output and high efficiency” fluctuates between 2 and 10, accounting for about one third of all cities in urban agglomerations. This illustrates that apart from Zhengzhou, which is positioned as a national central city, Luoyang, Bengbu, Handan, Heze and other cities have made significant progress in energy conservation and environmental protection, efficient utilization of resources, ecological innovation transformation, and have created a development model that coordinates resources, environment and innovation-driven development. The ecological innovation performance of the Zhongyuan urban agglomeration, driven by such major strategies, including “ecological protection and high-quality development in the Yellow River basin”, “high-quality development in the central region”, and “self-reliance and self-reliance in a high-level of science and technology”, continues to promote industrial transformation and upgrading, energy conservation and emission reduction, and always adheres to ecological innovation-driven development.
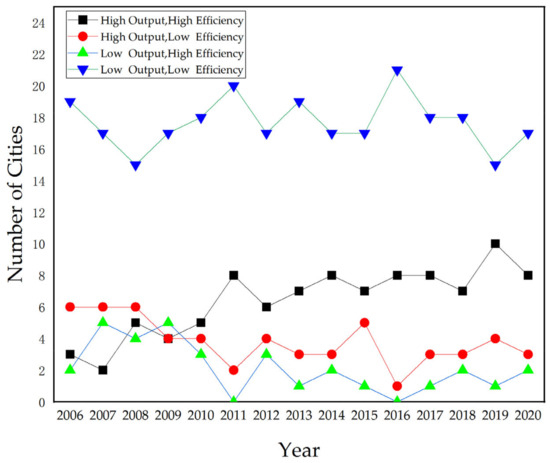
Figure 7.
Temporal evolution of the ecological innovation performance level in Zhongyuan urban agglomeration.
3.4. Evolution Analysis of Ecological Innovation Performance from Spatial Perspective
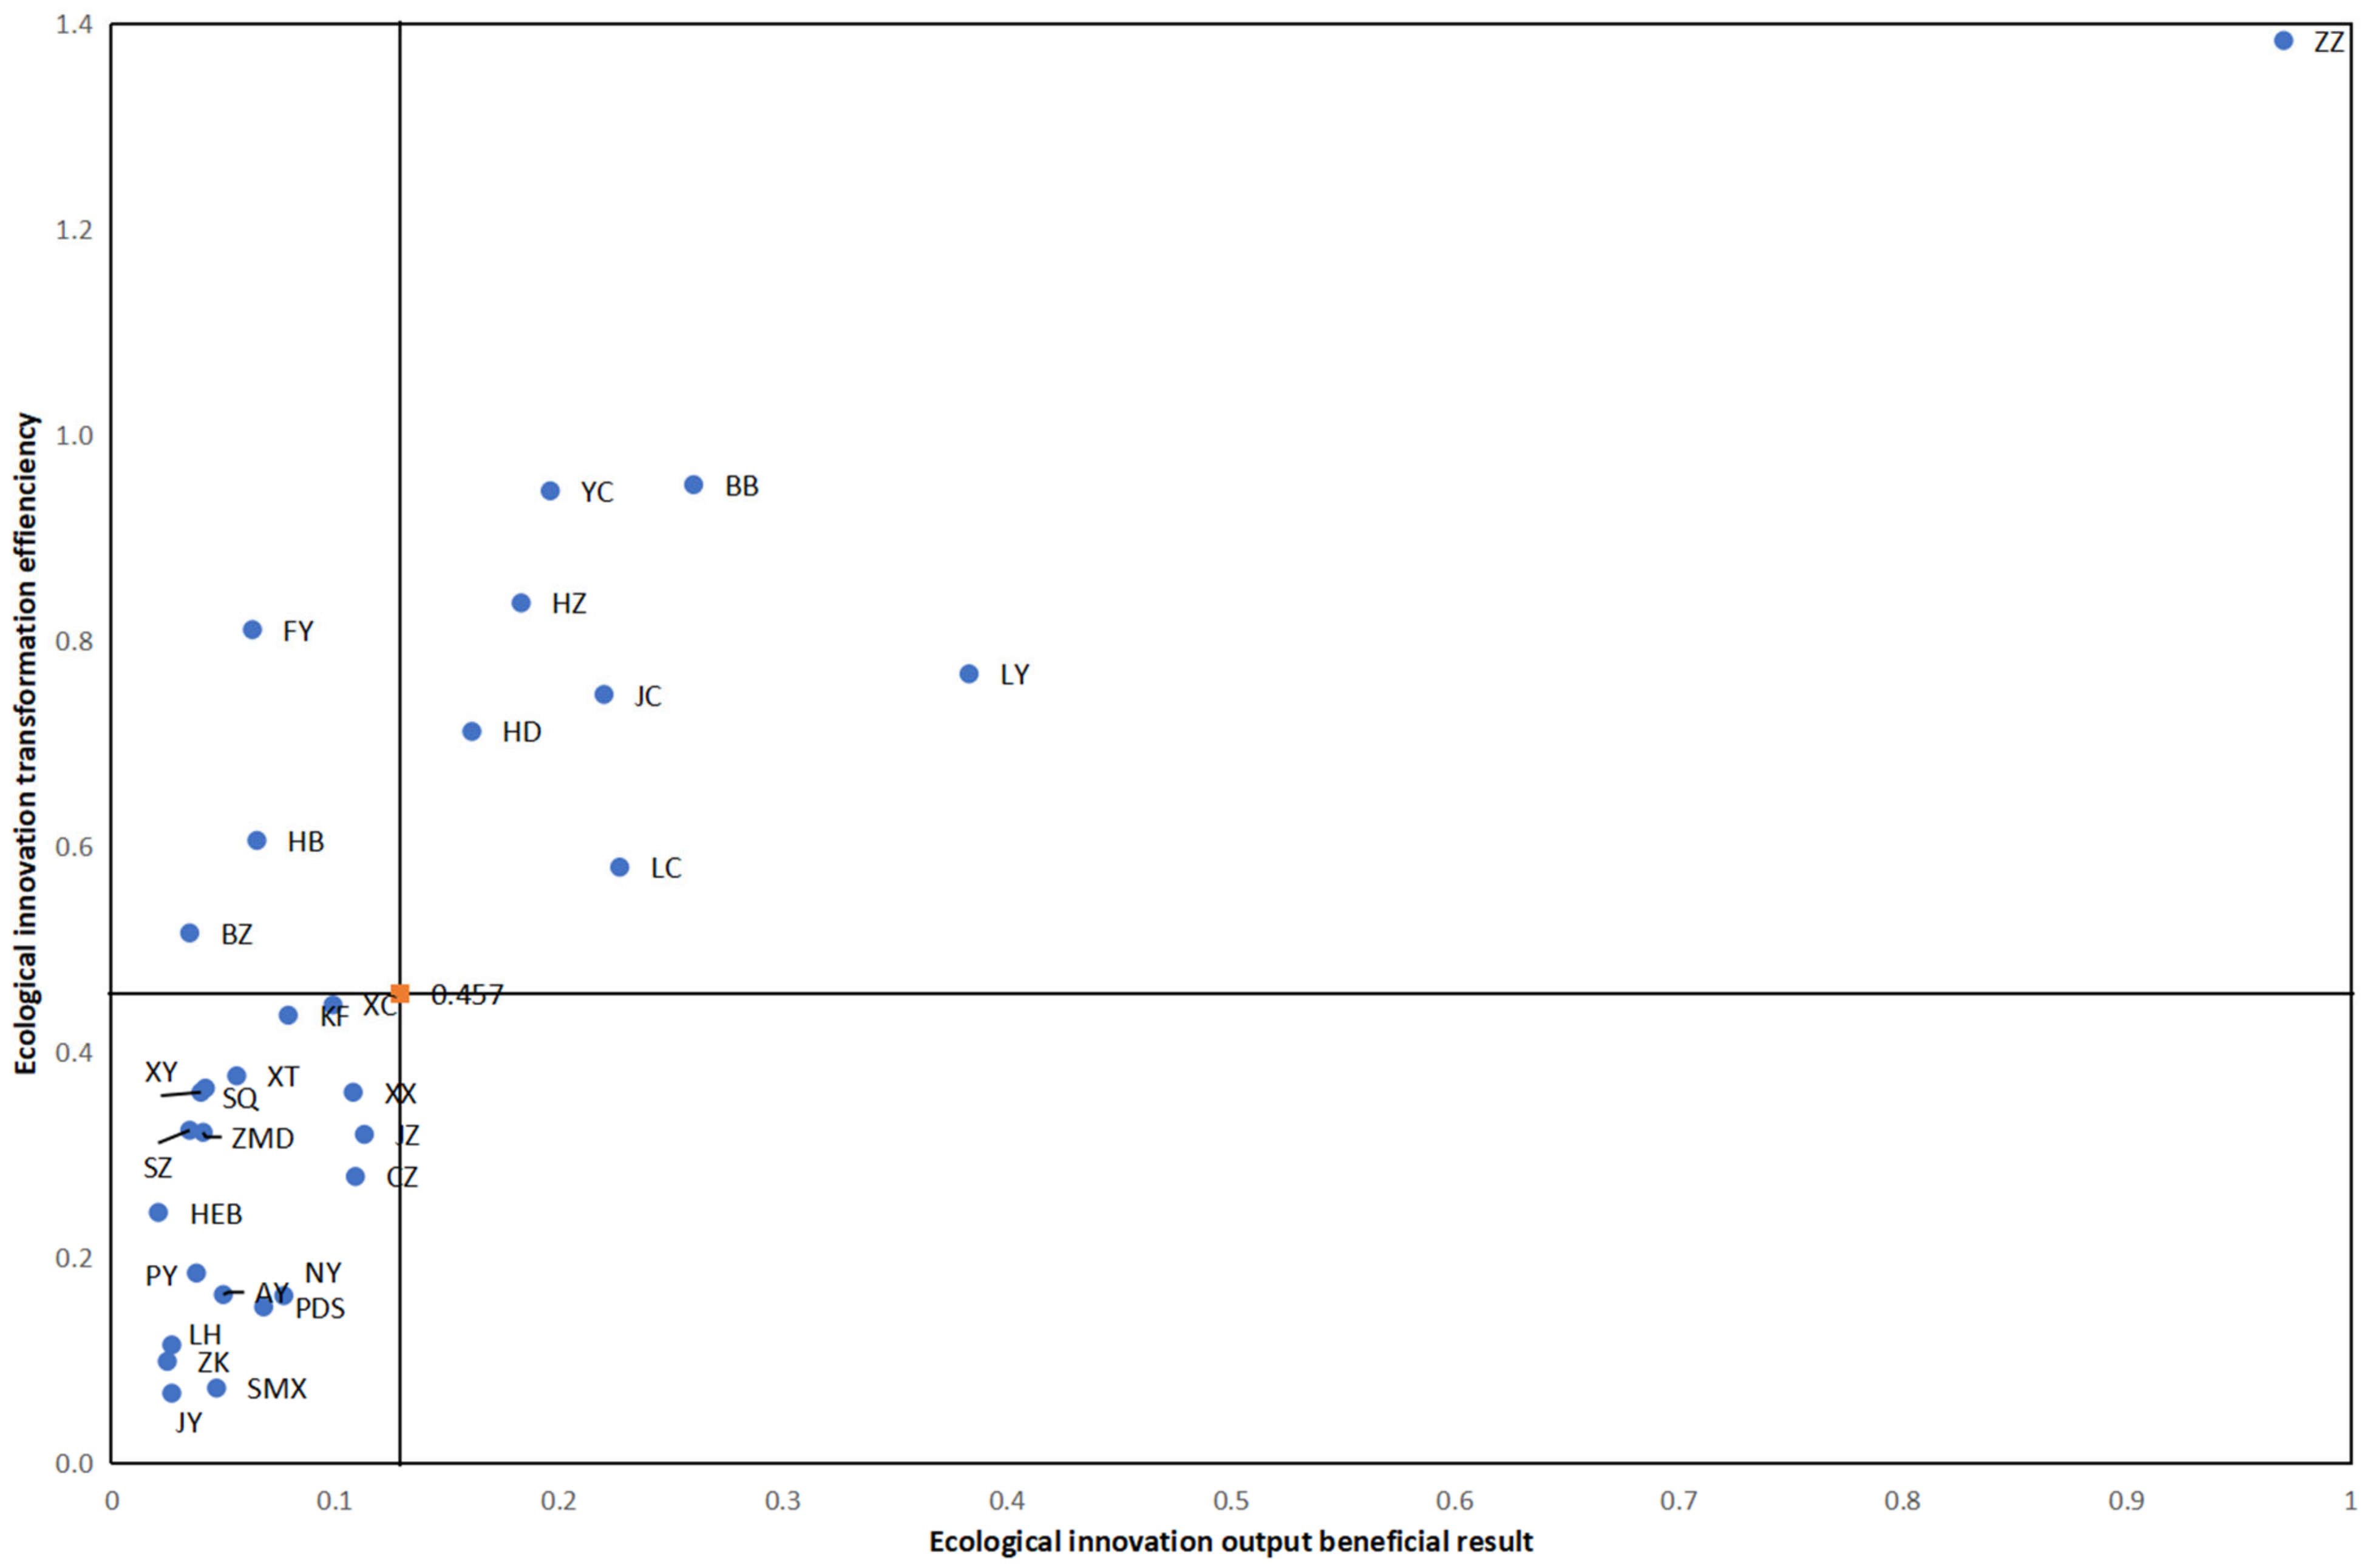
According to the above classification method of ecological innovation performance of the Zhongyuan urban agglomeration, the measured values of ecological innovation output benefits and ecological innovation transformation efficiency of 30 cities were compared with the average value of the entire urban agglomeration for the period from 2006 to 2020 (which is marked with an orange square in Figure 8, as the calculated results shown in Table 5; the mean value of innovation output benefits is 0.129, the mean value of innovation transformation efficiency is 0.457). Then, all 30 cities were divided into four different spatial distribution areas to complete the spatial distribution of ecological innovation performance of the Zhongyuan urban agglomeration, as shown in Figure 8. As a result, it can be seen that there are eight “high output and high efficiency” cities, accounting for 26.67% of all cities in the urban agglomeration, three of which were located in the core development region and the other five in the co-development region; three cities with “low output and high efficiency”, among them two in the core development region; 19 “low output and low efficiency” cities, accounting for 63.33%, with 10 of them in the core development region and nine of them in the co-development region; no one city was at the level of “high output and low efficiency”.
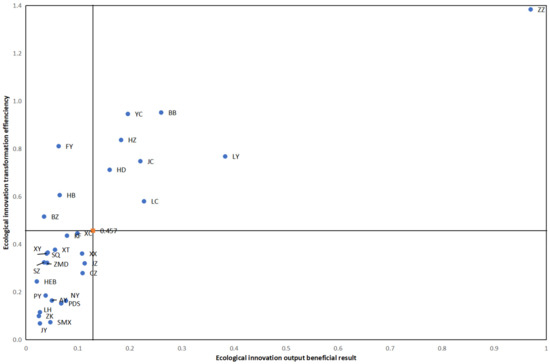
Figure 8.
Efficiency Matrix Distribution of cities with different ecological innovation performance levels in Zhongyuan urban agglomeration.
From the perspective of geographical location, the ecological innovation performance level in the north of the Zhongyuan urban agglomeration was significantly higher than in the south. In the Zhongyuan city cluster, Zhengzhou was positioned as a national central city; Luoyang and Xinxiang were important constituent cities of the National Innovation Demonstration Zones in Zhengzhou, Luoyang and Xinxiang, while Changzhi, Handan, Liaocheng, Anyang and other northern cities were targeted as regional central cities, as well as Jincheng, Xingtai, Hebi, Puyang and other resource-based cities. All these indicated that the northern region of the urban agglomeration was in the innovation resource endowment and that the innovative development foundation and policy support are better than those of Zhoukou, Zhumadian, Xinyang and other traditional agricultural cities in the south, which also results in “high yield and high efficiency” cities in the north, while “low yield and low efficiency” cities are in the south, forming a pattern of ecological innovation development in which the north is stronger than the south. However, it should be noted that in the south, Nanyang City has been identified as a sub-central city in Henan Province, which is equivalent to Luoyang, and is ready to vigorously develop the high-efficiency ecological economy demonstration zone in southern Henan. In addition, Bengbu, Fuyang, and Shangqiu are targeted as regional central cities. Suzhou, Huaibei, Bozhou and Pingdingshan are resource-based cities. However, in the overall ecological innovation performance evaluation of urban agglomeration, most cities are at the level of “low output and low efficiency”. On the one hand, Nanyang, Xinyang and Zhumadian are far away from Zhengzhou, which makes it difficult to form effective linkage radiation. On the other hand, agricultural planting plays a leading role in the economic and industrial structure, resulting in a weak foundation for innovation and development and weak growth.
4. Discussion
The conclusion of this research indicates that some indicators have an impact on the ecological innovation efficiency, mainly including ecological innovation input indicators and output indicators. There are significant correlations between input indicators and output indicators; changes of some input indicators can have a direct impact on some output indicators, and these relationships can provide some feasible optimization measures for the improvement of innovation ecological efficiency.
There are two major contributions in this research. (1) We built an evaluation index system of ecological innovation efficiency based on the development characteristics of urban agglomeration, which not only considered the benefits of ecological innovation output but also fully considered the transformation efficiency between ecological innovation input and output, and evaluated the ecological innovation efficiency of each city in the Zhongyuan urban agglomeration through this evaluation index system. (2) Combined with the background of policy constraints such as air pollution control, carbon peak and carbon neutralization, PM2.5 and CO2 emissions were selected as the undesirable output in the process of ecological innovation evaluation, and the super-efficiency SBM–DEA model was applied to calculate the ecological innovation efficiency.
However, this paper still contains some particular limitations. First, due to the severe lack of data acquisition, many important indicators (such as new product sales revenue) have not been included in the evaluation system for ecological innovation efficiency constructed in our research. As a result, the evaluation index system needs to be more comprehensive to avoid deviation in ecological innovation performance evaluation results. Moreover, the spatial Dubin model is not utilized to analyze the spatial agglomeration characteristics and evolution rules of the ecological innovation efficiency of the Zhongyuan urban agglomeration, which can be further explored in future research.
5. Conclusions
In this research, the ecological innovation efficiency of the Zhongyuan urban agglomeration was comprehensively measured and evaluated from the temporal and spatial perspectives. We established an urban agglomeration ecological innovation efficiency evaluation index system. We exploited the super-efficiency SBM–DEA Model, which considers the undesirable output (PM2.5 density and CO2 Emissions) to reveal the spatial–temporal evolution trend. Some research findings have been obtained and are summarized as follows:
- (1)
- Overall, the ecological innovation ability of the Zhongyuan urban agglomeration is inadequate, and the ecological innovation efficiency is relatively low. The ecological innovation performance of each city is substantially lower than that of Zhengzhou; the linkage and radiation effect of urban agglomeration innovation-driven development is not effectively reflected, and relevant national policies such as National Innovation Demonstration Zones in Zhengzhou, Luoyang and Xinxiang have not been effectively implemented.
- (2)
- From the temporal perspective, the temporal evolution of the Zhongyuan urban agglomeration shows a less obvious U-shaped trend. Although the innovation output benefits of the core development region (including 14 cities) are significantly better than the innovation output benefits of the co-development region (including 16 cities), it should be noted that this innovation benefit gap has been decreasing from 2018, which corresponds to the average performance level of the ecological innovation transformation efficiency of these the two regions, as the average ecological innovation transformation efficiency level of the co-development region exceeds the average efficiency value of the core development region. Otherwise, influenced by many factors, such as government investment, environmental regulation policies, and innovation-driven development policies, the transformation efficiency of ecological innovation in the Zhongyuan urban agglomeration shows a dynamic development trend.
- (3)
- From the spatial perspective, there are eight cities at the “high output and high efficiency”, three cities at the “low output and high efficiency” level, 19 cities at the “low output and low efficiency” level and no city at the “high output and low efficiency” level. In general, more than half of the cities are at a low level, and this indicates the urban agglomeration needs to further coordinate the sharing of ecological innovation resources, increase the investment of innovation resources, strengthen the control of undesirable outputs through various policies and regulations, increase the output of ecological innovation, improve the efficiency of ecological innovation transformation, and strive to achieve an effective balance between innovative resources, ecological environment protection and energy conservation and utilization. Furthermore, from the perspective of spatial distribution, the ecological innovation performance of most cities in the north is better than that in the south, which can be attributed to the northern cities having a good industrial foundation and a substantial innovation resource endowment. In contrast, the southern cities are based on agricultural development and lack a foundation for ecological innovation and development. In the future, we hope to achieve multi-core development in the urban agglomeration by constructing the southern sub-central city of Nanyang.
- (4)
- Through the correlation analysis between the inputs and outputs of ecological innovation, it can be seen that the optimization path to improve the ecological innovation efficiency mainly includes increasing the input of innovation manpower and capital while controlling the energy consumption, so as to increase the desirable output of ecological innovation and control the undesirable output. Furthermore, cities and regions should try their best to increase the total volume of contract turnover in the technology market and increase the number of green patents authorized, and meanwhile further strengthen the control of air pollution to reduce the PM2.5 density and the total emissions of CO2.
According to the evaluation of ecological innovation efficiency and analysis of related policies, some suggestions are provided as follows:
- (1)
- Taking the opportunity of building Nanyang as the sub-central city, the relevant sectors should accelerate the construction of the efficient ecological economy demonstration area in the south of Henan province. In the next stage, they should strengthen the exchange of resources and talents in southern Henan by constructing the Nanyang–Xinyang–Hefei high-speed railway. The above measures will change the situation of ecological innovation efficiency being more robust in the north and weaker in the south.
- (2)
- Based on the low level of ecological innovation performance in Kaifeng, they should further strengthen the integration of Zhengzhou and Kaifeng, promote deep and practical integration, and incorporate the innovative development of Kaifeng into the development process of modern metropolitan areas, coordinate the innovative resources of university parks in the east of Zhengzhou and the west of Kaifeng, and build the “mass entrepreneurship and innovation” corridor between Zhengzhou and Kaifeng.
- (3)
- Under the circumstance of the development planning of the Zhongyuan urban agglomeration, the Zhengzhou metropolitan area (including Zhengzhou, Kaifeng, Xinxiang, Jiaozuo and Xuchang) is the development core region of the Zhongyuan urban agglomeration; the western area (including Yuncheng and Sanmenxia) is positioned as the demonstration area of transformation and innovation development; the northern area (including Changzhi, Anyang, Puyang, Handan, Xingtai and Liaocheng) is positioned as the demonstration area of cross-regional and coordinated development; the southern area (including Nanyang, Zhumadian and Xinyang) is positioned as the demonstration area of efficient ecological economy, and the eastern area (including Heze, Huaibei, Suzhou, Bengbu, and Fuyang) is positioned as the demonstration area for undertaking the industrial transfer. Each demonstration zone should bring into full play its primary functions according to the spatial layout and functional positioning of the urban agglomeration, deepen the sharing of education, science and technology, culture, ecology, and other resources, and form an ecological innovation linkage radiation effect around the core development zone.
To sum up, it is hoped that the above suggestions can promote the continuous development of ecological innovation in the urban agglomeration, improve the ecological innovation output benefit and transformation efficiency, and strengthen the ecological innovation-driven development of low-level regions. This way, the gap between the northern and southern regions can be narrowed to achieve the internal linkage development of the urban agglomeration.
Author Contributions
Conceptualization, Y.Y. and Z.S.; methodology, Z.S. and W.W.; software, H.F. and Y.W.; validation, S.L. and Y.W.; formal analysis, Y.Y. and W.W.; investigation, Y.Y. and S.L.; resources, Y.Y.; data curation, Z.S. and H.F.; writing–original draft preparation, Z.S.; writing–review and editing, Y.Y. and Z.S.; visualization, Y.Y.; supervision, Y.W.; project administration, Y.Y.; funding acquisition, Y.Y. and W.W. All authors have read and agreed to the published version of the manuscript.
Funding
This research was funded by the Soft Science Research Major Project of Henan Province (232400411002), Philosophy and Social Science Research and Planning Project of Henan Province (2022BJJ065), Soft Science Research Project of Henan Province (222400410160), Humanities and Social Science Research Projects in Colleges and Universities of Henan Province (2024-ZZJH-152).
Institutional Review Board Statement
Not applicable.
Informed Consent Statement
Not applicable.
Data Availability Statement
Readers can obtain the raw datasets used in this paper by themselves through the data sources described in Section 4, or by contacting the first author or the corresponding author.
Acknowledgments
We gratefully acknowledge the anonymous reviewers for their insightful comments and suggestions for this paper.
Conflicts of Interest
The authors declare no conflict of interest.
References
- Liu, L.; Yang, Y.; Liu, S.; Gong, X.; Zhao, Y.; Jin, R.; Duan, H.; Jiang, P. A comparative study of green growth efficiency in Yangtze River Economic Belt and Yellow River Basin between 2010 and 2020. Ecol. Indic. 2023, 150, 110214. [Google Scholar] [CrossRef]
- Yang, Y.; Chen, L.; Su, Z.; Wang, W.; Wang, Y.; Luo, X. Study on Spatiotemporal Features and Factors Influencing the Urban Green Total Factor Productivity in the Yellow River Basin under the Constraint of Pollution Reduction and Carbon Reduction. Processes 2023, 11, 730. [Google Scholar] [CrossRef]
- The General Office of the Communist Party of China Central Committee; The General Office of the State Council. The Guiding Opinions on Promoting High Quality Development of Central China in the New Era. 2021. Available online: https://www.gov.cn/zhengce/2021-07/22/content_5626642.htm (accessed on 21 July 2021).
- National Development and Reform Commission. The Development Plan for Zhongyuan Urban Agglomeration. 2016. Available online: https://www.gov.cn/xinwen/2017-01/05/5156816/files/4e3c18bb7f2d4712b7264f379e7cb416.pdf (accessed on 29 December 2016).
- Wang, K.; Zhang, F.; Xu, R.; Miao, Z.; Cheng, Y.; Sun, H. Spatiotemporal pattern evolution and influencing factors of green innovation efficiency: A China’s city level analysis. Ecol. Indic. 2023, 146, 109901. [Google Scholar] [CrossRef]
- Yu, Y.; Xu, Z.; Shen, P.; Zhang, L.; Ni, T. Efficiency Evaluation and Influencing Factors of Green Innovation in Chinese Resource-Based Cities: Based on SBM-Undesirable and Spatial Durbin Model. Int. J. Environ. Res. Public. Health 2022, 19, 13772. [Google Scholar] [CrossRef] [PubMed]
- Zheng, Y.; Qin, K. Performance Evaluation and Its Spatio-temporal Differences of Ecological Innovation in China’s Capital Cities—Empirical Analysis Based on Innovation-driven Development Strategy Implementation. Sci. Technol. Prog. Policy 2021, 4, 36–44. [Google Scholar]
- Bossle, M.B.; Barcellos, M.D.d.; Vieira, L.M.; Sauvée, L. The drivers for adoption of eco-innovation. J. Clean. Prod. 2016, 113, 861–872. [Google Scholar] [CrossRef]
- Franceschini, S.; Faria, L.G.D.; Jurowetzki, R. Unveiling scientific communities about sustainability and innovation. A bibliometric journey around sustainable terms. J. Clean. Prod. 2016, 127, 72–83. [Google Scholar] [CrossRef]
- Fussler, C.; James, P. Driving Eco-Innovation: A Breakthrough Discipline for Innovation and Sustainability; Pitman Pub: London, UK, 1996. [Google Scholar]
- OECD. Environmental Policy, Technological Innovation and Patents; OECD: Paris, France, 2008. [Google Scholar]
- Dangelico, R. Green Product Innovation: Where we are and where we are going. Bus. Strateg. Environ. 2015, 2, 560–576. [Google Scholar] [CrossRef]
- Huber, J. Technological environmental innovations (TEIs) in a chain-analytical and life-cycle-analytical perspective. J. Clean. Prod. 2021, 16, 1980–1986. [Google Scholar] [CrossRef]
- Oduro, S.; Maccario, G.; De Nisco, A. Green innovation: A multidomain systematic review. Eur. J. Innov. Manag. 2022, 25, 567–591. [Google Scholar] [CrossRef]
- Costantini, V.; Crespi, F.; Marin, G.; Paglialunga, E. Eco-innovation, sustainable supply chains and environmental performance in European industries. J. Clean. Prod. 2017, 155, 141–154. [Google Scholar] [CrossRef]
- Alegre, J.; Lapiedra, R.; Chiva, R. A measurement scale for product innovation performance. Eur. J. Innov. Manag. 2006, 9, 333–346. [Google Scholar] [CrossRef]
- Wang, C.; Li, J. An Evaluation of Regional Green Innovation Performance in China and Its Spatial-temporal Differences Based on the Panel Data of Inter-provincial Industrial Enterprises from 2005 to 2015. Sci. Res. Manag. 2019, 40, 29–46. (In Chinese) [Google Scholar] [CrossRef]
- Bai, J. On regional innovation efficiency: Evidence from panel data of China’s different provinces. Reg. Stud. 2013, 47, 773–788. [Google Scholar] [CrossRef]
- Ren, Y.; Niu, C.; Niu, T.; Yao, X. Theoretical model and empirical study of green innovation efficiency. Manag. World. 2014, 7, 176–177. (In Chinese) [Google Scholar]
- Li, J.; Du, Y. Spatial Effect of Environmental Regulation on Green Innovation Efficiency: Evidence from Prefectural-level Cities in China. J. Clean. Prod. 2021, 286, 125032. [Google Scholar] [CrossRef]
- Luo, X.; Zhang, W. Green innovation efficiency: A threshold effect of research and development. Clean Technol. Environ. Policy 2021, 23, 285–298. [Google Scholar] [CrossRef]
- Lu, C.; Chen, M.; Tian, G. Spatial-Temporal Evolution and Influencing Factors of Urban Green Innovation Efficiency in China. J. Environ. Public Health 2022, 19, 3039. [Google Scholar] [CrossRef]
- Du, J.-L.; Liu, Y.; Diao, W.-X. Assessing Regional Differences in Green Innovation Efficiency of Industrial Enterprises in China. Int. J. Environ. Res. Public. Health 2019, 16, 940. [Google Scholar] [CrossRef]
- Bai, L.; Guo, T.; Xu, W.; Luo, K. The Spatial Differentiation and Driving Forces of Ecological Welfare Performance in the Yangtze River Economic Belt. Int. J. Environ. Res. Public. Health 2022, 19, 14801. [Google Scholar] [CrossRef]
- Zhao, T.; Zhou, H.; Jiang, J.; Yan, W. Impact of Green Finance and Environmental Regulations on the Green Innovation Efficiency in China. Sustainability 2022, 14, 3206. [Google Scholar] [CrossRef]
- Wu, F.; Fu, X.; Zhang, T.; Wu, D.; Sindakis, S. Examining Whether Government Environmental Regulation Promotes Green Innovation Efficiency—Evidence from China’s Yangtze River Economic Belt. Sustainability 2022, 14, 1827. [Google Scholar] [CrossRef]
- Cecchini, L.; Venanzi, S.; Pierri, A.; Chiorri, M. Environmental efficiency analysis and estimation of CO2 abatement costs in dairy cattle farms in Umbria (Italy): A SBM-DEA model with undesirable output. J. Clean. Prod. 2018, 197, 895–907. [Google Scholar] [CrossRef]
- Yang, S.W.; Wu, T.; Li, X.Z. Study on the spatial-temporal differences and influencing factors of green innovation efficiency in the Yangtze River Economic Belt. Macroeconomics 2018, 6, 102. [Google Scholar]
- Song, M.; Chen, Y.; An, Q. Spatial econometric analysis of factors influencing regional energy efficiency in China. Environ. Sci. Pollut. Res. 2018, 25, 13745–13759. [Google Scholar] [CrossRef] [PubMed]
- Wang, H.; Yang, G.; Qin, J. City Centrality, Migrants and Green Innovation Efficiency: Evidence from 106 Cities in the Yangtze River Economic Belt of China. Int. J. Environ. Res. Public. Health 2020, 17, 652. [Google Scholar] [CrossRef] [PubMed]
- García-Granero, E.M.; Piedra-Muñoz, L.; Galdeano-Gómez, E. Eco-innovation measurement: A review of firm performance indicators. J. Clean. Prod. 2018, 191, 304–317. [Google Scholar] [CrossRef]
- Tian, P.; Lin, B.Q. Regional technology gap in energy utilization in China’s light industry sector: Non-parametric meta-frontier and sequential DEA methods. J. Clean. Prod. 2018, 178, 880–889. [Google Scholar] [CrossRef]
- Han, L.J. Relationship between urbanization and urban air quality: An insight on fine particulate dynamics in China. Prog. Geogr. 2018, 37, 1011–1021. [Google Scholar] [CrossRef]
- Dong, S.; Xue, Y.; Ren, G.; Liu, K. Urban Green Innovation Efficiency in China: Spatiotemporal Evolution and Influencing Factors. Land 2023, 12, 75. [Google Scholar] [CrossRef]
- Choi, Y.; Yu, Y.; Lee, H.S. A Study on the Sustainable Performance of the Steel Industry in Korea Based on SBM-DEA. Sustainability 2018, 10, 173. [Google Scholar] [CrossRef]
- Song, J.; Wang, J.; Chen, Z. How Low-Carbon Pilots Affect Chinese Urban Energy Efficiency: An Explanation from Technological Progress. Int. J. Environ. Res. Public. Health 2022, 19, 15563. [Google Scholar] [CrossRef]
- Tone, K. A slacks-based measure of efficiency in data envelopment analysis. Eur. J. Oper. Res. 2001, 130, 498–509. [Google Scholar] [CrossRef]
- Zhang, K.; Shen, J.; Han, H.; Zhang, J. Study of the Allocation of Regional Flood Drainage Rights in Watershed Based on Entropy Weight TOPSIS Model: A Case Study of the Jiangsu Section of the Huaihe River, China. Int. J. Environ. Res. Public. Health 2020, 17, 5020. [Google Scholar] [CrossRef] [PubMed]
- Dong, X.; Fu, W.; Yang, Y.; Liu, C.; Xue, G. Study on the Evaluation of Green Technology Innovation Efficiency and Its Influencing Factors in the Central Plains City Cluster of China. Sustainability 2022, 14, 11012. [Google Scholar] [CrossRef]
- Li, G.; Liu, J.; Li, T. Regional Differences of Energy Eco-efficiency in Manufacturing Industry under Consideration of Undesirable Outputs Based on the SBM-Tobit Two-stage Model. Chin. Manag. Sci. 2019, 11, 76–87. [Google Scholar]
- Xie, T.; Wang, M.E.; Su, C.; Chen, W.P. Evaluation of the natural attenuation capacity of urban residential soils with ecosystem-service performance index (EPX) and entropy-weight methods. Environ. Pollut. 2018, 238, 222–229. [Google Scholar] [CrossRef] [PubMed]
- Tzeng, G.-H.; Huang, J.-J. Multiple Attribute Decision Making: Methods and Applications; CRC Press: Boca Raton, FL, USA, 2011; ISBN 1439861579. [Google Scholar]
- Chen, P. Effects of normalization on the entropy-based TOPSIS method. Expert. Syst. Appl. 2019, 136, 33–41. [Google Scholar] [CrossRef]
- Rui, X.; Zhang, S.; Li, J.; Li, H.; Ge, L.; Yuan, G. Spatial distribution and quantitative identification of contributions for nutrient and beneficial elements in top- and sub-soil of Huairou District of Beijing, China. Ecol. Indic. 2023, 154, 110853. [Google Scholar] [CrossRef]
- Chen, L.; Ma, Y. How Do Ecological and Recreational Features of Waterfront Space Affect Its Vitality? Developing Coupling Coordination and Enhancing Waterfront Vitality. Int. J. Environ. Res. Public. Health 2023, 20, 1196. [Google Scholar] [CrossRef]
- Wang, S.; Duan, L.; Zhu, Q.; Zhang, Y. Spatial Differences of Ecological Well-Being Performance in the Poyang Lake Area at the Local Level. Int. J. Environ. Res. Public. Health 2022, 19, 11439. [Google Scholar] [CrossRef]


Disclaimer/Publisher’s Note: The statements, opinions and data contained in all publications are solely those of the individual author(s) and contributor(s) and not of MDPI and/or the editor(s). MDPI and/or the editor(s) disclaim responsibility for any injury to people or property resulting from any ideas, methods, instructions or products referred to in the content. |
© 2023 by the authors. Licensee MDPI, Basel, Switzerland. This article is an open access article distributed under the terms and conditions of the Creative Commons Attribution (CC BY) license (https://creativecommons.org/licenses/by/4.0/).