Article

A Dynamic Assessment of Rubber–Sand Mixtures as Subgrade Materials during Vibratory Roller Compaction through DEM Simulation in 2D

1
School of Civil Engineering, Chongqing University, Chongqing 400045, China
2
Foshan Transportation Science and Technology Co., Ltd., Foshan 528000, China
3
School of Transportation, Southeast University, Nanjing 210096, China
*
Author to whom correspondence should be addressed.
Sustainability 2023, 15(19), 14238; https://doi.org/10.3390/su151914238
Submission received: 22 August 2023 / Revised: 22 September 2023 / Accepted: 25 September 2023 / Published: 26 September 2023
(This article belongs to the Section Sustainable Engineering and Science)

Abstract

:
The accumulation of discarded tire rubber poses significant challenges in terms of land usage and environmental hazards. To address this issue, this article explores the potential reuse of rubber in roadbed engineering. This study conducts a comprehensive examination of the vibration compaction process involving a vibratory roller and rubber–sand mixtures, utilizing the discrete element method (DEM) in a two-dimensional (2D) framework to investigate the impact of dynamic vibration compaction on sand mixtures with varying rubber contents under different roller working conditions, while also evaluating the associated energy consumption. The results reveal that both the rubber content and operational parameters of the roller significantly influence compaction vibration effects. Notably, optimal rolling frequency, velocity, and rolling mass show correlations with the rubber content. Furthermore, this research provides a microscopic understanding of the compaction process, offering detailed insights into displacement fields, velocity fields, and contact forces.

1. Introduction

The rapid growth of the global economy has led to a concerning surge in automobile numbers, resulting in a significant rise in discarded tire quantities. Startlingly, statistics reveal an annual disposal of approximately 27.0 million tons of tires [1,2]. Unfortunately, the tire recycling rate remains low, causing vast tire stockpiles that devour precious land resources. Furthermore, the current practice of incinerating these discarded tires significantly contributes to environmental pollution. Hence, it is vital to explore effective tire recycling methods. One promising approach involves converting processed rubber from these tires into sheets or powder, showcasing remarkable properties like low relative density, high water permeability, and exceptional elastic deformation. These attributes render it highly suitable for diverse geotechnical applications, offering substantial potential for extensive utilization [3,4]. Thus, embracing this recycling technique not only tackles environmental challenges linked with tire waste but also furnishes valuable material resources for sustainable deployment in the geotechnical realm.
Significant research has been directed towards exploring the potential applications of rubber–soil mixtures in subgrade engineering [5,6]. For example, Khatami et al. [7] studied the evolution of soil arching in sand–rubber mixtures by discrete element method in a trapdoor apparatus. Yaowarat et al. [8] investigated the utilization of natural rubber latex as an eco-friendly additive to augment flexural strength properties in concrete pavements. Saberian et al. [9] assessed the viability of cost-effective and low-carbon solutions for pavement base/subbase, examining blends of waste crushed rock and rubber. Li et al. [10] delved into the mobilization behavior of aged asphalt–rubber binder during reclaimed asphalt pavement mixture recycling. They analyzed potential mobilization of the bitumen phase and rubber particles and their correlation with RARP mixture cracking resistance. Tran et al. [11] researched the influence of NRL on strength development in cement-stabilized lateritic soil and recycled aggregate blends, aiming to establish a sustainable pavement base. Valizadeh et al. [12] studied the soil liquefaction-induced uplift of buried pipes in a sand–granulated rubber mixture. Additionally, Tan et al. [13] conducted an extensive study investigating rubber’s performance on icy pavement, both experimentally and theoretically. Despite these valuable contributions, current studies predominantly focus on the static behavior of rubber–sand mixtures in road applications, neglecting their dynamic characteristics during construction. Addressing rubber’s low stiffness and high elasticity is essential, given their significant impact on road molding quality. Investigating the dynamic properties of rubber–soil mixtures assumes paramount importance in advancing our comprehension of their behavior under construction conditions. By illuminating dynamic behavior, researchers can further optimize rubber–soil mixture utilization and performance in subgrade applications, thereby contributing to the development of more sustainable and resilient road infrastructure.
Vibration compaction stands as a widely embraced technique in subgrade construction, typically executed via a vibratory roller. This established roller generates a targeted exciting force, accomplished through an eccentric block operating at a specific frequency. This mechanism effectively compresses the surface material, heightening its density. The roller’s curved surface and limited contact area yield substantial advantages, including robust unit compaction efficacy, an extensive influence range, and the capability to attain considerable compaction depths, rendering it especially suited for granular materials. Although preceding research has predominantly centered on in situ assessments to gauge vibratory roller effectiveness, Wersall et al. [14,15] identified an optimal operating frequency for the roller. This revelation led to enhanced vibration compaction, reduced fuel consumption, and prolonged roller longevity. Nevertheless, a discernible gap persists in the scrutiny of vibration compaction performance specific to rubber–sand mixtures. Executing field tests for such inquiries proves labor-intensive, costly, time-consuming, and often vulnerable to uncertainties pertaining to parameter control and measurement during vibratory roller operations. To surmount these challenges, numerical simulation has arisen as a promising alternative for comprehending and evaluating the vibration compaction performance of rubber–sand mixtures under demanding conditions. Leveraging numerical models, researchers can simulate and analyze mixture behavior, yielding valuable insights devoid of the limitations tied to field tests. This approach presents a cost-effective and efficient avenue for delving deeper into the compaction process and fine-tuning vibratory roller performance in road construction.
In 1979, Cundall and Stack [16] introduced the discrete element method (DEM), a potent tool for investigating mechanical behavior across granular materials at both macroscopic and microscopic scales [17,18,19,20]. Since then, DEM has found extensive application across various granular material studies. For instance, Wu et al. [4] employed DEM to scrutinize the vibration compaction effect of roundtrip rollers on gravel, comparing vibratory roller efficiency across different frequencies. Chen et al. [21] simulated the rolling dynamic roller technique using DEM, proposing ground settlement as an indicator to determine optimal roller pass numbers. In the domain of stiff sand and soft rubber particle mixtures, Perez et al. [22] executed drained triaxial tests using DEM, underscoring rubber particle size’s significant sway over critical state line slopes. Asadi et al. [23] probed rubber particles’ deformability under compressive force using DEM, revealing their potential to establish additional contacts and enhance interlocking, particularly in rubber–rubber contacts within fragile force networks. Further, rubber particles were observed to reshape strain localization patterns in the displacement field, impeding shear band formation and constraining particle rearrangement by limiting microscale interparticle rolling and sliding motion [24]. Another study by Sarajpoor et al. [25] delved into sand–rubber mixture dynamic behavior via hollow cylinder tests. Akbarimehr et al. [26,27] studied the elasto-plastic and dynamic shear modulus of clay mixed with waste rubber using a cyclic triaxial apparatus and demonstrated a good cohesion between clay and rubber grains, as well as an appropriate strength and shear strain for the given mixture. This work revealed that sand–crumb rubber mixture dynamic properties were chiefly influenced by rubber content and confining stress values, with relative density and rubber particle size exerting a comparatively lesser impact.
The principal aim of this study is to investigate the effects of dynamic vibration compaction on sand mixtures with varying rubber contents under various roller working conditions, while also assessing the associated energy consumption. To realize this goal, we employ a discrete element method (DEM) model of a vibratory roller applied to a subgrade section in 2D. The research unfolds with three specific aims: Firstly, to explore the optimal frequency, velocity, and number of roller passes required for effective compaction and, secondly, to delve into the multiscale mechanical behavior of sand–rubber mixture particles. This encompasses an analysis and evaluation of contact force chains, particle displacement fields, and velocity fields. Lastly, the study seeks to present crucial insights derived from its findings. This research not only scrutinizes the outcomes of vibration compaction but also offers valuable recommendations for optimizing the selection of vibration roller working parameters with a focus on minimizing energy consumption. Such insights hold significant practical relevance and provide valuable guidance for real-world construction endeavors.

2. DEM Simulation of Vibration Roller

2.1. Contact Law

The simulations in this study were conducted using the PFC 2D 6.0 software developed by Itasca company. Since the roller’s movement primarily occurs in a plane during its roundtrip motion, employing a 2D simulation is appropriate for this scenario. Commencing with a 2D simulation simplifies the spatial interactions between particles, facilitates computer programming, and significantly reduces computation time. Therefore, our simulations are performed in 2D conditions. To account for the influence of deformed shape, the rolling resistance model proposed by Ai et al. [28] was applied. The rolling resistance contact law incorporates a torque that acts on the contacting pieces to counteract the rolling motion of particles. The force–displacement relationship for the rolling resistance linear model calculates the contact force and moment according to Equation (1):
F = F l + F d
where F l is the linear force, and F d is the dashpot force.
The linear force, denoted as F l , comprises both the normal force F n and the shear force F s . The calculation of the normal force F n is determined by Equation (2).
F n = k n g s
where g s is the surface gap.
The shear force F s is calculated by Equation (3).
F s t = F s t 1 k s Δ δ s
where Δ δ s is the relative displacement increment at the contact during a timestep Δ t .
The rolling resistance moment M r is calculated incrementally, as in Equations (4) and (5):
M r t = M r t 1 k r Δ θ b
where Δ θ b is the relative bend–rotation increment.
k r = k s R ¯ 2
where k r is the rolling resistance stiffness, and k s is the shear stiffness.
The normal and tangential stiffness can be determined based on the effective modulus E * and the ratio of normal to shear stiffness κ * at the contact, as described in Equations (6)–(8), respectively.
k n = A E * L
The effective radius R ¯ is calculated in Equation (7).
1 R ¯ = 1 R 1 + 1 R 2
where R 1 and R 2 are the radius of ends of the contact, respectively.
k s = k n κ *
where A = 2 × m i n ( R 1 , R 2 ) is the cross-section area between the contact particles, and L is the distance between the center of two contacting particles.
The shear force is limited by Equation (9):
F s l i m i t = F s * , | | F s | | F s μ F s μ ( F s * / | | F s * | | ) , o t h e r w i s e .
The rolling resistance moment M r is updated, but it cannot exceed the limiting torque M l i m i t calculated in Equation (10)
M l i m i t = μ r R ¯ F n
where the rolling resistance coefficient μ r corresponds to the tangent of the maximum angle of a slope on which the rolling resistance torque counterbalances the torque produced by gravity acting on the particle.

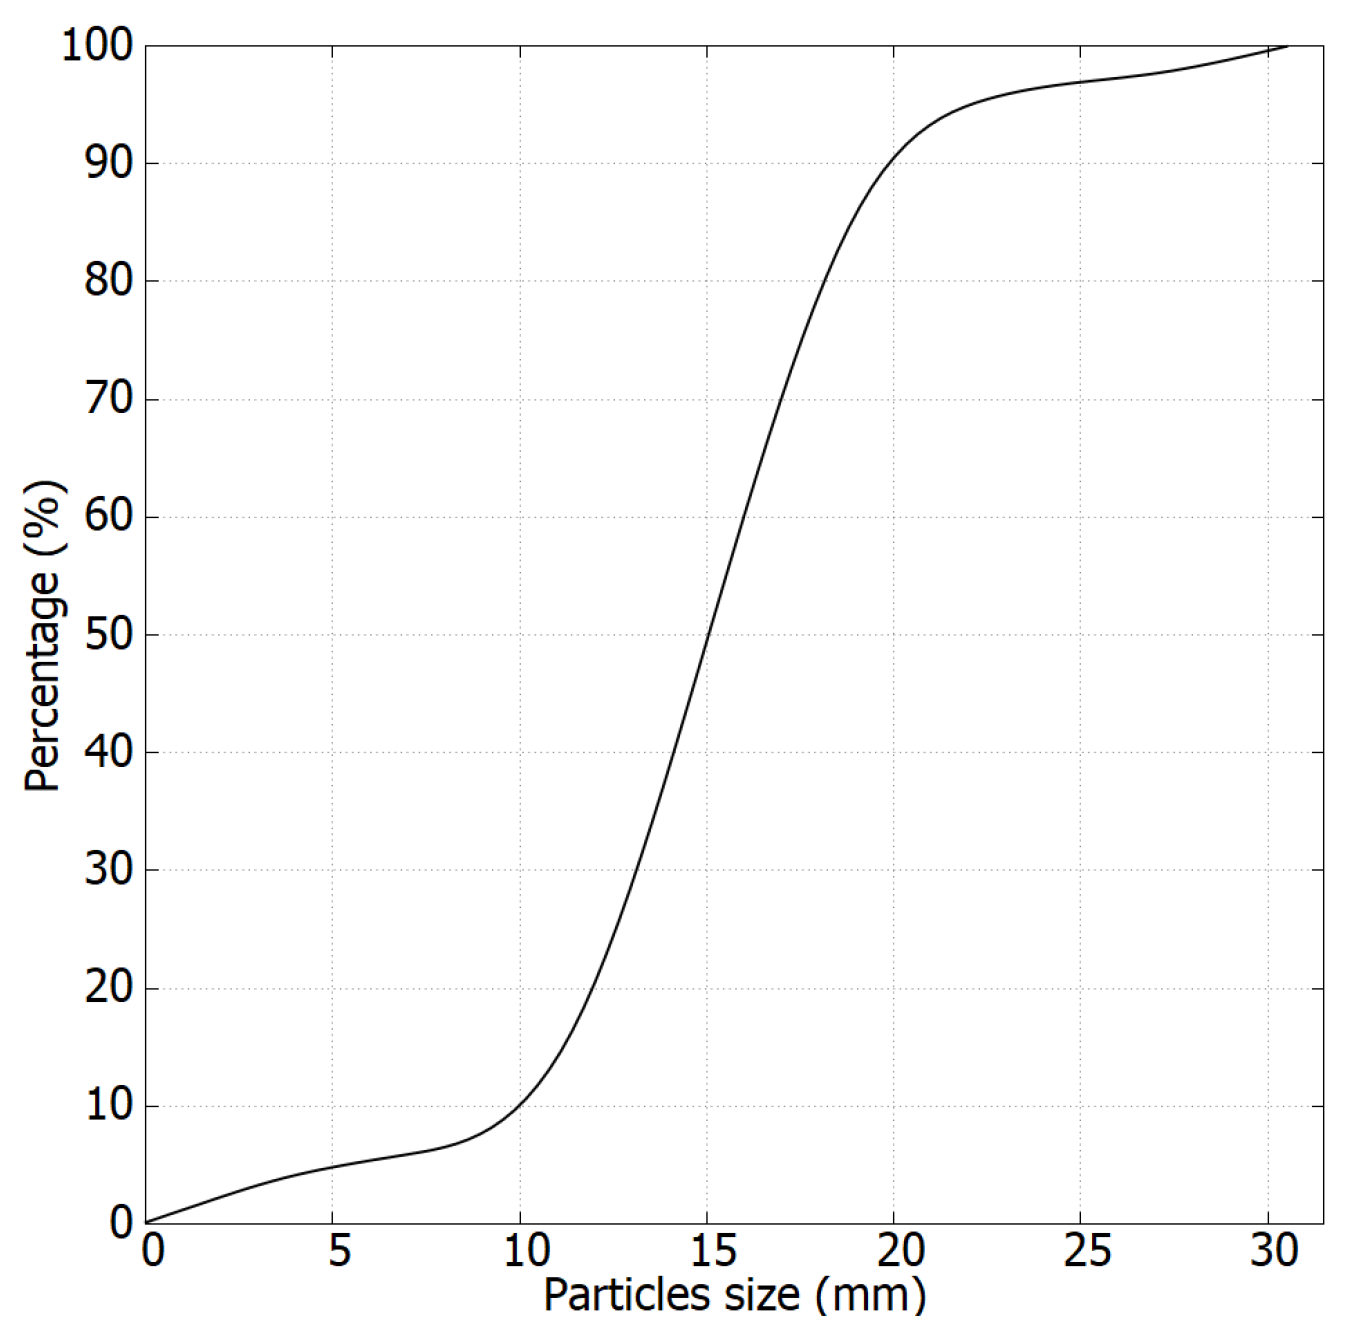
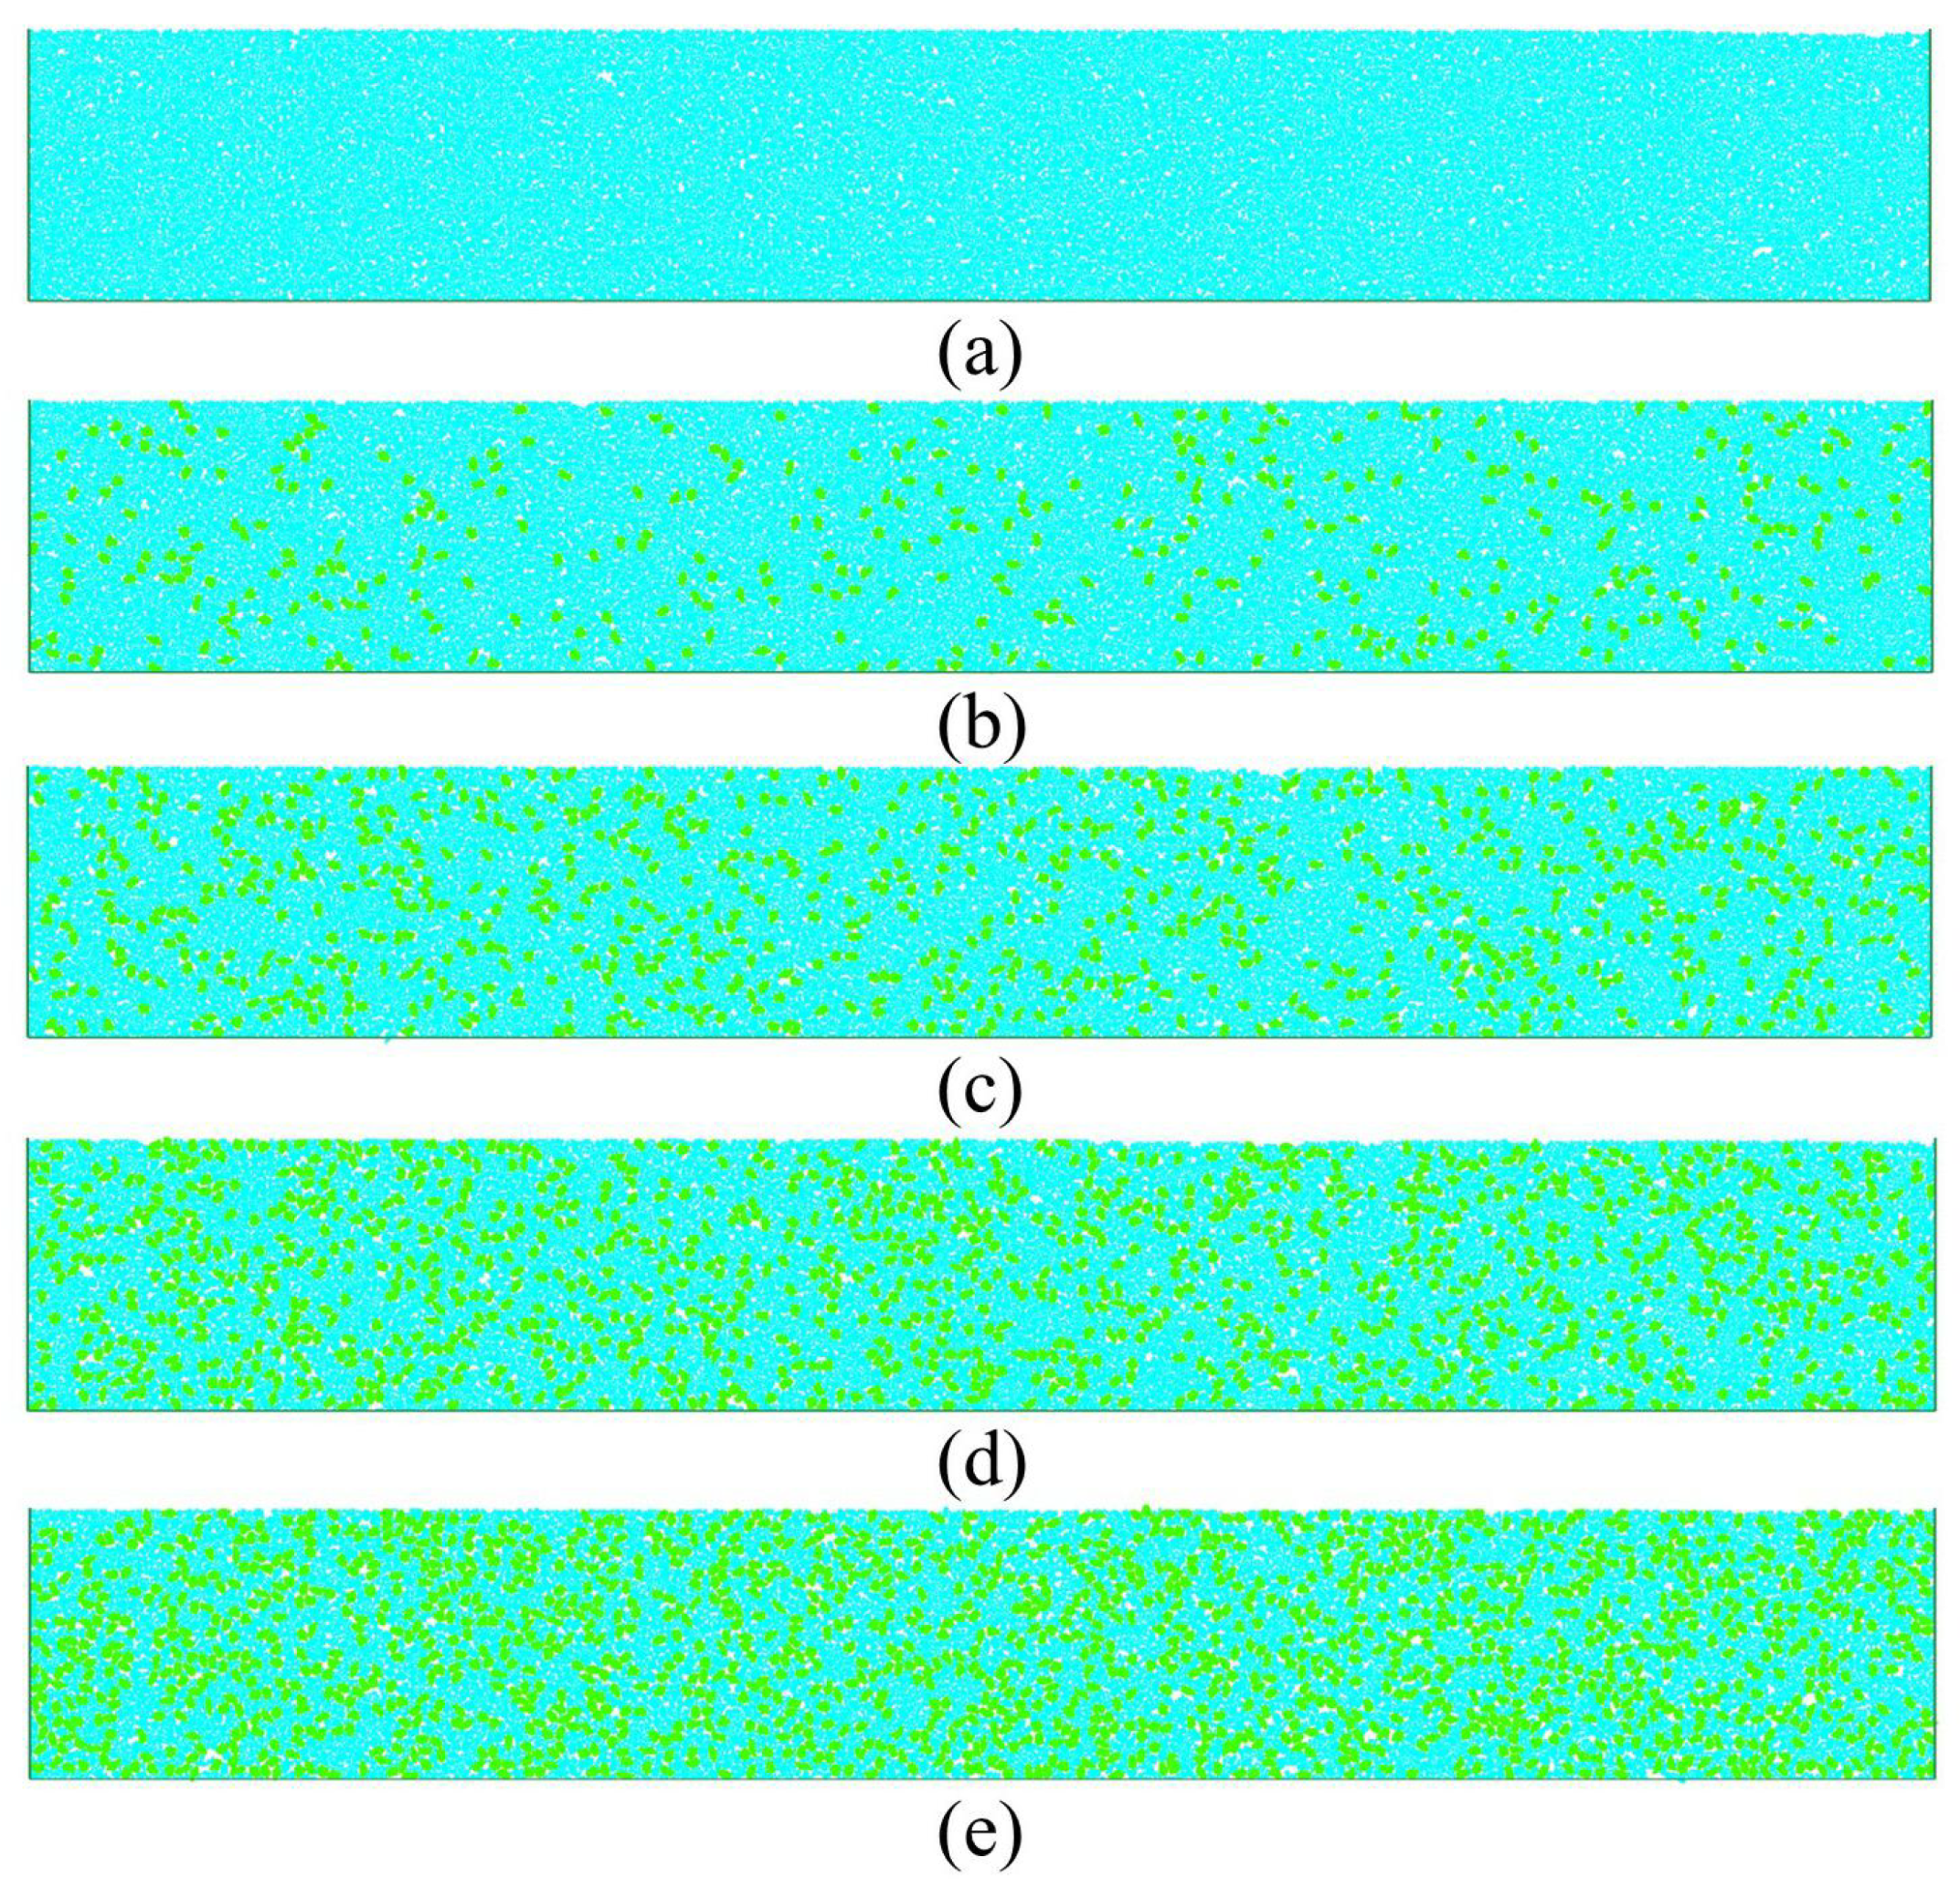
2.2. Generation of Subgrade Sample of Gravels and Rubber Mixtures

The subgrade model has dimensions of 7.0 m × 1.0 m, with the X-axis ranging from −1.0 m to 6.0 m. The vibratory roller was restricted to a movement range of 0.0 m to 5.0 m, leaving two sections from −1.0 m to 0 m and 5.0 m to 6.0 m to avoid the influence of stiff boundary effects. The simulation utilized a well-graded sand with a particle size distribution presented in Figure 1. The dry density of the sand was 2230 kg/m 3 , while the dry density of the rubber was 1680 kg/m 3 . To enhance the realism of the simulation, sand and rubber particles were represented using particle templates of various shapes randomly selected from Figure 2. These particle templates were obtained from three-dimensional scans of real sand particles projected onto a two-dimensional plane to create a contour model, and then transformed into unbreakable clump templates using a particle filling method. By employing these realistic particle shapes, the simulation offers improved accuracy compared with traditional spherical particles. Baghbani et al. [29] investigated the effects of particle shape on the secant shear modulus of dry sand through dynamic simple shear testing and indicated that the sand had a dilative behavior, and successive cyclic loading negatively affected the shape of the sand particles. This paper does not delve extensively into the effects of rubber particle and sand particle shapes on the simulation outcomes, because the rubber particles employed for road filling predominantly comprise discarded tire byproducts and, as such, do not possess tailored shapes. Instead, the primary differentiation between rubber and sand particles centers on distinct physical parameters, including density, size, and other pertinent properties. Figure 3 illustrates five samples of rubber–sand mixtures with different rubber volume fractions: 0%, 10%, 20%, 30%, and 40%. The number of sand particles and rubber particles in each subgrade sample is provided in Table 1. It can be observed from the figure that the distribution of rubber particles is relatively uniform within the sample. The parameters used in the simulations are validated by comparisons with the full-scale experimental tests of vibratory roller performed in [14] and detailed in Table 2. These parameter values comprehensively consider the literature parameter values and experimental results [3,24].

2.3. DEM Simulation of Vibration Roller

In the 2D simulation, the primary vibration component of the vibratory roller was represented by a simplified large disk. The working parameters of the vibration roller, including its distinct motions, are summarized in Table 3. The roller executed three main movements during the simulation: horizontal movement between the starting point (0.0, 0.0) and the endpoint (5.0, 0.0), rolling, and vertical vibration at a specific frequency f. The applied vibration force on the roller was determined as the sum of the static force of the vibrating wheel and the dynamic force of the vibration component, calculated based on Equation (11):
F = G + F e
where F is the vibration force, G is the weight of the roller, and f is the vibration frequency. F e is the maximum value of the vibration force, as calculated in Equation (12):
F e = M × ( 2 π f ) 2
where M is the eccentric moment.
Furthermore, in the simulations, the roller was allowed to roll on the subgrade surface with a fixed nonangular velocity, enabling the observation of the roller’s rolling and squeezing process on the gravel.
After conducting a pretest, the radius of the measuring circle was set to 0.22 m to ensure that the upper measuring circles were consistently filled with sand particles. This adjustment was necessary as the rolling effect of the vibrating roller could displace sand particles from larger dimensions, potentially causing them to be pushed out of the measuring circle. By using three rows of measuring circles, it became possible to monitor the evolution of porosity in the upper, middle, and bottom layers of soils at various depths. The porosity n within the corresponding measuring circle was calculated using Equation (13):
n = V v o i d V c i r c l e
where V v o i d stands for the surface of gravels in the target measuring circle, and V c i r c l e represents the surface of the measuring circle.
Figure 4 illustrates the deformation of the road surface from particle displacement field contour resulting from five roundtrips of the vibratory roller. It can be seen that the impact depth of the vibrating roller is between 0.3 m and 0.4 m. Initially, the road surface was flat. After one roundtrip, gradual deformation became evident. Two roundtrips later, the middle section of the road experienced compaction and settling. By the third roundtrip, slight protrusions appeared on both sides of the road due to the roller being confined within the boundary, resulting in difficulties in compacting the protruding zone effectively. After four roundtrips, the middle section of the subgrade exhibited greater compaction compared with its initial state. The fifth roundtrip of vibration compaction did not yield a significantly discernible effect. The settlement curve of the ground deformation shows that the settlement is about 10 cm after five compaction roundtrips.

3. Results and Discussions

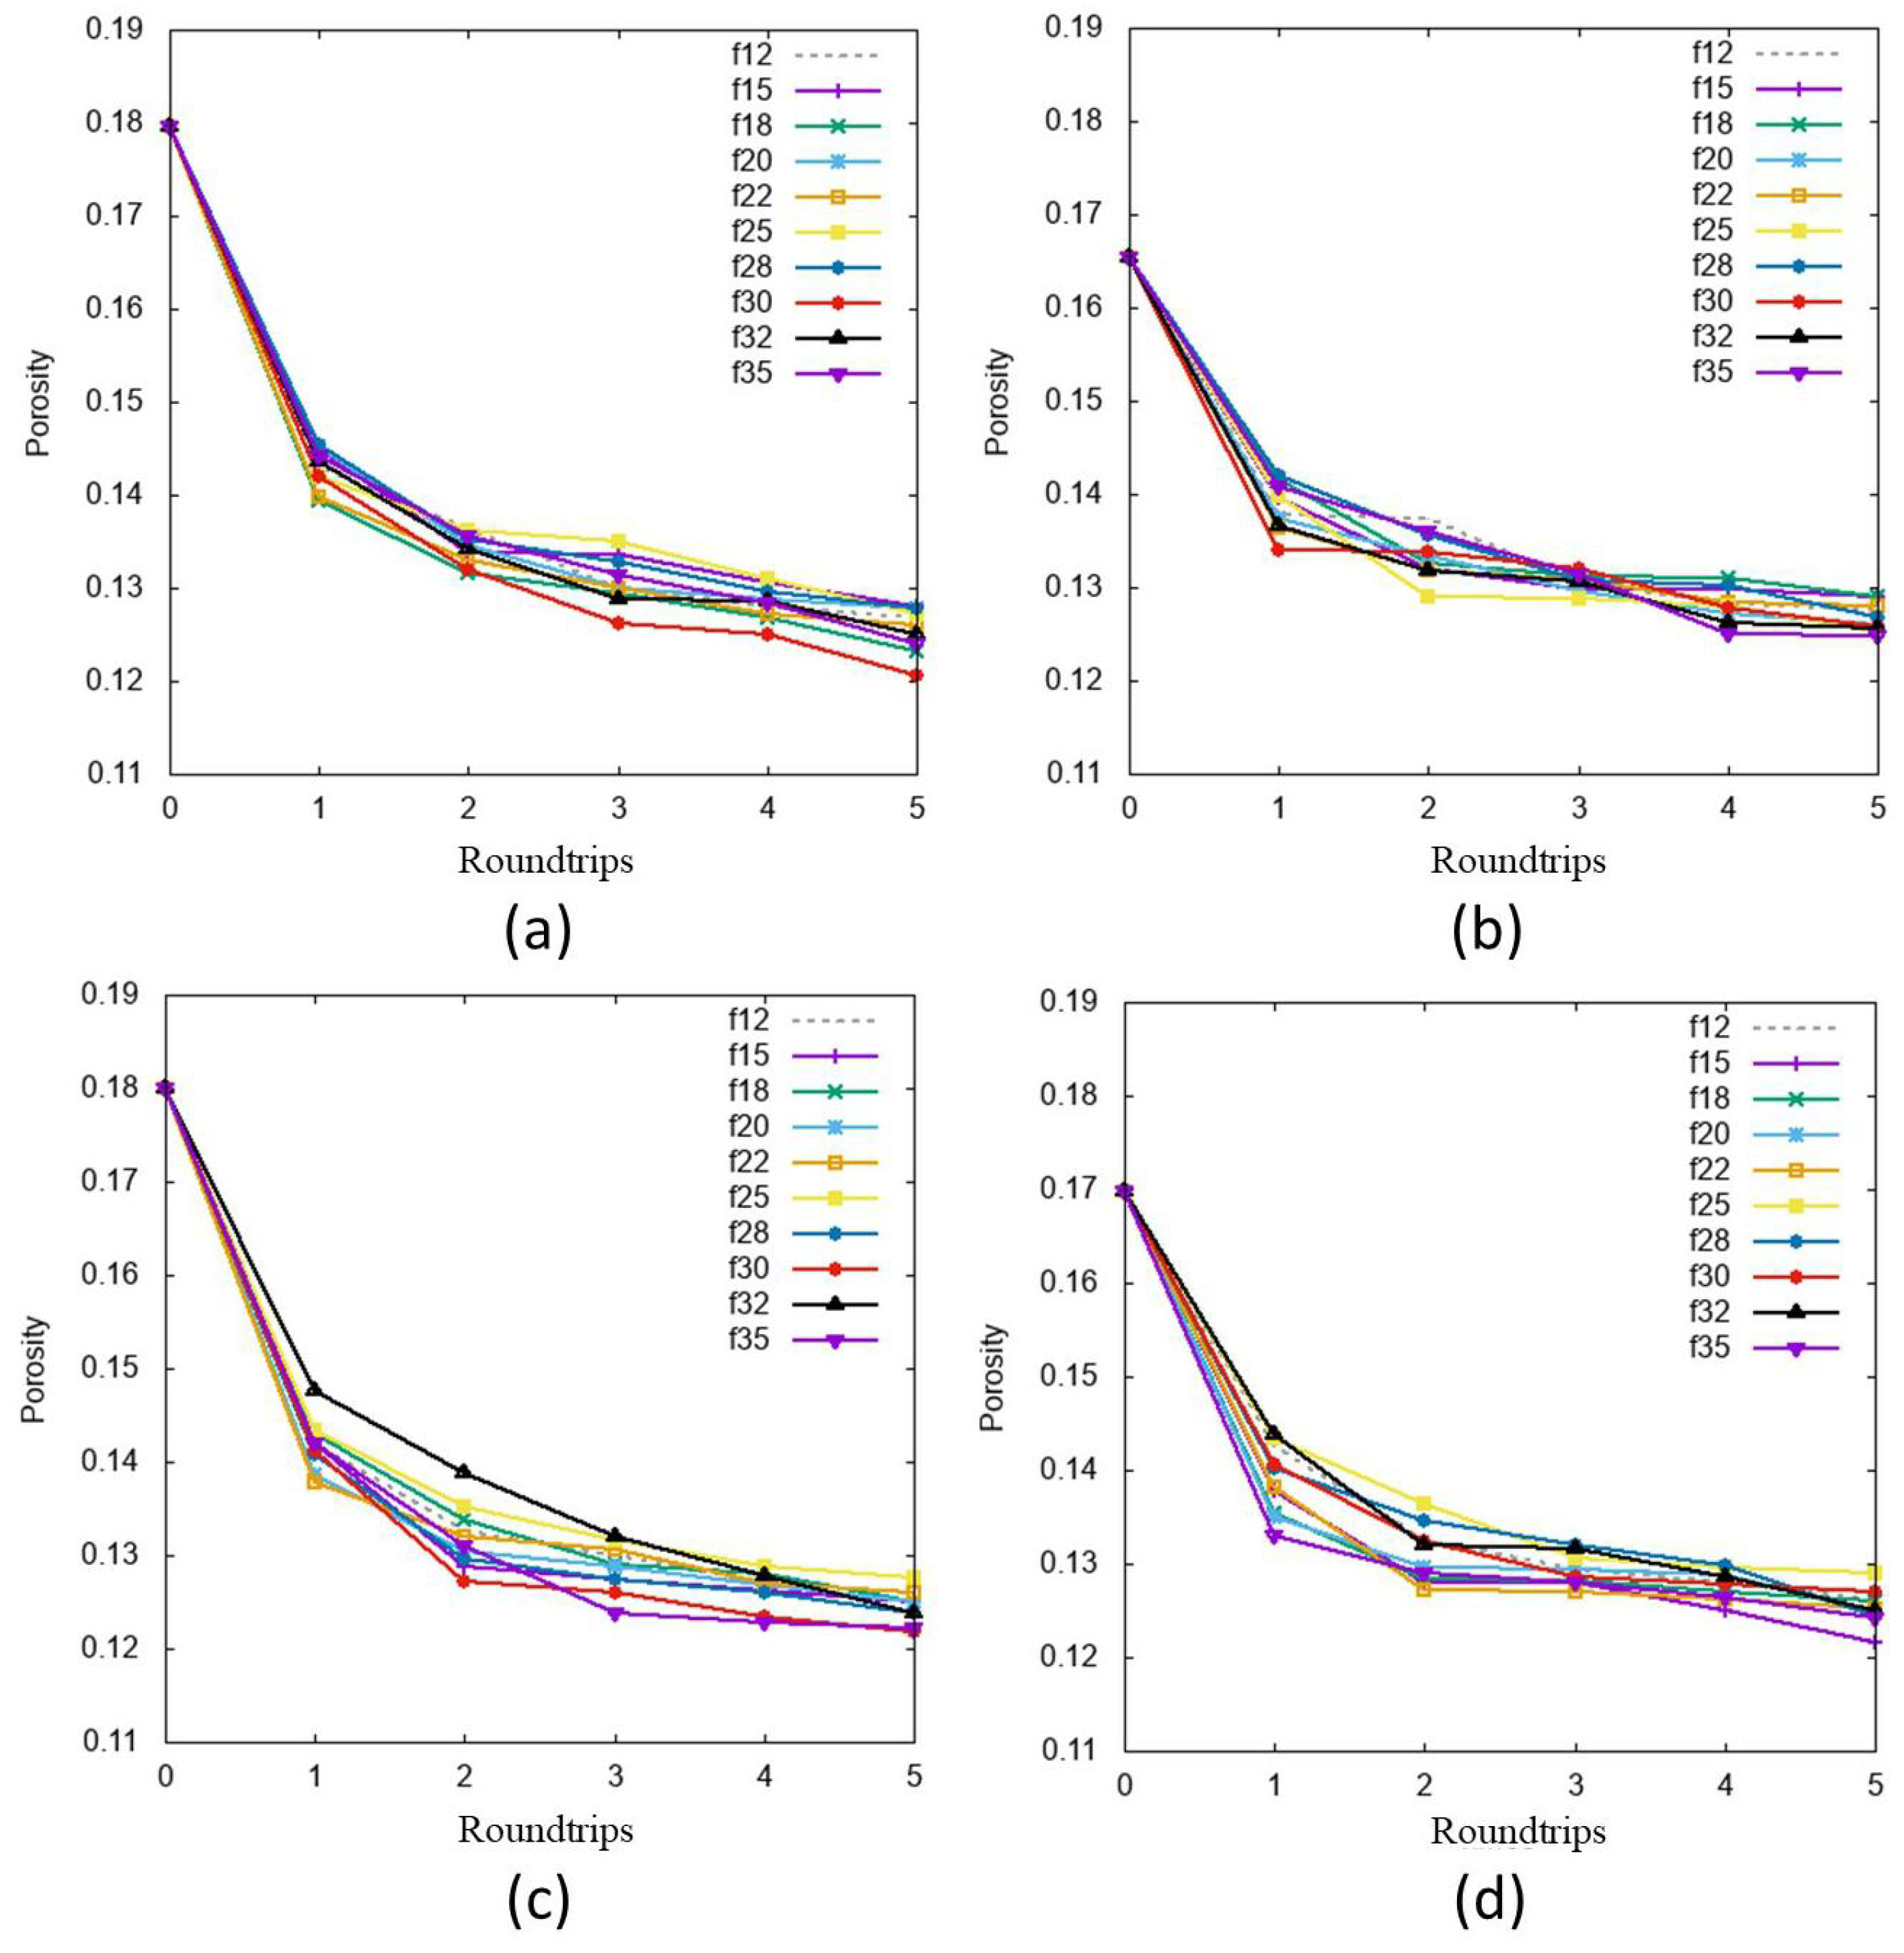
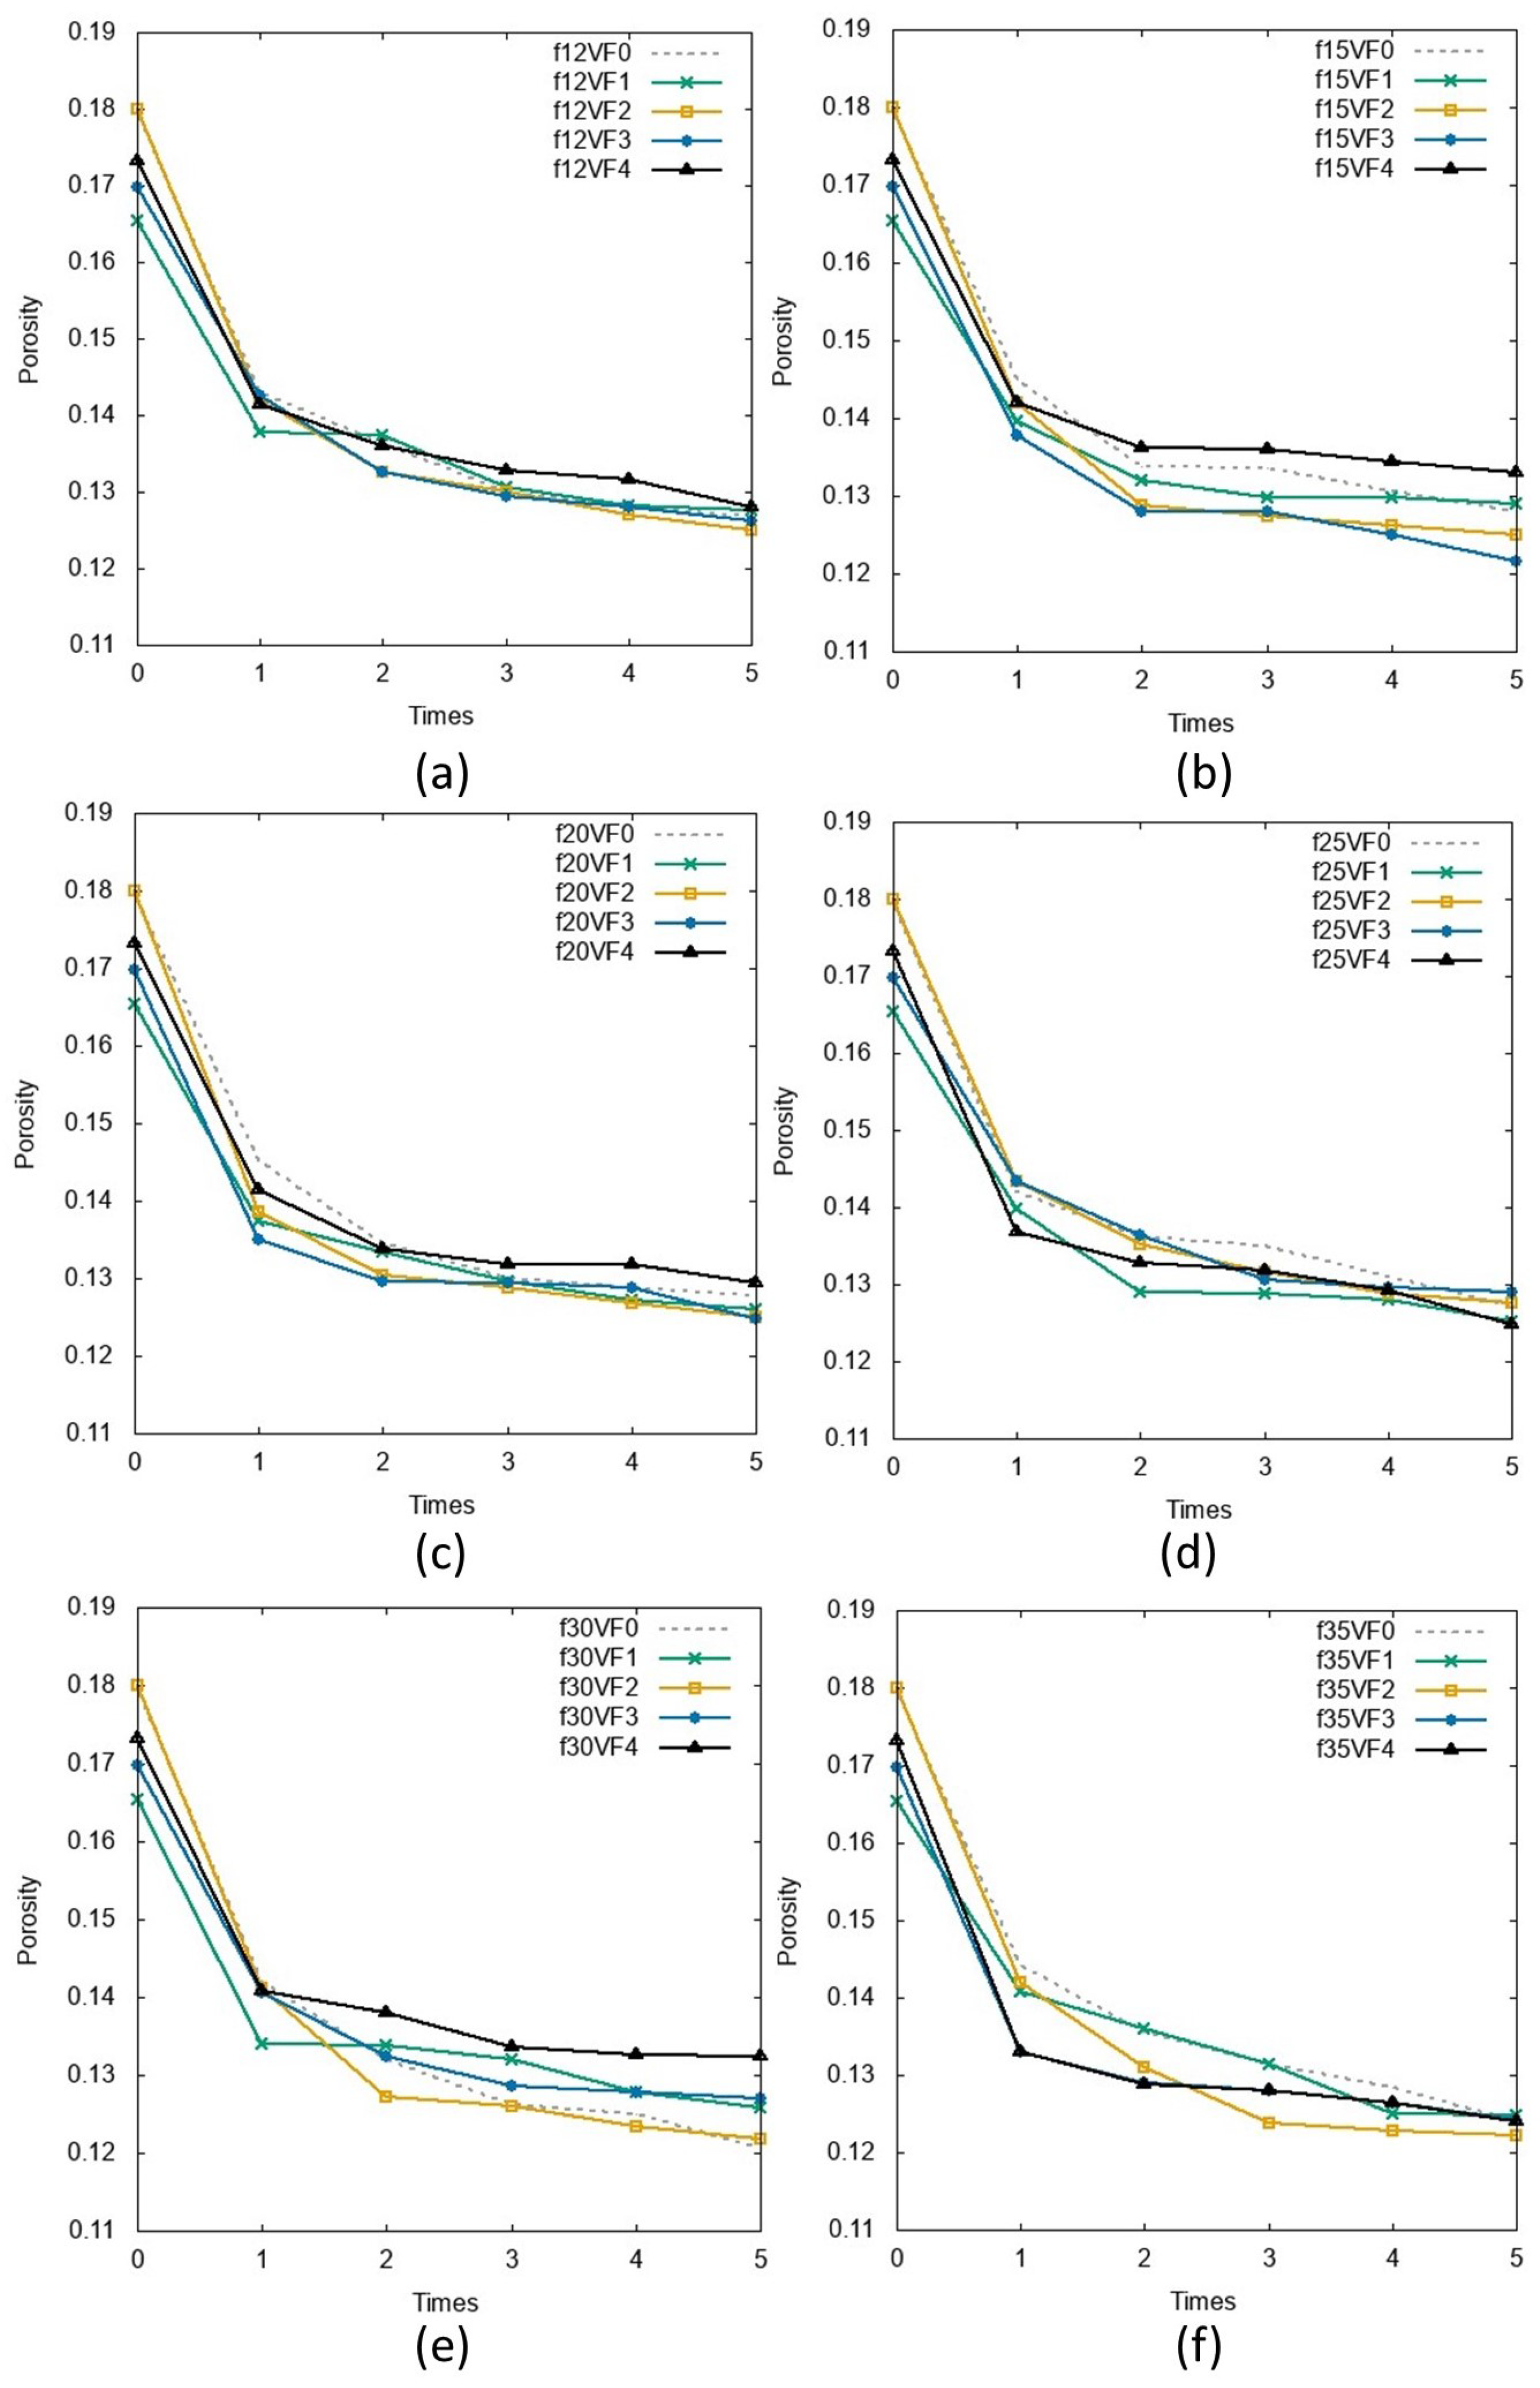
3.1. Influence of Vibration Frequency

Figure 5 demonstrates the impact of vibration compaction frequencies for different volume fraction rubber–sand mixtures. It is evident that the vibration compaction times play a significant role in the compaction effects of the mixture samples. Overall, the first and second rounds of vibration compaction noticeably reduce the porosity of the subgrade samples, with the compaction effect gradually slowing down from the third compaction onward. As the number of compaction times increases, the compaction efficiency diminishes, although the porosity continues to decrease. Furthermore, the compaction effect of vibration frequency on subgrade models with varying rubber contents differs. In the absence of rubber particles, the optimal vibration frequency is determined to be 30 Hz. However, as the rubber content increases, the optimal vibration frequency gradually increases to 35 Hz. This is attributed to the rubber’s energy absorption properties, requiring higher-power vibration compaction for achieving satisfactory compaction results. By attaining improved compaction effects with lower frequencies, which correspond to higher energy consumption, costs can be reduced. Therefore, during the construction process, the optimal frequency can be judiciously selected based on the rubber content.
Figure 6 illustrates the influence of volume fraction of rubber on the vibration compaction effects of mixtures. As a result of different rubber contents, the initial porosity of the model varies. In general, higher vibration frequencies result in better vibration compaction effects. For mixtures subjected to the same frequency, a composition with a 20% rubber content is more likely to attain the lowest porosity, indicating superior compaction effectiveness. This outcome can be attributed to the poorer vibration compaction effect of sand, where a higher content of rubber particles can lead to porosity rebound, thereby reducing the overall compaction effect. Consequently, a rubber content of 20% represents the optimal mix ratio for achieving the most favorable vibration compaction effect. In addition, in the case of a sample with a volume fraction of 20%, after five vibrations, frequency f25 exhibits the poorest vibration effect, leading to a final porosity of 0.128. Conversely, frequency f35 demonstrates the most favorable vibration effect, resulting in a final porosity of 0.122, with a difference of only 0.06 compared with the worst case. Moreover, even low-frequency vibrations (f < 20 Hz) can achieve porosities around 0.125. It is important to note that the vibration frequency of the rollers directly impacts fuel consumption, thereby influencing construction costs. Therefore, in order to achieve optimal construction results while minimizing costs, it is crucial to identify the optimal vibration frequency.

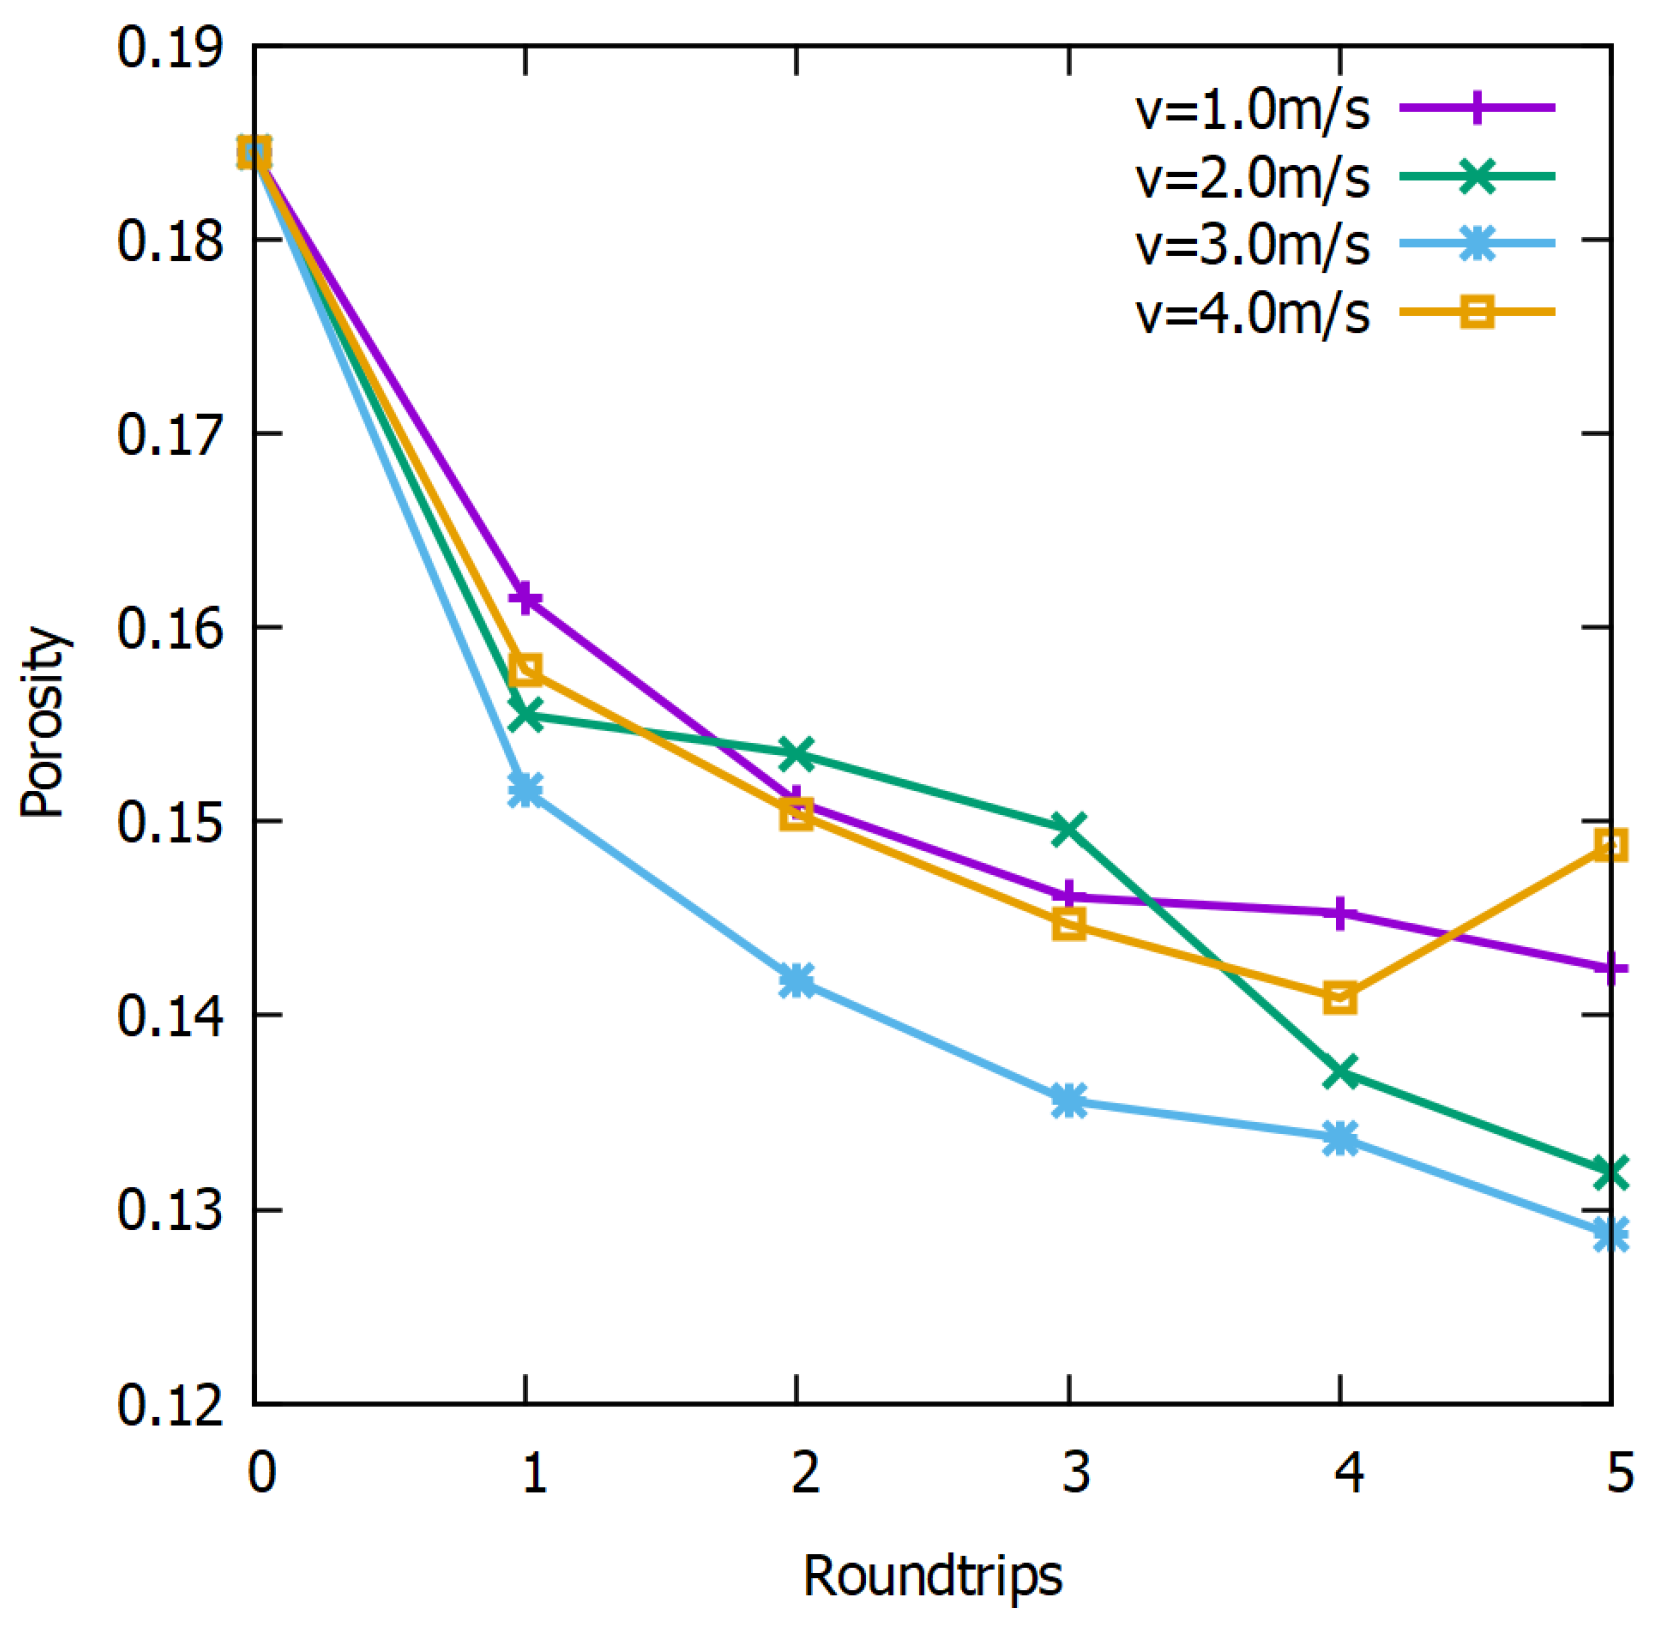
3.2. Influence of Rolling Velocity

Figure 7 illustrates the impact of rolling velocity on the rubber–sand mixture subgrade with a volume fraction of 20% rubber particles. As the rolling velocity increases, the vibration compaction efficiency initially improves and then decreases. This behavior arises from the fact that excessively high rolling velocities are not conducive to achieving optimal vibration compaction effects, while a slower speed not only fails to represent optimal work efficiency but also significantly prolongs construction time, hampering progress. Therefore, finding an appropriate rolling velocity can not only enhance work efficiency but also expedite the construction process.
Figure 8 presents the influence of roller mass on the rubber–sand mixture subgrade with a volume fraction of 20% rubber particles. As the roller mass increases, the vibration compaction efficiency improves. The mass of the roller has a notable impact on the compaction effect. A larger roller mass results in a greater excitation force, leading to a better compaction effect. However, it is important to avoid blindly pursuing excessive roller mass. Excessive mass can cause the porosity of the mixture to rebound, thereby reducing the compaction effect. It is therefore advisable to conduct tests to determine the optimal roller mass for achieving the desired compaction results.

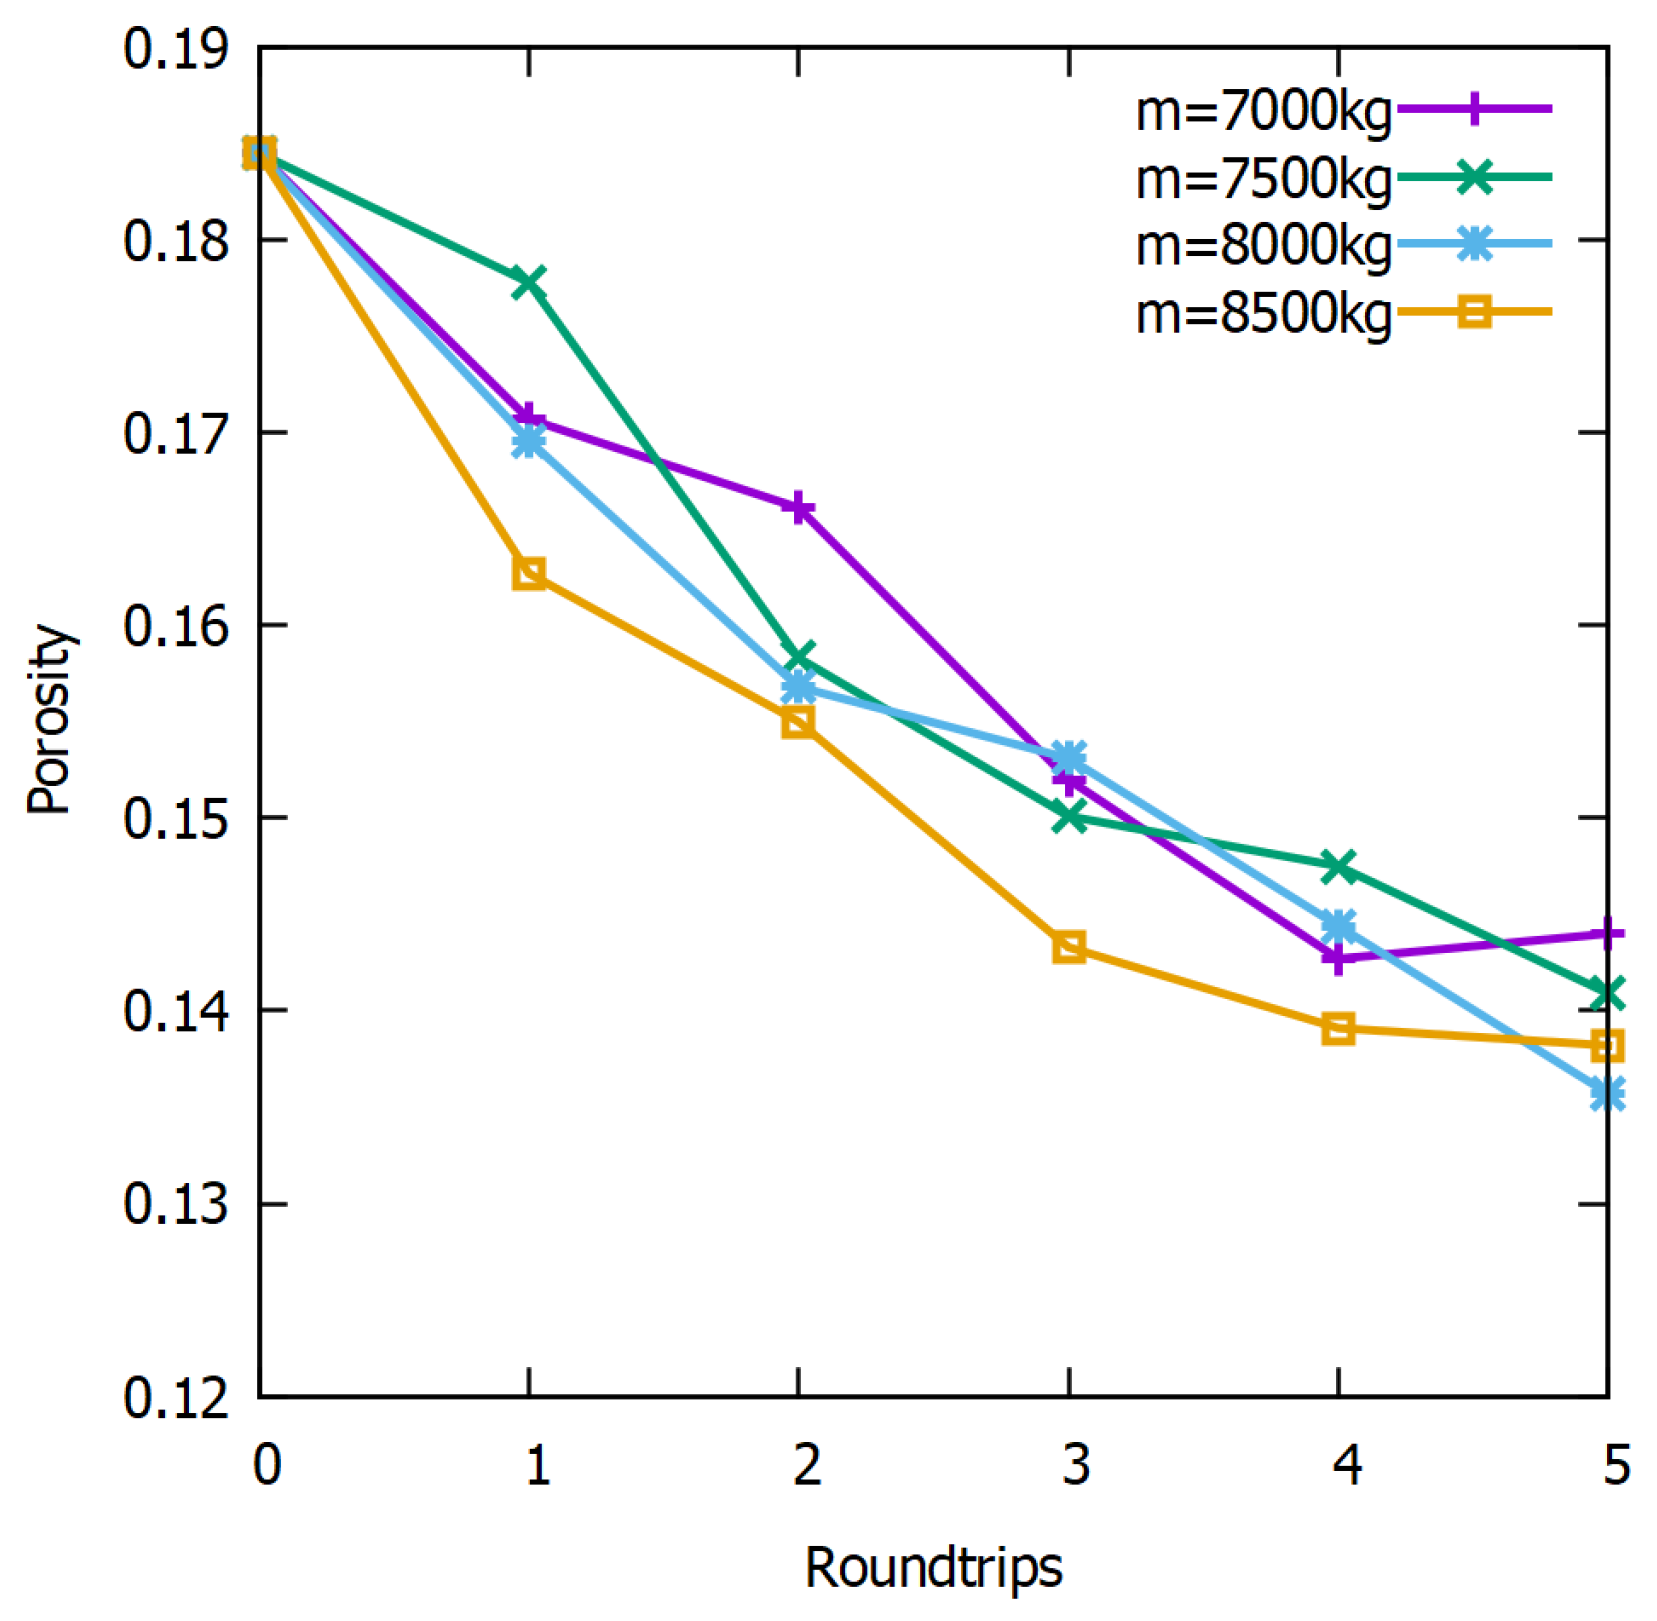
3.3. Influence of Roller Mass

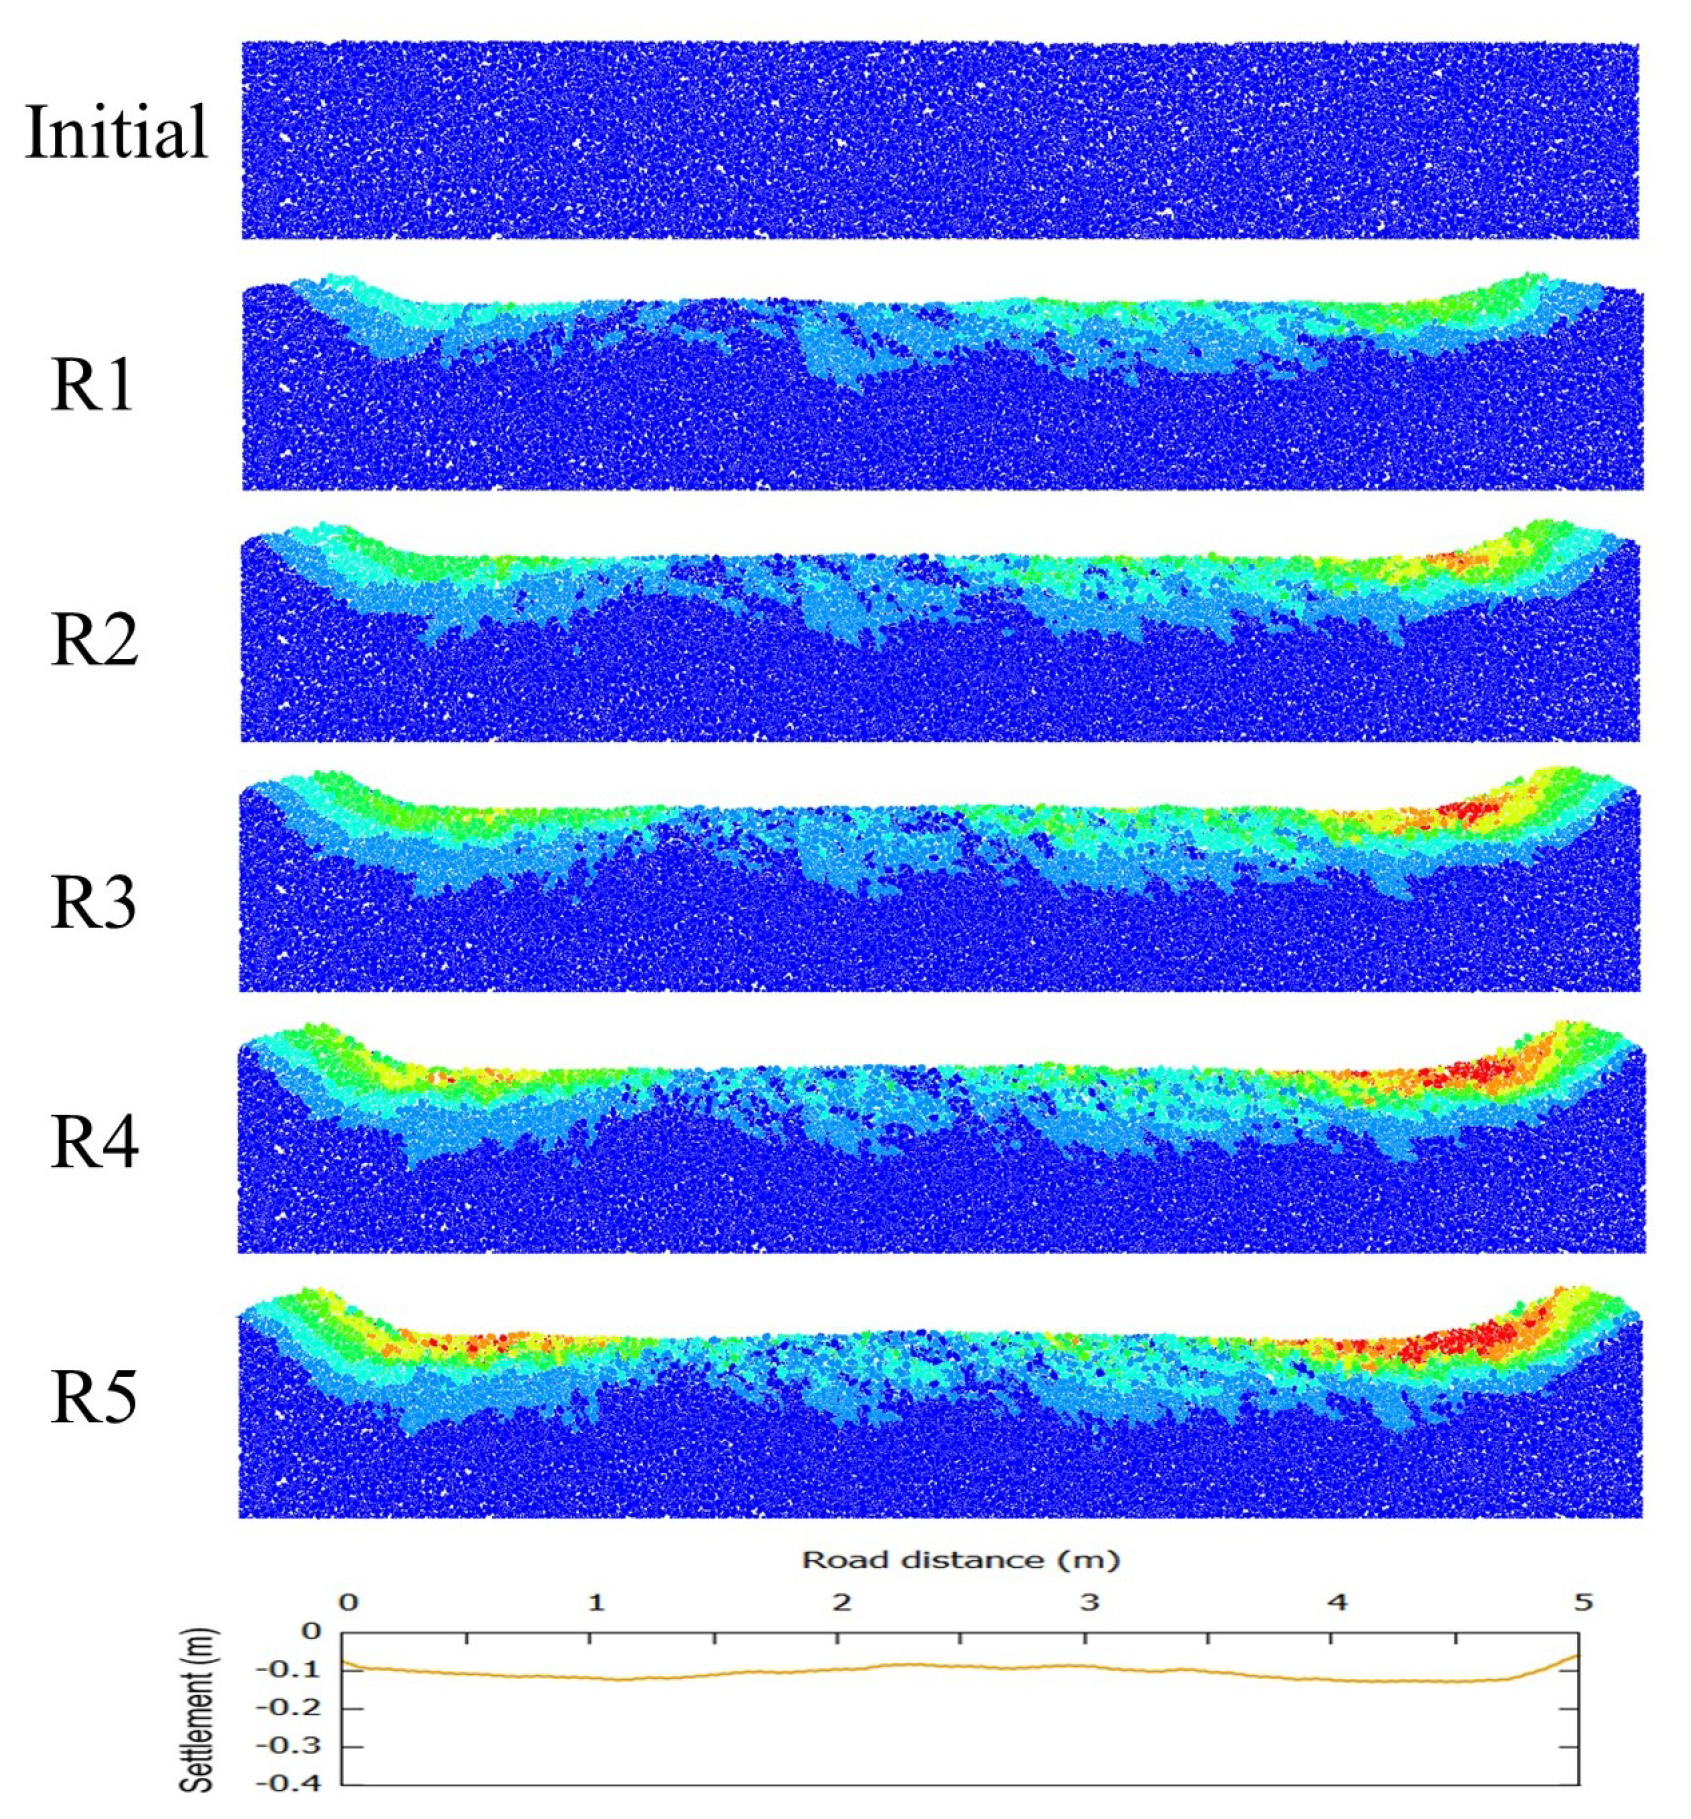
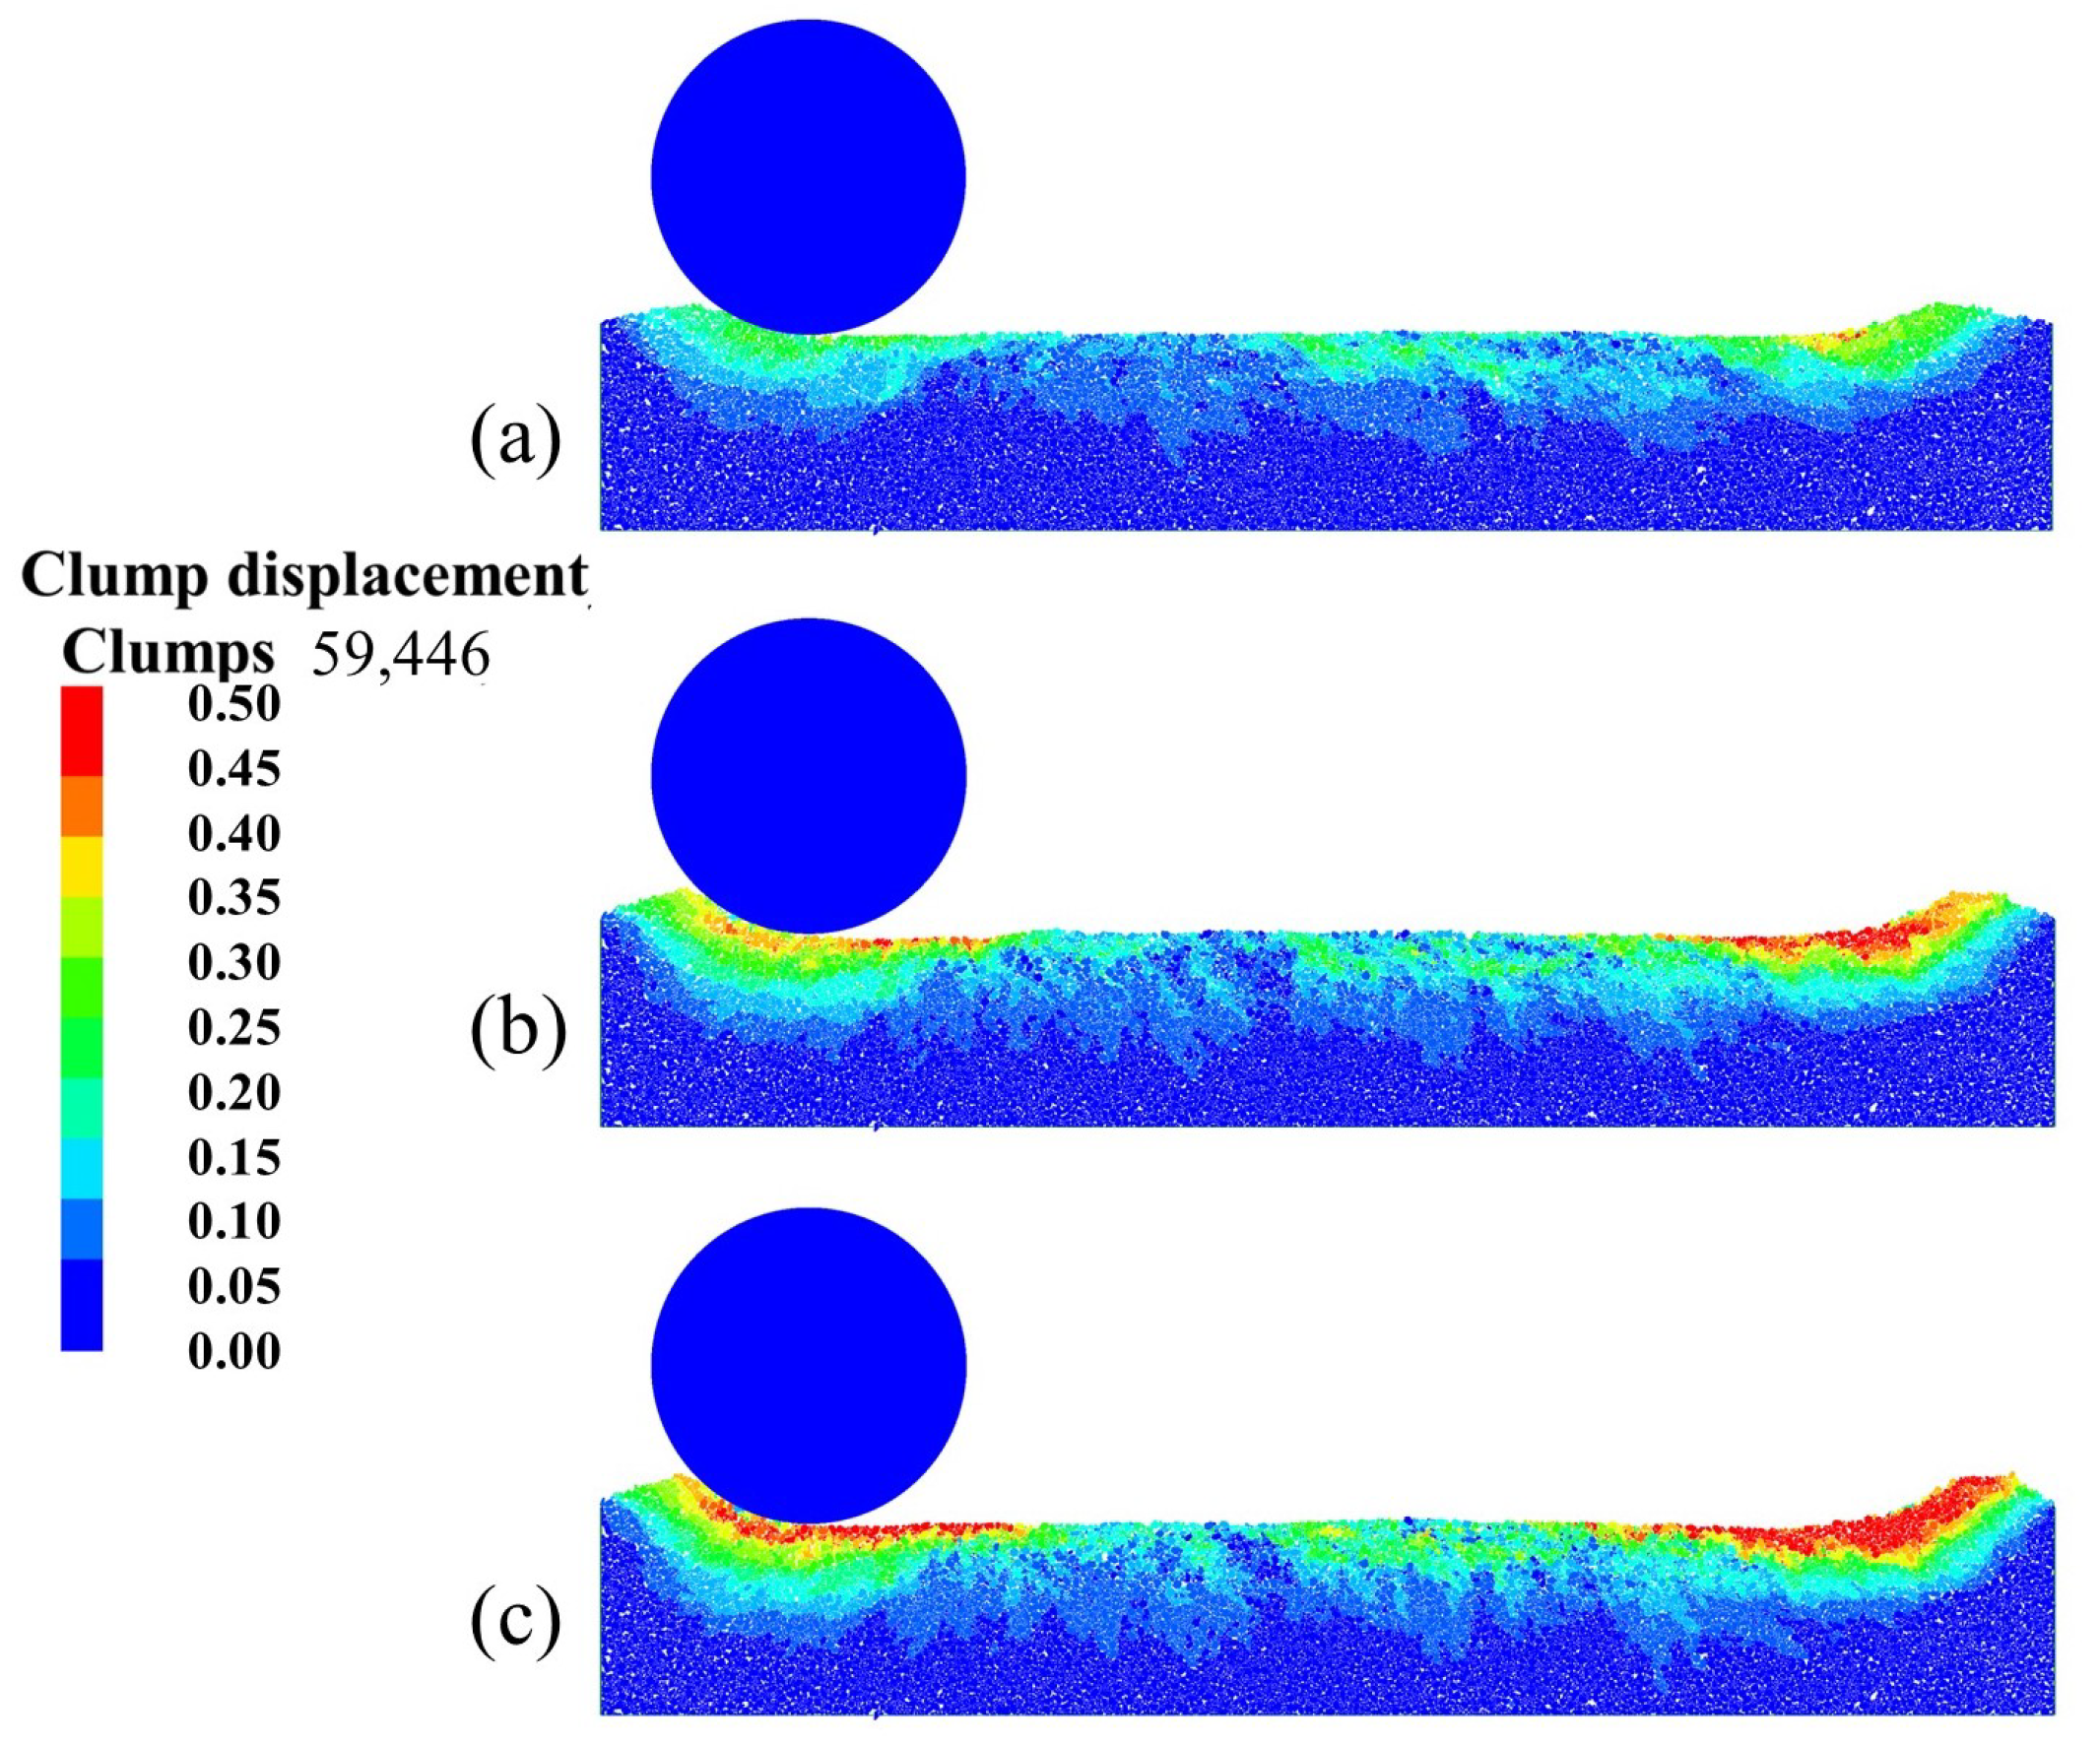
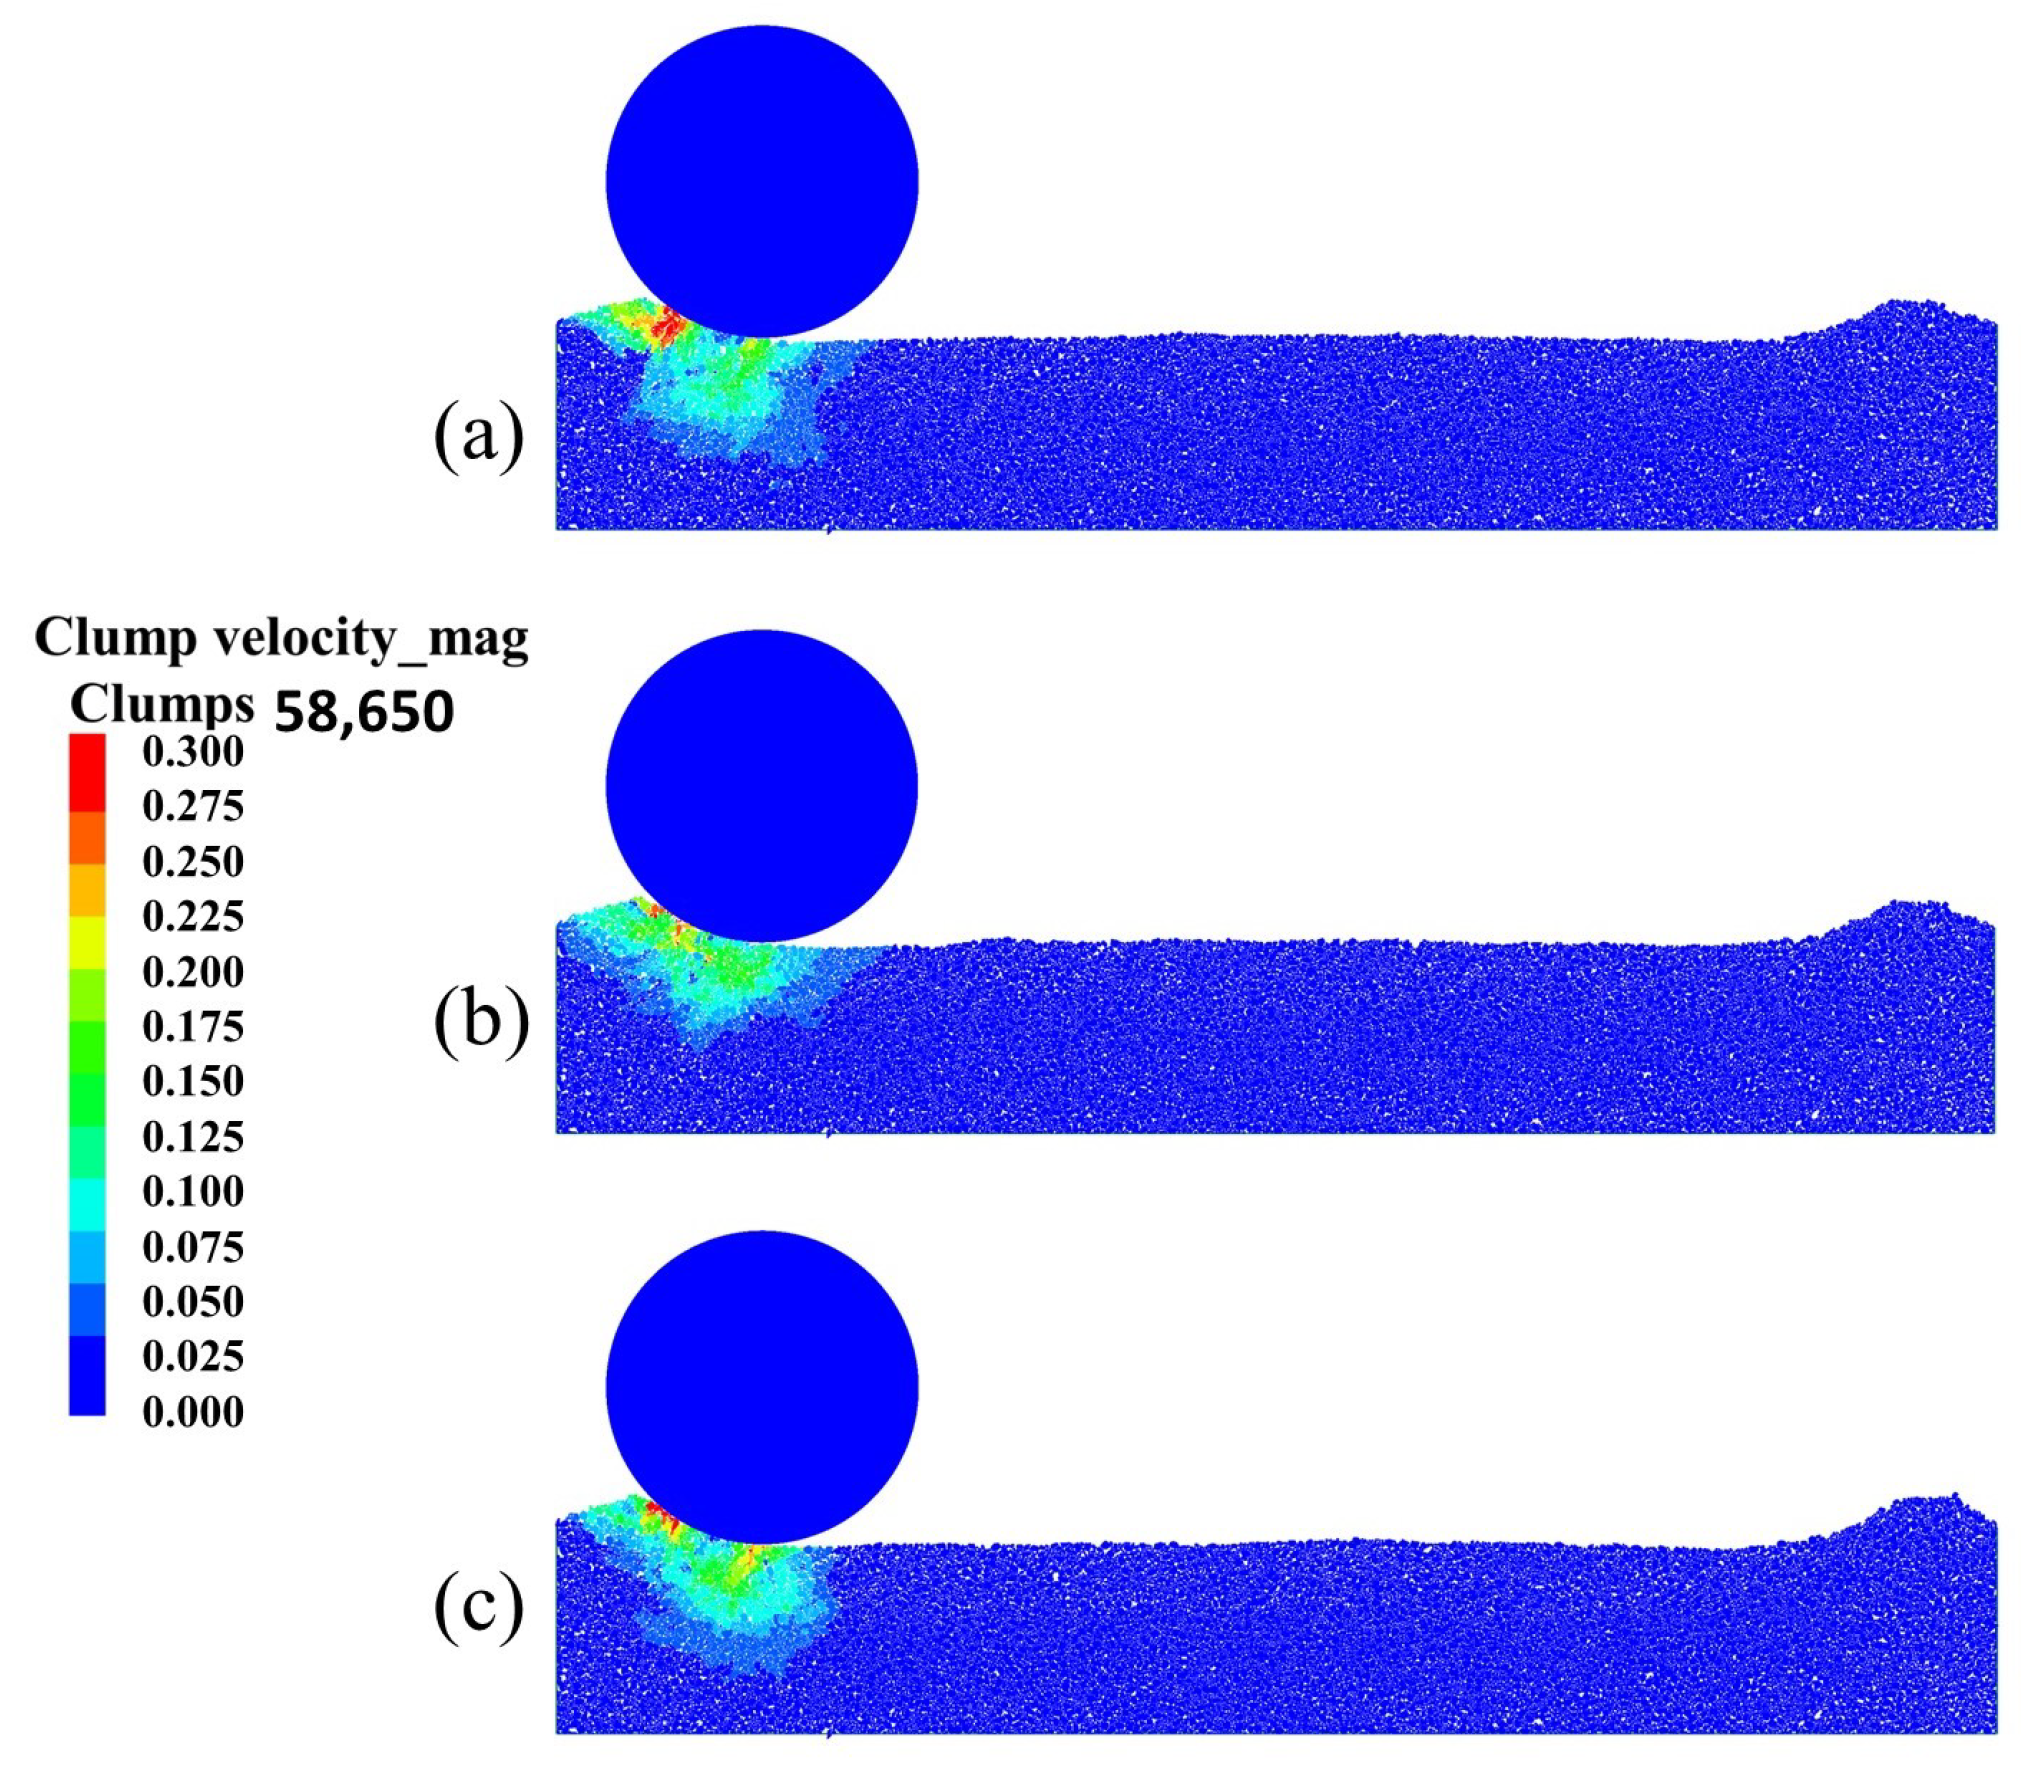
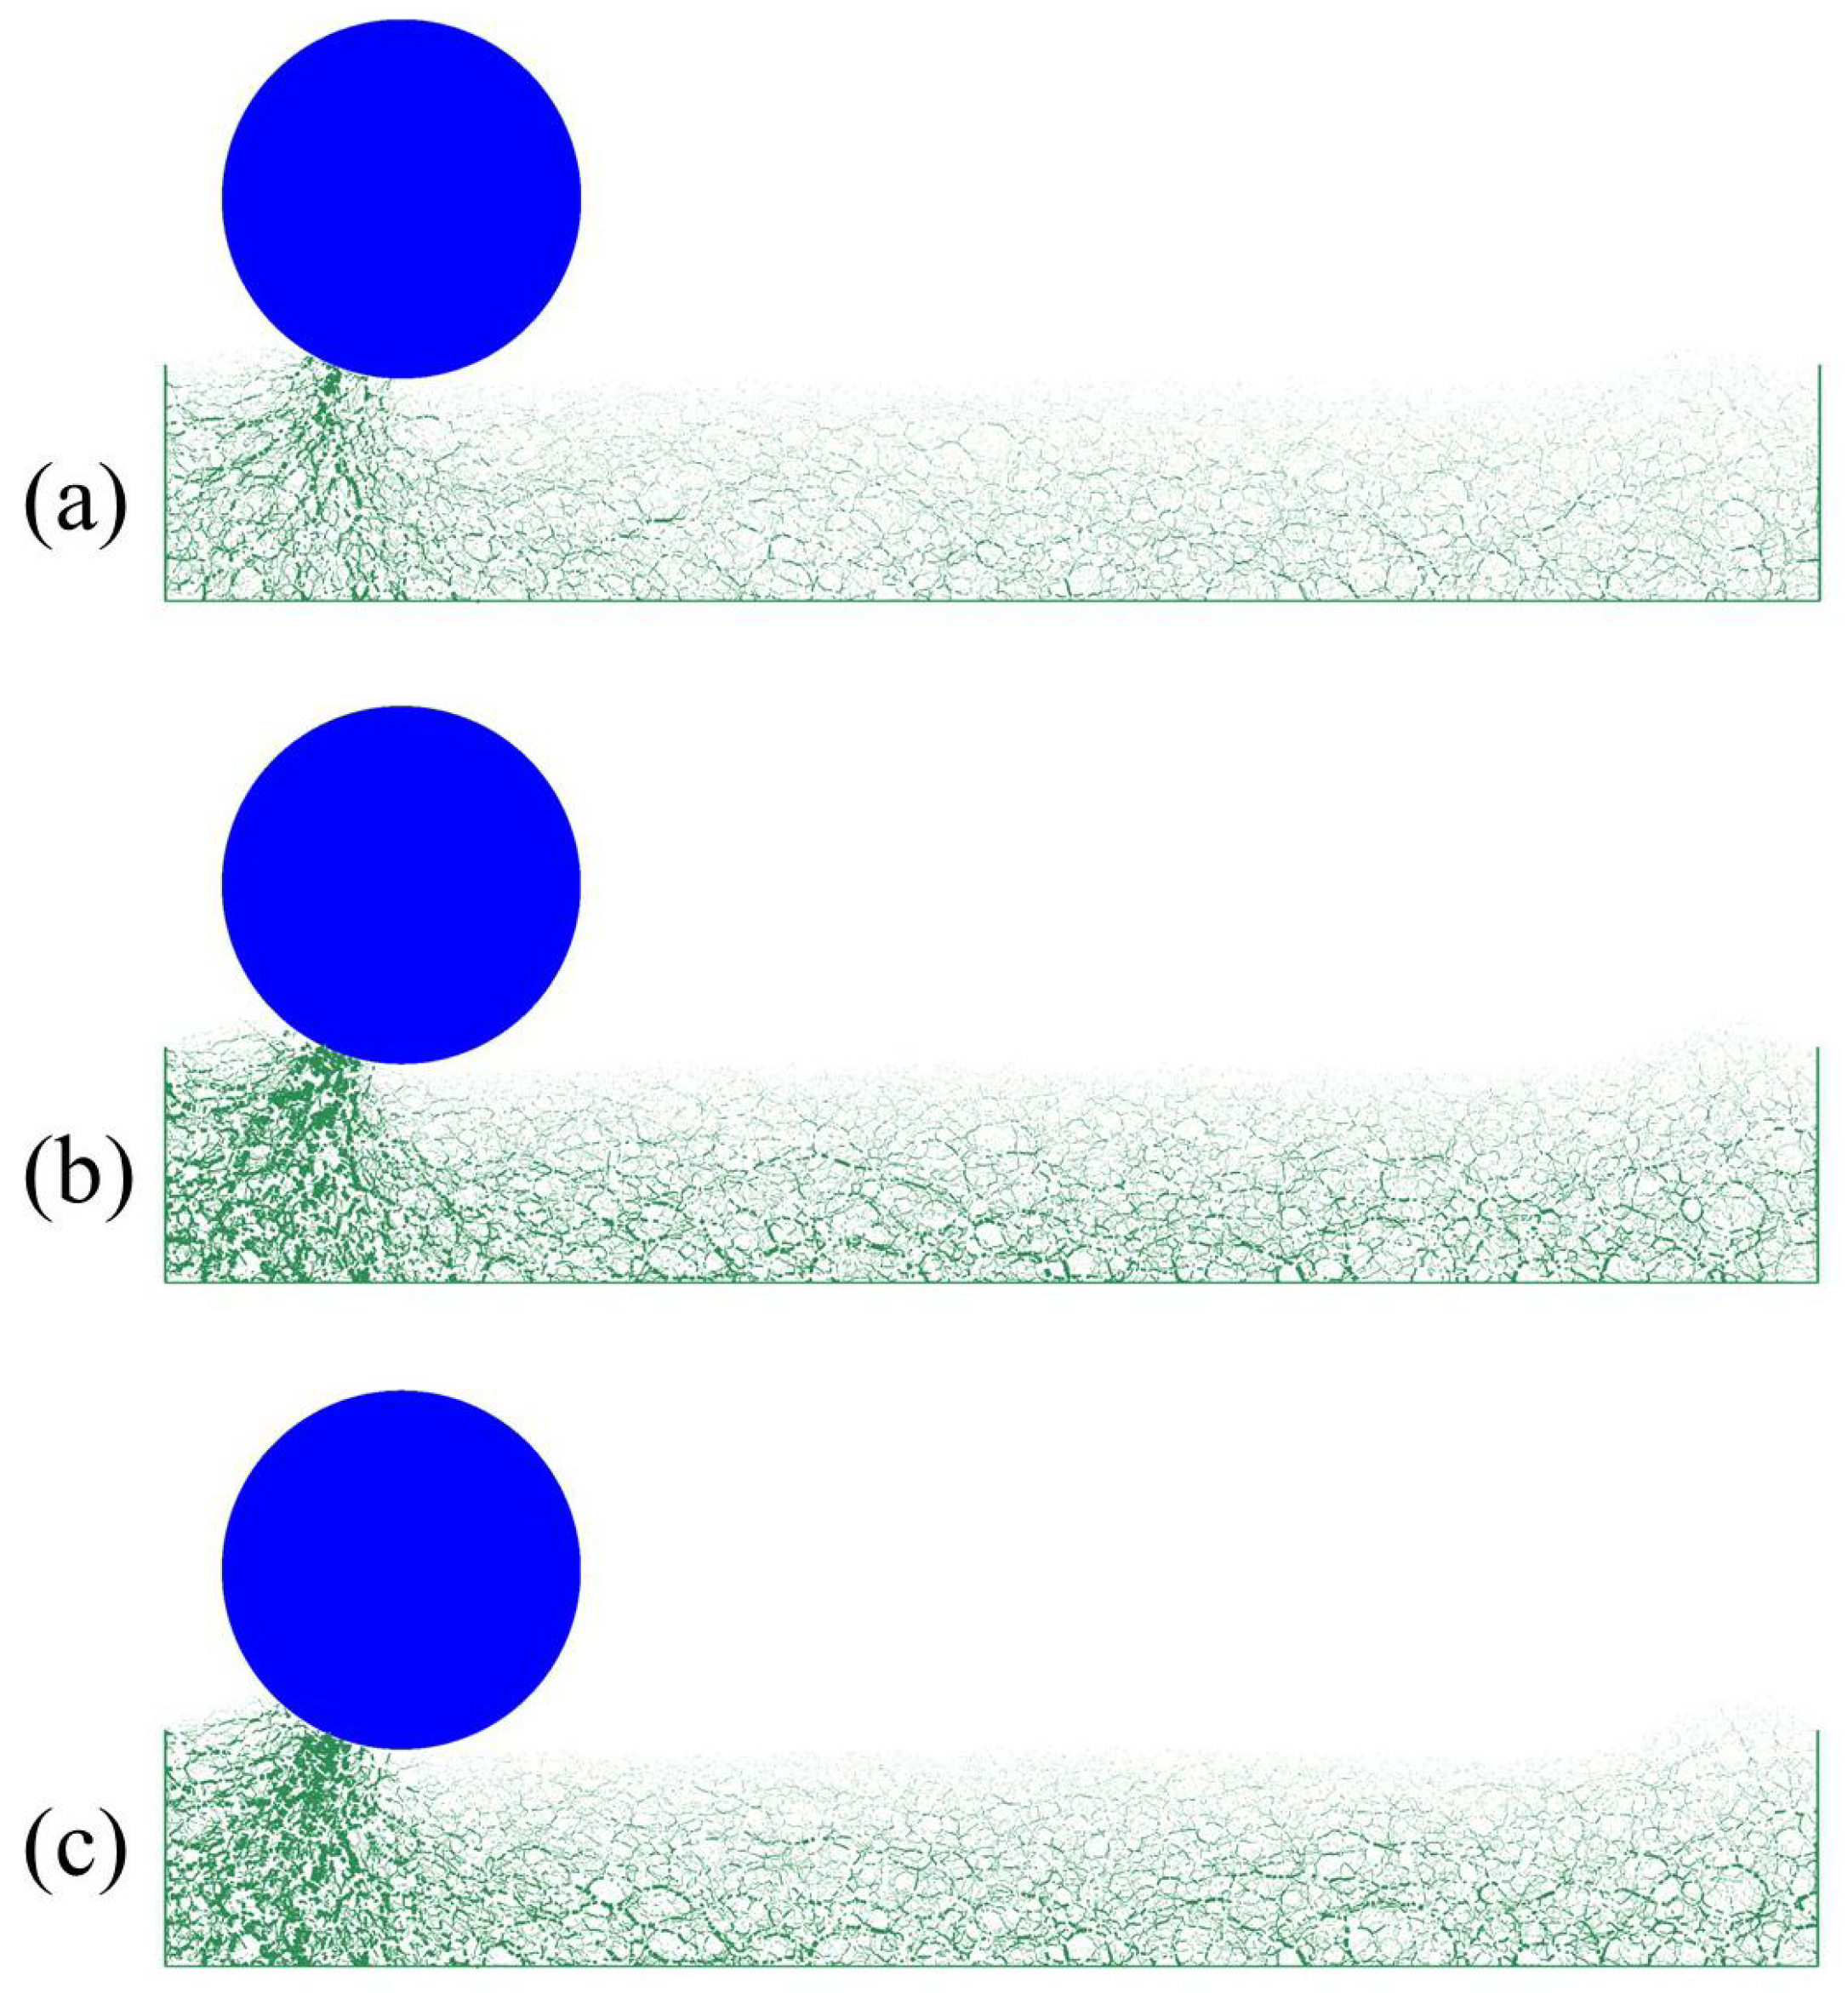
3.4. Displacement Field, Velocity Field, and Contact Force Chain

The evolution of the displacement field of gravels during the initial vibration compaction is depicted in Figure 9. The color mapping of the displacement represents changes in depth, indicating that the vibration compaction effect of the roller intensifies with higher volume fractions of rubber. The legends for displacement field is from 0 to 0.5 m. The interval is 0.05 m. The displacement cloud maps clearly illustrate that the rubber content enhances the magnitude and extent of displacement.
Figure 10 displays the velocity vectors of the granular mixture materials. The legend for velocity field is from 0 to 0.3 m/s. The interval is 0.025 m/s. It is evident that the granular mixture underneath the roller exhibit higher velocities compared with those in other regions. In addition, the maximum velocity field appears behind the direction of motion of the vibrating roller. The velocity field decays as it moves away from the vibration roller, with the deepest influence range only around half of the depth of the subgrade.
The DEM simulation serves as a powerful tool for visualizing the contact force chain, which is a fundamental microscopic static variable between sand particles. The plot of the contact force chain is essential for examining how energy is transmitted throughout the entire subgrade model. It is important to note that the magnitude of contact forces is not uniform; stronger force chains carry the majority of the stress, while weaker force chains represent areas of lower stress. From Figure 11, two key observations can be made: (i) the strong force network plays a vital role in the interaction between the roller and the mixture samples, and (ii) the contact force chain diffuses from the contact point into the depth of the entire model. The force chain distributes the contact force to the sand particles in a triangular pattern beneath the roller. Of particular importance is the fact that the strength of the contact force chain grows proportionally to the volume fraction of rubber particles. This phenomenon occurs because the force chain is predominantly carried by sand particles. As the number of rubber particles increases, the quantity of sand particles reduces. However, the vibration force remains relatively constant under similar conditions and is absorbed by the reduced number of sand particles. Consequently, instead of diminishing, the overall strength of the force chain actually increases. Therefore, the intuitive conclusion drawn is that a greater quantity of rubber particles significantly enhances the force chain distributed throughout the entire system, specifically acting on the sand particles.

4. Conclusions

This research focuses on a 2D DEM simulation of a vibratory roller performing roundtrip operations on a rubber–sand mixture subgrade. This study particularly emphasizes investigating the impact of rubber content in the mixtures and the operational parameters of the roller on compaction vibrations. Based on the numerical simulation findings discussed above, the following key conclusions are drawn:
  • The vibration frequency significantly influences the vibration compaction effect of rubber–sand mixtures. For mixtures with lower rubber content, optimal vibration effects are achieved at lower frequencies. Conversely, mixtures with higher rubber content require a progressively higher optimal vibration frequency to achieve the desired compaction effect.
  • The rubber content also affects the vibration compaction effect at the same vibration frequency, showing an initial increase followed by a decrease. Both the absence of rubber and high rubber content can reduce the vibration compaction effect. The 20% content of rubber with 35 Hz is demonstrated as a better compaction effects and lower energy consumption.
  • The rolling velocity and roller mass have a substantial influence on the vibration compaction effect, and their impacts do not follow a linear increase or decrease pattern. Therefore, achieving optimal compaction efficiency in engineering requires considering not only the rubber content in the mixture but also selecting an appropriate rolling velocity and roller mass.
  • The displacement field, velocity field, and contact forces offer insights into the interaction mechanism between the roller and rubber–sand mixture particles during the vibration compaction process. The movement of gravel under the roller is typically divided into two directions, and the strong force network plays a crucial role in the interaction between the roller and the granular particles.
In a future study, we plan to further expand our research by investigating the influence of varying rubber content and rubber particle sizes on the effectiveness of vibration compaction in 3D DEM simulations. Simultaneously, in alignment with local construction guidelines, we will delve into the optimal working parameters of vibration rollers, aiming to enhance compaction efficiency while also promoting energy conservation and emission reduction. Our objective is to furnish valuable insights for practical engineering applications.

Author Contributions

Software and original draft preparation, W.S.; supervision and validation, Q.X.; methodology and formal analysis, H.L.; data curation, J.C.; writing—review and editing, K.W. All authors have read and agreed to the published version of the manuscript.

Funding

We gratefully acknowledge the financial support provided by the National Natural Science Foundation of China NO. 51608112, the Fundamental Research Funds for the Central Universities NO.2242023K40018, and the open fund project from Chongqing Key Laboratory of Geomechanics & Geoenvironment Protection (LQYTKFJJ2020002).

Institutional Review Board Statement

Not applicable.

Informed Consent Statement

Not applicable.

Data Availability Statement

The data that support the findings of this study are available from the corresponding author upon reasonable request.

Conflicts of Interest

The authors declare no conflict of interest.

References

  1. Liu, J.Y.; Nicot, F.; Zhou, W. Sustainability of internal structures during shear band forming in 2D granular materials. Powder Technol. 2018, 338, 458–470. [Google Scholar] [CrossRef]
  2. Platzer, A.; Rouhanifar, S.; Richard, P.; Cazacliu, B.; Ibraim, E. Sand-rubber mixtures undergoing isotropic loading derivation and experimental probing of a physical model. Granul. Matter 2018, 20, 81. [Google Scholar] [CrossRef]
  3. Manohar, D.R.; Anbazhagan, P. Shear strength characteristics of geosynthetic reinforced rubber-sand mixtures. Geotext. Geomembranes 2021, 49, 910–920. [Google Scholar] [CrossRef]
  4. Wu, K.; Sun, W.C.; Liu, S.Y.; Huang, H.B. Discrete Element Modeling of Vibration Compaction Effect of the Vibratory Roller in Roundtrips on Gravels. J. Test. Eval. 2021, 49, 3869–3884. [Google Scholar] [CrossRef]
  5. Ding, Y.; Zhang, J.S.; Chen, X.B.; Wang, X.; Jia, Y. Experimental investigation on static and dynamic characteristics of granulated rubber sand mixtures as a new railway subgrade filler. Constr. Build. Mater. 2021, 273, 121955. [Google Scholar] [CrossRef]
  6. Fakharian, K.; Ahmad, A. Effect of anisotropic consolidation and rubber content on dynamic parameters of granulated rubber-sand mixtures. Soil Dyn. Earthq. Eng. 2021, 141, 106531. [Google Scholar] [CrossRef]
  7. Khatami, H.; Deng, A.; Jaksa, M. Discrete-element modelling of the trapdoor arching effect in sand and rubberised sand. Proc. Inst. Civ. Eng. Geotech. Eng. 2021, 174, 657–669. [Google Scholar] [CrossRef]
  8. Yaowarat, T.; Suddeepong, A.; Hoy, M.; Horpibulsuk, S.; Takaikaew, T.; Vichitcholchai, N.; Arulrajah, A.; Chinkulkijniwat, A. Improvement of flexural strength of concrete pavements using natural rubber latex. Constr. Build. Mater. 2021, 282, 122704. [Google Scholar] [CrossRef]
  9. Saberian, M.; Li, J.; Perera, S.T.A.M.; Zhou, A.; Roychand, R.; Ren, G. Large-scale direct shear testing of waste crushed rock reinforced with waste rubber as pavement base/subbase materials. Transp. Geotech. 2021, 28, 100546. [Google Scholar] [CrossRef]
  10. Li, D.L.; Leng, Z.; Zhang, S.W.; Jiang, J.W.; Yu, H.Y.; Wellner, F.; Leischner, S. Blending efffciency of reclaimed asphalt rubber pavement mixture and its correlation with cracking resistance. Resour. Conserv. Recycl. 2022, 185, 106506. [Google Scholar] [CrossRef]
  11. Tran, N.Q.; Hoy, M.; Suddeepong, A.; Horpibulsuk, S.; Kantathum, K.; Arulrajah, A. Improved mechanical and microstructure of cement-stabilized lateritic soil using recycled materials replacement and natural rubber latex for pavement applications. Constr. Build. Mater. 2022, 347, 128547. [Google Scholar] [CrossRef]
  12. Valizadeh, H.; Ecemis, N. Soil liquefaction-induced uplift of buried pipes in sand-granulated-rubbermixture Numerical modeling. Transp. Geotech. 2022, 33, 100719. [Google Scholar] [CrossRef]
  13. Tan, T.; Xing, C.; Tan, Y.Q. Rubber friction on icy pavement Experiments and modeling. Cold Reg. Sci. Technol. 2020, 174, 103022. [Google Scholar] [CrossRef]
  14. Wersall, C.; Nordfelt, I.; Larsson, S. Soil compaction by vibratory roller with variable frequency. Geotechnique 2017, 67, 272–278. [Google Scholar] [CrossRef]
  15. Wersall, C.; Nordfelt, I.; Larsson, S. Resonant roller compaction of gravel in full-scale tests. Transp. Geotech. 2018, 14, 93–97. [Google Scholar] [CrossRef]
  16. Cundall, P.A.; Strack, O.D.L. A discrete numerical model for granular assemblies. Geotechnique 1979, 29, 47–65. [Google Scholar] [CrossRef]
  17. Tian, J.Q.; Liu, E.L. Effect of particle shape on micro-and mesostructure evolution of granular assemblies under biaxial loading conditions. Comptes Rendus Mec. 2018, 346, 1233–1252. [Google Scholar] [CrossRef]
  18. Wu, K.; Remond, S.; Abriak, N.E.; Pizette, P.; Becquart, F.; Liu, S.Y. Study of the shear behavior of binary granular materials by DEM simulations and experimental triaxial tests. Adv. Powder Technol. 2017, 28, 2198–2210. [Google Scholar] [CrossRef]
  19. Ma, C.; Yao, W.M.; Yao, Y.; Li, J. Simulating Strength Parameters and Size Effect of Stochastic Jointed Rock Mass using DEM Method. KSCE J. Civ. Eng. 2018, 22, 4872–4881. [Google Scholar] [CrossRef]
  20. Hanley, K.J.; O’Sullivan, C.; Huang, X. Particle-scale mechanics of sand crushing incompression and shearing using DEM. Soils Found. 2015, 55, 1100–1112. [Google Scholar] [CrossRef]
  21. Chen, Y.; Jaksa, M.B.; Kuo, Y.; Airey, D.W. Investigating the effectiveness of Rolling Dynamic Compaction using Discrete Element Method. Granul. Matter 2021, 23, 94. [Google Scholar] [CrossRef]
  22. Perez, J.C.L.; Kwok, C.Y.; Senetakis, K. Micromechanical analyses of the effect of rubber size and content on sand-rubber mixtures at the critical state. Geotext. Geomembranes 2017, 45, 81–97. [Google Scholar] [CrossRef]
  23. Asadi, M.; Thoeni, K.; Mahboubi, A. An experimental and numerical study on the compressive behavior of sand rubber particle mixtures. Comput. Geotech. 2018, 104, 185–195. [Google Scholar] [CrossRef]
  24. Gong, L.X.; Nie, L.; Xu, Y.; Wang, H.; Zhang, T.; Du, C.; Wang, Y.Z. Discrete element modelling of the mechanical behaviour of a sand-rubber mixture containing large rubber particles. Constr. Build. Mater. 2019, 205, 574–585. [Google Scholar] [CrossRef]
  25. Sarajpoor, S.; Kavand, A.; Zogh, P.; Ghalandarzadeh, A. Dynamic behavior of sand-rubber mixtures based on hollow cylinder tests. Constr. Build. Mater. 2020, 251, 118948. [Google Scholar] [CrossRef]
  26. Akbarimehr, D.; Fakharian, K. Dynamic shear modulus and damping ratio of clay mixed with waste rubber using cyclic triaxial apparatus. Soil Dyn. Earthq. Eng. 2021, 140, 106435. [Google Scholar] [CrossRef]
  27. Akbarimehr, D.; Hosseini, S. Elasto-plastic characteristics of the clay soil mixed with rubber waste using cyclic triaxial test results. Arab. J. Geosci. 2022, 15, 1280. [Google Scholar] [CrossRef]
  28. Ai, J.; Chen, J.F.; Rotter, J.M.; Ooi, J.Y. Assessment of Rolling Resistance Models in Discrete Element Simulations. Powder Technol. 2011, 206, 269–282. [Google Scholar] [CrossRef]
  29. Baghbani, A.; Costa, S.; Lu, Y.; Soltani, A.; Abuel-Naga, H.; Samui, P. Effects of particle shape on shear modulus of sand using dynamic simple shear testing. Arab. J. Geosci. 2023, 16, 422. [Google Scholar] [CrossRef]
Figure 1. Gradation curve of sand samples.
Sustainability 15 14238 g001
Figure 2. Different shape templates for sand and rubber particles.
Sustainability 15 14238 g002
Figure 3. Subgrade models with different volume fractions of rubber–sand mixtures: (a) 0%, (b) 10%, (c) 20%, (d) 30%, and (e) 40%.
Sustainability 15 14238 g003
Figure 4. Ground deformation after five roundtrips of vibratory roller by particle displacement field contour.
Sustainability 15 14238 g004
Figure 5. Influence of vibration compaction frequencies on the porosities of different volume fractions of rubber–sand mixtures: (a) VF = 0%, (b) VF = 10%, (c) VF = 20%, and (d) VF = 30%.
Sustainability 15 14238 g005
Figure 6. Influence of volume fractions of rubber on the vibration compaction effects of mixtures: (a) f = 12 Hz, (b) f = 15 Hz, (c) f = 20 Hz, (d) f = 25 Hz, (e) f = 30 Hz, and (f) f = 35 Hz.
Sustainability 15 14238 g006
Figure 7. Influence of rolling velocity on the rubber–sand mixture subgrade with volume fraction of 20% rubber particles.
Sustainability 15 14238 g007
Figure 8. Influence of roller mass on the rubber–sand mixture subgrade with volume fraction of 20% rubber particles.
Sustainability 15 14238 g008
Figure 9. Displacement field of rubber–sand mixture subgrade under vibration compaction roller with different volume fractions of rubber: (a) VF = 0%, (b) VF = 20%, and (c) VF = 40%.
Sustainability 15 14238 g009
Figure 10. Velocity field of rubber–sand mixture subgrade under vibration compaction roller with different volume fractions of rubber: (a) VF = 0%, (b) VF = 20%, and (c) VF = 40%.
Sustainability 15 14238 g010
Figure 11. Contact force chains of rubber–sand mixture subgrade under vibration compaction roller with different volume fractions of rubber: (a) VF = 0%, (b) VF = 20%, and (c) VF = 40%.
Sustainability 15 14238 g011
Table 1. Rubber and sand particles numbers for different volume fractions of subgrade mixture samples.
SamplesVolume Fraction (VF)Sand ParticlesRubber ParticlesInitial Porosity
VF10%60,35600.181
VF210%54,27851680.165
VF320%48,20410,4460.180
VF430%42,18315,5370.172
VF540%36,21420,9220.175
Table 2. Values of parameters used in the simulations of binary particle samples.
ParameterValueUnity
Effective modulus of between sand particles, E s s * 50MPa
Effective modulus of between rubber particles, E r r * 5MPa
Effective modulus of between sand and rubber particles, E s r * 5MPa
Normal to shear stiffness ratio, κ p * 1.5-
Normal critical damping ratio, β n 0.25-
Shear critical damping ratio, β s 1.5 × 10 6 -
Density of sand particles, N s 2230kg/m 3
Density of rubber particles, N r 1680kg/m 3
Local damping, α 0.5-
Friction coefficient between sand particles, μ s s 0.3-
Rolling resistance coefficient between sand particles, μ r s s 0.2-
Friction coefficient between rubber particles, μ r r 0.5-
Rolling resistance coefficient between rubber particles, μ r r r 0.3-
Friction coefficient between sand–rubber particles, μ s r 0.5-
Rolling resistance coefficient between sand–rubber particles, μ r s r 0.3-
Friction coefficient between wall–sand/rubber particles, μ w s r 0.1-
Rolling resistance coefficient between wall–sand/rubber particles, μ r w s r 0.05-
Table 3. Values of working parameters used in the simulations of vibratory roller.
ParameterValueUnity
Roller diameter, d1.52m
Roller width, l2.13m
Roller mass, m7000, 7600, 8000, 8500kg
Vibration frequency, f12, 15, 18, 20, 22, 25, 28, 30, 32, 35Hz
Rolling velocity, v1.0, 2.0, 3.0, 4.0m/s
Disclaimer/Publisher’s Note: The statements, opinions and data contained in all publications are solely those of the individual author(s) and contributor(s) and not of MDPI and/or the editor(s). MDPI and/or the editor(s) disclaim responsibility for any injury to people or property resulting from any ideas, methods, instructions or products referred to in the content.

