

Hydrological Properties of Rill Erosion on a Soil from a Drought-Prone Area during Successive Rainfalls as a Result of Microorganism Inoculation


Abstract
:1. Introduction
2. Research Methodology
2.1. Soil Analysis
2.2. Selection and Supply of Cyanobacteria and Bacteria for Inoculation
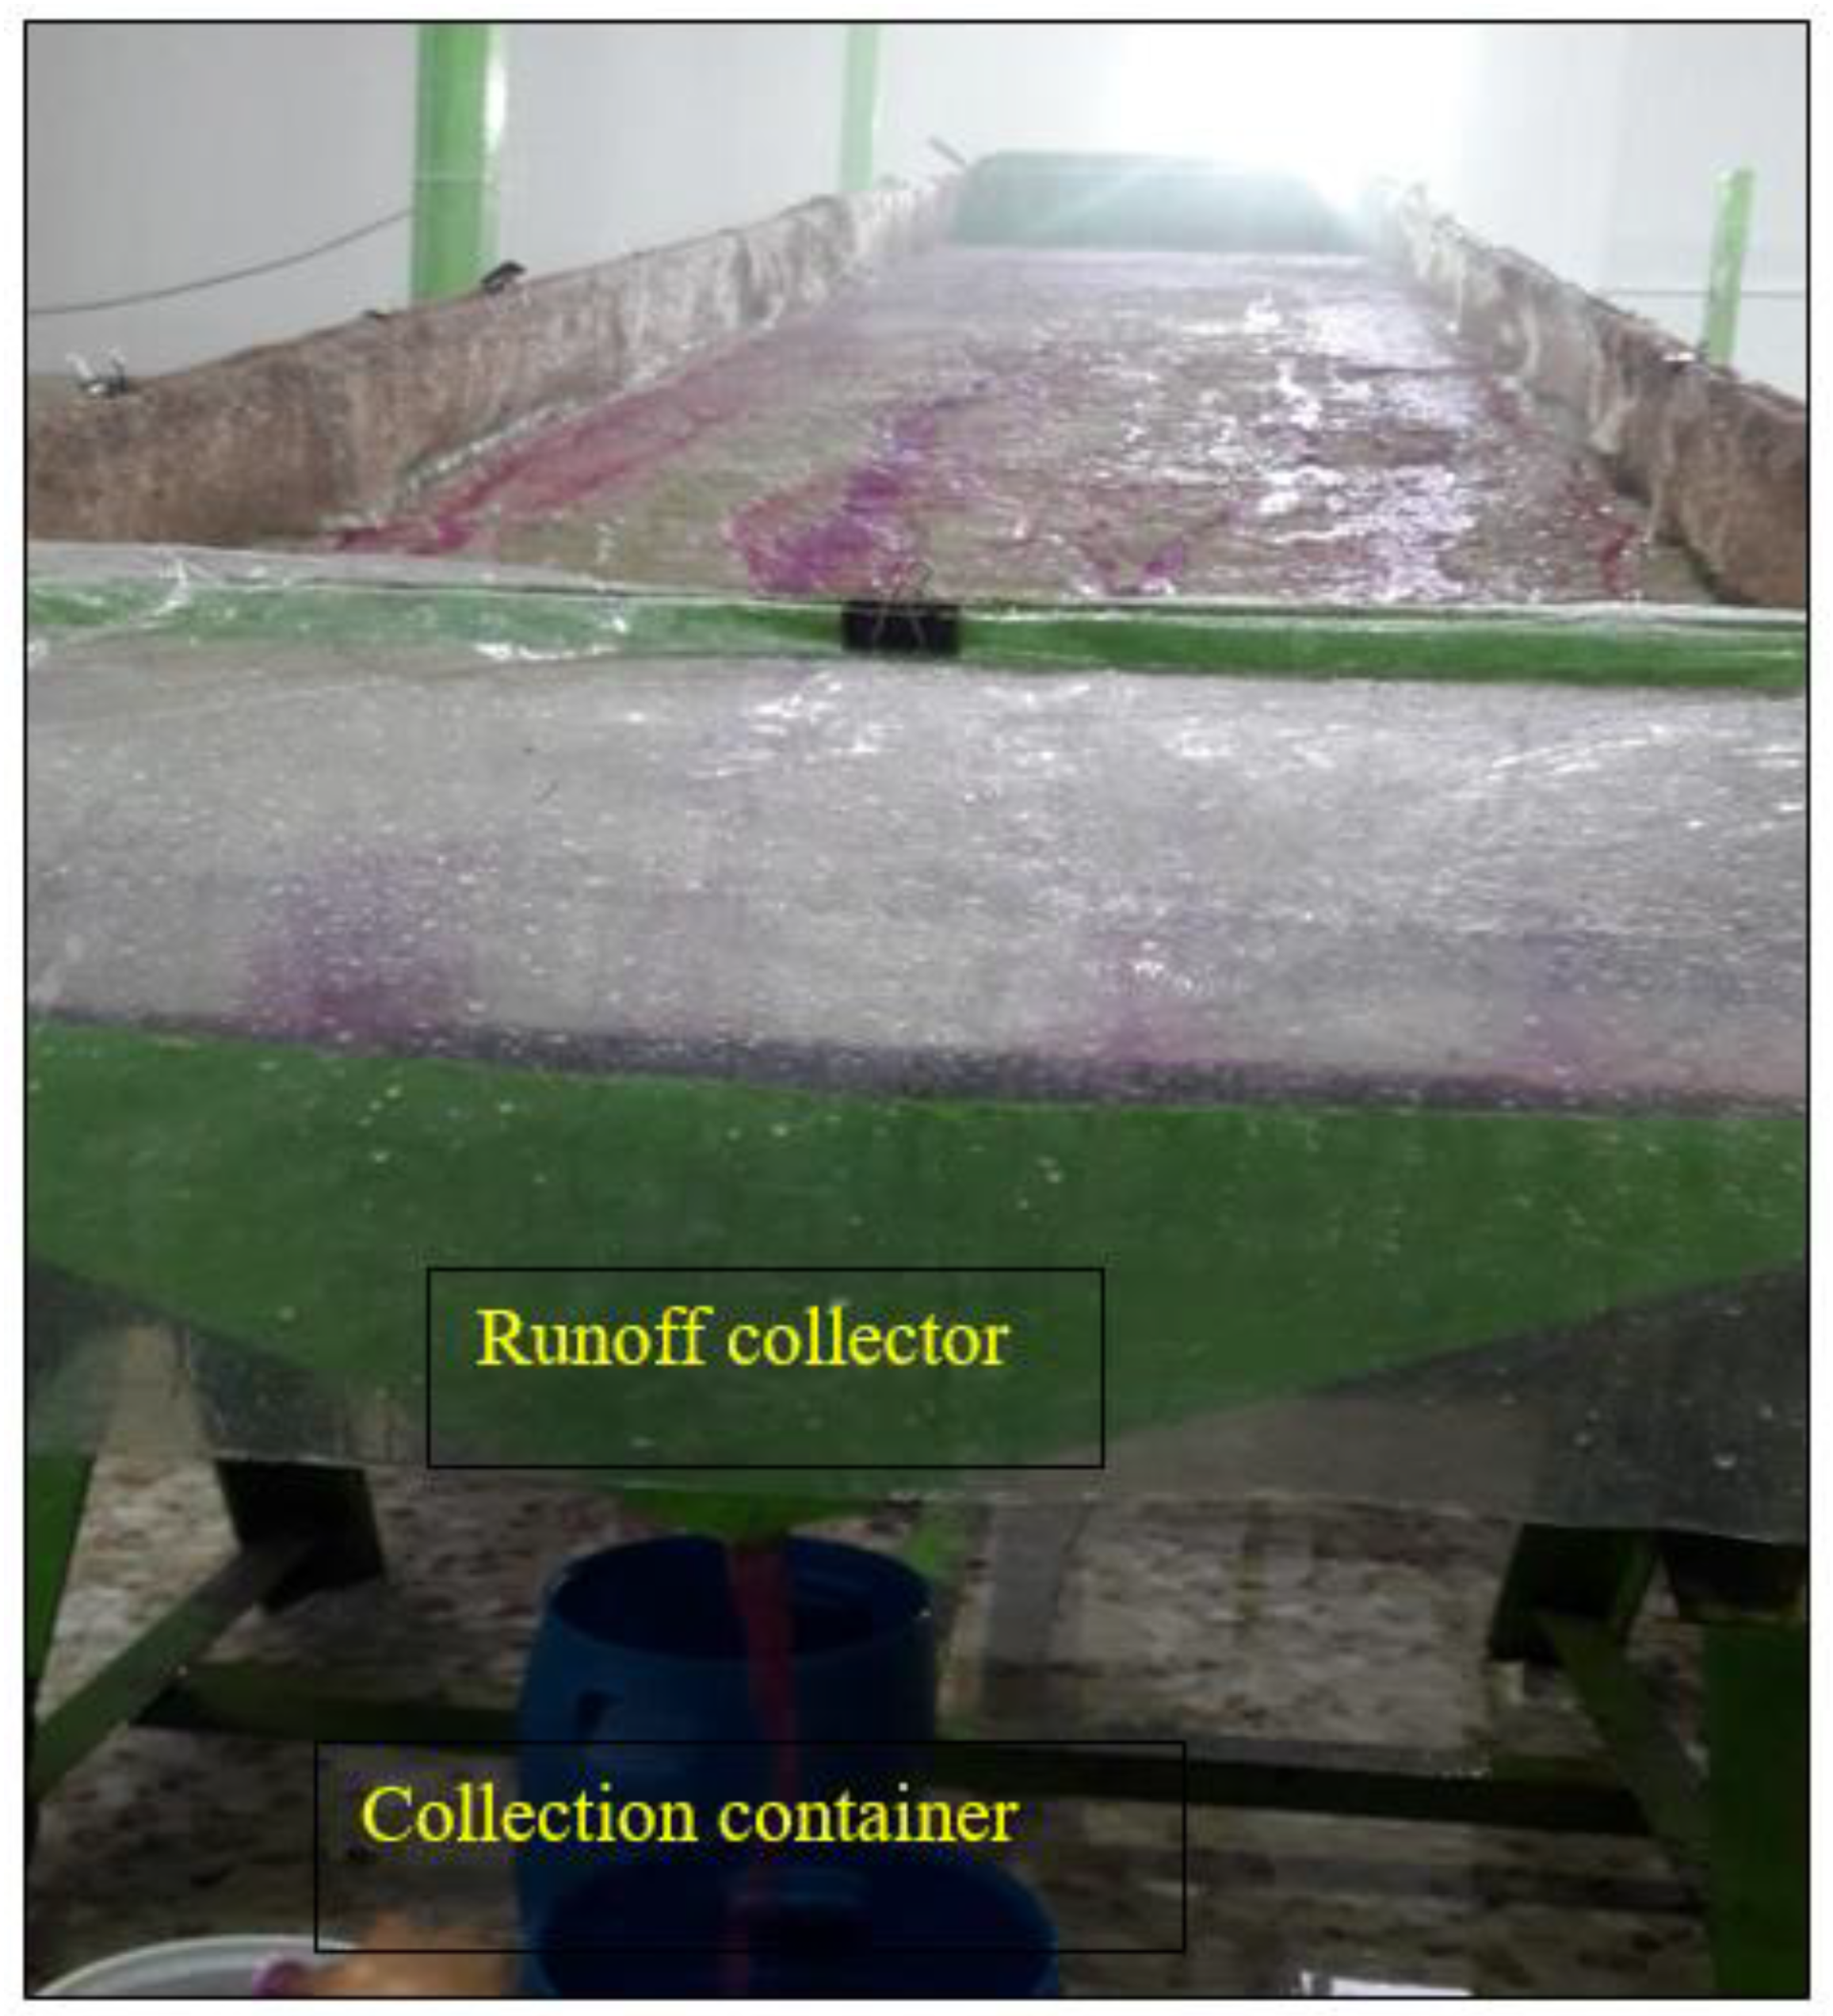
2.3. Experimental Section Plot Preparation
2.4. Hydrological Components Measurement
2.5. Analytical Statistics
3. Results
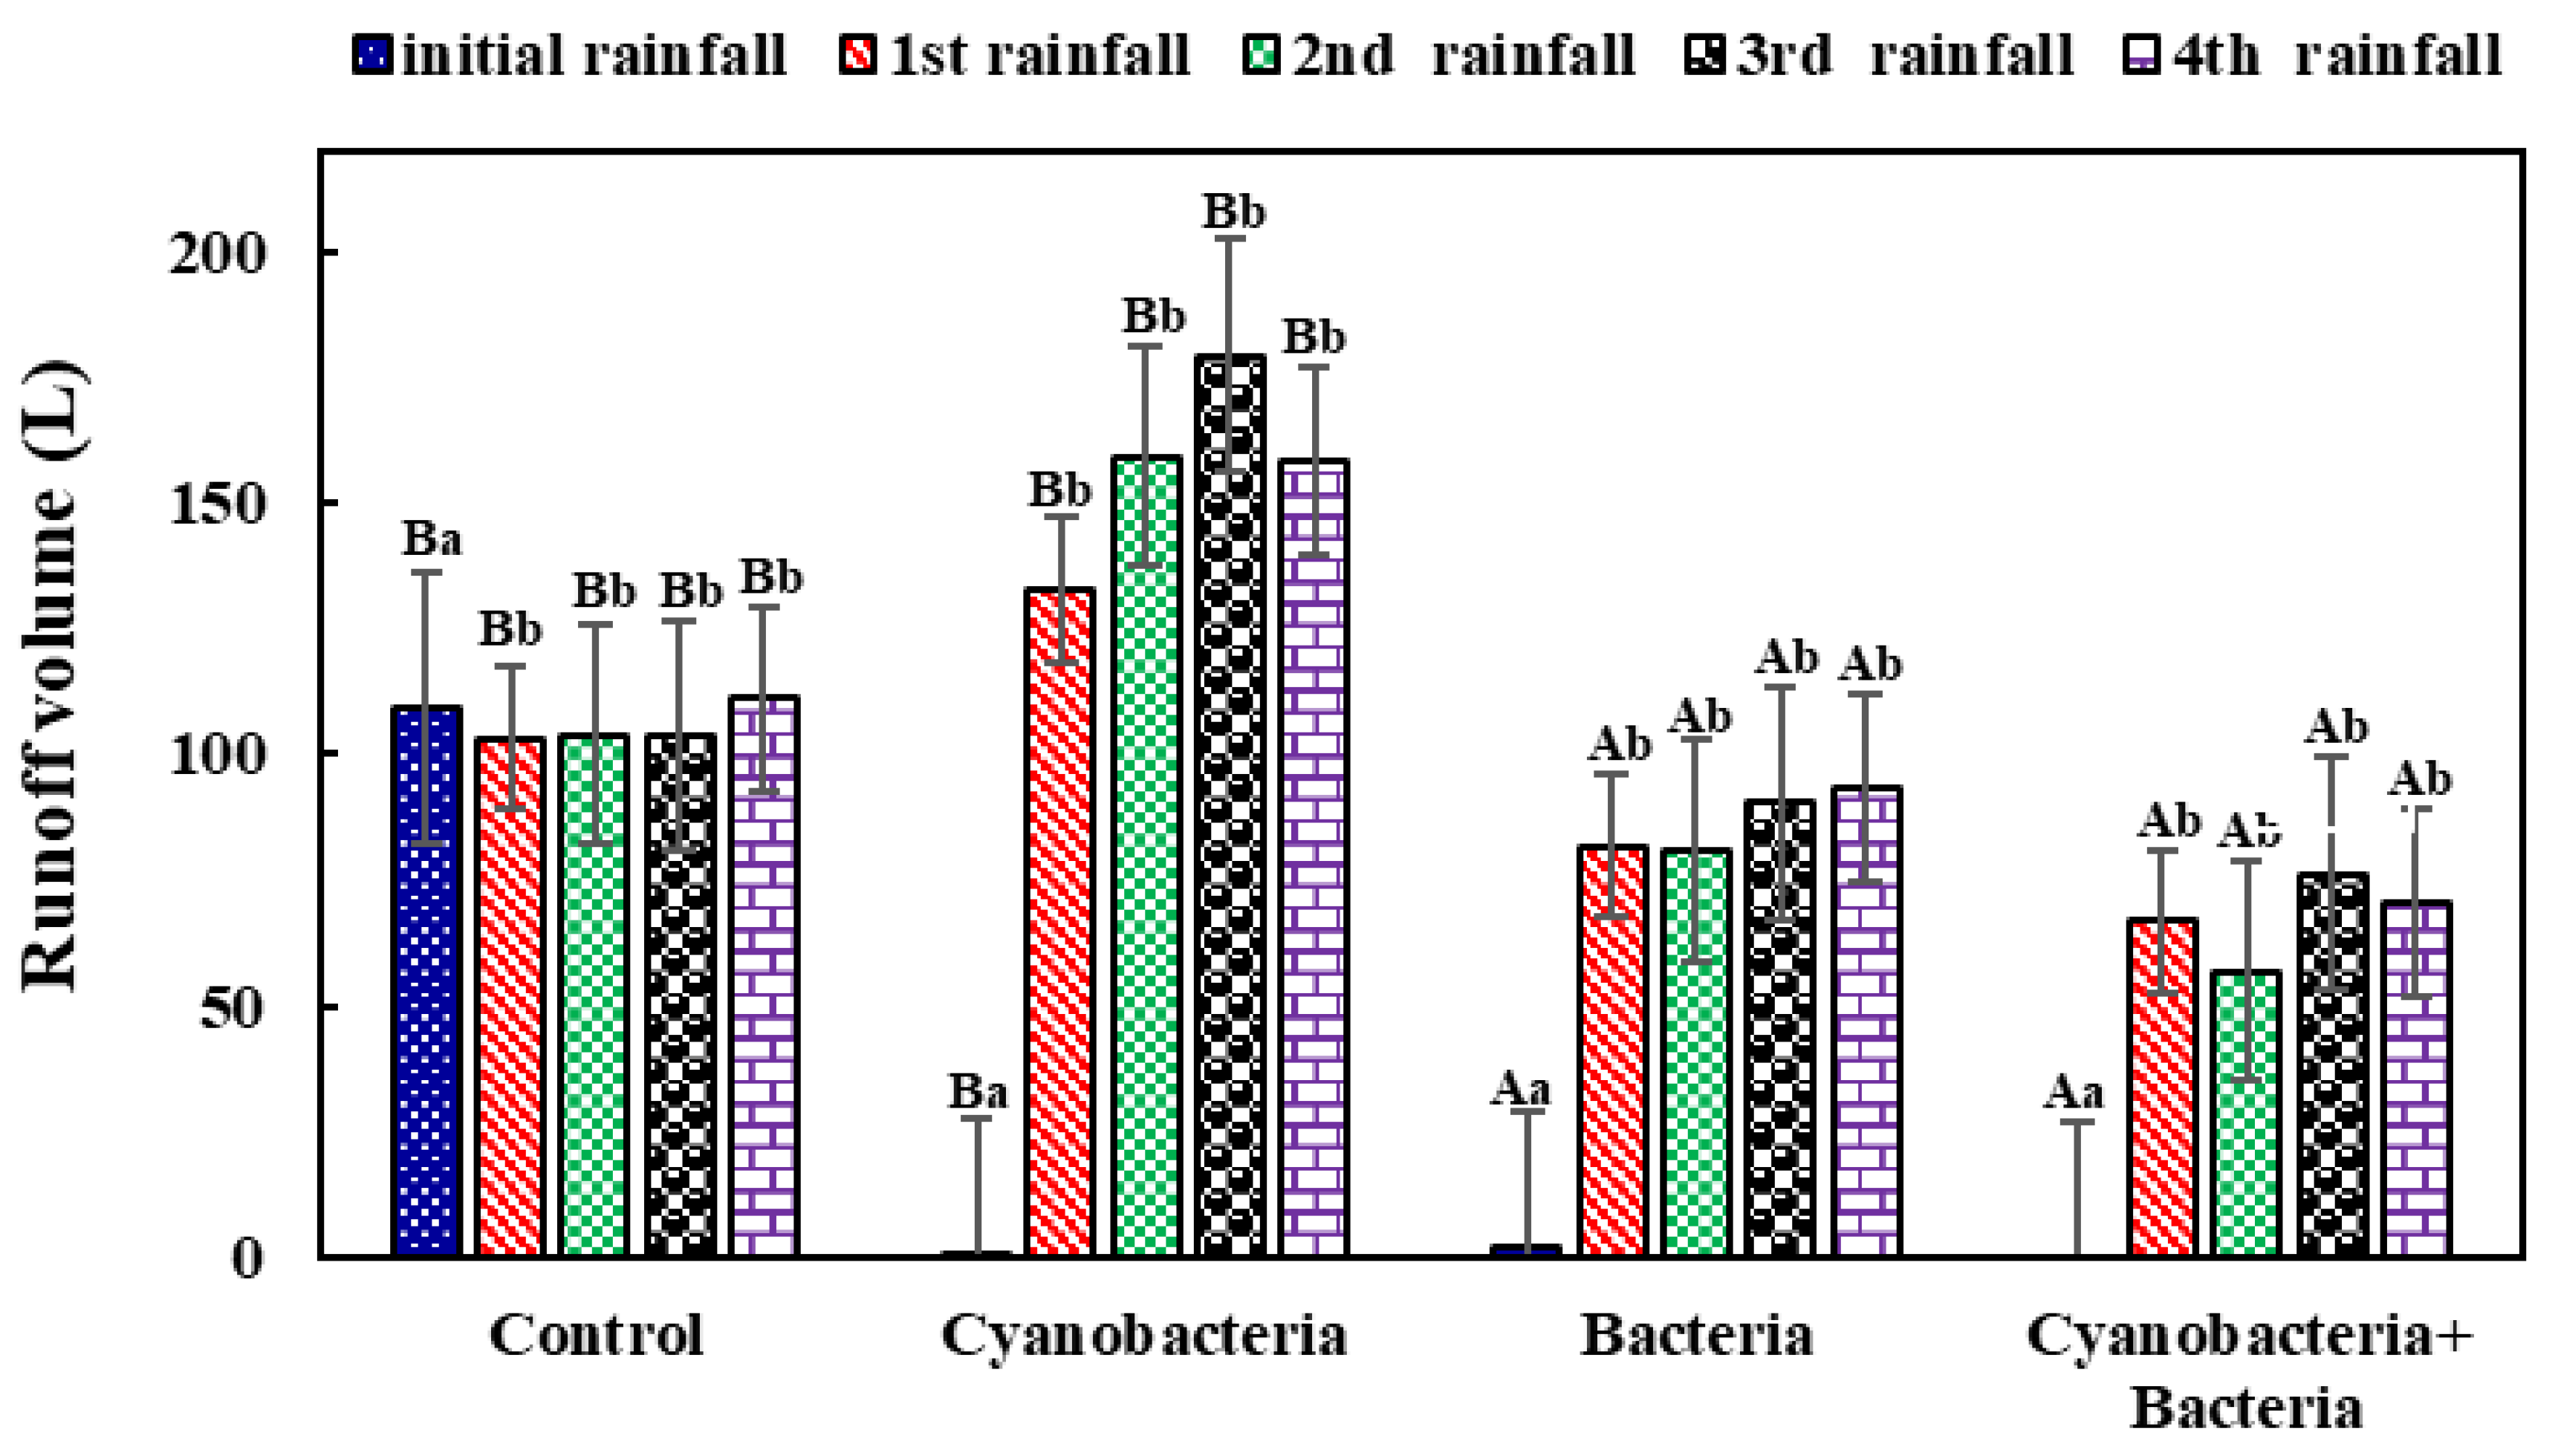
3.1. Runoff Volume
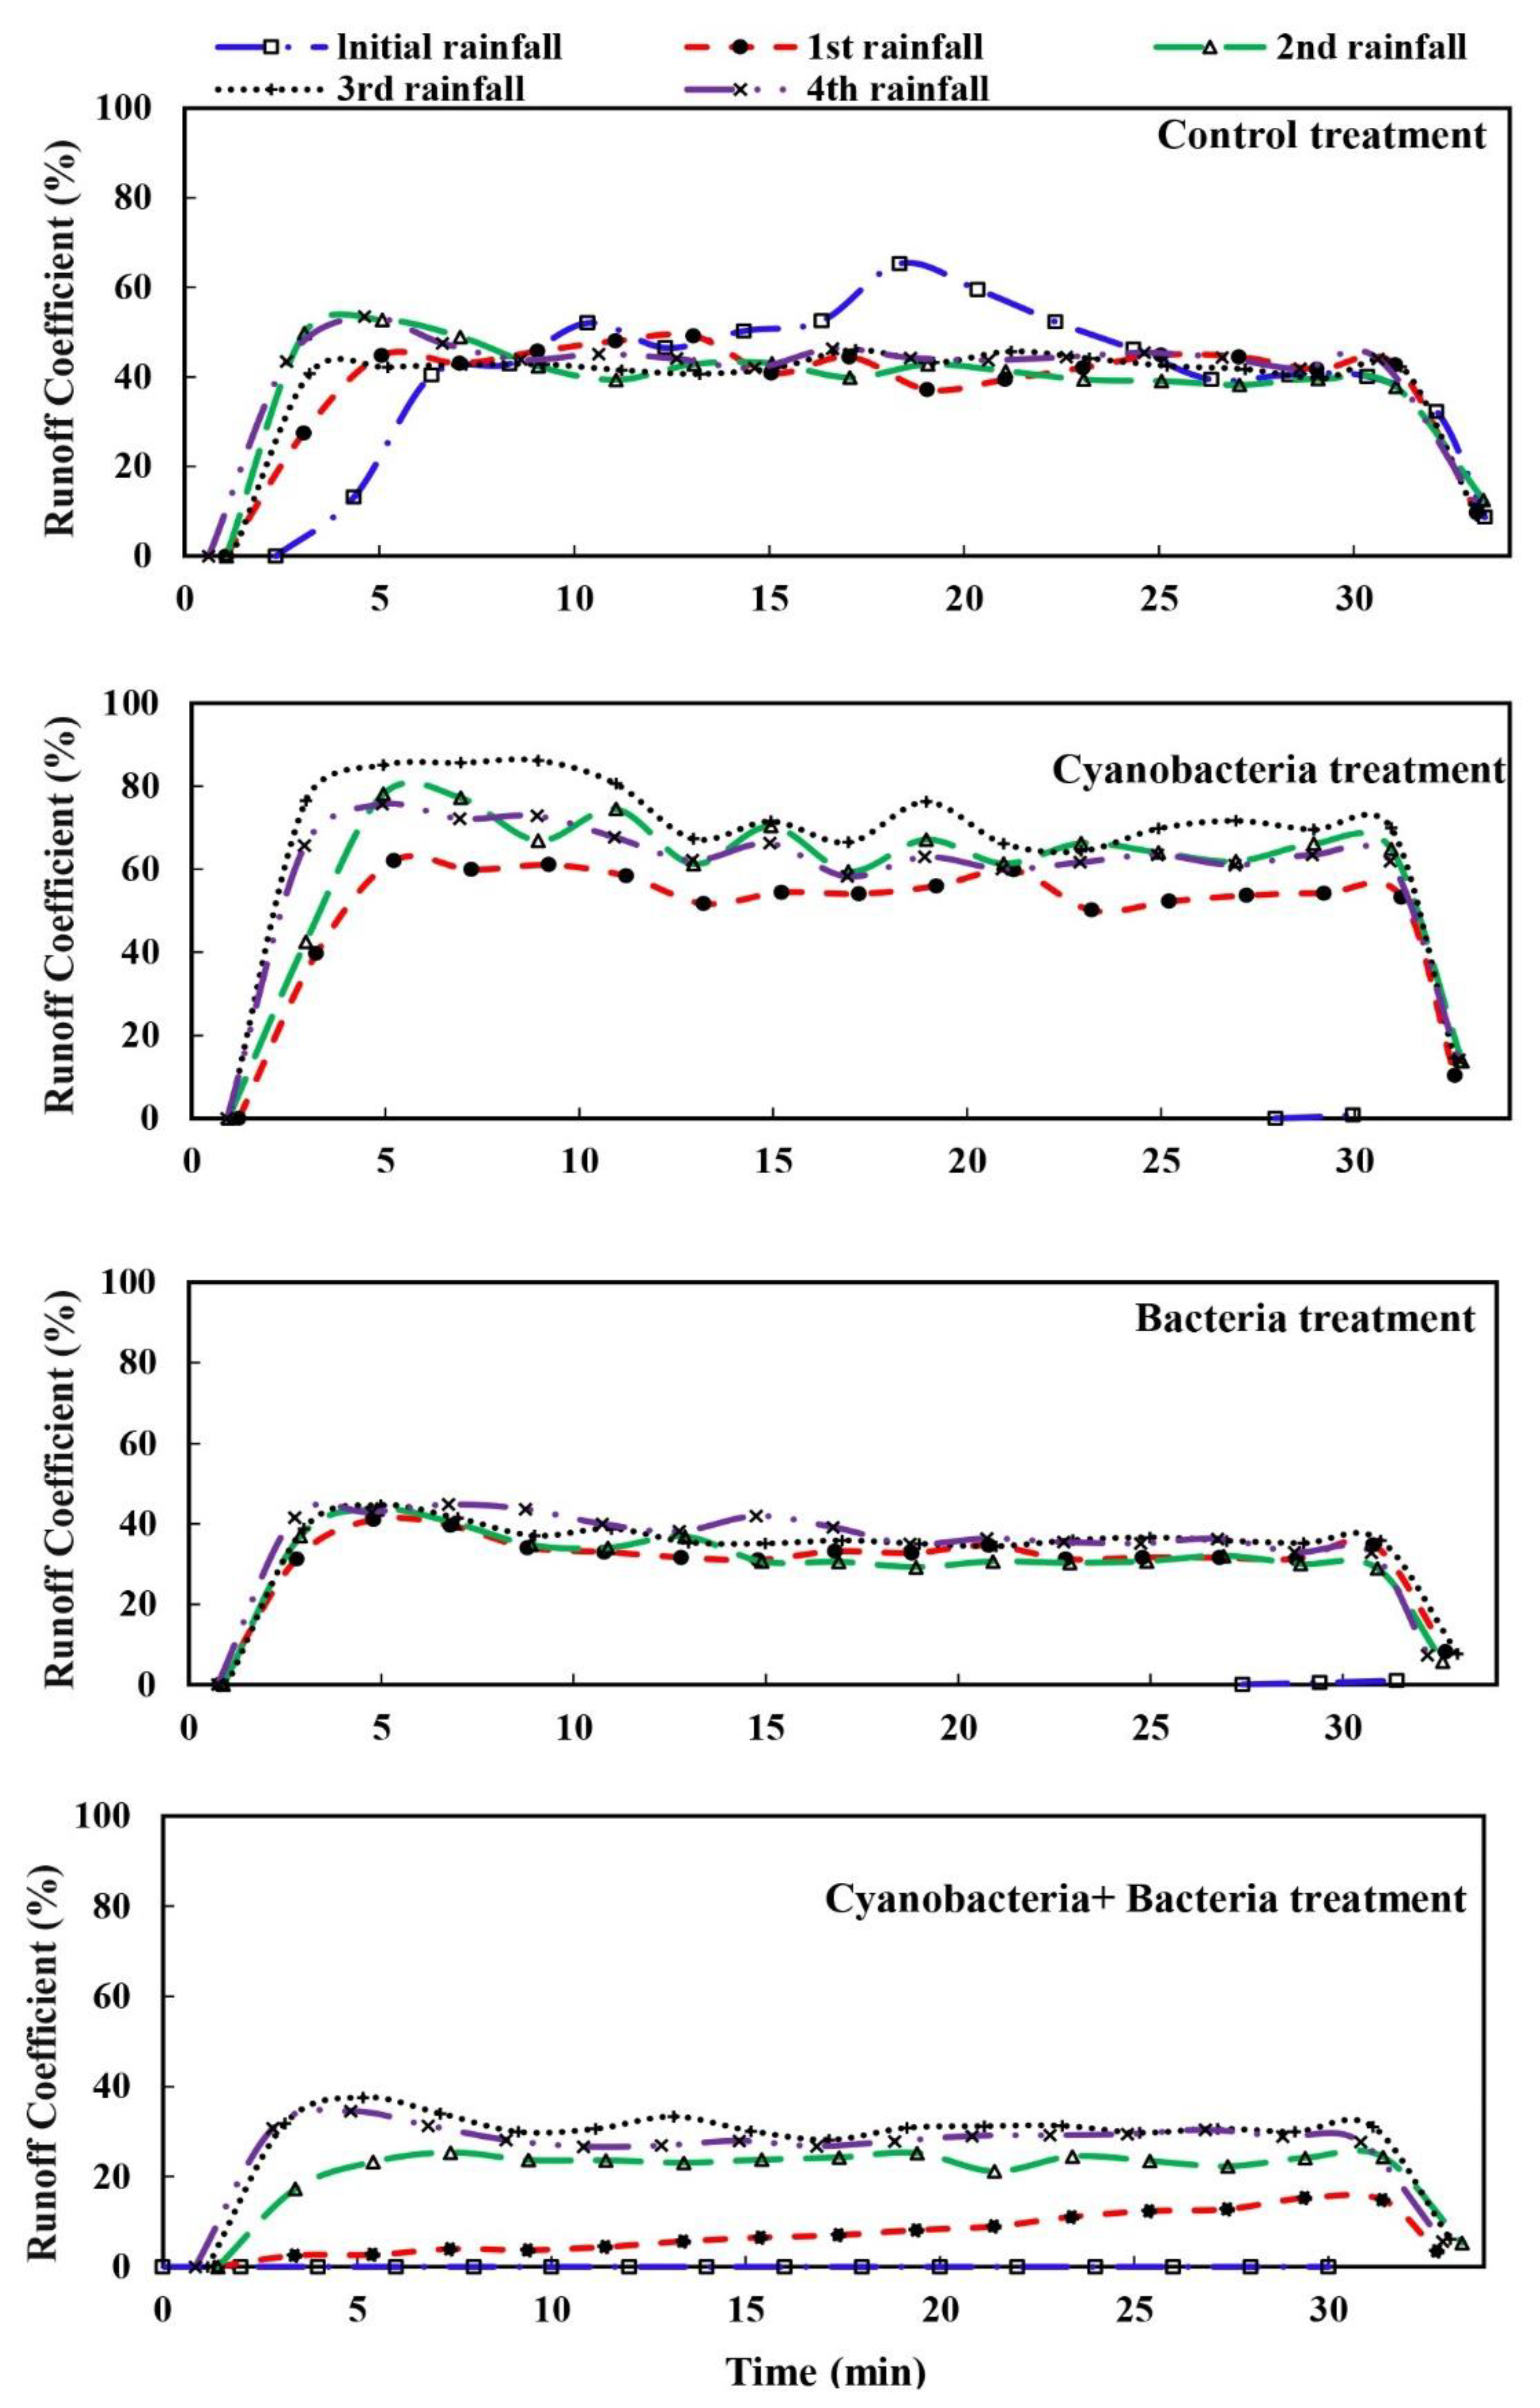
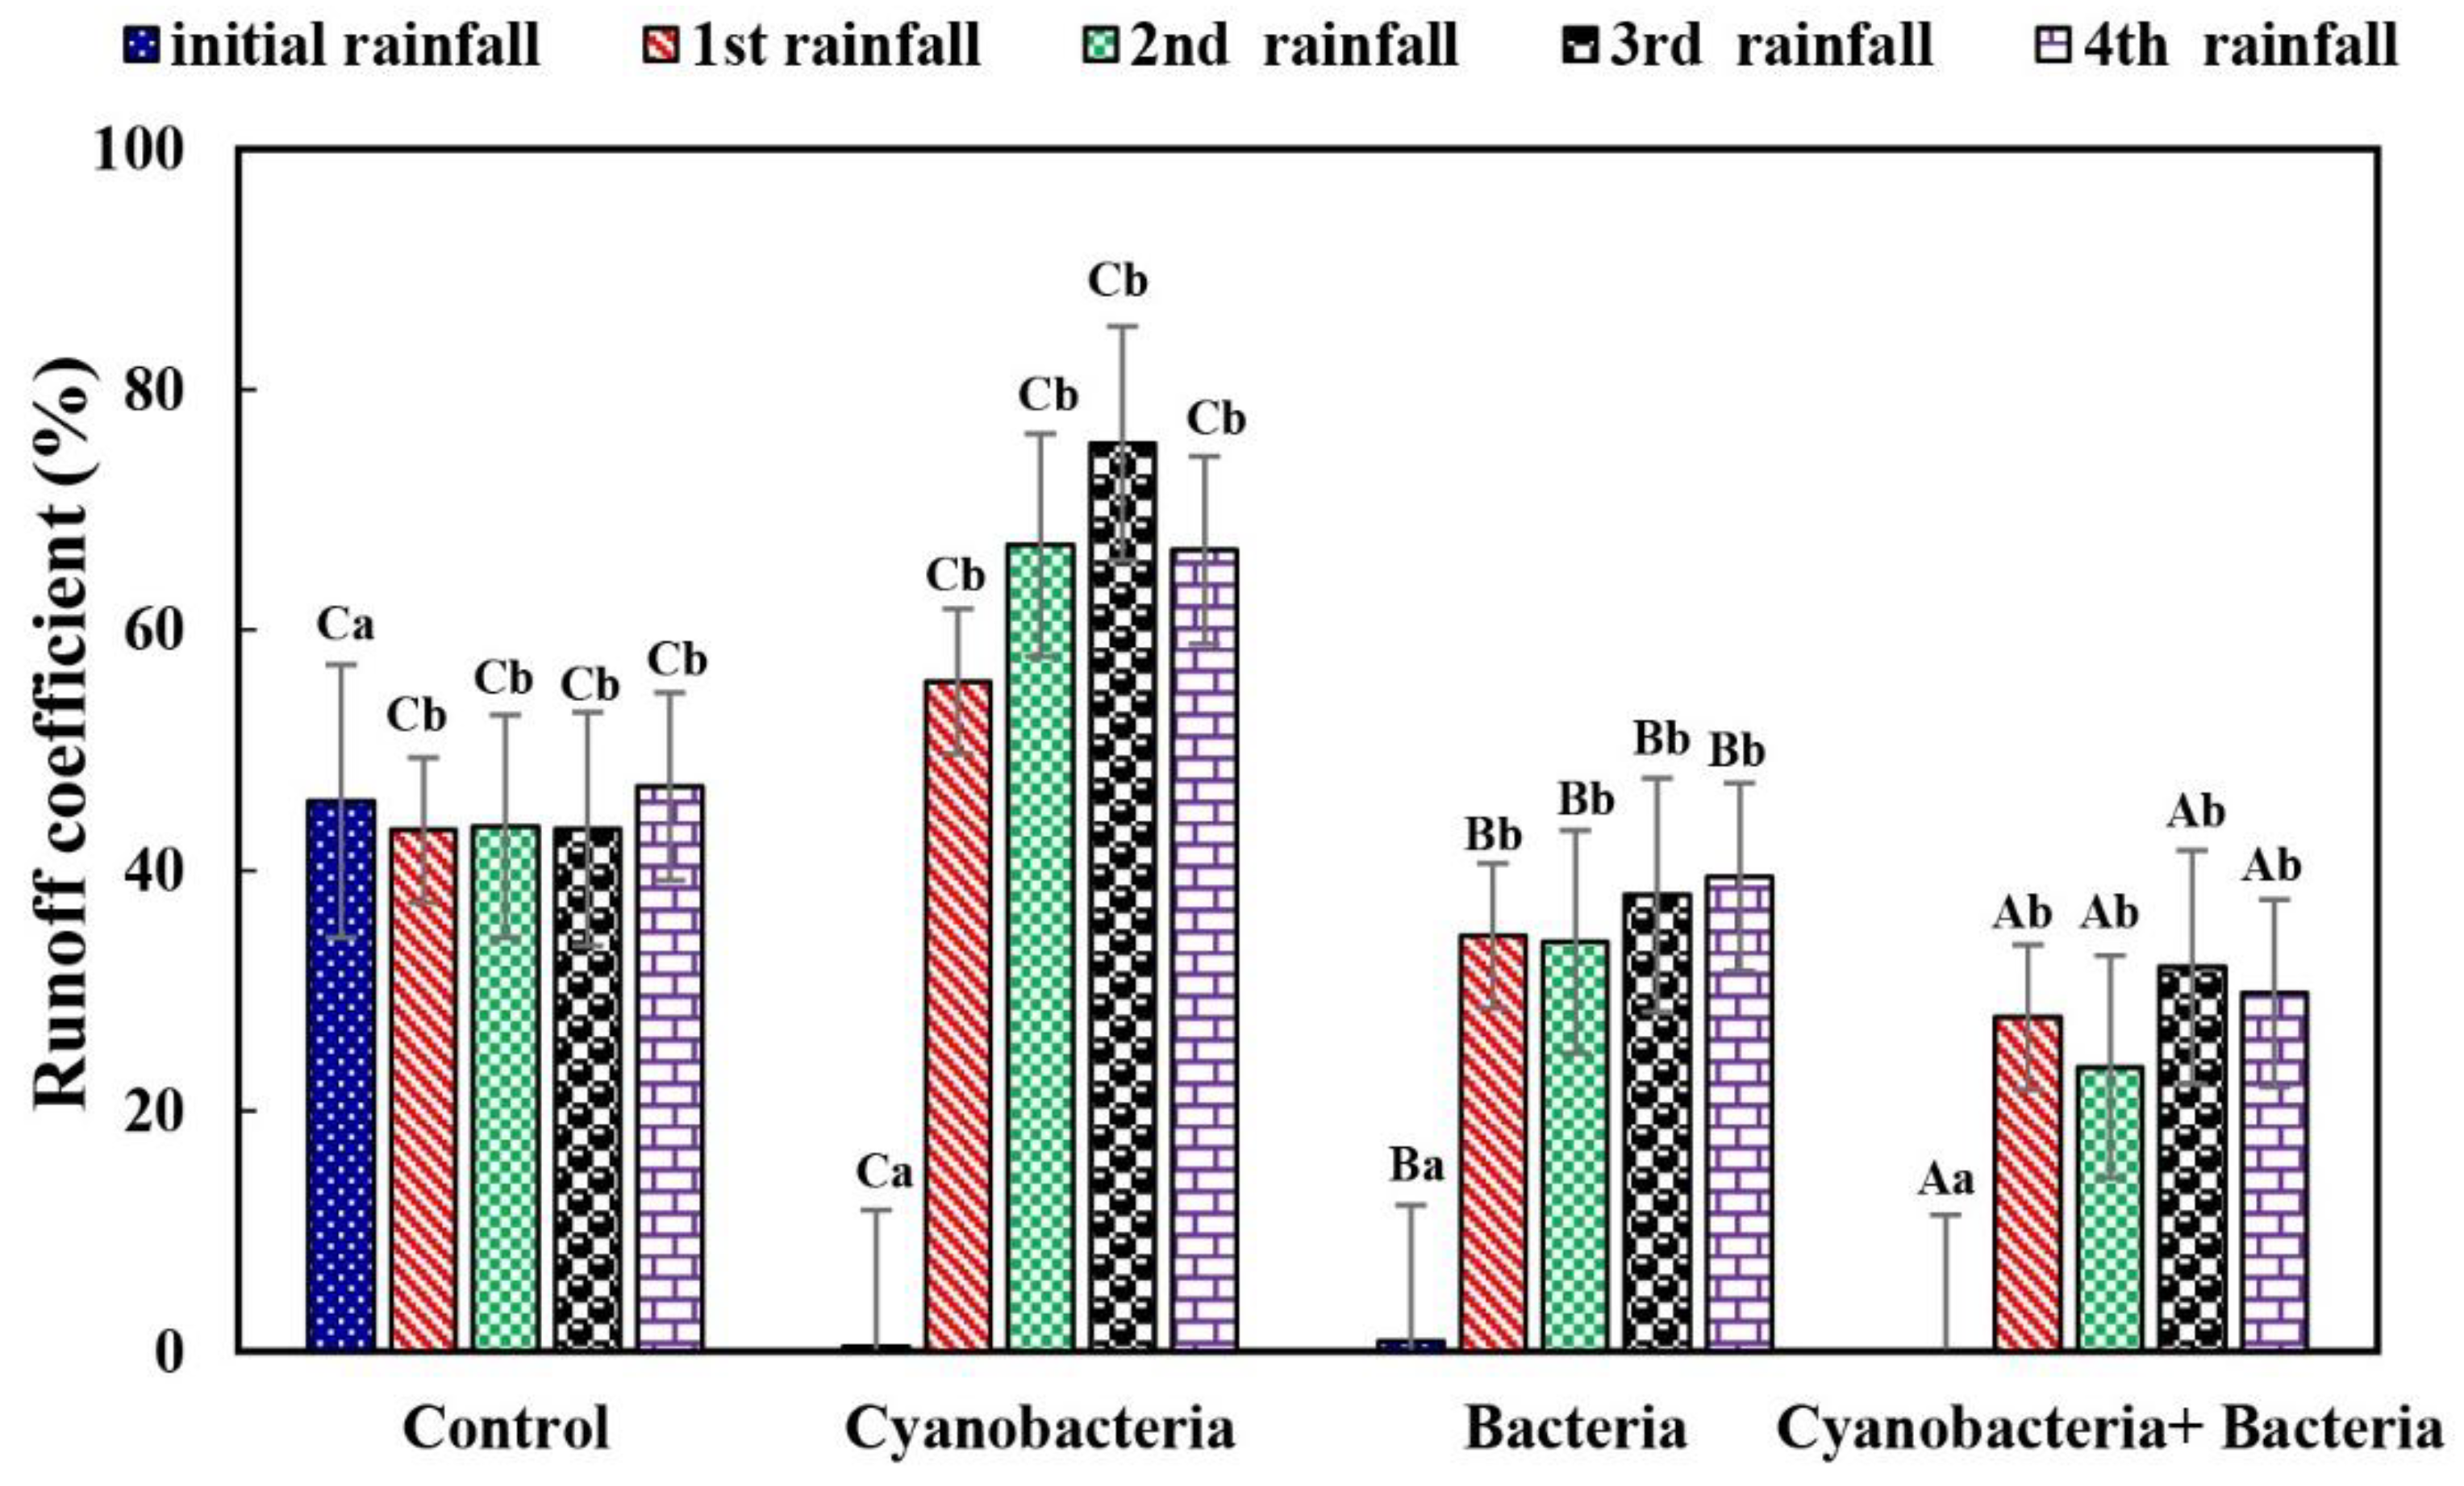
3.2. Runoff Coefficient
3.3. Infiltration and Seepage Water
4. Discussion
4.1. Runoff Volume
4.2. Runoff Coefficient
4.3. Infiltration and Seepage Water
5. Conclusions
- Each soil microorganism inoculation treatment regulated the rilling process during the first rainfall event, finally abolishing runoff-generating circumstances.
- After rill formation and flow linearization, the cyanobacterial treatment had no significant effect compared to the control treatment.
- The bacterial and combined cyanobacteria and bacteria treatments were influential and significant in controlling runoff components to rill erosion in successive rainfalls.
- Using soil microorganisms is an efficient biological strategy for providing crucial ecosystem services, including recharging groundwater and ensuring water safety while enhancing ecosystem restoration in erosion-prone locations.
Author Contributions
Funding
Institutional Review Board Statement
Informed Consent Statement
Data Availability Statement
Acknowledgments
Conflicts of Interest
References
- Vaezi, A.R.; Hasanzadeh, H.; Cerdà, A. Developing an erodibility triangle for soil textures in semi-arid regions, NW Iran. Catena 2016, 142, 221–232. [Google Scholar] [CrossRef]
- Rossi, F.; Mugnai, G.; De Philippis, R. Complex role of the polymeric matrix in biological soil crusts. Plant Soil 2018, 429, 19–34. [Google Scholar] [CrossRef]
- Sadeghi, S.H.R.; Khazayi, M.; Mirnia, S.K. Effect of soil surface disturbance on overland flow, sediment yield, and nutrient loss in a Hyrcanian deciduous forest stand in Iran. Catena 2022, 218, 106546. [Google Scholar] [CrossRef]
- Gharemahmudli, S.; Sadeghi, S.H.; Najafinejad, A.; Zarei Darki, B.; Kheirfam, H.; Mohammadian Behbahani, A. Changes in overall and inter-variability of runoff and soil loss for a loess soil resulted from a freezing–thawing cycle. Environ. Monit. Assess. 2023, 195, 860. [Google Scholar] [CrossRef]
- Kebede, B.; Tsunekawa, A.; Haregeweyn, N.; Tsubo, M.; Mulualem, T.; Mamedov, A.I.; Meshesha, D.T.; Adgo, E.; Fenta, A.A.; Ebabu, K.; et al. Effect of Polyacrylamide integrated with other soil amendments on runoff and soil loss: Case study from northwest Ethiopia. Int. Soil Water Conserv. Res. 2022, 10, 487–496. [Google Scholar] [CrossRef]
- Chamizo, S.; Cantón, Y.; Lázaro, R.; Solé-Benet, A.; Domingo, F. Crust composition and disturbance drive infiltration through biological soil crusts in semi-arid ecosystems. Ecosystems 2012, 15, 148–161. [Google Scholar] [CrossRef]
- Cantón, Y.; Chamizo, S.; Rodriguez-Caballero, E.; Lázaro, R.; Roncero-Ramos, B.; Román, J.R.; Solé-Benet, A. Water regulation in cyanobacterial biocrusts from drylands: Negative impacts of anthropogenic disturbance. Water 2020, 12, 720. [Google Scholar] [CrossRef]
- Du, L.; Wang, R.; Gao, X.; Hu, Y.; Guo, S. Divergent responses of soil bacterial communities in erosion-deposition plots on the Loess Plateau. Geoderma 2020, 358, 113995. [Google Scholar] [CrossRef]
- Gao, L.; Bowker, M.A.; Sun, H.; Zhao, J.; Zhao, Y. Linkages between biocrust development and water erosion and implications for erosion model implementation. Geoderma 2020, 357, 113973. [Google Scholar] [CrossRef]
- Gao, L.; Sun, H.; Xu, M.; Zhao, Y. Biocrusts resist runoff erosion through direct physical protection and indirect modification of soil properties. J. Soils Sediments 2020, 20, 133–142. [Google Scholar] [CrossRef]
- Jafarpoor, A.; Sadeghi, S.H.R.; Zarei-Darki, B.; Homaee, M. Changes in Morphologic, Hydraulic, and Hydrodynamic Properties of Rill Erosion due to Surface Inoculation of Endemic Soil Cyanobacteria. Catena 2022, 208, 105782. [Google Scholar] [CrossRef]
- Jafarpoor, A.; Sadeghi, S.H.R.; Zarei-Darki, B.; Homaee, M. Changes in hydrologic components from a mid-sized plots induced by rill erosion due to cyanobacterization. Int. Soil Water Conserv. Res. 2022, 10, 143–148. [Google Scholar] [CrossRef]
- Lázaro, R.; Gascón, C.; Rubio, C. Runoff and soil loss in biocrusts and physical crusts from the Tabernas Desert (southeast Spain) according to rainfall intensity. Front. Microbiol. 2023, 14, 1171096. [Google Scholar] [CrossRef]
- Shen, H.; Zheng, F.; Zhang, X.C.; Qin, C. Rill network development on loessial hillslopes in China. Earth Surf. Process. Land. 2020, 45, 3178–3184. [Google Scholar] [CrossRef]
- Ou, X.; Hu, Y.; Li, X.; Guo, S.; Liu, B. Advancements and challenges in rill formation, morphology, measurement and modeling. Catena 2021, 196, 104932. [Google Scholar] [CrossRef]
- Greenwood, P.; Zhang, Y. Comparing grain size composition of inter-rill and rill-eroded sediment from cultivated hillslope soils using caesium-134 and cobalt-60 as tracers. Soil Tillage Res. 2020, 198, 104532. [Google Scholar] [CrossRef]
- Jiang, Y.; Shi, H.; Wen, Z.; Guo, M.; Zhao, J.; Cao, X.; Fan, Y.; Zheng, C. The dynamic process of slope rill erosion analyzed with a digital close-range photogrammetry observation system under laboratory conditions. Geomorphology 2020, 350, 106893. [Google Scholar] [CrossRef]
- Zhang, J.; Zhou, L.; Huang, D. Development of rill erosion on bare sloping farmland under natural rainfall conditions. Environ. Earth Sci. 2022, 81, 264. [Google Scholar] [CrossRef]
- Shen, H.; Zheng, F.; Wen, L.; Lu, J.; Jiang, Y. An experimental study of rill erosion and morphology. Geomorphology 2015, 231, 193–201. [Google Scholar] [CrossRef]
- Wang, Y.; You, W.; Fan, J.; Jin, M.; Wei, X.; Wang, Q. Effects of subsequent rainfall events with different intensities on runoff and erosion in a coarse soil. Catena 2018, 170, 100–107. [Google Scholar] [CrossRef]
- Treppiedi, D.; Cipolla, G.; Francipane, A.; Cannarozzo, M.; Valerio Noto, L. Investigating the reliability of stationary design rainfall in a Mediterranean Region under a changing climate. Water 2023, 15, 2245. [Google Scholar] [CrossRef]
- Govers, G.; Gimenez, R.; Oost, W.K. Rill erosion: Exploring the relationship between experiments modelling and field observations. Earth-Sci. Rev. 2007, 84, 87–102. [Google Scholar] [CrossRef]
- Guo, T.; Wang, Q.; Li, D.; Zhuang, J. Effect of surface stone cover on sediment and solute transport on the slope of fallow land in the semi-arid loess region of northwestern China. J. Soils Sediments 2010, 10, 1200–1208. [Google Scholar] [CrossRef]
- Wirtz, S.; Seeger, M.; Remke, A.; Wengel, R.; Wagner, J.F.; Ries, J.B. Do deterministic sediment detachment and transport equations adequately represent the process-interactions in eroding rills? An experimental field study. Catena 2013, 101, 61–78. [Google Scholar] [CrossRef]
- Zhang, Q.; Dong, Y.; Li, F.; Zhang, A.; Lei, T. Quantifying detachment rate of eroding rill or ephemeral gully for WEPP with flume experiments. J. Hydrol. 2014, 519, 2012–2019. [Google Scholar] [CrossRef]
- He, J.J.; Sun, L.Y.; Gong, H.L.; Cai, Q.G. Comparison of rill flow velocity regimes between developing and stationary rills. Catena 2018, 167, 13–17. [Google Scholar] [CrossRef]
- Sun, L.; Wu, S.; Zhang, B.; Lei, Q. Development of rill erosion and its simulation with Cellular Automata-Rill model in Chinese Loess Plateau. Arch. Agron. Soil Sci. 2022, 68, 823–837. [Google Scholar] [CrossRef]
- Erpul, G.; Canga, M.R. Effect of subsequent simulated rainfalls on runoff and erosion. Agric. For. 1999, 23, 659–665. Available online: https://journals.tubitak.gov.tr/agriculture/vol23/iss6/15 (accessed on 1 August 2023).
- Sadeghi, S.H.R.; Sharifi Moghadam, E.; Khaledi Darvishan, A. Effects of subsequent rainfall events on runoff and soil erosion components from small plots treated by vinasse. Catena 2016, 138, 1–12. [Google Scholar] [CrossRef]
- Sadeghi, S.H.R.; Ashgevar Heydari, M.; Jafarpoor, A. Inhibitability of soil loss and sediment concentration during consecutive rainfalls from experimental plots treated by endemic microorganisms. Int. J. Sediment. Res. 2023, 38, 446–454. [Google Scholar] [CrossRef]
- Bajracharya, R.M.; Lal, R.; Hall, G.F. Temporal variation in properties of an uncropped, ploughed Miamian soil in relation to seasonal erodibility. Hydrol. Process. 1998, 12, 1021–1030. [Google Scholar] [CrossRef]
- Weston, D.D.; Lentz, R.D.; Cahn, M.D.; Ogle, R.S.; Rother, A.K.; Lydy, M.J. Toxicity of anionic polyacrylamide formulations when used for erosion control in agriculture. Technical reports: Surface water quality. J. Environ. Qual. 2009, 38, 238–247. [Google Scholar] [CrossRef] [PubMed]
- Jiang, T.; Teng, L.; Wei, S.; Deng, L.; Luo, Z.; Chen, Y. Application of polyacrylamide to reduce phosphorus losses from a Chinese purple soil: A laboratory and field investigation. J. Environ. Manag. 2010, 91, 1437–1445. [Google Scholar] [CrossRef] [PubMed]
- Belnap, J.; Wilcox, B.P.; Van Scoyoc, M.W.; Phillips, S.L. Successional stage of biological soil crusts: An accurate indicator of ecohydrological condition. Ecohydrology 2013, 6, 474–482. [Google Scholar] [CrossRef]
- Zeng, Z.X.; Kong, L.W. Effect of wetting–drying–freezing-thawing cycles on the swelling behaviour of the Yanji mudstone. Environ. Earth Sci. 2019, 78, 435. [Google Scholar] [CrossRef]
- Sadeghi, S.H.R.; Najafinejad, A.; Gharemahmudli, S.; Zarei-Darki, B.; Behbahani, A.M.; Kheirfam, H. Reduction in soil loss caused by a freeze-thaw cycle through inoculation of endemic soil microorganisms. Appl. Soil Ecol. 2021, 157, 103770. [Google Scholar] [CrossRef]
- Bowker, M.A.; Reed, S.C.; Maestre, F.T.; Eldridge, D.J. Biocrusts: The living skin of the earth. Plant Soil 2018, 429, 1–7. [Google Scholar] [CrossRef]
- Xiao, B.; Sun, F.; Hu, K.; Kidron, G.J. Biocrusts reduce surface soil infiltrability and impede soil water infiltration under tension and ponding conditions in dryland ecosystem. J. Hydrol. 2019, 568, 792–802. [Google Scholar] [CrossRef]
- Bullard, J.E.; Ockelford, A.; Strong, C.; Aubault, H. Effects of cyanobacterial soil crusts on surface roughness and splash erosion. J. Geophys. Res. Biogeosci. 2018, 123, 3697–3712. [Google Scholar] [CrossRef]
- Roncero-Ramos, B.; Muñoz-Martín, M.Á.; Chamizo, S.; Fernández-Valbuena, L.; Mendoza, D.; Perona, E.; Cantón, Y.; Mateo, P. Polyphasic evaluation of key cyanobacteria in biocrusts from the most arid region in Europe. PeerJ 2019, 7, e6169. [Google Scholar] [CrossRef]
- Román, J.R.; Roncero-Ramos, B.; Rodríguez-Caballero, E.; Chamizo, S.; Cantón, Y. Effect of water availability on induced cyanobacterial biocrust development. Catena 2021, 197, 104988. [Google Scholar] [CrossRef]
- Maestre, F.T.; Solé, R.; Singh, B.K. Microbial biotechnology as a tool to restore degraded drylands. Microb. Biotechnol. 2017, 10, 1250–1253. [Google Scholar] [CrossRef] [PubMed]
- Sadeghi, S.H.R.; Jafarpoor, A.; Homaee, M.; Darki, B.Z. Changeability of rill erosion properties due to microorganism inoculation. Catena 2023, 223, 106956. [Google Scholar] [CrossRef]
- Chamizo, S.; Mugnai, G.; Rossi, F.R.; Certini, G.; De Philippis, R. Cyanobacteria inoculation improves soil stability and fertility on different textured soils gaining insights for applicability in soil restoration. Front. Environ. Sci. 2018, 6, 49. [Google Scholar] [CrossRef]
- Gharemahmudli, S.; Sadeghi, S.H.R.; Sadeghi, V.S.; Najafinejad, A.; Jafarpoor, A. Morphometrical analysis of cracks and crevices on a cyanobacterized soil surface subjected to a freeze-thaw cycle using image processing. Catena 2022, 213, 106150. [Google Scholar] [CrossRef]
- Liang, C.; Schimel, J.P.; Jastrow, J.D. The importance of anabolism in microbial control over soil carbon storage. Nat. Microbiol. 2017, 2, 17105. [Google Scholar] [CrossRef]
- Andersen, R.A. Algal Culturing Techniques; Elsevier Academic Press: London, UK, 2005; 578p. [Google Scholar]
- Whitton, B.A.; Potts, M. Introduction to the Cyanobacteria. In Ecology of Cyanobacteria II; Springer: Dordrecht, The Netherlands, 2012; pp. 1–13. [Google Scholar]
- Parthiban, J.; Jambulingam, R. Enhancing the Biodiesel Production Potential of Synechococcus elongatus and Anabaena Cyanobacterial Strain Isolated from Saline Water Using Different Media Composition and Organic Carbon Sources. Sustainability 2023, 15, 870. [Google Scholar] [CrossRef]
- Kiani-Harchegani, M.; Sadeghi, S.H.; Singh, V.P.; Asadi, H.; Abedi, M. Effect of rainfall intensity and slope on sediment particle size distribution during erosion using partial eta squared. Catena 2019, 176, 65–72. [Google Scholar] [CrossRef]
- Niu, Y.; Gao, Z.; Li, Y.; Lou, Y.; Zhang, S.; Zhang, L.; Jie, D.; Zhang, X.; Luo, K. Characteristics of rill erosion in spoil heaps under simulated inflow: A field runoff plot experiment. Soil Tillage Res. 2020, 202, 104655. [Google Scholar] [CrossRef]
- Zhao, Y.; Wang, H.; Chen, X.; Fu, Y. Effect of Rainfall on Soil Aggregate Breakdown and Transportation on Cultivated Land in the Black Soil Region of Northeast China. Sustainability 2022, 14, 11028. [Google Scholar] [CrossRef]
- Chamizo, S.; Rodríguez-Caballero, E.; Román, J.R.; Cantón, Y. Effects of biocrust on soil erosion and organic carbon losses under natural rainfall. Catena 2017, 148, 117–125. [Google Scholar] [CrossRef]
- Montenegro, A.D.A.; Abrantes, J.R.C.B.; De Lima, J.L.M.P.; Singh, V.P.; Santos, T.E.M. Impact of mulching on soil and water dynamics under intermittent simulated rainfall. Catena 2013, 109, 139–149. [Google Scholar] [CrossRef]
- Yin, X.; Zhao, L.; Ding, G.; Fang, Q.; Zi, R.; Fang, F.; Yang, X. Effects of Biochar Amendment on Surface-Underground Runoff and Soil Loss on Karst Slopes. SSRN 2023, 4541330. [Google Scholar] [CrossRef]


| Treatment | Source | ||||
|---|---|---|---|---|---|
| Runoff volume (L) | Rainfall | 4 | 14,547.32 | 15.50 | 0.00 |
| Treatment | 3 | 16,361.16 | 17.43 | 0.00 | |
| Treatment × Rainfall | 12 | 2807.26 | 2.99 | 0.01 | |
| Runoff coefficient (%) | Rainfall | 4 | 2058.99 | 12.93 | 0.00 |
| Treatment | 3 | 7700.87 | 48.37 | 0.00 | |
| Treatment × Rainfall | 12 | 531.57 | 3.34 | 0.00 | |
| Infiltration water (L) | Rainfall | 4 | 3.329 | 5.25 | 0.00 |
| Treatment | 3 | 3.481 | 5.49 | 0.00 | |
| Treatment × Rainfall | 12 | 0.824 | 1.30 | 0.257 | |
| Seepage water (L) | Rainfall | 4 | 4013.90 | 9.23 | 0.00 |
| Treatment | 3 | 55,165.53 | 126.81 | 0.00 | |
| Treatment × Rainfall | 12 | 199.62 | 0.46 | 0.88 |
| Rainfall Event | Plot Number | Control | Cyanobacteria | Bacteria | Cyanobacteria + Bacteria |
|---|---|---|---|---|---|
| Initial rainfall | 1 | 0.00 | 0.00 | 17.00 | 17.92 |
| 2 | 0.00 | 0.00 | 15.28 | 15.60 | |
| 3 | 0.00 | 0.00 | 14.13 | 18.47 | |
| Mean | 0.00 | 0.00 | 15.47 | 17.33 | |
| SD | 0.00 | 0.00 | 1.44 | 1.52 | |
| CV (%) | 0.00 | 0.00 | 9.34 | 8.79 | |
| 1st rainfall | 1 | 0.00 | 2.00 | 1.33 | 3.33 |
| 2 | 0.00 | 5.00 | 1.90 | 2.33 | |
| 3 | 0.00 | 6.00 | 2.75 | 2.95 | |
| Mean | 0.00 | 4.33 | 1.99 | 2.87 | |
| SD | 0.00 | 2.08 | 0.71 | 0.50 | |
| CV (%) | 0.00 | 48.04 | 35.85 | 17.59 | |
| 2nd rainfall | 1 | 2.00 | 2.42 | 2.00 | 1.78 |
| 2 | 5.00 | 5.00 | 1.92 | 2.50 | |
| 3 | 2.00 | 2.83 | 3.25 | 2.00 | |
| Mean | 3.00 | 3.42 | 2.39 | 2.09 | |
| SD | 1.73 | 1.39 | 0.75 | 0.37 | |
| CV (%) | 57.74 | 40.58 | 31.21 | 17.63 | |
| 3rd rainfall | 1 | 1.00 | 1.33 | 1.42 | 1.58 |
| 2 | 5.00 | 8.33 | 2.33 | 2.10 | |
| 3 | 4.00 | 4.17 | 1.83 | 1.50 | |
| Mean | 3.33 | 4.61 | 1.86 | 1.73 | |
| SD | 2.08 | 3.52 | 0.46 | 0.33 | |
| CV (%) | 62.45 | 76.37 | 24.50 | 18.87 | |
| 4th rainfall | 1 | 1.8 | 1.80 | 0.33 | 0.87 |
| 2 | 2.00 | 2.47 | 2.17 | 0.57 | |
| 3 | 2.60 | 2.68 | 1.33 | 1.48 | |
| Mean | 2.13 | 2.32 | 1.28 | 0.97 | |
| SD | 0.42 | 0.46 | 0.92 | 0.46 | |
| CV (%) | 19.52 | 19.84 | 72.15 | 47.64 |
| Rainfall Event | Plot Number | Entrance (L) | Runoff | Seepage Water | The Remaining Water in the Plot from the Current Rainfall | The Water in the Plot from the Previous Rainfall | |||
|---|---|---|---|---|---|---|---|---|---|
| Volume (L) | Ratio (%) | Volume (L) | Ratio (%) | Volume (L) | Ratio (%) | Volume (L) | |||
| Initial rainfall | 1 | 239.60 | 129.56 | 54.07 | 0.00 | 0.00 | 110.04 | 45.93 | 0.00 |
| 2 | 240.41 | 111.76 | 46.49 | 0.00 | 0.00 | 128.65 | 53.51 | 0.00 | |
| 3 | 234.25 | 85.98 | 36.70 | 0.00 | 0.00 | 148.27 | 63.30 | 0.00 | |
| Mean | 238.09 | 109.10 | 45.76 | 0.00 | 0.00 | 128.99 | 54.24 | 0.00 | |
| SD | 3.35 | 21.91 | 8.71 | 0.00 | 0.00 | 19.12 | 8.71 | 0.00 | |
| CV (%) | 1.41 | 20.08 | 19.03 | 0.00 | 0.00 | 14.82 | 16.05 | 0.00 | |
| 1st rainfall | 1 | 239.22 | 111.75 | 46.71 | 0.00 | 0.00 | 127.47 | 53.29 | 110.04 |
| 2 | 236.86 | 111.45 | 47.05 | 0.00 | 0.00 | 125.41 | 52.95 | 128.65 | |
| 3 | 238.89 | 86.85 | 36.24 | 0.00 | 0.00 | 152.31 | 63.76 | 148.27 | |
| Mean | 238.32 | 103.26 | 43.34 | 0.00 | 0.00 | 135.06 | 56.66 | 128.99 | |
| SD | 1.28 | 14.45 | 6.15 | 0.00 | 0.00 | 14.97 | 6.15 | 19.12 | |
| CV (%) | 0.54 | 13.99 | 14.18 | 0.00 | 0.00 | 11.08 | 10.85 | 14.82 | |
| 2nd rainfall | 1 | 236.59 | 146.61 | 61.97 | 55.00 | 23.25 | 34.98 | 14.79 | 237.51 |
| 2 | 238.79 | 85.95 | 35.99 | 73.40 | 30.74 | 79.44 | 33.27 | 254.06 | |
| 3 | 239.74 | 79.14 | 33.01 | 113.80 | 47.47 | 46.80 | 19.52 | 300.58 | |
| Mean | 238.37 | 103.90 | 43.66 | 80.73 | 33.82 | 53.74 | 22.52 | 264.05 | |
| SD | 1.62 | 37.14 | 15.93 | 30.08 | 12.40 | 23.03 | 9.60 | 32.70 | |
| CV (%) | 0.68 | 35.75 | 36.48 | 37.26 | 36.67 | 42.85 | 42.62 | 12.38 | |
| 3rd rainfall | 1 | 236.88 | 169.83 | 71.69 | 77.50 | 32.72 | −10.45 | −4.41 | 272.49 |
| 2 | 240.79 | 61.49 | 25.54 | 87.00 | 36.13 | 92.30 | 38.33 | 333.50 | |
| 3 | 239.46 | 79.27 | 33.10 | 80.00 | 33.41 | 80.19 | 33.49 | 347.38 | |
| Mean | 239.04 | 103.53 | 43.44 | 8150 | 34.09 | 54.01 | 22.74 | 317.79 | |
| SD | 1.99 | 58.10 | 24.76 | 4.92 | 1.80 | 56.15 | 23.41 | 39.84 | |
| CV (%) | 0.83 | 56.12 | 56.98 | 6.04 | 5.30 | 103.96 | 104.16 | 12.54 | |
| 4th rainfall | 1 | 236.26 | 181.21 | 76.70 | 45.01 | 19.05 | 10.04 | 4.25 | 262.04 |
| 2 | 233.78 | 61.95 | 26.50 | 72.00 | 30.80 | 99.83 | 42.70 | 425.80 | |
| 3 | 238.65 | 90.03 | 37.72 | 97.60 | 40.90 | 51.02 | 21.38 | 427.57 | |
| Mean | 236.23 | 111.06 | 46.97 | 71.54 | 30.25 | 53.63 | 22.78 | 371.80 | |
| SD | 2.44 | 62.35 | 26.35 | 26.30 | 10.93 | 44.95 | 19.26 | 95.06 | |
| CV (%) | 1.03 | 56.14 | 56.09 | 36.76 | 36.14 | 83.82 | 84.58 | 25.57 | |
| Rainfall Event | Plot Number | Entrance (L) | Runoff | Seepage Water | The Remaining Water in the Plot from the Current Rainfall | The Water in the Plot from the Previous Rainfall | |||
|---|---|---|---|---|---|---|---|---|---|
| Volume (L) | Ratio (%) | Volume (L) | Ratio (%) | Volume (L) | Ratio (%) | Volume (L) | |||
| Initial rainfall | 1 | 143.25 | 1.80 | 1.26 | 94.00 | 25.63 | 202.23 | 55.14 | 0.00 |
| 2 | 143.25 | 0.00 | 0.00 | 97.26 | 24.76 | 220.21 | 56.05 | 0.00 | |
| 3 | 143.25 | 0.00 | 0.00 | 105.00 | 26.28 | 251.22 | 62.78 | 0.00 | |
| Mean | 143.25 | 0.60 | 0.42 | 98.75 | 25.55 | 224.55 | 58.02 | 0.00 | |
| SD | 0.00 | 1.04 | 0.73 | 5.65 | 0.76 | 24.78 | 4.23 | 0.00 | |
| CV (%) | 0.00 | 173.21 | 173.21 | 5.72 | 2.99 | 11.04 | 7.29 | 0.00 | |
| 1st rainfall | 1 | 236.98 | 161.59 | 68.19 | 75.00 | 31.65 | 0.39 | 0.16 | 202.23 |
| 2 | 238.31 | 144.08 | 60.46 | 55.47 | 32.28 | 38.76 | 16.26 | 220.21 | |
| 3 | 241.85 | 93.10 | 38.49 | 79.70 | 32.95 | 69.05 | 28.55 | 251.22 | |
| Mean | 239.05 | 132.92 | 55.71 | 70.06 | 29.29 | 36.07 | 14.99 | 224.55 | |
| SD | 2.52 | 35.58 | 15.40 | 12.85 | 5.25 | 34.41 | 14.24 | 24.78 | |
| CV (%) | 1.05 | 26.77 | 27.65 | 18.34 | 17.93 | 95.40 | 94.95 | 11.04 | |
| 2nd rainfall | 1 | 238.03 | 181.98 | 76.45 | 60.38 | 25.37 | −4.33 | −1.82 | 202.62 |
| 2 | 236.74 | 180.58 | 76.28 | 66.80 | 28.22 | −10.64 | −4.49 | 258.97 | |
| 3 | 238.50 | 115.40 | 48.39 | 77.60 | 32.54 | 45.50 | 19.08 | 320.27 | |
| Mean | 237.76 | 159.32 | 67.04 | 68.26 | 28.71 | 10.18 | 4.25 | 260.62 | |
| SD | 0.91 | 38.04 | 16.15 | 8.70 | 3.61 | 30.75 | 12.91 | 58.84 | |
| CV (%) | 0.38 | 23.88 | 24.10 | 12.75 | 12.58 | 302.15 | 303.35 | 22.58 | |
| 3rd rainfall | 1 | 236.97 | 191.76 | 80.92 | 66.96 | 28.26 | −21.75 | −9.18 | 198.29 |
| 2 | 237.07 | 198.05 | 83.54 | 69.45 | 29.30 | −30.43 | −12.84 | 248.33 | |
| 3 | 239.22 | 148.46 | 62.06 | 105.00 | 43.89 | −14.24 | −5.95 | 365.77 | |
| Mean | 237.75 | 179.42 | 75.51 | 80.47 | 33.81 | −22.14 | −9.32 | 270.80 | |
| SD | 1.27 | 27.00 | 11.72 | 21.28 | 8.74 | 8.10 | 3.44 | 85.97 | |
| CV (%) | 0.53 | 15.05 | 15.52 | 26.44 | 25.86 | −36.59 | −36.94 | 31.75 | |
| 4th rainfall | 1 | 236.74 | 161.18 | 68.08 | 99.00 | 41.82 | −23.44 | −9.90 | 189.11 |
| 2 | 238.41 | 164.19 | 68.87 | 83.00 | 34.81 | −8.78 | −3.68 | 235.49 | |
| 3 | 237.69 | 149.43 | 62.87 | 65.00 | 27.35 | 23.26 | 9.79 | 359.82 | |
| Mean | 237.61 | 158.27 | 66.61 | 82.33 | 34.66 | −2.99 | −1.27 | 261.47 | |
| SD | 0.84 | 7.80 | 3.26 | 17.01 | 7.24 | 23.88 | 10.06 | 88.27 | |
| CV (%) | 0.35 | 4.93 | 4.90 | 20.66 | 20.88 | −799.65 | −794.90 | 33.76 | |
| Rainfall Event | Plot Number | Entrance (L) | Runoff | Seepage Water | The Remaining Water in the Plot from the Current Rainfall | The Water in the Plot from the Previous Rainfall | |||
|---|---|---|---|---|---|---|---|---|---|
| Volume (L) | Ratio (%) | Volume (L) | Ratio (%) | Volume (L) | Ratio (%) | Volume (L) | |||
| Initial rainfall | 1 | 143.25 | 0.00 | 0.00 | 340.00 | 53.74 | 292.68 | 46.26 | 0.00 |
| 2 | 143.25 | 111.76 | 46.49 | 180.00 | 49.44 | 180.52 | 49.58 | 0.00 | |
| 3 | 143.25 | 85.98 | 36.70 | 85.00 | 22.19 | 298.09 | 77.81 | 0.00 | |
| Mean | 143.25 | 109.10 | 45.76 | 0.00 | 41.79 | 257.10 | 57.88 | 0.00 | |
| SD | 0.00 | 21.91 | 8.71 | 0.00 | 17.11 | 66.37 | 17.34 | 0.00 | |
| CV (%) | 0.00 | 20.08 | 19.03 | 0.00 | 40.95 | 25.82 | 29.95 | 0.00 | |
| 1st rainfall | 1 | 236.64 | 55.01 | 23.25 | 165.00 | 69.73 | 16.63 | 7.03 | 292.68 |
| 2 | 235.78 | 130.13 | 55.19 | 95.00 | 40.29 | 10.65 | 4.52 | 180.52 | |
| 3 | 238.79 | 60.24 | 25.23 | 165.00 | 69.10 | 13.55 | 5.67 | 298.09 | |
| Mean | 237.07 | 81.79 | 34.55 | 141.67 | 59.71 | 13.61 | 5.74 | 251.10 | |
| SD | 1.55 | 41.94 | 17.90 | 40.41 | 16.82 | 2.99 | 1.26 | 66.37 | |
| CV (%) | 0.65 | 51.28 | 51.80 | 28.53 | 28.16 | 21.97 | 21.89 | 25.82 | |
| 2nd rainfall | 1 | 237.64 | 73.12 | 30.77 | 184.00 | 77.43 | −19.48 | −8.20 | 309.31 |
| 2 | 236.83 | 100.61 | 42.48 | 125.00 | 52.78 | 11.22 | 4.74 | 191.17 | |
| 3 | 238.17 | 68.93 | 28.94 | 94.00 | 39.47 | 75.24 | 31.59 | 311.64 | |
| Mean | 237.55 | 80.89 | 34.06 | 134.33 | 56.56 | 22.33 | 9.38 | 270.71 | |
| SD | 0.67 | 17.21 | 7.35 | 45.72 | 19.26 | 48.33 | 20.30 | 68.89 | |
| CV (%) | 0.28 | 21.28 | 21.57 | 34.03 | 34.05 | 216.45 | 216.44 | 25.45 | |
| 3rd rainfall | 1 | 238.17 | 64.24 | 26.97 | 141.00 | 59.20 | 32.93 | 13.83 | 289.83 |
| 2 | 236.83 | 118.46 | 50.02 | 168.00 | 70.94 | −49.63 | −20.96 | 202.39 | |
| 3 | 238.88 | 88.04 | 36.86 | 118.00 | 49.40 | 32.84 | 13.75 | 386.88 | |
| Mean | 237.96 | 90.25 | 37.95 | 142.33 | 59.85 | 5.38 | 2.21 | 293.03 | |
| SD | 1.04 | 27.18 | 11.56 | 25.03 | 10.78 | 47.64 | 20.06 | 92.29 | |
| CV (%) | 0.44 | 30.11 | 30.47 | 17.58 | 18.02 | 885.50 | 909.31 | 31.49 | |
| 4th rainfall | 1 | 235.54 | 71.30 | 30.27 | 151.00 | 64.11 | 13.24 | 5.62 | 322.76 |
| 2 | 236.74 | 132.08 | 55.79 | 130.00 | 54.91 | −25.34 | −10.70 | 152.76 | |
| 3 | 238.17 | 76.94 | 32.30 | 90.00 | 37.79 | 71.23 | 29.91 | 419.72 | |
| Mean | 236.82 | 93.44 | 39.46 | 123.67 | 52.27 | 19.71 | 8.27 | 298.41 | |
| SD | 1.32 | 33.58 | 14.18 | 30.99 | 13.36 | 48.61 | 20.44 | 135.14 | |
| CV (%) | 0.56 | 35.94 | 35.95 | 25.06 | 25.56 | 246.62 | 246.95 | 45.28 | |
| Rainfall Event | Plot Number | Entrance (L) | Runoff | Seepage Water | The Remaining Water in the Plot from the Current Rainfall | The Water in the Plot from the Previous Rainfall | |||
|---|---|---|---|---|---|---|---|---|---|
| Volume (L) | Ratio (%) | Volume (L) | Ratio (%) | Volume (L) | Ratio (%) | Volume (L) | |||
| Initial rainfall | 1 | 143.25 | 0.00 | 0.00 | 529.00 | 85.72 | 81.29 | 13.17 | 0.00 |
| 2 | 143.25 | 0.00 | 0.00 | 534.00 | 93.70 | 5.83 | 1.02 | 0.00 | |
| 3 | 143.25 | 0.00 | 0.00 | 315.00 | 39.82 | 454.39 | 57.44 | 0.00 | |
| Mean | 143.25 | 0.00 | 0.00 | 459.33 | 73.08 | 180.50 | 23.88 | 0.00 | |
| SD | 0.00 | 0.00 | 0.00 | 125.02 | 29.08 | 240.17 | 29.69 | 0.00 | |
| CV (%) | 0.00 | 0.00 | 0.00 | 27.22 | 39.79 | 133.06 | 124.35 | 0.00 | |
| 1st rainfall | 1 | 242.80 | 71.49 | 29.44 | 160.00 | 65.90 | 11.31 | 4.66 | 81.29 |
| 2 | 238.50 | 91.92 | 38.54 | 208.00 | 87.21 | −61.42 | −25.75 | 5.83 | |
| 3 | 238.41 | 36.69 | 15.39 | 122.00 | 51.17 | 79.72 | 33.44 | 454.39 | |
| Mean | 239.90 | 66.70 | 27.79 | 163.33 | 68.09 | 9.87 | 4.11 | 180.50 | |
| SD | 2.51 | 27.92 | 11.66 | 43.10 | 18.12 | 70.58 | 29.60 | 240.17 | |
| CV (%) | 1.05 | 41.87 | 41.97 | 26.39 | 26.61 | 715.11 | 719.37 | 133.06 | |
| 2nd rainfall | 1 | 239.31 | 60.11 | 25.12 | 140.00 | 58.50 | 39.20 | 16.38 | 92.60 |
| 2 | 240.99 | 81.44 | 33.79 | 155.00 | 64.32 | 4.55 | 1.89 | −55.59 | |
| 3 | 239.60 | 28.81 | 12.02 | 110.00 | 45.91 | 100.79 | 42.07 | 534.11 | |
| Mean | 236.97 | 56.79 | 23.65 | 135.00 | 56.24 | 48.18 | 20.11 | 190.37 | |
| SD | 0.90 | 26.47 | 10.96 | 22.91 | 9.41 | 48.74 | 20.35 | 306.77 | |
| CV (%) | 0.37 | 46.62 | 46.35 | 16.97 | 16.73 | 101.17 | 101.17 | 161.14 | |
| 3rd rainfall | 1 | 238.88 | 91.42 | 38.27 | 136.00 | 59.93 | 11.46 | 4.80 | 131.80 |
| 2 | 240.27 | 63.97 | 26.62 | 154.00 | 64.09 | 22.30 | 9.28 | −51.04 | |
| 3 | 236.97 | 73.36 | 30.96 | 88.00 | 37.14 | 75.61 | 31.91 | 634.90 | |
| Mean | 238.71 | 76.25 | 31.95 | 126.00 | 52.72 | 36.46 | 15.33 | 238.55 | |
| SD | 1.66 | 13.95 | 5.89 | 34.12 | 13.96 | 34.34 | 14.53 | 355.21 | |
| CV (%) | 0.69 | 18.30 | 18.42 | 27.08 | 26.49 | 94.19 | 94.8 | 148.90 | |
| 4th rainfall | 1 | 236.35 | 80.88 | 34.22 | 170.00 | 71.93 | −14.53 | −6.15 | 143.26 |
| 2 | 237.88 | 49.40 | 20.77 | 178.00 | 74.83 | 10.48 | 4.41 | −28.74 | |
| 3 | 237.40 | 81.52 | 34.34 | 88.00 | 37.07 | 67.88 | 28.59 | 710.51 | |
| Mean | 237.21 | 70.60 | 29.78 | 145.33 | 61.27 | 21.28 | 8.95 | 275.01 | |
| SD | 0.78 | 18.36 | 7.80 | 49.81 | 21.01 | 42.25 | 17.81 | 386.83 | |
| CV (%) | 0.33 | 26.01 | 26.20 | 34.27 | 34.29 | 198.59 | −198.99 | 140.66 | |
Disclaimer/Publisher’s Note: The statements, opinions and data contained in all publications are solely those of the individual author(s) and contributor(s) and not of MDPI and/or the editor(s). MDPI and/or the editor(s) disclaim responsibility for any injury to people or property resulting from any ideas, methods, instructions or products referred to in the content. |
© 2023 by the authors. Licensee MDPI, Basel, Switzerland. This article is an open access article distributed under the terms and conditions of the Creative Commons Attribution (CC BY) license (https://creativecommons.org/licenses/by/4.0/).
Share and Cite
Ashgevar Heydari, M.; Sadeghi, S.H.; Jafarpoor, A. Hydrological Properties of Rill Erosion on a Soil from a Drought-Prone Area during Successive Rainfalls as a Result of Microorganism Inoculation. Sustainability 2023, 15, 14379. https://doi.org/10.3390/su151914379
Ashgevar Heydari M, Sadeghi SH, Jafarpoor A. Hydrological Properties of Rill Erosion on a Soil from a Drought-Prone Area during Successive Rainfalls as a Result of Microorganism Inoculation. Sustainability. 2023; 15(19):14379. https://doi.org/10.3390/su151914379
Chicago/Turabian StyleAshgevar Heydari, Masumeh, Seyed Hamidreza Sadeghi, and Atefeh Jafarpoor. 2023. "Hydrological Properties of Rill Erosion on a Soil from a Drought-Prone Area during Successive Rainfalls as a Result of Microorganism Inoculation" Sustainability 15, no. 19: 14379. https://doi.org/10.3390/su151914379