
Urban Resilience of Important Node Cities in Population Migration under the Influence of COVID-19 Based on Mamdani Fuzzy Inference System


Abstract
:1. Introduction
- (i)
- How is the resilience of 50INCPM in China in 2020 under the influence of COVID-19?
- (ii)
- In the case of large-scale emergencies, which has stronger resilience, metropolises or small cities?
2. Data Sources and Study Area
2.1. Data Sources
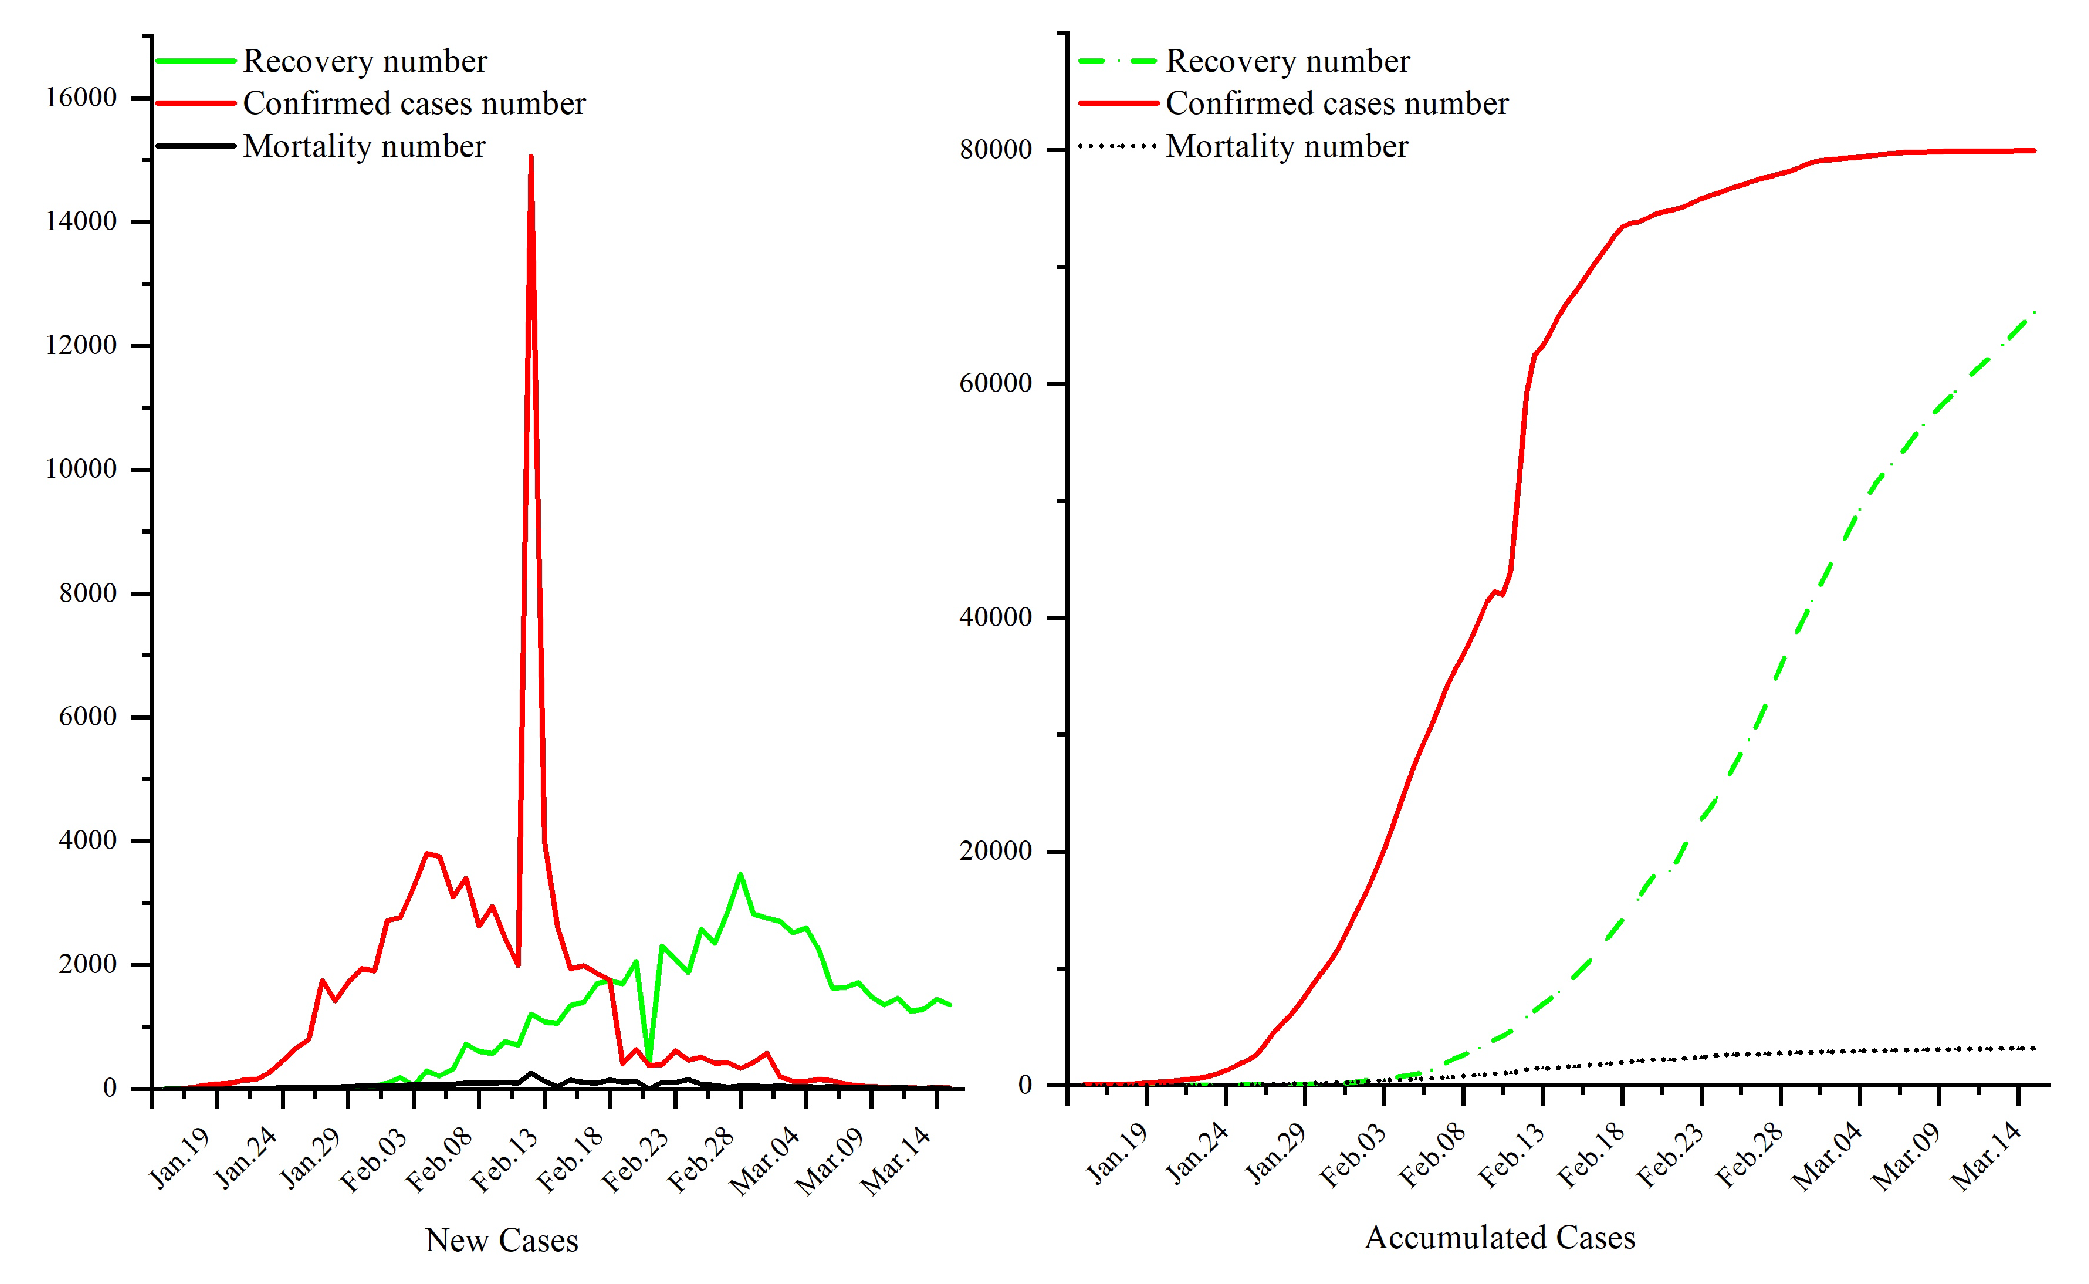
2.2. Study Period Selection
- (1)
- The incubative period: This period is from 15 January to 31 January 2020.
- (2)
- The pandemic period: This period is from 1 February 2020 to 20 February 2020.
- (3)
- The controlled period: This period is from 21 February 2020 to 15 March 2020.
2.3. The Study Area Selection
3. Proposed Method
- The data are collected from big data of the migration of Baidu (http://qianxi.baidu.com (accessed on 9 August 2023) and the National Health Commission of China (http://www.nhc.gov.cn (accessed on 9 August 2023). So, the input parameters PRI, IRI, ORI, GRI, RR, CCN and MR are inevitably inaccurate in the data statistics process, that is, the obtained data have a certain degree of uncertainty. Therefore, it is particularly important and necessary to fuzzify the data. At the same time, it must be mentioned that this fuzzification method was successfully applied in solving problems related to COVID-19, see, for example, the recent works [33,34,35,36,37,38,39,40,41,42,43,44,45,46,47].
- Due to the vast territory of China, there may be some omissions and inconsistent measurement rules when reporting data from different cities. Therefore, the input data we collected may have some slight omissions and inconsistencies. These omissions and inconsistencies generally do not affect the overall description, and can reflect the relevant situation of the economic and social indicators of the corresponding city under the influence of COVID-19. However, in order to balance these slight omissions and inconsistencies, all the crisp inputs are fuzzified into TFNs in our methodology.
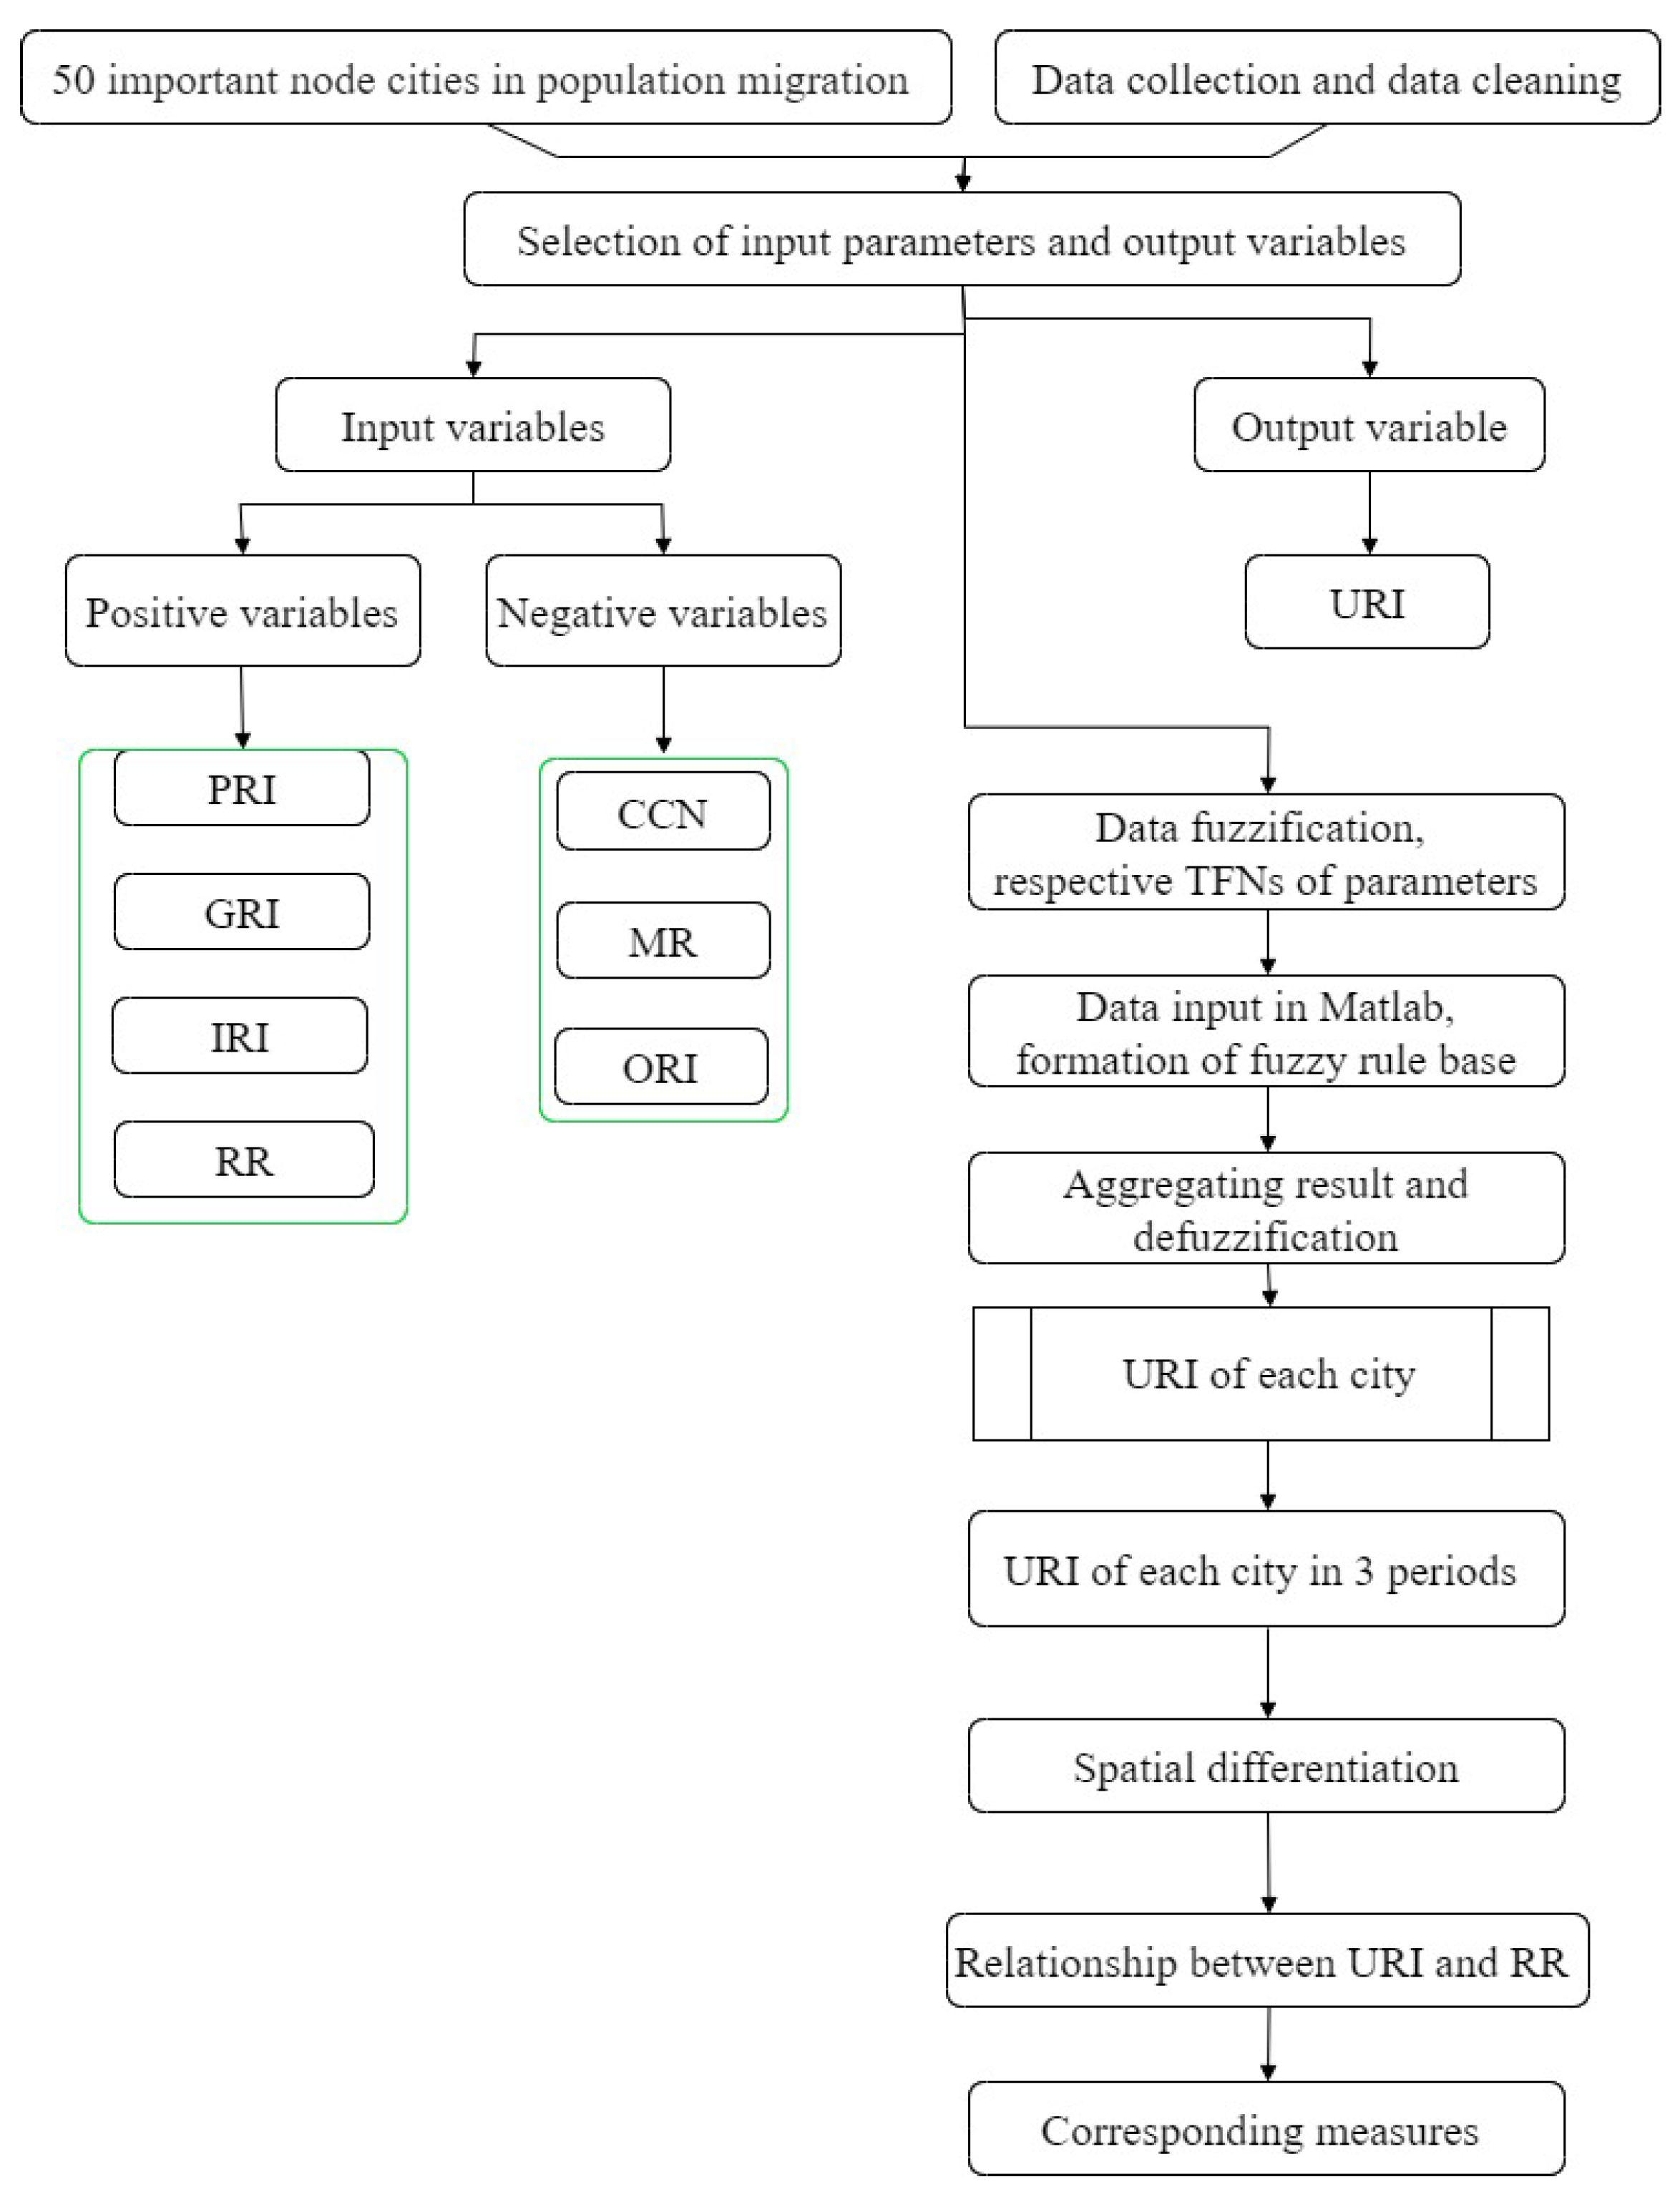
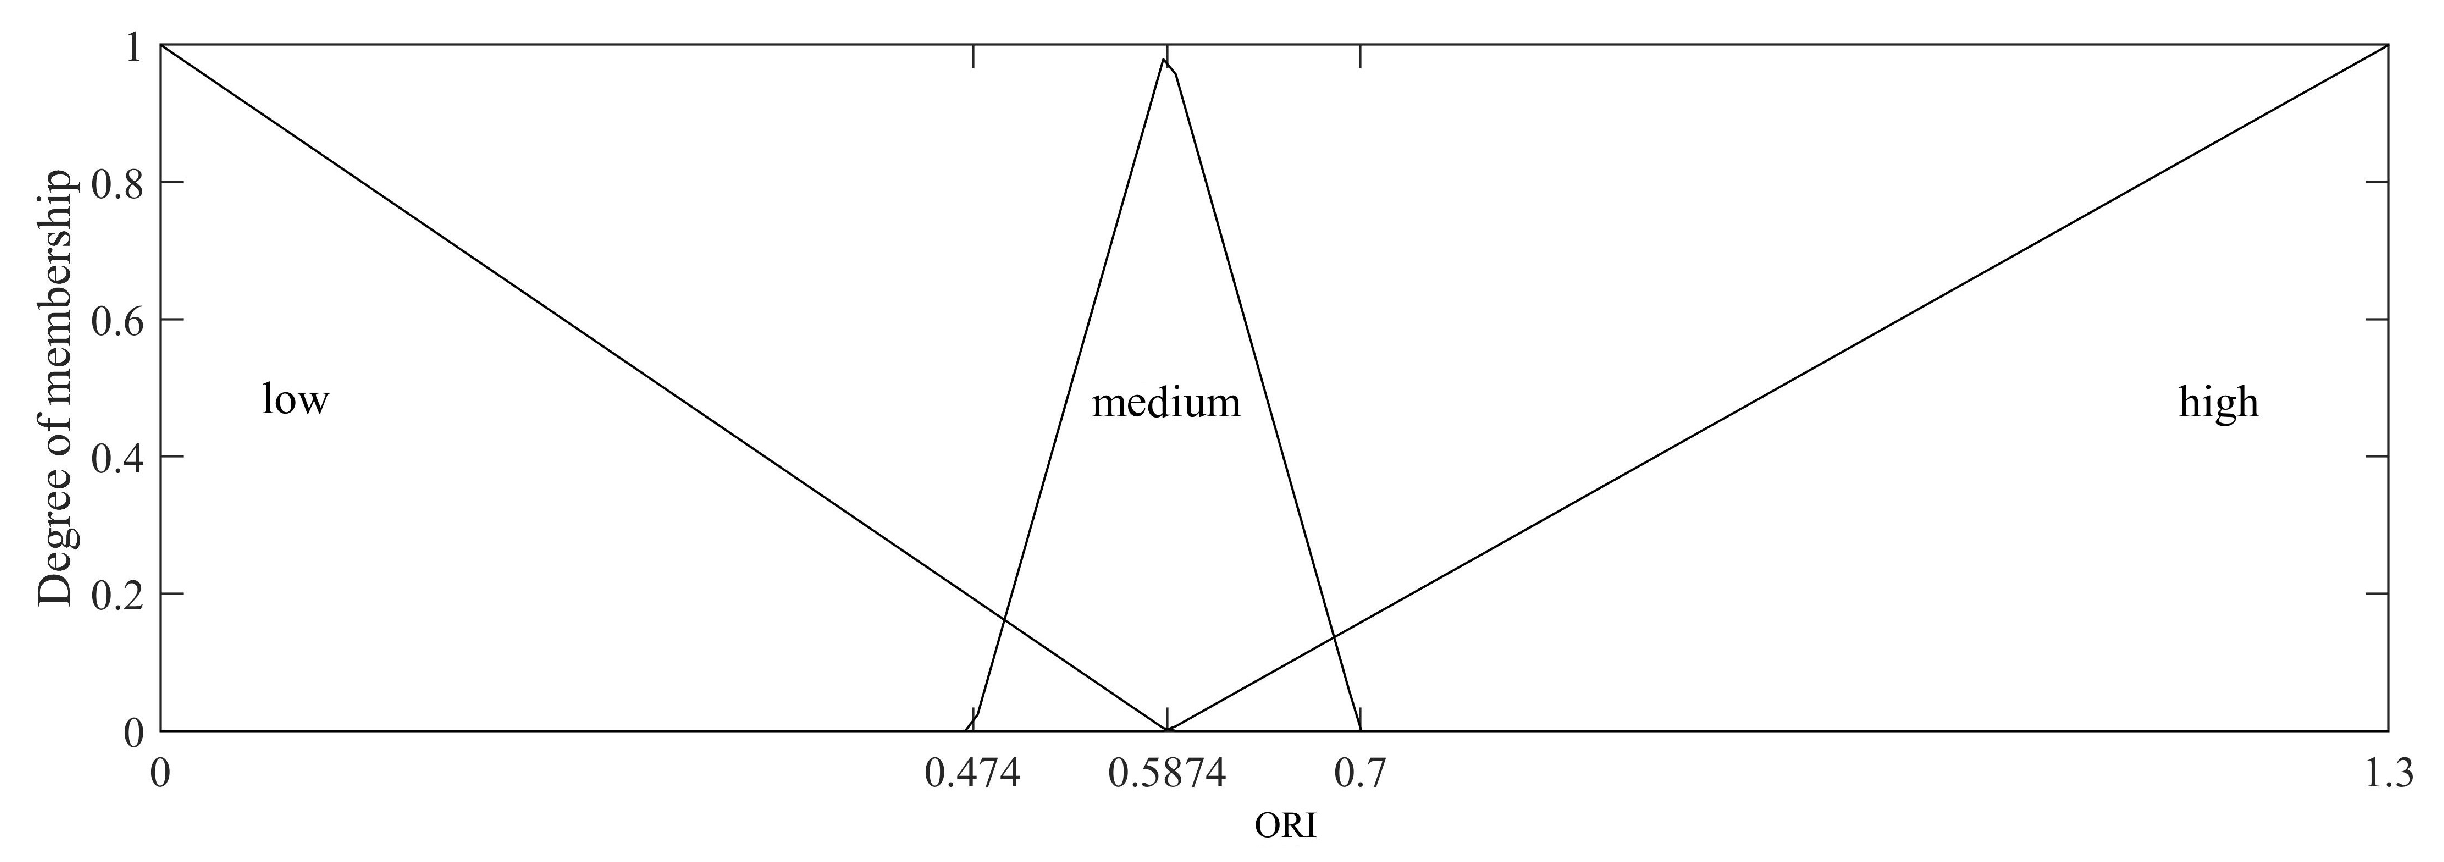
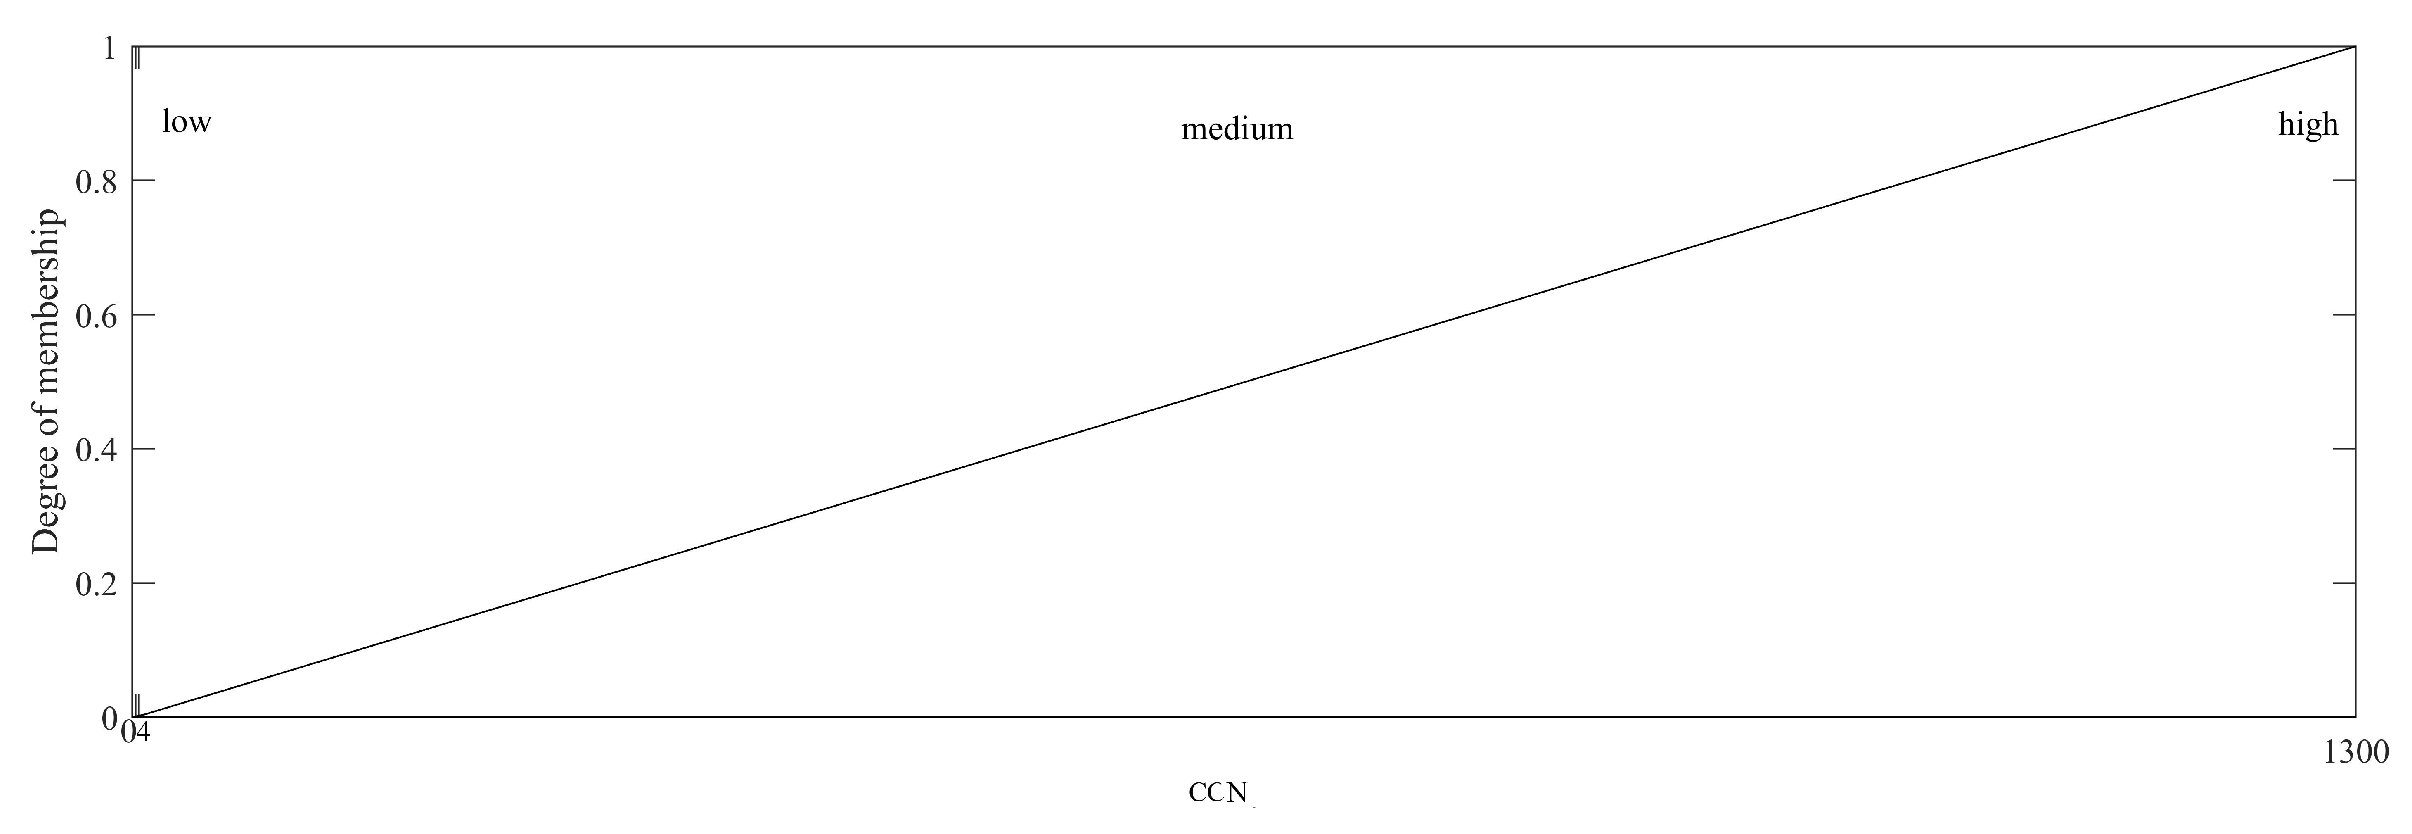
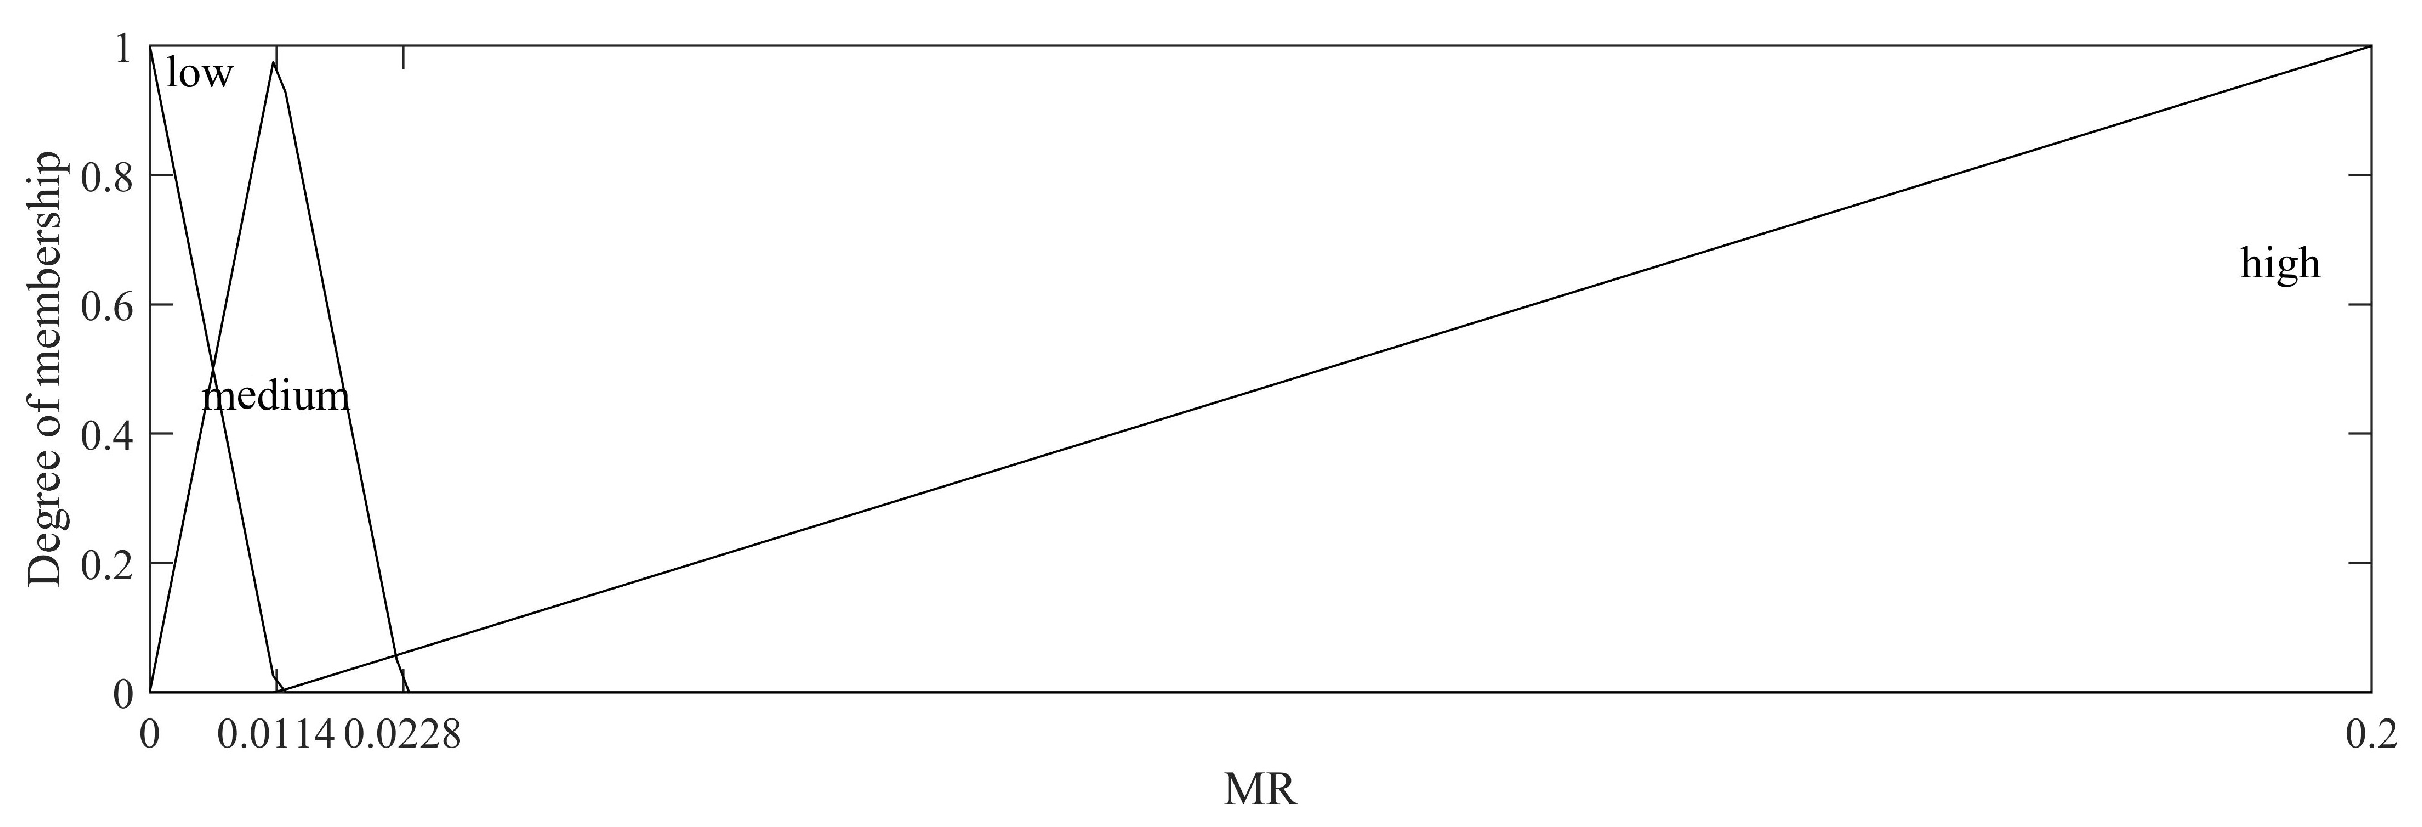
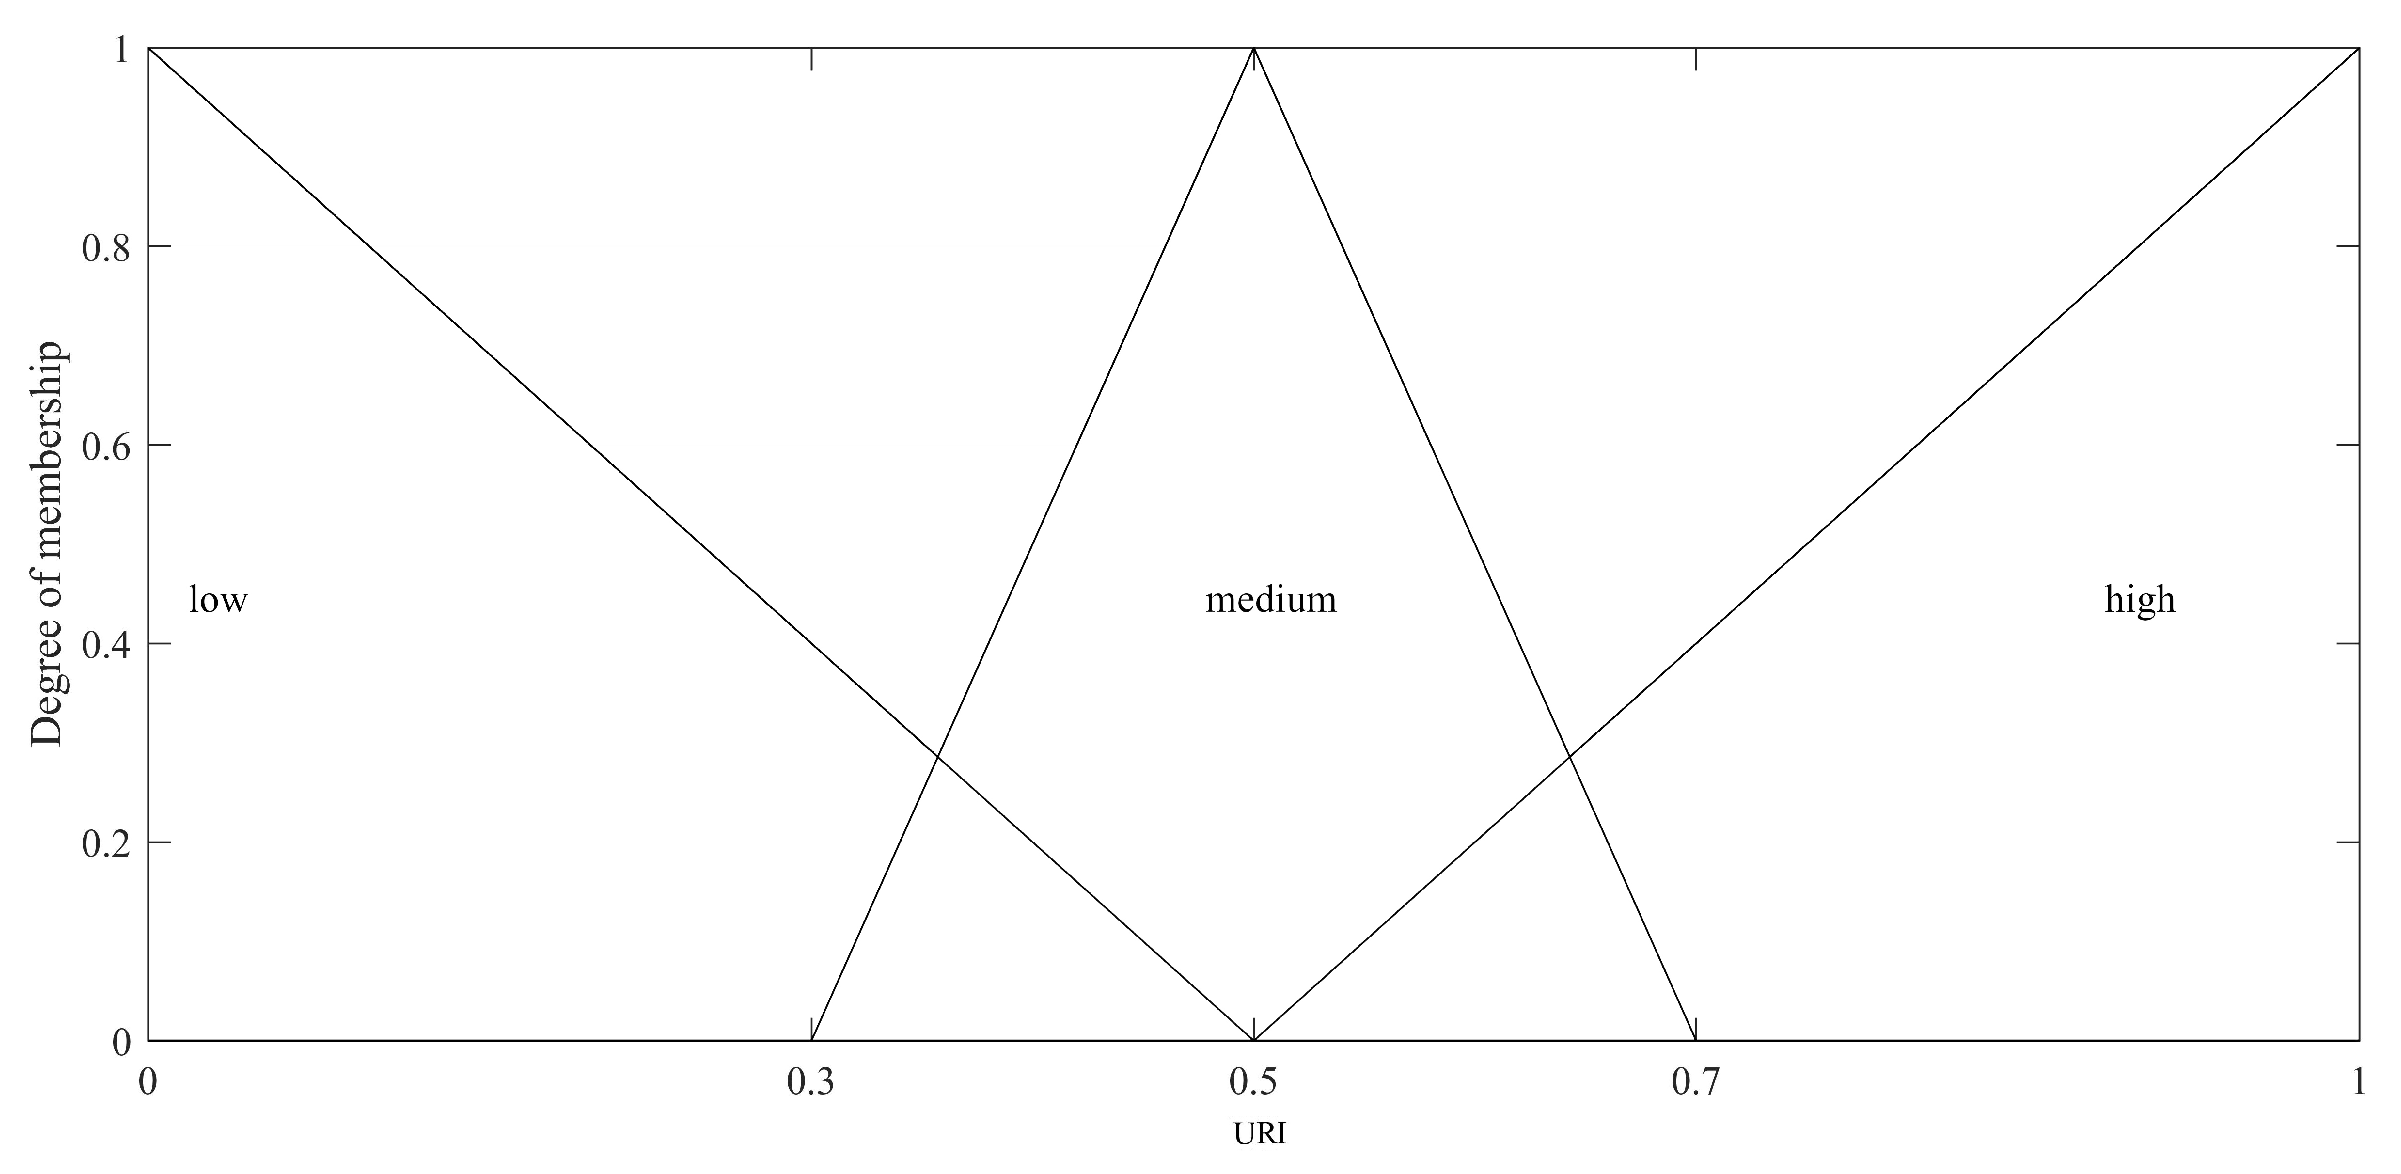
- Step 1: Variables selectionThe used MFIS consists of seven input variables and one output variable. Specifically, the seven input variables are PRI, IRI, ORI, GRI, RR, CCN, and MR in the universe of discourses , and , respectively, and one output variable is URI in the universe of discourse Y. In order to capture the uncertainty associated with the collected data, the membership functions (MFs) of the input and output variables are both represented by TFNs.
- Step 2: Rule baseThe rule base of MFIS depicts the relationship between input and output variables. The “if–then” rule of a MFIS is taken through the following format:where and y belong to , and Y, respectively, and and are TFNs used to represent the qualitative description of PRI, IRI, ORI, GRI, RR, CCN, MR and URI, respectively.
- Step 3: Calculate the fire strength of apiece ruleIn the large amount of existing work (see, for example, [32,48]), the fuzzy intersection operation, as the most commonly used logical connective in fuzzy logic, is widely used to evaluate the fire strength of each rule. So, here, we also use the fuzzy intersection operation to evaluate the fire strength of rule , and the details are listed as follows:where , , , , , and are the MFs of fuzzy sets and of qualitative descriptors in rule , respectively, and , , , , , and are the MFs of fuzzy inputs and in the form of TFNs, respectively.
- Step 4: Derivation of fuzzy output of each ruleIn the abundant existing work (see, for example, [32,48,49]), the output of apiece rule is taken as the intersection of the fire strength of rule and the MF of the qualitative descriptor for the corresponding output. Therefore, here, we also use the intersection operation to derive the fuzzy output of the rule as follows:where is the fire strength of rule , is the MF of (the qualitative descriptor of the output URI), and .
- Step 5: Aggregation of fuzzy outputs
- Step 6: Defuzzification of the aggregated outputAs is well known, the centroid-of-area method, as a way to determine the center of gravity of an aggregated fuzzy set, has been successfully applied in various works (see, for example, [32,50]) to defuzzify the aggregated output. And, here, we also use the centroid-of-area method to defuzzify the aggregated output and obtain the final output URI as follows:where are k quantization of Y.
4. URI of Important Node Cities for Population Migration under the Influence of COVID-19
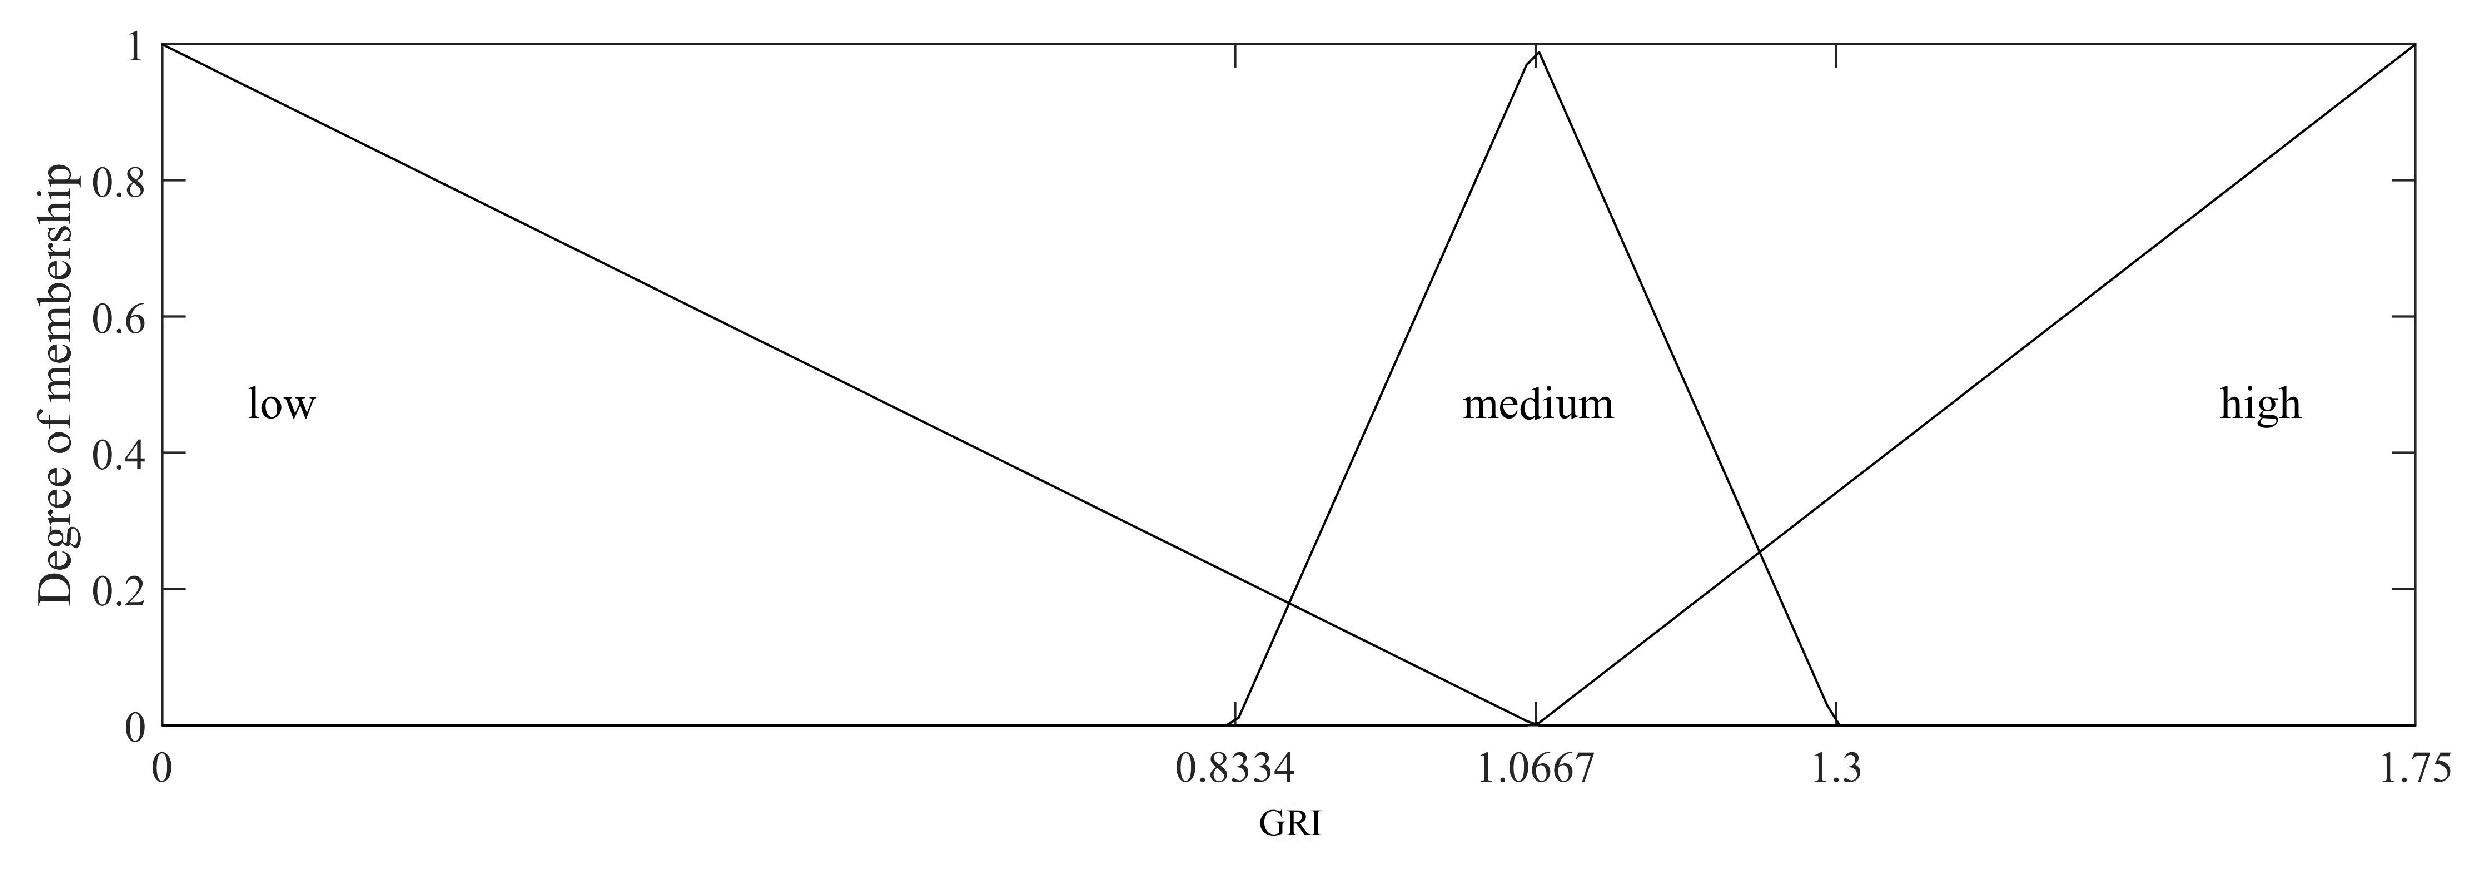
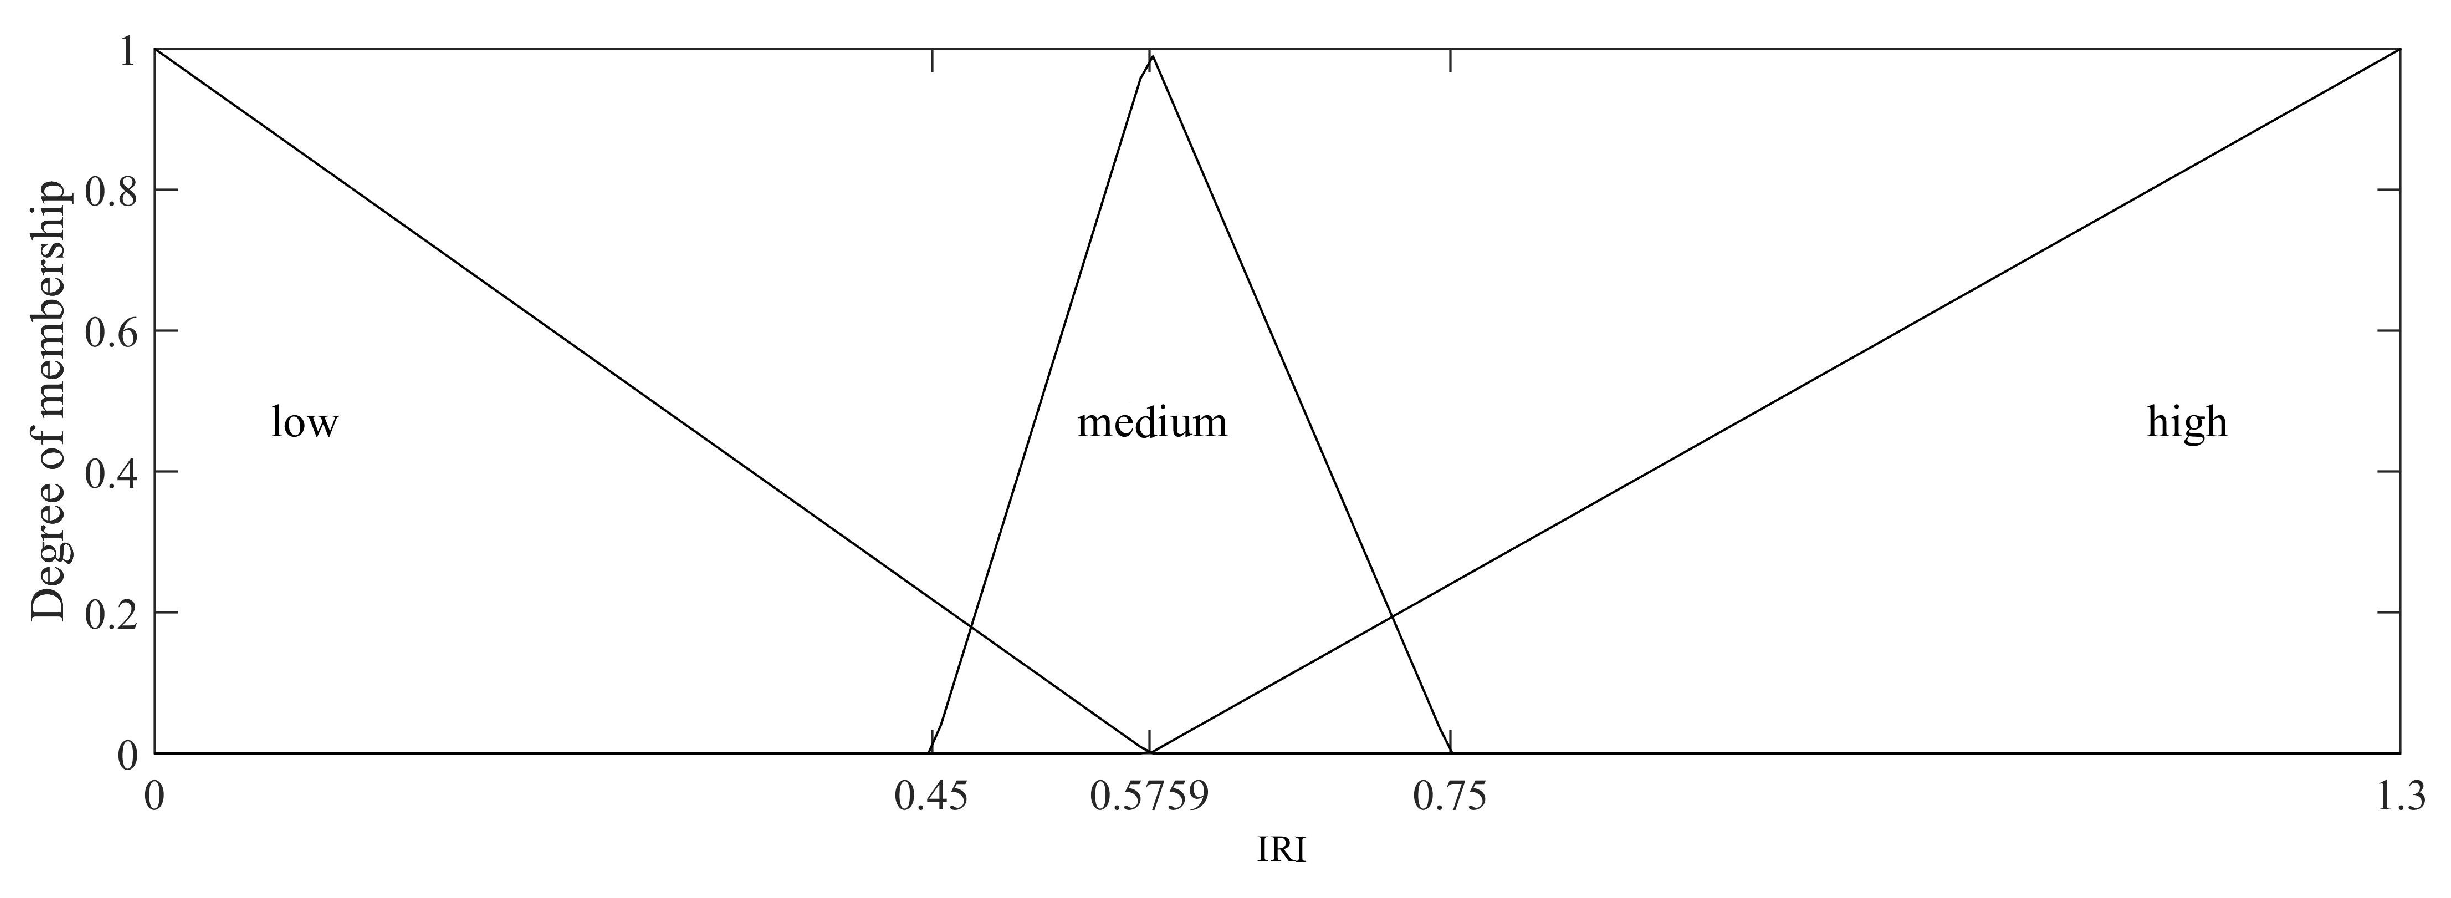
4.1. Membership Functions for Input and Output Parameters
4.2. Formation of Fuzzy Rule Base
5. URI of the 50 Important Node Cities under the Influence of COVID-19
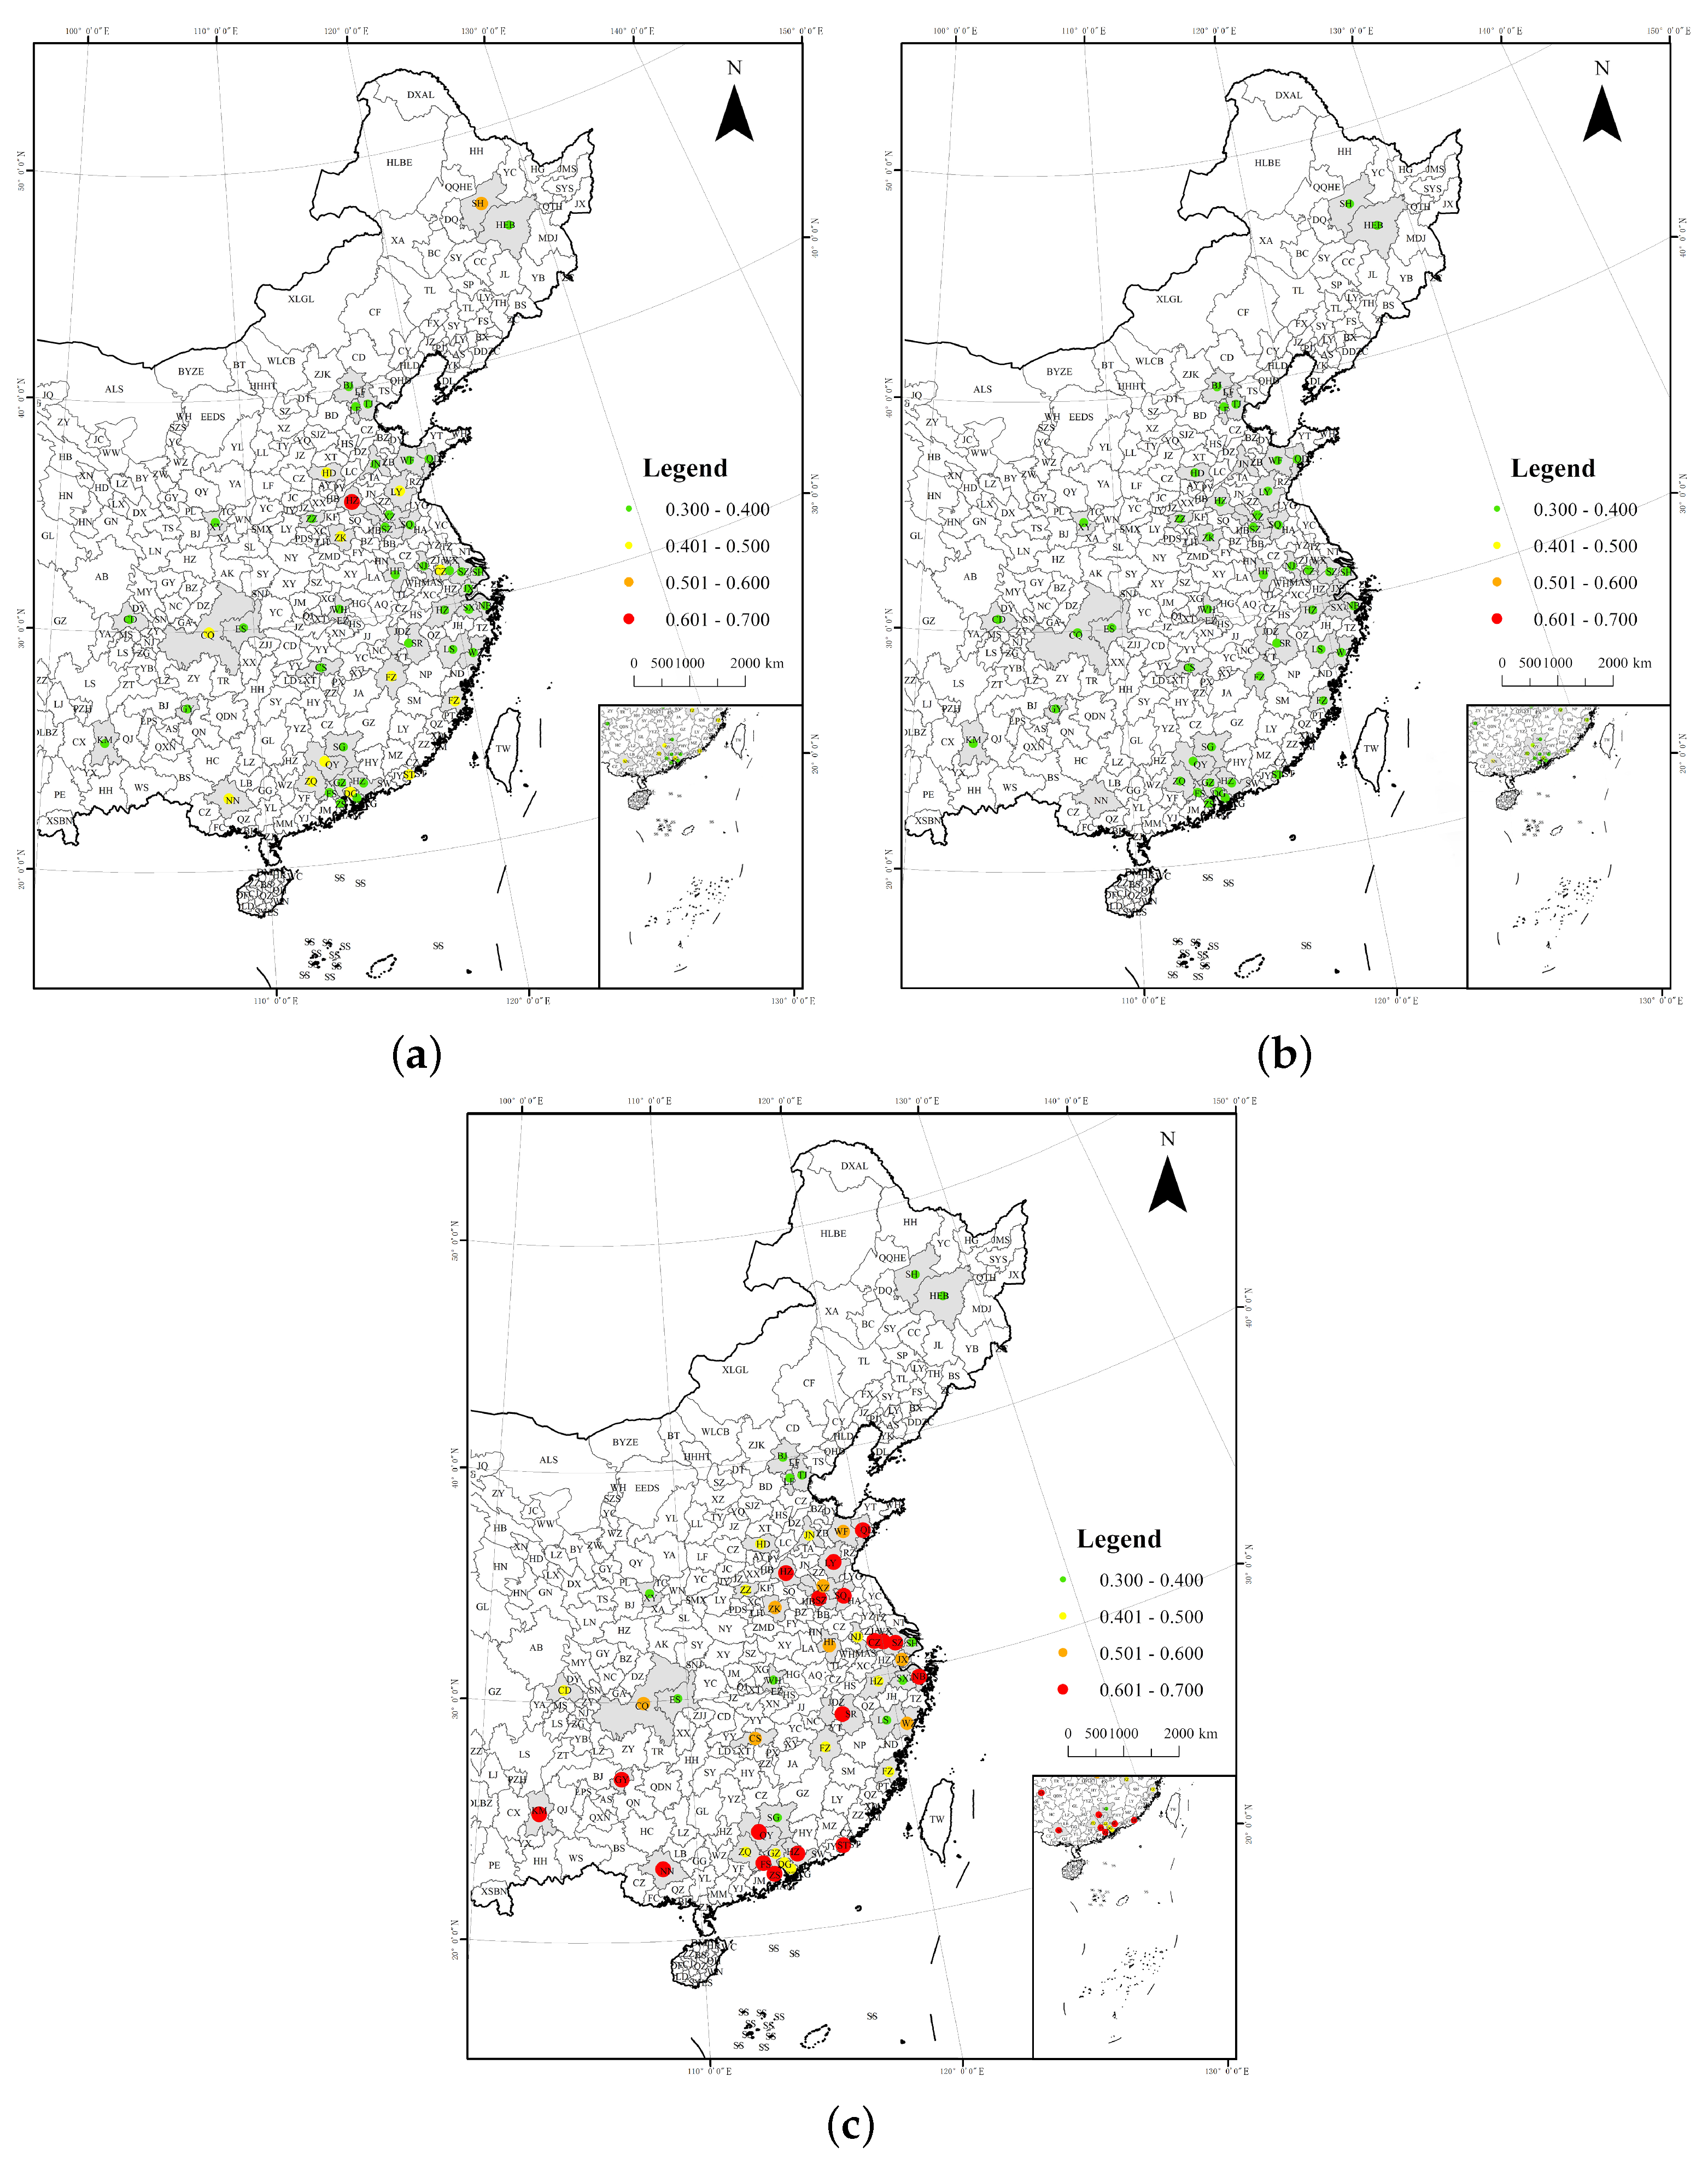
5.1. The Spacial Distribution of URI of the 50 Important Node Cities
5.2. The URI of the 50 Important Node Cities in Each Period
- (1)
- In the incubative period, from 15 January to 31 January 2020, the average URI of 50INCPM is 0.3816. The URI in Heze is the largest; it is 0.6695. The URI in Shaoxing is the smallest; it is 0.3161. Affected by COVID-19, the URI of Guangzhou is lower relatively, just 0.3175. It is only higher than that of Shaoxing; see Figure 13. Compared with the western cities, the eastern cities have a higher URI, cities with higher URI are all located in the eastern coastal area, which shows agglomeration characteristics in space; they are Heze, Handan, Shanghai, Suzhou, Ningbo and Zhaoqing. For western cities of China, except for Xi ’an, Xianyang, Chongqing and Chengdu, the rest of the western cities have lower URI, and they are relatively scattered in space.
- (2)
- During the pandemic period, from 1 February 2020 to 20 February 2020, the most serious stage of COVID-19, the URI is generally lower in each city. The average URI of 50INCPM is 0.3263. The URI in Enshi is the largest; it is 0.3511. The URI in Jinan is the smallest; it is 0.2928. In addition, the URI of Wuhan is relatively low; it is only 0.3144. See Figure 13. The calculation results in the pandemic period show that the impact of COVID-19 on cities in mainland China is very widespread. Cities with higher URI are distributed in the eastern coastal zone, showing agglomeration characteristics, higher URI concentrated in Beijing, Heze, Shanghai, Ningbo and Zhaoqing. For western cities of China, except for Xianyang, Xi’an, Chengdu, Chongqing and Kunming, the URIs of western cities are generally lower and more dispersed. Compared to the incubative period, the URIs in this period showed the Matthew effect, in which eastern developed cities are more resilient and western cities are more vulnerable. At the same time, the URI presents a cluster distribution. In other words, the cities with high URIs are clustered together and the cities with low URIs are focused together, which makes for obvious differences between the east and the west cities.
- (3)
- In the controlled period, from 21 February 2020 to 15 March 2020, the average URI of 50INCPM is 0.5138, the URI in Xiangxi is the largest, at 0.6879, and the URI in Xianyang is the smallest, at 0.3257. It is worth noting that the URI in Wuhan is still low. It is just 0.3511; see Figure 13. During the controlled period, the URI of all cities is increased, but the trend in cities along the southeast coast is more obvious, and it is concentrated in Qingdao, Heze, Suzhou, Ningbo, Shantou, and Qingyuan. This increasing trend has obvious regional agglomeration.
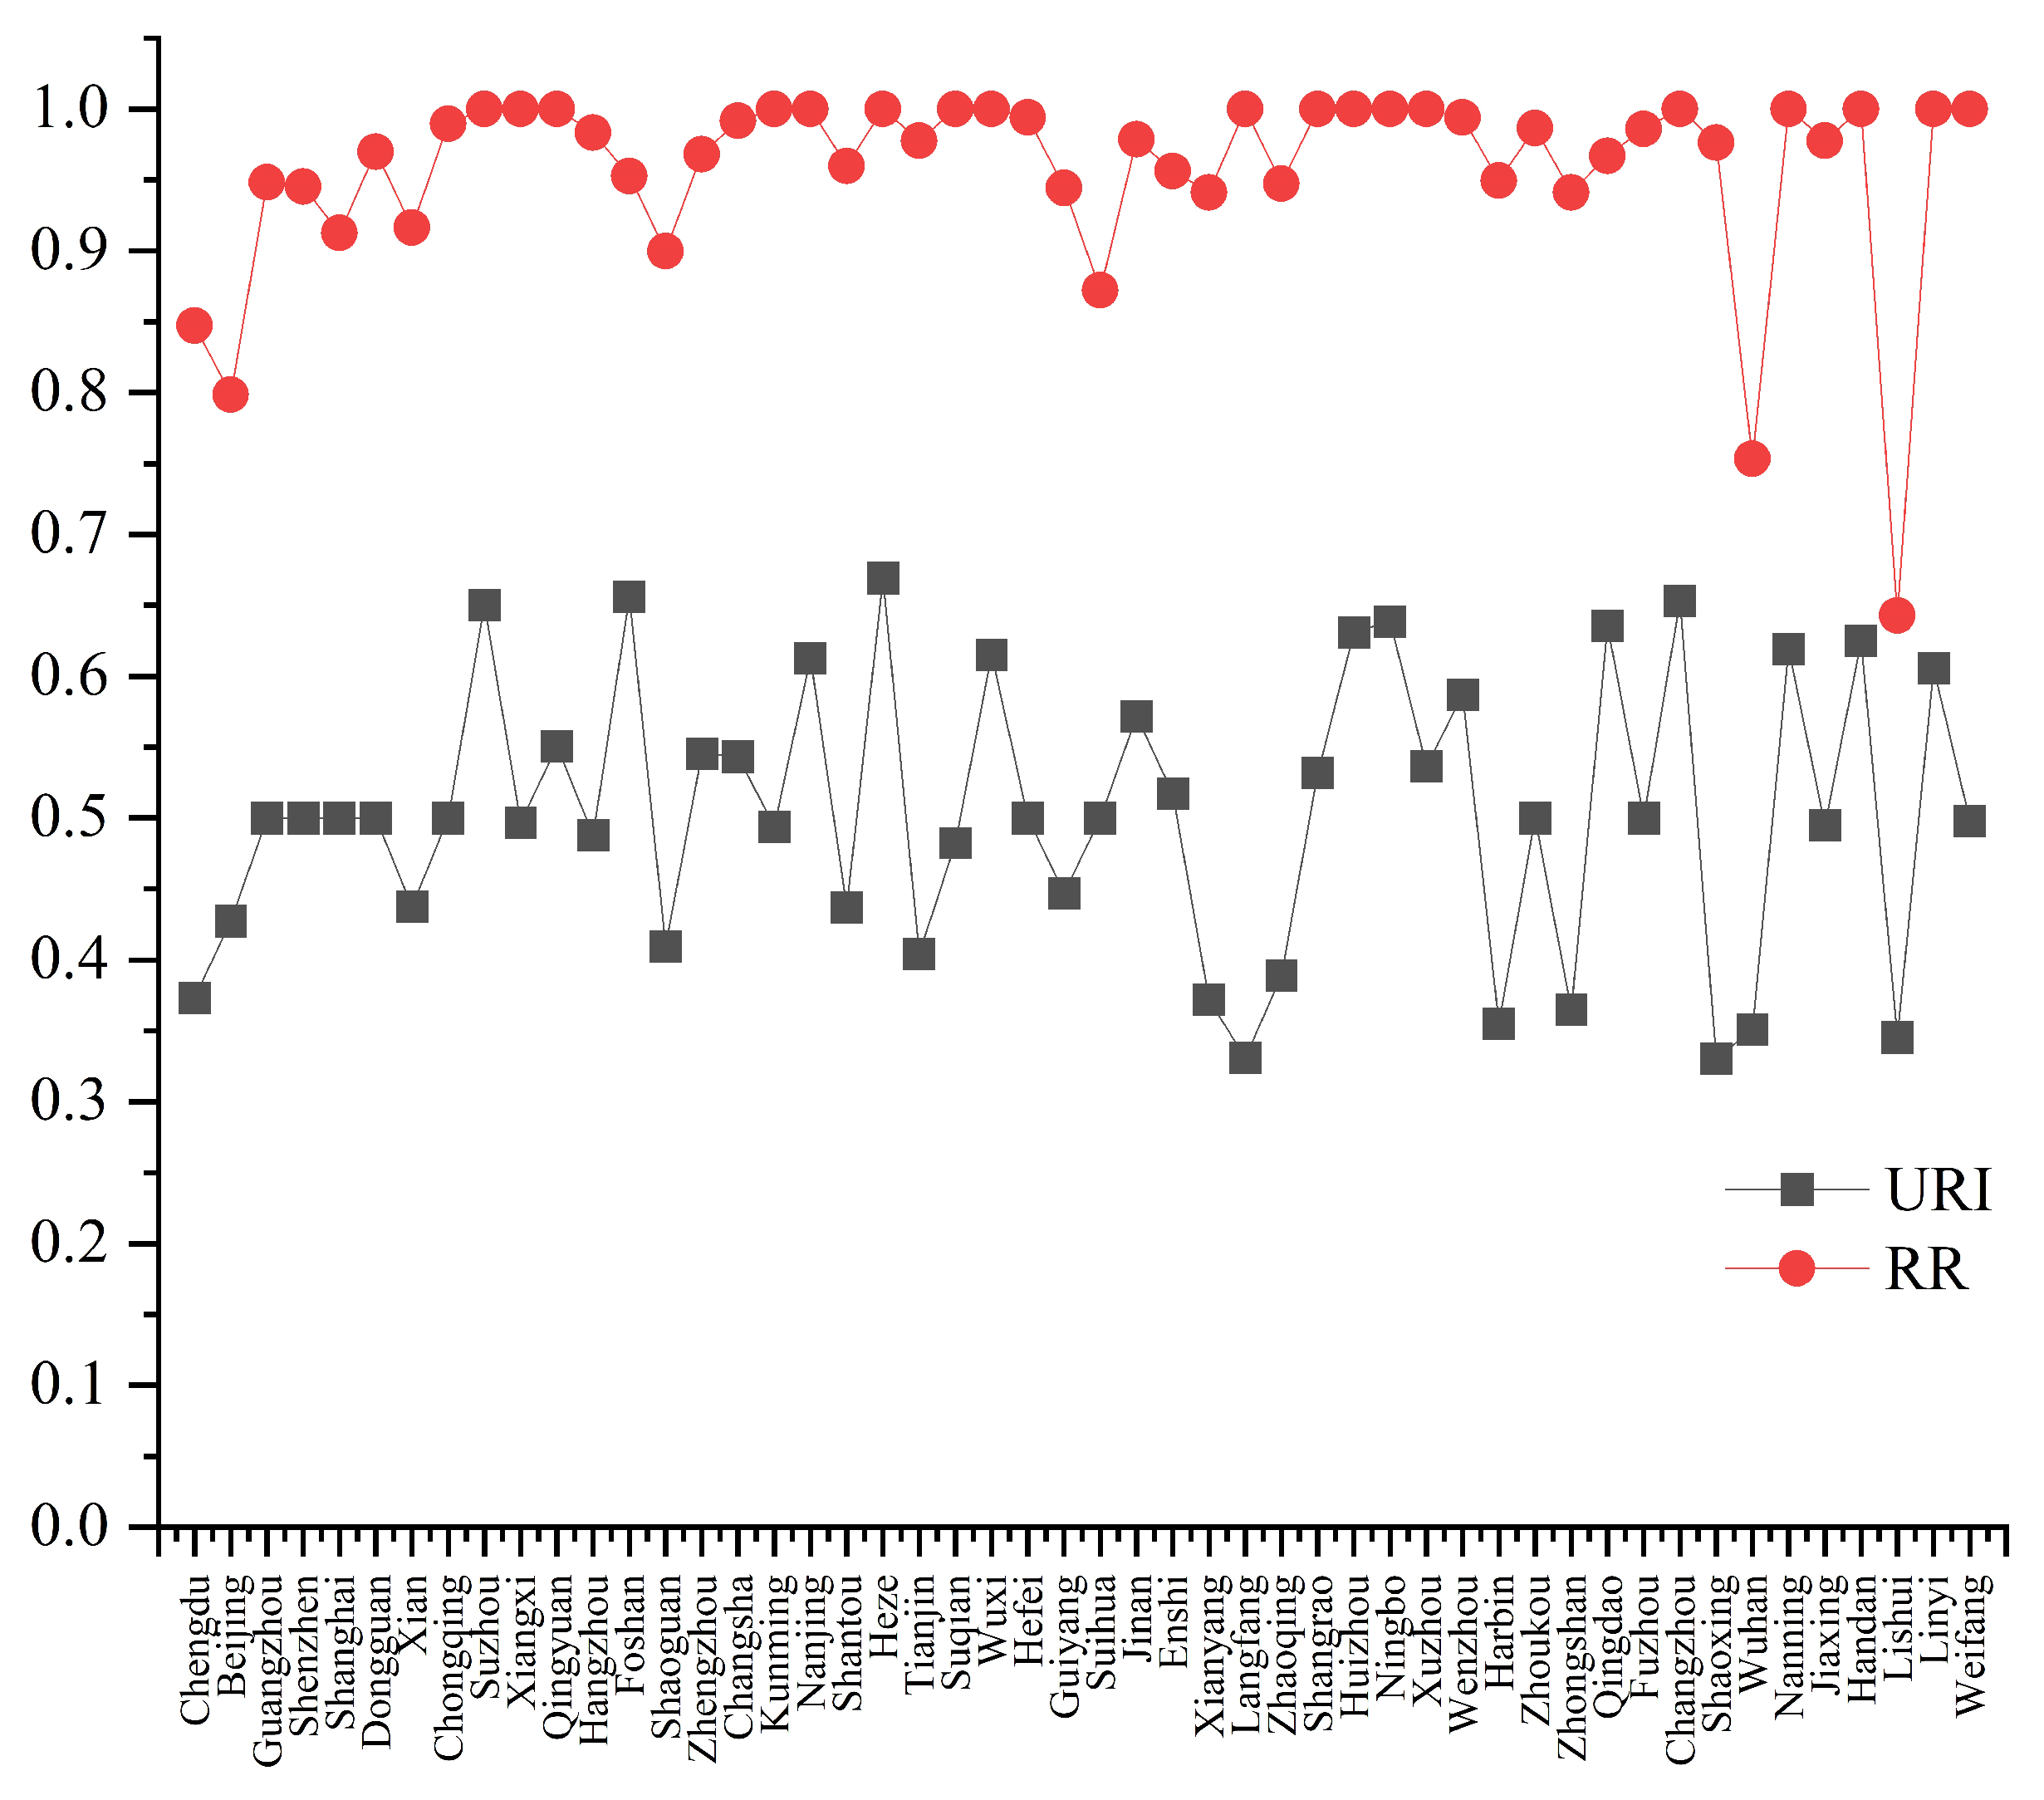
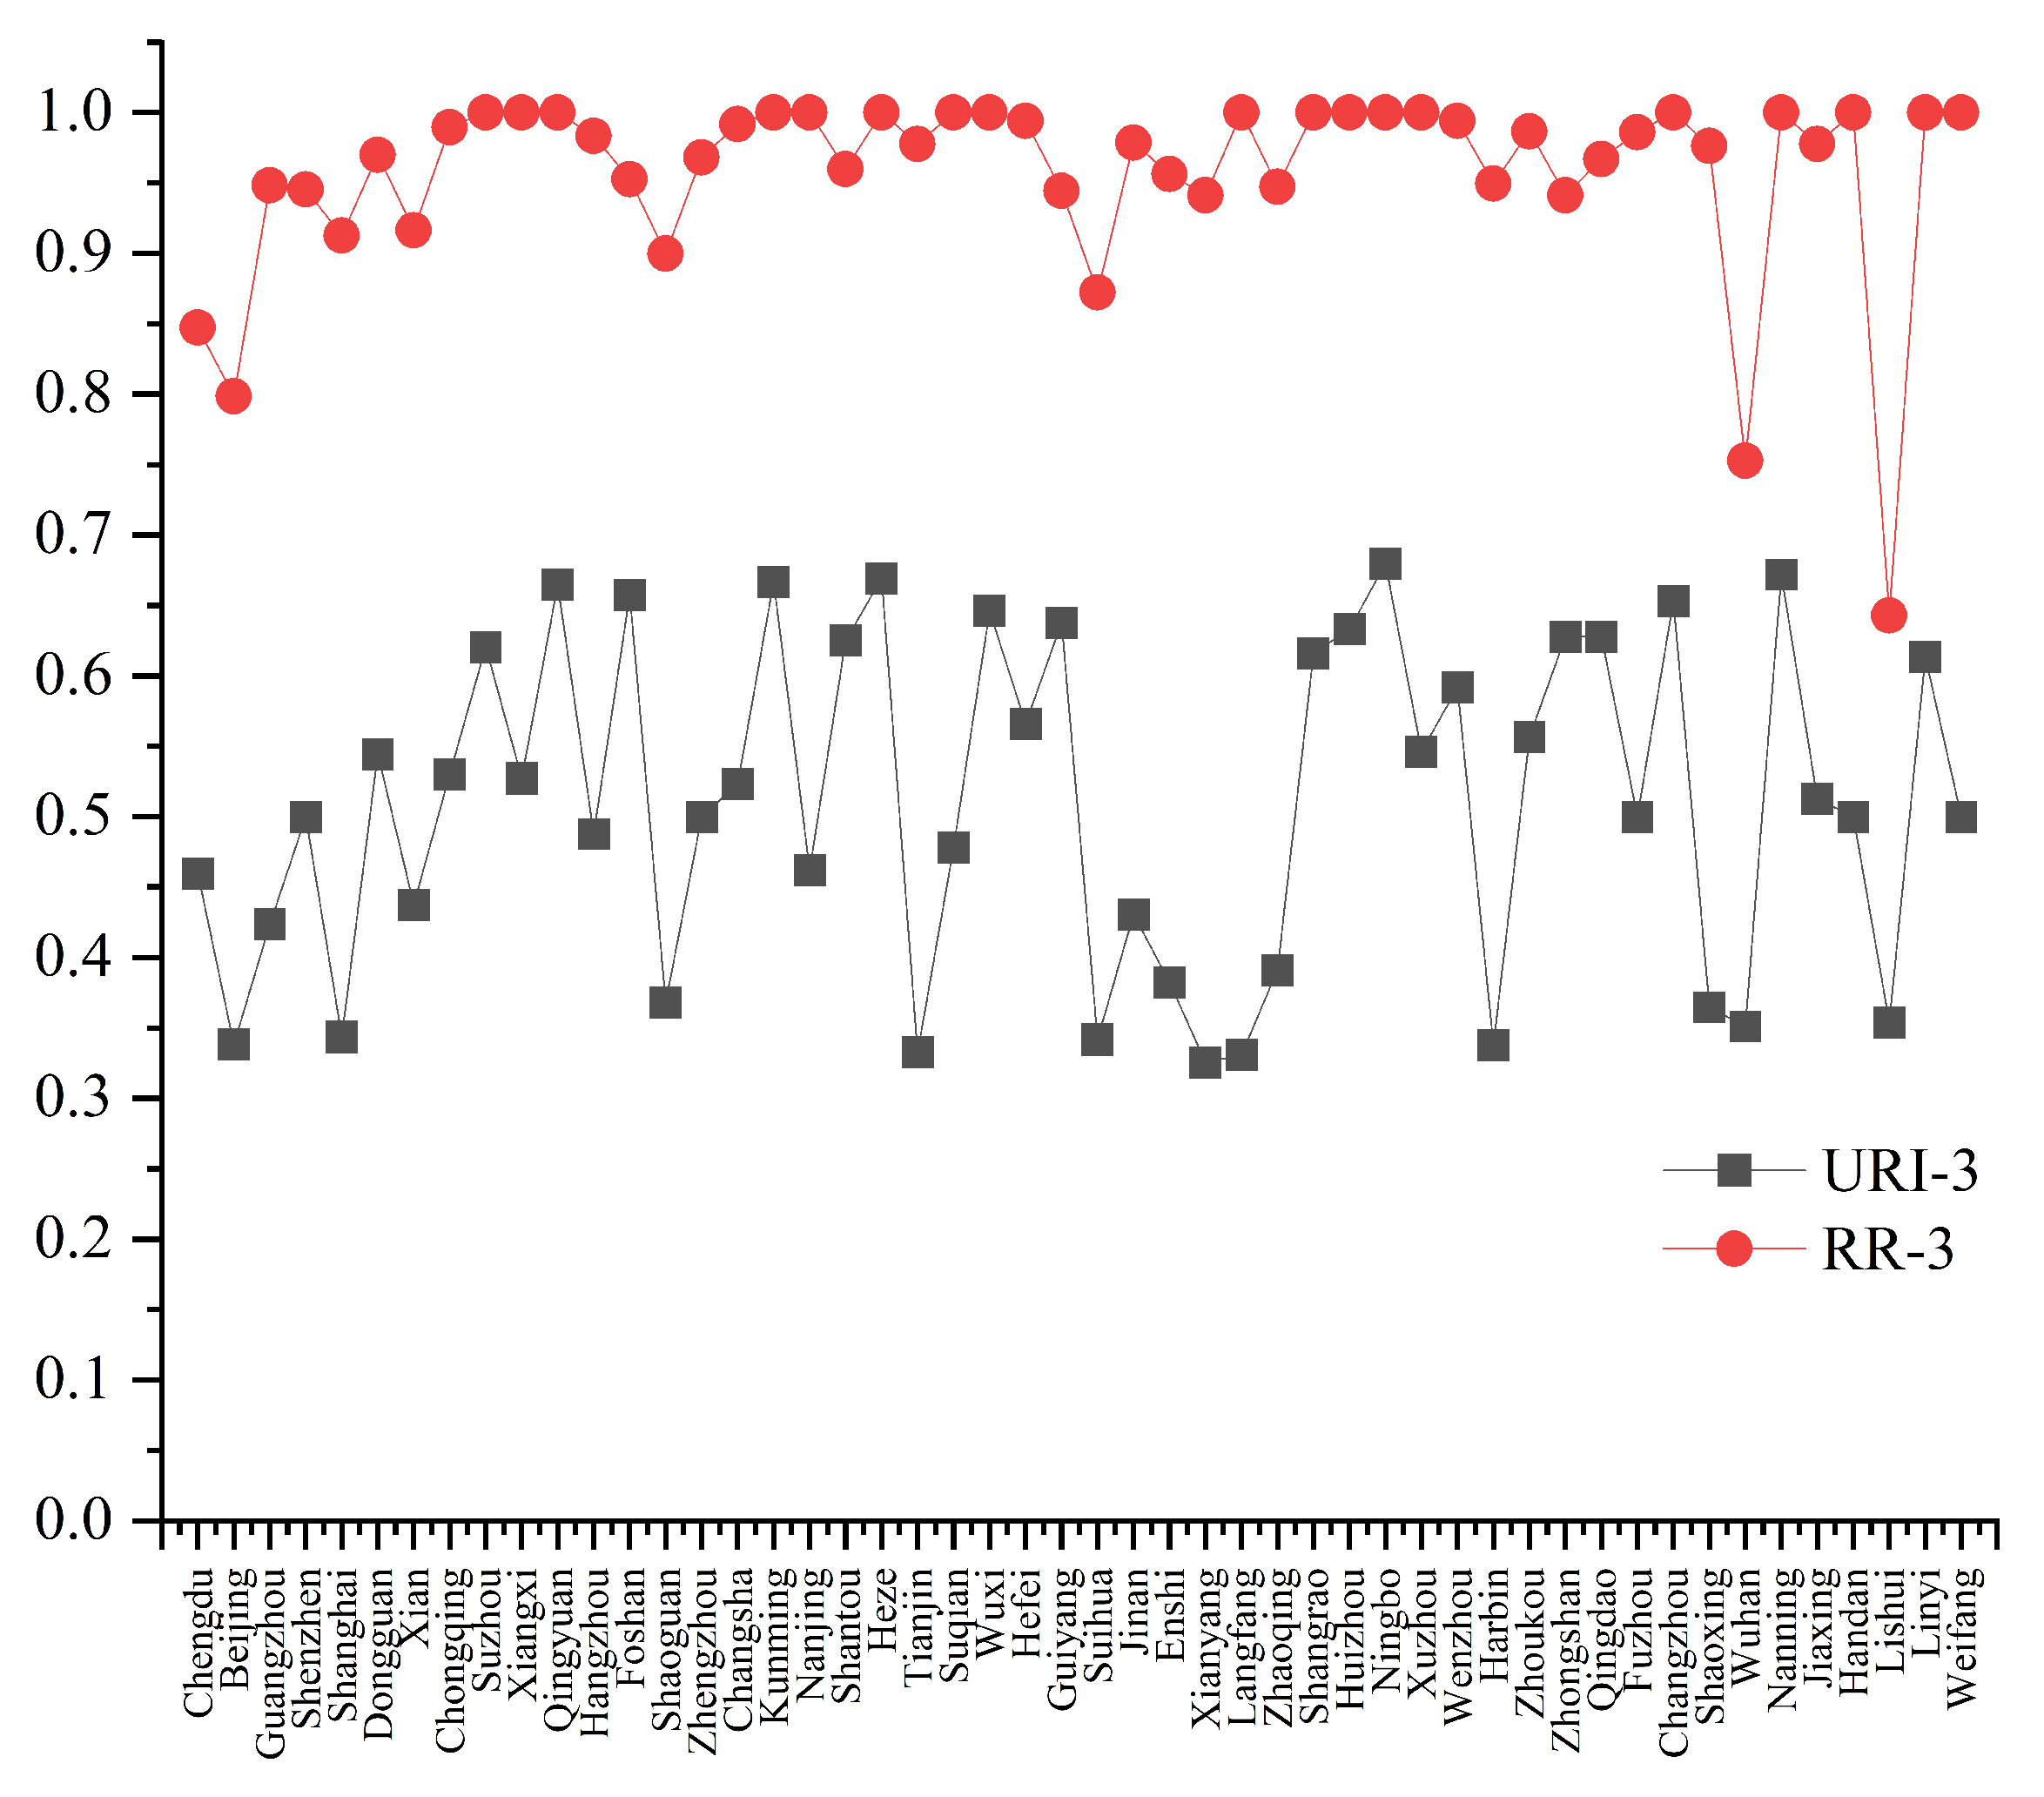
5.3. The Correlation between URI and RR
6. Discussion and Conclusions
6.1. Discussion
6.2. Conclusions
- (i)
- Under the influence of the COVID-19 pandemic, most of 50INCPM in 2020 is concentrated along the southeast coast of China. The URI of 50INCPM decreases from the eastern coastal area to the western inland, the cities with a URI greater than 0.5 are gathered in Guangdong, Zhejiang, Jiangsu and Shandong provinces. As the COVID-19 pandemic is being controlled, the URI is gradually rising. The growth rate of URI in southeast coastal cities exceeds that of inland cities. So, it can be seen that the impact of the COVID-19 pandemic on inland cities is higher than that on coastal cities.
- (ii)
- The second-tier and third-tier cities have stronger resilience in the case of large-scale emergencies.
- (iii)
- There exists a positive correlation in URI and RR. The correlation analysis shows that the correlation of URI and RR is 0.549, and the p value is 0.000 with a significant effect at the 1% level.
Author Contributions
Funding
Institutional Review Board Statement
Informed Consent Statement
Data Availability Statement
Conflicts of Interest
References
- Chen, N.; Zhou, M.; Dong, X.; Qu, J.; Gong, F.; Han, Y.; Qiu, Y.; Wang, J.; Liu, Y.; Wei, Y.; et al. Epidemiological and clinical characteristics of 99 cases of 2019 novel coronavirus pneumonia in Wuhan, China: A descriptive study. Lancet 2020, 395, 391–393. [Google Scholar] [CrossRef] [PubMed]
- Jain, V.; Yuan, J.M. Predictive symptoms and comorbidities for severe COVID-19 and intensive care unit admission: A systematic review and meta-analysis. Int. J. Public Health 2020, 65, 533–546. [Google Scholar] [CrossRef] [PubMed]
- Song, C.Y.; Xu, J.; He, J.Q.; Lu, Y.Q. Immune dysfunction following COVID-19, especially in severe patients. Sci. Rep. 2020, 10, 15838. [Google Scholar] [CrossRef] [PubMed]
- Sohrabi, C.; Alsafi, Z.; O’neill, N.; Khan, M.; Kerwan, A.; Al-Jabir, A.; Agha, R.C. World Health Organization declares global emergency: A review of the 2019 novel coronavirus (COVID-19). Int. J. Surg. 2020, 76, 71–76. [Google Scholar] [CrossRef] [PubMed]
- Narlikar, A.; Sottilotta, C.E. Pandemic narratives and policy responses: West European governments and COVID-19. J. Eur. Public Policy 2021, 28, 1–20. [Google Scholar] [CrossRef]
- Lai, S.; Ruktanonchai, N.W.; Zhou, L.; Prosper, O.; Luo, W.; Floyd, J.R.; Tatem, A.J. Effect of non-pharmaceutical interventions to contain COVID-19 in China. Nature 2020, 585, 410–413. [Google Scholar] [CrossRef]
- Ayalon, L. There is nothing new under the sun: Aageism and intergenerational tension in the age of the COVID-19 outbreak. Int. Psychogeriatr. 2020, 32, 1221–1224. [Google Scholar] [CrossRef] [PubMed]
- Demirba, D.; Bozkurt, V.; Yorun, S. The COVID-19 Pandemic and Its Economic, Social, and Political Impacts; Istanbul University Press: Instanbul, Turkey, 2020. [Google Scholar]
- Simons, G. A critical review of mass media and non-academic reports forecasts of the economic effects of COVID-19 within the frame of crisis management. Stud. Russ. Econ. Dev. 2021, 32, 351–356. [Google Scholar] [CrossRef]
- Akhtar, N. COVID-19: A great challenge for the tourism industry. J. Biomed. Pharm. Res. 2021, 10, 83–87. [Google Scholar] [CrossRef]
- Wu, F.; Liu, G.; Guo, N.; Li, Z.; Deng, X. The impact of COVID-19 on China’s regional economies and industries. J. Geogr. Sci. 2021, 31, 565–583. [Google Scholar] [CrossRef]
- Long, H.; Zhao, J.Z. The impact of SARS epidemic and financial crisis on China’s economy structure referenced to the potential impact of COVID-19. Bull. Appl. Econ. 2021, 8, 97–108. [Google Scholar] [CrossRef]
- Roxana, I. Capital market correlations structure during the COVID-19 crisis. Ann. Econ. 2020, 6, 67–79. [Google Scholar]
- Chen, M.; Li, Y.; Chen, J.; Wen, Z.; Feng, F.; Zou, H.; Sun, C. An online survey of the attitude and willingness of Chinese adults to receive COVID-19 vaccination. Hum. Vaccines Immunother. 2021, 17, 2279–2288. [Google Scholar] [CrossRef] [PubMed]
- Sims, A.C.; Burkett, S.E.; Yount, B.; Pickles, R.J. SARS-CoV replication and pathogenesis in an in vitro model of the human conducting airway epithelium. Virus Res. 2008, 133, 33–44. [Google Scholar] [CrossRef] [PubMed]
- Ahadu, E. Novel Corona virus COVID-19: Impact on economic development and mitigating solution for developing countries. J. Humanit. Soc. Sci. 2020, 8, 86–91. [Google Scholar] [CrossRef]
- Adkins, J.K.; Linville, D.; Clarence, B.; Elliott, S.; Paddock, S. The impact of COVID-19 on industry and education. J. Comput. Sci. Coll. 2021, 36, 80–81. [Google Scholar]
- Fu, X.L.; Zhang, J.; Wang, L.M. Introduction to the special section: The impact of COVID-19 and post-pandemic recovery: China and the world economy. J. Chin. Econ. Bus. Stud. 2020, 18, 311–319. [Google Scholar] [CrossRef]
- Sharifi, A.; Yamagata, Y. A conceptual framework for assessment of urban energy resilience. Energy Procedia 2015, 75, 2904–2909. [Google Scholar] [CrossRef]
- Cui, Z.; Fu, X.; Wang, J.; Qiang, Y.; Jiang, Y.; Long, Z. How does COVID-19 pandemic impact cities’ logistics performance? An evidence from China’s highway freight transport. Transp. Policy 2022, 120, 11–22. [Google Scholar] [CrossRef]
- Zhen, C.; Cheng, M.; Song, M. What determines urban resilience against COVID-19: City size or governance capacity? Sustain. Cities Soc. 2021, 75, 103304. [Google Scholar]
- Khavarian-Garmsir, A.R.; Sharifi, A.; Moradpour, N. Are high-density districts more vulnerable to the COVID-19 pandemic? Sustain. Cities Soc. 2021, 70, 102911. [Google Scholar] [CrossRef] [PubMed]
- Adhikari, S.; Pantaleo, N.P.; Feldman, J.M.; Ogedegbe, O.; Thorpe, L.; Troxel, A.B. Assessment of community-level disparities in coronavirus disease 2019 (COVID-19) infections and deaths in large US metropolitan areas. JAMA Netw. Open 2020, 3, e2016938. [Google Scholar] [CrossRef] [PubMed]
- Valjarević, A.; Milić, M.; Valjarević, D.; Stanojević-Ristić, Z.; Petrović, L.; Milanović, M.; Filipović, D.; Ristanović, B.; Basarin, B.; Lukić, T. Modelling and mapping of the COVID-19 trajectory and pandemic paths at global scale: A geographer’s perspective. Open Geosci. 2020, 12, 1603–1616. [Google Scholar] [CrossRef]
- Chen, X.; Quan, R. A spatiotemporal analysis of urban resilience to the COVID-19 pandemic in the Yangtze River Delta. Nat. Hazards 2021, 106, 829–854. [Google Scholar] [CrossRef]
- Hou, X.; Ma, Q.; Wang, X. Spatial differentiation and elements influencing urban resilience in the middle reaches of the Yangtze River under the COVID-19 pandemic. Discret. Dyn. Nat. Soc. 2021, 2021, 6687869. [Google Scholar] [CrossRef]
- Wu, X.; Mao, R.; Guo, X. Equilibrium of Tiered Healthcare Resources during the COVID-19 Pandemic in China: A Case Study of Taiyuan, Shanxi Province. Int. J. Environ. Res. Public Health 2022, 19, 7035. [Google Scholar] [CrossRef]
- Trencher, G.; Broto, V.C.; Takagi, T.; Sprigings, Z.; Nishida, Y.; Yarime, M. Innovative policy practices to advance building energy efciency and retroftting: Approaches, impacts and challenges in ten C40 cities. Environ. Sci. Policy 2016, 66, 353–365. [Google Scholar] [CrossRef]
- Liu, Y. Measurement of urban resilience system development: Based on an empirical study of 288 cities in China. Urban Dev. Res. 2021, 28, 93–100. [Google Scholar]
- Álvarez-Pomar, L.; Rojas-Galeano, S. Impact of personal protection habits on the spread of pandemics: Insights from an agent-based model. Sci. World J. 2021, 1, 1–14. [Google Scholar] [CrossRef]
- Mamdani, E.H.; Assilian, S. An experiment in linguistic synthesis with a fuzzy logic controller. Int. J. Hum.-Comput. Stud. 1975, 7, 1–13. [Google Scholar] [CrossRef]
- Ghosh, B.; Biswas, A. Status evaluation of provinces affected by COVID-19: A qualitative assessment using fuzzy system. Appl. Soft Comput. 2021, 109, 107540. [Google Scholar] [CrossRef] [PubMed]
- Togacar, M.; Ergen, B.; Comert, Z.Z. COVID-19 detection using deep learning models to exploit social mimic optimization and structured chest X-ray images using fuzzy color and stacking approaches. Comput. Biol. Med. 2020, 121, 103805. [Google Scholar] [CrossRef] [PubMed]
- Govindan, K.; Mina, H.; Alavi, B. A decision support system for demand management in healthcare supply chains considering the epidemic outbreaks:A case study of coronavirus disease 2019 (COVID-19). Transp. Res. Part E Logist. Transp. Rev. 2020, 138, 101967. [Google Scholar] [CrossRef] [PubMed]
- Mardani, A.; Saraji, M.K.; Mishra, A.R.; Rani, P. A novel extended approach under hesitant fuzzy sets to design a framework for assessing the key challenges of digital health interventions adoption during the COVID-19 outbreak. Appl. Soft Comput. 2020, 96, 106613. [Google Scholar] [CrossRef] [PubMed]
- Mahmoudi, M.R.; Baleanu, D.; Mansor, Z.; Tuan, B.A.; Pho, K.H. Fuzzy clustering method to compare the spread rate of COVID-19 in the high risks countries. Chaos Solitons Fractals 2020, 140, 110230. [Google Scholar] [CrossRef] [PubMed]
- Behnood, A.; Golafshani, E.M.; Hosseini, S.M. Determinants of the infection rate of the COVID-19 in the U.S. using ANFIS and virus optimization algorithm (VOA). Chaos Solitons Fractals 2020, 139, 110051. [Google Scholar] [CrossRef] [PubMed]
- Ly, K.T. A COVID-19 forecasting system using adaptive neuro-fuzzy inference. Financ. Res. Lett. 2021, 41, 101844. [Google Scholar] [CrossRef] [PubMed]
- Ocampo, L.; Yamagishi, K. Modeling the lockdown relaxation protocols of the philippine government in response to the COVID-19 pandemic: An intuitionistic fuzzy DEMATEL analysis. Socio-Econ. Plan. Sci. 2020, 72, 100911. [Google Scholar] [CrossRef]
- Ren, Z.; Liao, H.; Liu, Y. Generalized Z-numbers with hesitant fuzzy linguistic information and its application to medicine selection for the patients with mild symptoms of the COVID-19. Comput. Ind. Eng. 2020, 145, 106517. [Google Scholar] [CrossRef]
- Li, X.; Liao, H.; Wen, Z. A consensus model to manage the non-cooperative behaviors of individuals in uncertain group decision making problems during the COVID-19 outbreak. Appl. Soft Comput. 2021, 99, 106879. [Google Scholar] [CrossRef]
- Shaban, W.M.; Rabie, A.H.; Saleh, A.I.; Abo-Elsoud, M.A. Detecting COVID-19 patients based on fuzzy inference engine and Deep Neural Network. Appl. Soft Comput. 2021, 99, 106906. [Google Scholar] [CrossRef] [PubMed]
- Aggarwal, L.; Goswami, P.; Sachdeva, S. Multi-criterion intelligent decision support system for COVID-19. Appl. Soft Comput. 2021, 101, 107056. [Google Scholar] [CrossRef] [PubMed]
- Ghorui, N.; Ghosh, A.; Mondal, S.P.; Bajuri, M.Y.; Ahmadian, A.; Salahshour, S.; Ferrara, M. Identifcation of dominant risk factor involved in spread of COVID-19 using hesitant fuzzy MCDM methodology. Results Phys. 2021, 21, 103811. [Google Scholar] [CrossRef] [PubMed]
- Mishra, A.R.; Rani, P.; Krishankumar, R.; Ravichandran, K.S.; Kar, S. An extended fuzzy decision-making framework using hesitant fuzzy sets for the drug selection to treat the mild symptoms of Coronavirus Disease 2019 (COVID-19). Appl. Soft Comput. 2021, 103, 107155. [Google Scholar] [CrossRef]
- Ecer, F.; Pamucar, D. MARCOS technique under intuitionistic fuzzy environment for determining the COVID-19 pandemic performance of insurance companies in terms of healthcare services. Appl. Soft Comput. 2021, 104, 107199. [Google Scholar] [CrossRef] [PubMed]
- Sharma, M.K.; Dhiman, N.; Mishra, V.N. Mediative fuzzy logic mathematical model: A contradictory management prediction in COVID-19 pandemic. Appl. Soft Comput. 2021, 105, 107285. [Google Scholar] [CrossRef] [PubMed]
- An, M.; Chen, Y.; Baker, C.J. A fuzzy reasoning and fuzzy analytical hierarchy process based approach to the process of railway risk information: A railway risk management system. Inf. Sci. 2011, 181, 3946–3966. [Google Scholar] [CrossRef]
- Majumder, D.; Debnath, J.; Biswas, A. Risk analysis in construction sites using fuzzy reasoning and fuzzy analytic hierarchy process. Procedia Technol. 2013, 10, 604–614. [Google Scholar] [CrossRef]
- An, M.; Lin, W.; Stirling, A. Fuzzy-reasoning-based approach to qualitative railway risk assessment. Proc. Inst. Mech. Eng. Part F J. Rail Rapid Transit 2006, 220, 153–167. [Google Scholar] [CrossRef]
- Tong, Y.; Ma, Y.; Liu, H.M. The short-term impact of COVID-19 epidemic on the migration of Chinese urban population and the evaluation of Chinese urban resilience. Acta Geogr. Sin. 2020, 75, 2506–2520. [Google Scholar]
- Lau, H.; Khosrawipour, V.; Kocbach, P.; Mikołajczyk, A.; Schubert, J.; Bania, J.; Khosrawipour, T. The positive impact of lockdown in Wuhan on containing the COVID-19 outbreak in China. J. Travel Med. 2020, 27, 1–7. [Google Scholar] [CrossRef]
- Helena, B.; Jean, R.; Vanessa, S.; Désirée, N. A study of changes in everyday mobility during the Covid-19 pandemic: As perceived by people living in Malm, Sweden. Transp. Policy 2021, 106, 109–119. [Google Scholar]


| City | PRI | GRI | ORI | IRI | CCN | MR | RR |
|---|---|---|---|---|---|---|---|
| Chengdu | |||||||
| Beijing | |||||||
| Guangzhou | |||||||
| Shenzhen | |||||||
| Shanghai | |||||||
| Dongguan | |||||||
| Xian | |||||||
| Chongqing | |||||||
| Suzhou | |||||||
| Xiangxi | |||||||
| Qingyuan | |||||||
| Hangzhou | |||||||
| Foshan | |||||||
| Shaoguan | |||||||
| Zhengzhou | |||||||
| Changsha | |||||||
| Kunming | |||||||
| Nanjing | |||||||
| Shantou | |||||||
| Heze | |||||||
| Tianjin | |||||||
| Suqian | |||||||
| Wuxi | |||||||
| Hefei | |||||||
| Guiyang | |||||||
| Suihua | |||||||
| Jinan | |||||||
| Enshi | |||||||
| Xianyang | |||||||
| Langfang | |||||||
| Zhaoqing | |||||||
| Shangrao | |||||||
| Huizhou | |||||||
| Ningbo | |||||||
| Xuzhou | |||||||
| Wenzhou | |||||||
| Haerbin | |||||||
| Zhoukou | |||||||
| Zhongshan | |||||||
| Qingdao | |||||||
| Fuzhou | |||||||
| Changzhou | |||||||
| Shaoxing | |||||||
| Wuhan | |||||||
| Nanning | |||||||
| Jiaxing | |||||||
| Handan | |||||||
| Lishui | |||||||
| Linyi | |||||||
| Weifang |
| Rules | If | Then | ||||||
|---|---|---|---|---|---|---|---|---|
| CCN | RR | MR | PRI | GRI | ORI | IRI | URI | |
| 1 | low | low | low | low | low | low | low | low |
| 2 | low | low | low | low | low | low | medium | low |
| 3 | low | low | low | low | low | low | high | low |
| ⋮ | ⋮ | ⋮ | ⋮ | ⋮ | ⋮ | ⋮ | ⋮ | ⋮ |
| 26 | low | low | low | low | high | high | medium | medium |
| 27 | low | low | low | low | high | high | high | medium |
| 28 | low | low | low | medium | low | low | low | low |
| ⋮ | ⋮ | ⋮ | ⋮ | ⋮ | ⋮ | ⋮ | ⋮ | ⋮ |
| 1198 | medium | medium | high | high | medium | low | low | medium |
| 1199 | medium | medium | high | high | medium | low | medium | medium |
| 1200 | medium | medium | high | high | medium | low | high | medium |
| ⋮ | ⋮ | ⋮ | ⋮ | ⋮ | ⋮ | ⋮ | ⋮ | ⋮ |
| 2185 | high | high | high | high | high | high | low | high |
| 2186 | high | high | high | high | high | high | medium | high |
| 2187 | high | high | high | high | high | high | high | high |
| City | URI-I | City | URI-II | City | URI-III | City | URI | Rank |
|---|---|---|---|---|---|---|---|---|
| Heze | 0.6695 | Enshi | 0.3511 | Xiangxi | 0.6879 | Qingyuan | 0.6855 | 1 |
| Suihua | 0.5161 | Linyi | 0.3425 | Ningbo | 0.6798 | Heze | 0.6695 | 2 |
| Chongqing | 0.5000 | Xiangxi | 0.3423 | Nanning | 0.6764 | Xiangxi | 0.6561 | 3 |
| Shantou | 0.5000 | Lishui | 0.3397 | Heze | 0.6695 | Changzhou | 0.6533 | 4 |
| Zhoukou | 0.4944 | Shantou | 0.3384 | Kunming | 0.6671 | Handan | 0.6398 | 5 |
| Handan | 0.4826 | Harbin | 0.3378 | Qingyuan | 0.6650 | Ningbo | 0.6387 | 6 |
| Nanning | 0.4667 | Heze | 0.3374 | Shantou | 0.6625 | Linyi | 0.6373 | 7 |
| Linyi | 0.4255 | Zhongshan | 0.3368 | Wuxi | 0.6583 | Qingdao | 0.6346 | 8 |
| Dongguan | 0.4246 | Qingyuan | 0.3360 | Changzhou | 0.6533 | Wuxi | 0.6322 | 9 |
| Fuzhou | 0.4133 | Zhoukou | 0.3344 | Linyi | 0.6464 | Huizhou | 0.6293 | 10 |
| Changzhou | 0.4130 | Langfang | 0.3335 | Foshan | 0.6435 | Nanning | 0.6257 | 11 |
| Zhaoqing | 0.4077 | Xuzhou | 0.3333 | Guiyang | 0.6378 | Suzhou | 0.6195 | 12 |
| Qingyuan | 0.4045 | Tianjin | 0.3328 | Huizhou | 0.6333 | Suqian | 0.6063 | 13 |
| Shanghai | 0.3954 | Guiyang | 0.3324 | Zhongshan | 0.6277 | Foshan | 0.5932 | 14 |
| Hefei | 0.3935 | Zhengzhou | 0.3315 | Qingdao | 0.6260 | Wenzhou | 0.5872 | 15 |
| Guiyang | 0.3912 | Hangzhou | 0.3313 | Suzhou | 0.6208 | Jinan | 0.5719 | 16 |
| Kunming | 0.3888 | Handan | 0.3310 | Suqian | 0.6174 | Nanjing | 0.5685 | 17 |
| Zhengzhou | 0.3879 | Ningbo | 0.3306 | Shangrao | 0.6158 | Zhengzhou | 0.5454 | 18 |
| Beijing | 0.3871 | Changzhou | 0.3305 | Wenzhou | 0.5917 | Changsha | 0.5433 | 19 |
| Foshan | 0.3778 | Huizhou | 0.3290 | Hefei | 0.5660 | Shangrao | 0.5319 | 20 |
| Enshi | 0.3707 | Weifang | 0.3284 | Zhoukou | 0.5567 | Enshi | 0.5173 | 21 |
| Jiaxing | 0.3680 | Shanghai | 0.3281 | Chongqing | 0.5304 | Xuzhou | 0.5151 | 22 |
| Wenzhou | 0.3641 | Shenzhen | 0.3281 | Changsha | 0.5233 | Weifang | 0.5062 | 23 |
| Huizhou | 0.3636 | Xianyang | 0.3277 | Jiaxing | 0.5127 | Zhaoqing | 0.5000 | 24 |
| Jinan | 0.3626 | Dongguan | 0.3274 | Xuzhou | 0.5115 | Shanghai | 0.5000 | 25 |
| Qingdao | 0.3597 | Qingdao | 0.3261 | Weifang | 0.5062 | Suihua | 0.5000 | 26 |
| Zhongshan | 0.3589 | Shangrao | 0.3254 | Shenzhen | 0.5000 | Guangzhou | 0.5000 | 27 |
| Wuxi | 0.3581 | Suqian | 0.3251 | Zhengzhou | 0.5000 | Hefei | 0.5000 | 28 |
| Suqian | 0.3542 | Hefei | 0.3251 | Handan | 0.5000 | Guiyang | 0.5000 | 29 |
| Hangzhou | 0.3512 | Kunming | 0.3248 | Zhaoqing | 0.5000 | Shenzhen | 0.5000 | 30 |
| Lishui | 0.3475 | Chongqing | 0.3245 | Hangzhou | 0.4878 | Zhoukou | 0.5000 | 31 |
| Wuhan | 0.3445 | Changsha | 0.3239 | Fuzhou | 0.4775 | Chongqing | 0.5000 | 32 |
| Chengdu | 0.3416 | Fuzhou | 0.3234 | Nanjing | 0.4623 | Jiaxing | 0.4951 | 33 |
| Shaoguan | 0.3382 | Nanjing | 0.3233 | Chengdu | 0.4599 | Kunming | 0.4941 | 34 |
| Harbin | 0.3378 | Shaoguan | 0.3231 | Dongguan | 0.4461 | Hangzhou | 0.4878 | 35 |
| Weifang | 0.3377 | Chengdu | 0.3229 | Jinan | 0.4308 | Fuzhou | 0.4800 | 36 |
| Xianyang | 0.3353 | Wenzhou | 0.3224 | Guangzhou | 0.4236 | Shantou | 0.4598 | 37 |
| Suzhou | 0.3348 | Guangzhou | 0.3212 | Enshi | 0.3824 | Beijing | 0.4276 | 38 |
| Shenzhen | 0.3342 | Zhaoqing | 0.3203 | Shaoguan | 0.3680 | Shaoguan | 0.4096 | 39 |
| Xuzhou | 0.3333 | Xian | 0.3202 | Shaoxing | 0.3649 | Dongguan | 0.4081 | 40 |
| Tianjin | 0.3328 | Beijing | 0.3200 | Lishui | 0.3538 | Tianjin | 0.4045 | 41 |
| Nanjing | 0.3322 | Suzhou | 0.3199 | Wuhan | 0.3511 | Xian | 0.3987 | 42 |
| Langfang | 0.3311 | Suihua | 0.3193 | Xian | 0.3442 | Chengdu | 0.3734 | 43 |
| Shangrao | 0.3271 | Foshan | 0.3192 | Shanghai | 0.3439 | Xianyang | 0.3720 | 44 |
| Xiangxi | 0.3222 | Wuhan | 0.3144 | Suihua | 0.3421 | Zhongshan | 0.3650 | 45 |
| Changsha | 0.3217 | Wuxi | 0.3095 | Beijing | 0.3384 | Harbin | 0.3554 | 46 |
| Ningbo | 0.3212 | Nanning | 0.3094 | Harbin | 0.3378 | Wuhan | 0.3512 | 47 |
| Xian | 0.3202 | Shaoxing | 0.3071 | Tianjin | 0.3328 | Lishui | 0.3455 | 48 |
| Guangzhou | 0.3175 | Jiaxing | 0.3019 | Langfang | 0.3311 | Langfang | 0.3311 | 49 |
| Shaoxing | 0.3161 | Jinan | 0.2928 | Xianyang | 0.3257 | Shaoxing | 0.3303 | 50 |
Disclaimer/Publisher’s Note: The statements, opinions and data contained in all publications are solely those of the individual author(s) and contributor(s) and not of MDPI and/or the editor(s). MDPI and/or the editor(s) disclaim responsibility for any injury to people or property resulting from any ideas, methods, instructions or products referred to in the content. |
© 2023 by the authors. Licensee MDPI, Basel, Switzerland. This article is an open access article distributed under the terms and conditions of the Creative Commons Attribution (CC BY) license (https://creativecommons.org/licenses/by/4.0/).
Share and Cite
Wang, H.; Wang, M.; Yang, R.; Yang, H. Urban Resilience of Important Node Cities in Population Migration under the Influence of COVID-19 Based on Mamdani Fuzzy Inference System. Sustainability 2023, 15, 14401. https://doi.org/10.3390/su151914401
Wang H, Wang M, Yang R, Yang H. Urban Resilience of Important Node Cities in Population Migration under the Influence of COVID-19 Based on Mamdani Fuzzy Inference System. Sustainability. 2023; 15(19):14401. https://doi.org/10.3390/su151914401
Chicago/Turabian StyleWang, Huilong, Meimei Wang, Rong Yang, and Huijuan Yang. 2023. "Urban Resilience of Important Node Cities in Population Migration under the Influence of COVID-19 Based on Mamdani Fuzzy Inference System" Sustainability 15, no. 19: 14401. https://doi.org/10.3390/su151914401
APA StyleWang, H., Wang, M., Yang, R., & Yang, H. (2023). Urban Resilience of Important Node Cities in Population Migration under the Influence of COVID-19 Based on Mamdani Fuzzy Inference System. Sustainability, 15(19), 14401. https://doi.org/10.3390/su151914401