
Spatiotemporal Dynamic Analysis and Simulation Prediction of Land Use and Landscape Patterns from the Perspective of Sustainable Development in Tourist Cities
Abstract
:1. Introduction
2. Materials and Methods
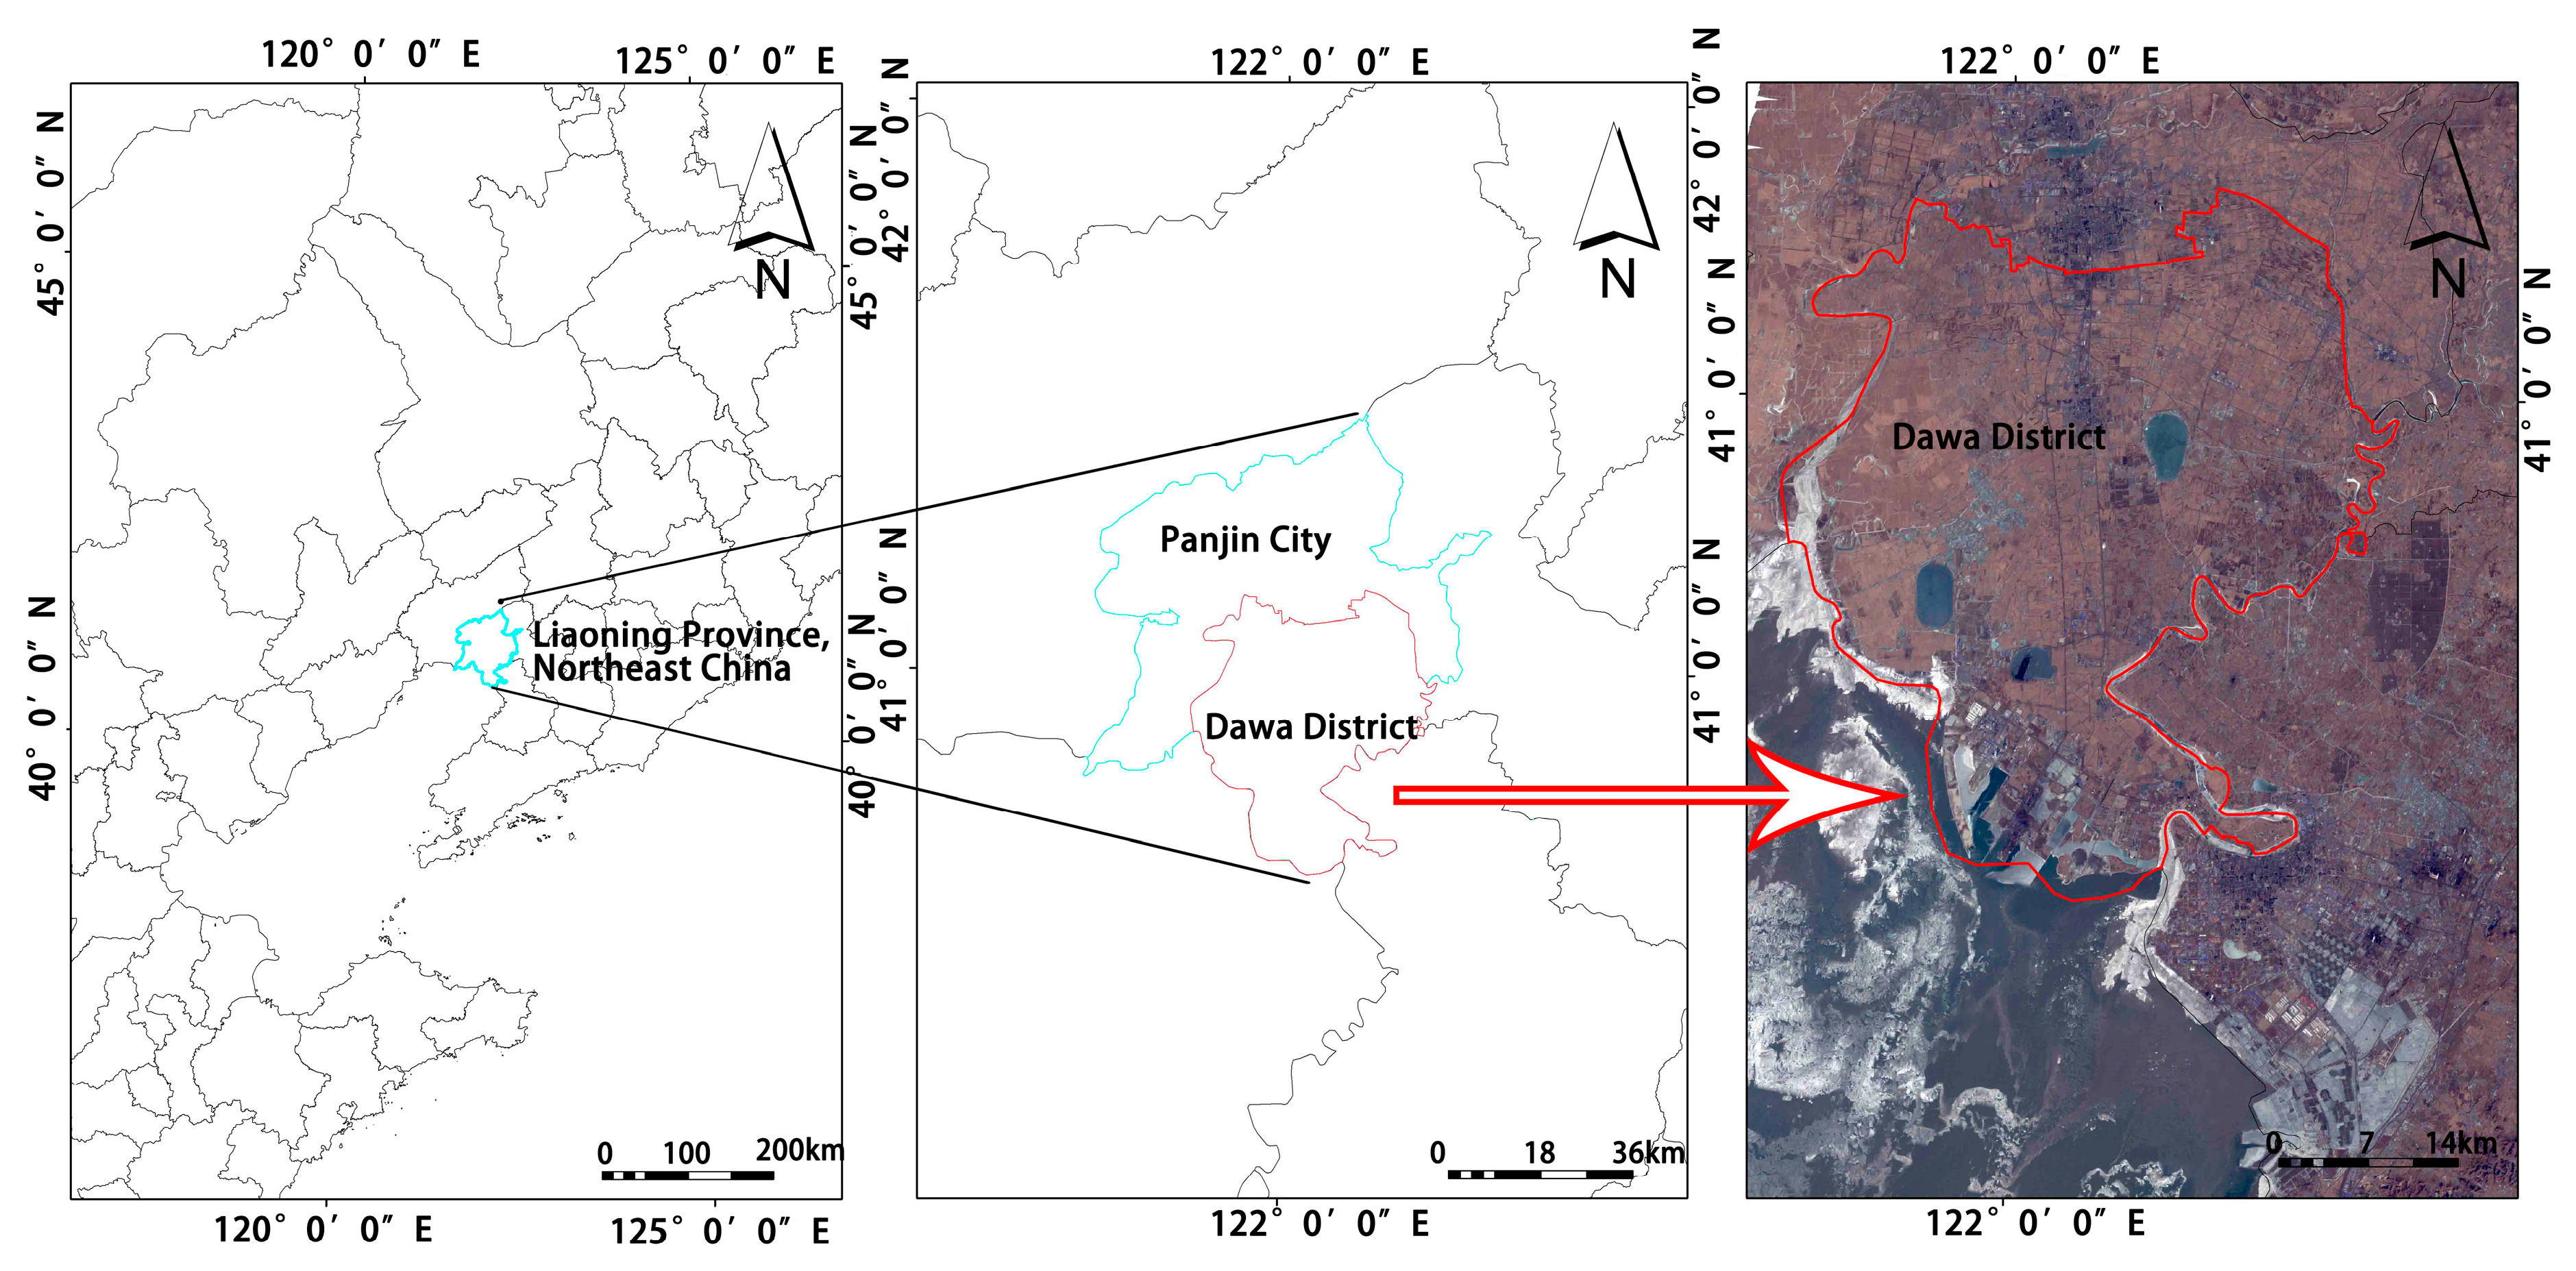
2.1. Study Area and Data Sources
2.2. Preprocessing and LUCC Classification of Satellite Images
2.2.1. Image Preprocessing
- To begin with, a considerable number of band ripples in the Landsat7 data collected in the study hampered observation and analysis. Therefore, ENVI 5.3 software was used for Landsat strip restoration (Landsat_Gapfill) to create a complete satellite image free of ripple gaps.
- Due to the influence of atmospheric radiation, the velocity angle, and cloud conditions, there will be numerous variations in the initial state of satellite images captured by satellite, which cannot be used directly for research analysis. Before applying the analysis, data are necessary for radiative calibration (RC) and atmospheric correction (QUAC). Thus, the RC and QUAC modules in ENVI 5.3 were utilized to modify and correct the radiation values in remote sensing images as well as eliminate the impact of the atmosphere on remote sensing images. Consequently, more precise surface reflectivity data were obtained.
- Typically, the downloaded satellite images cannot contain the entirety of the study area, necessitating the use of multiple satellite images for composite processing. After applying the aforementioned geometric corrections, the satellite image’s coordinate system unifies them. ENVI 5.3 software was used for the image inlay operation, uniform color fusion, and cutting of the research area, thereby completing the preprocessing of remote sensing images [28]. Finally, a satellite image data collection with numerous bands and the ability to differentiate image content was created.
2.2.2. LUCC Classification of Satellite Images
2.3. Research Methods
2.3.1. Geographic Information System’s Spatial Analysis
2.3.2. Selection of Landscape Indices
2.3.3. CA–Markov Model
3. Results
3.1. The Spatiotemporal Evolution Characteristics of LUCC
3.2. Spatiotemporal Simulation of LUCC
3.2.1. Evolutionary Driver Factor Analysis
- 1.
- Population and Economy
- 2.
- Folk Culture
- 3.
- Policies and Regulations
3.2.2. MCE-Based Suitability Atlas Production
3.2.3. CA–Markov Accuracy Calibration
3.2.4. 2026 LUCC Projection and Simulation
3.3. Analysis of Spatiotemporal Changes of Landscape Pattern Characteristic
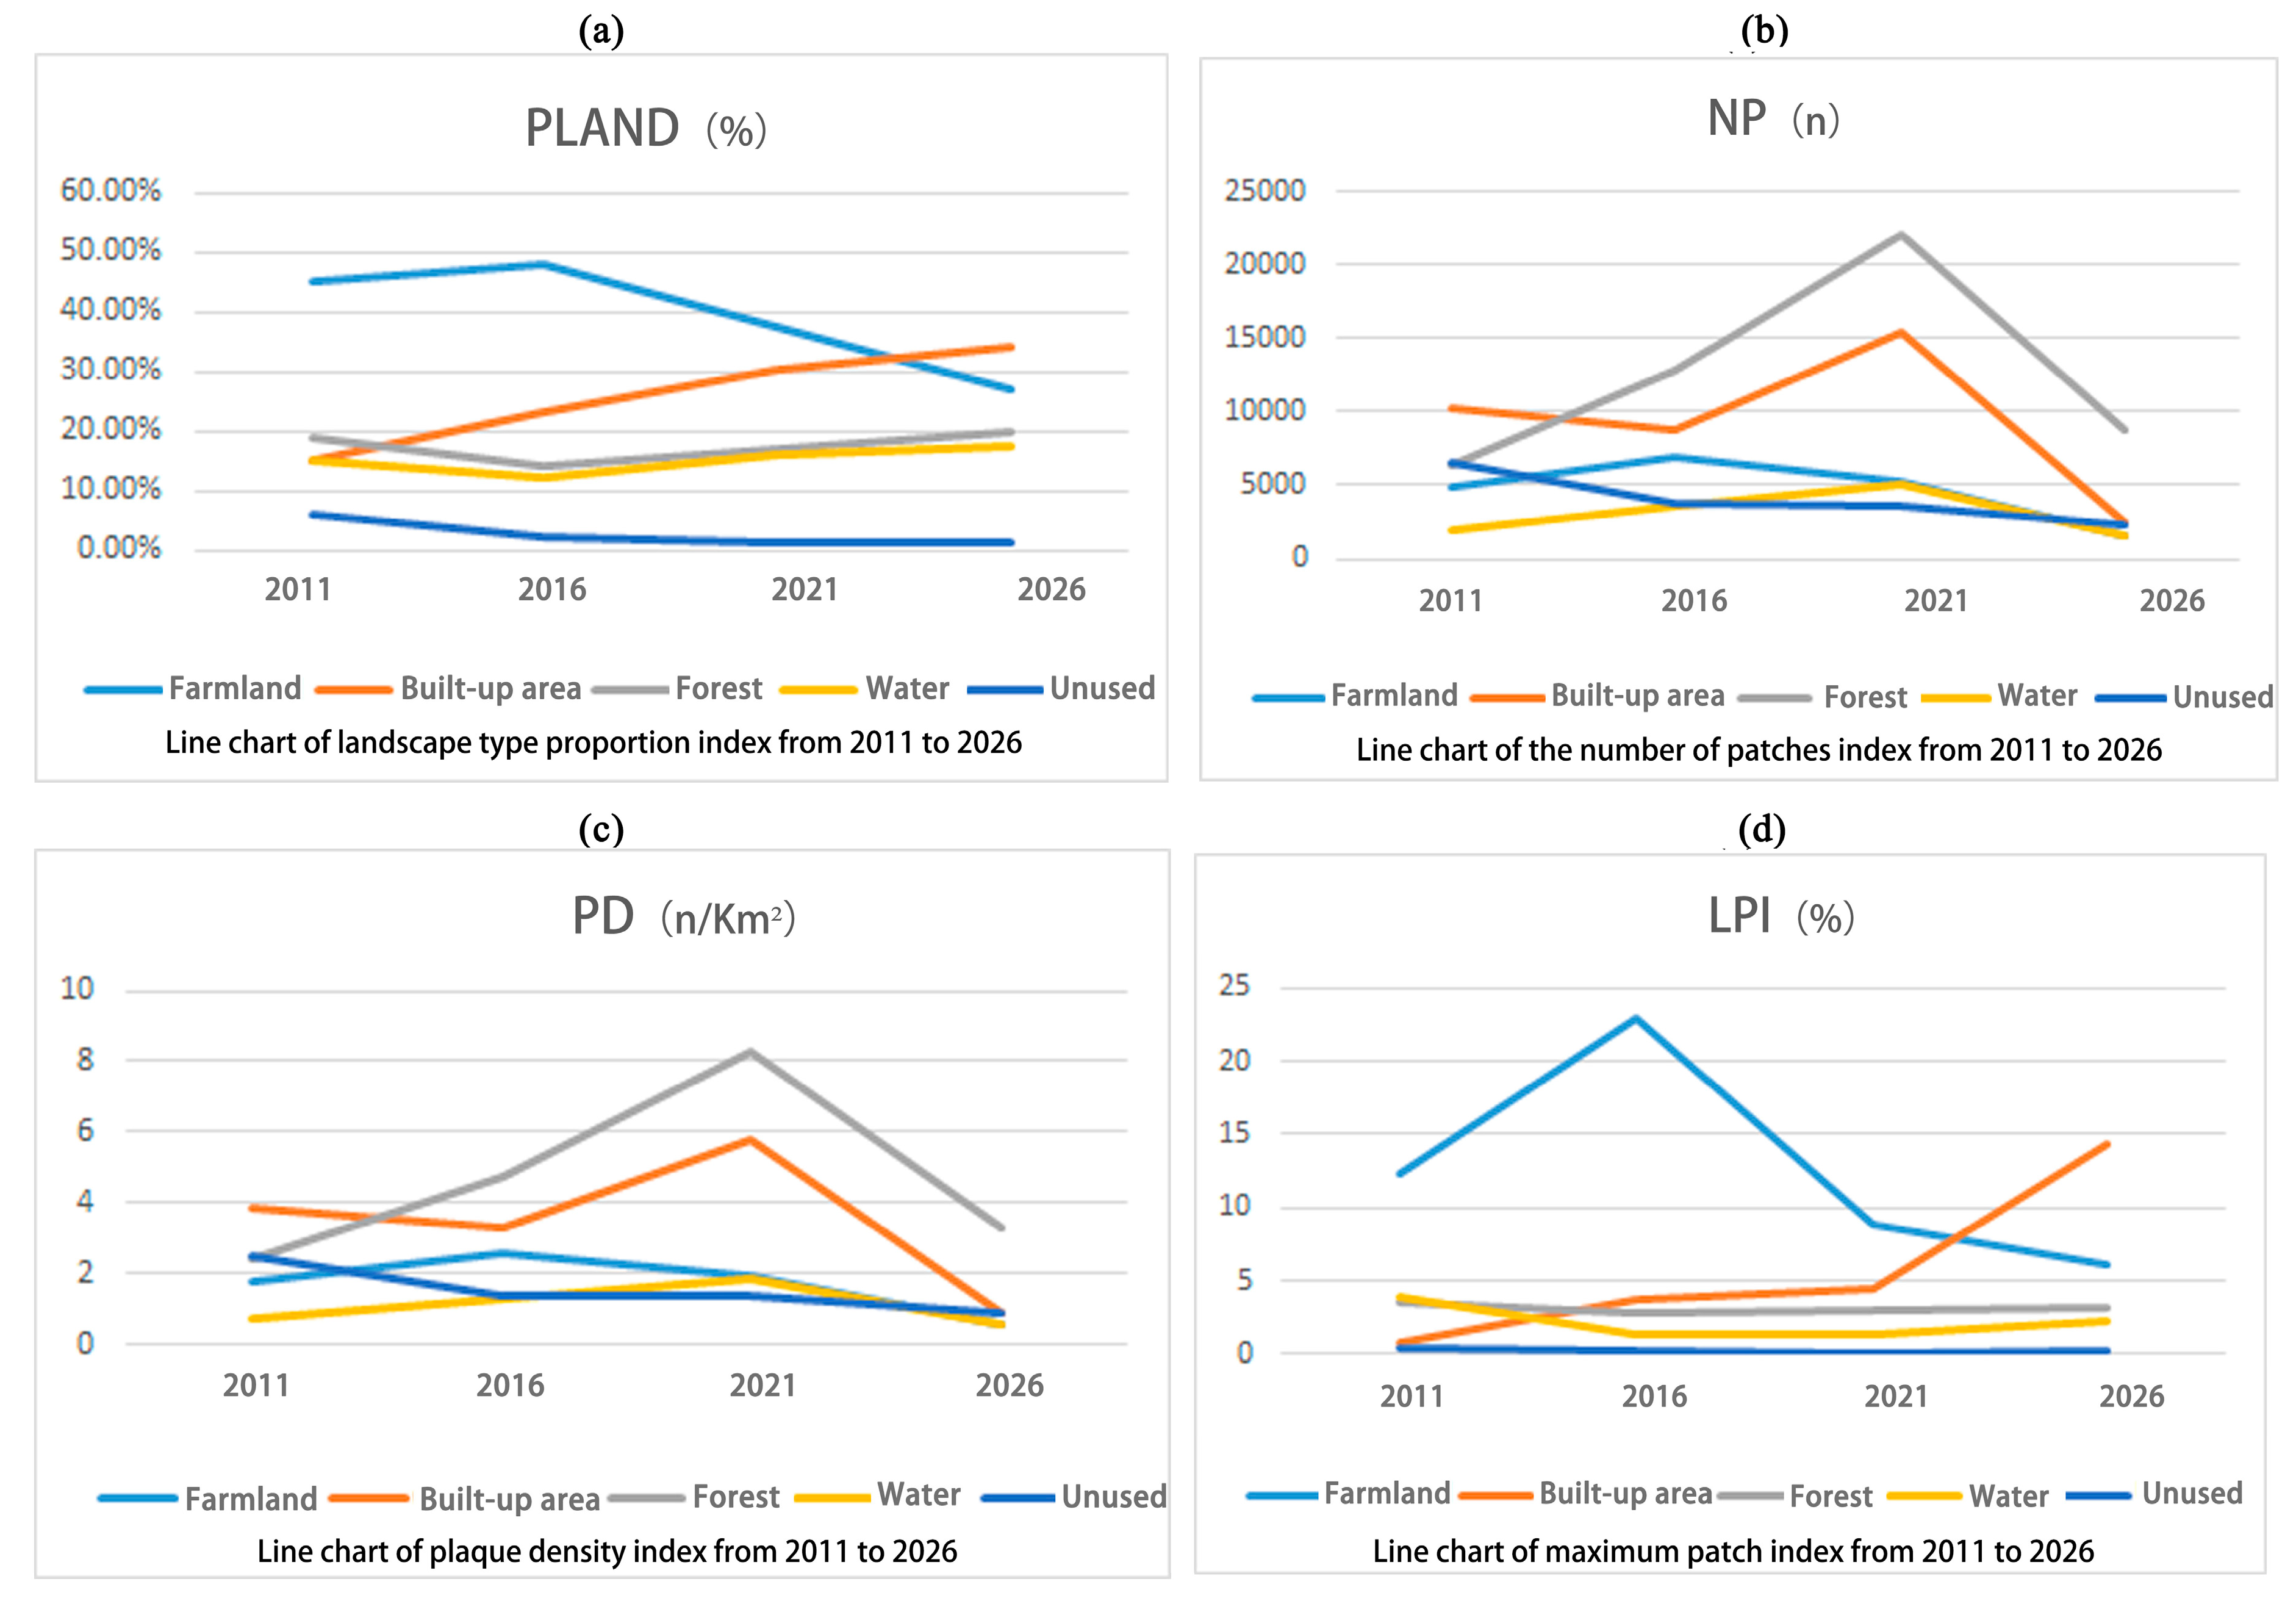
3.3.1. Area Characteristics Analysis
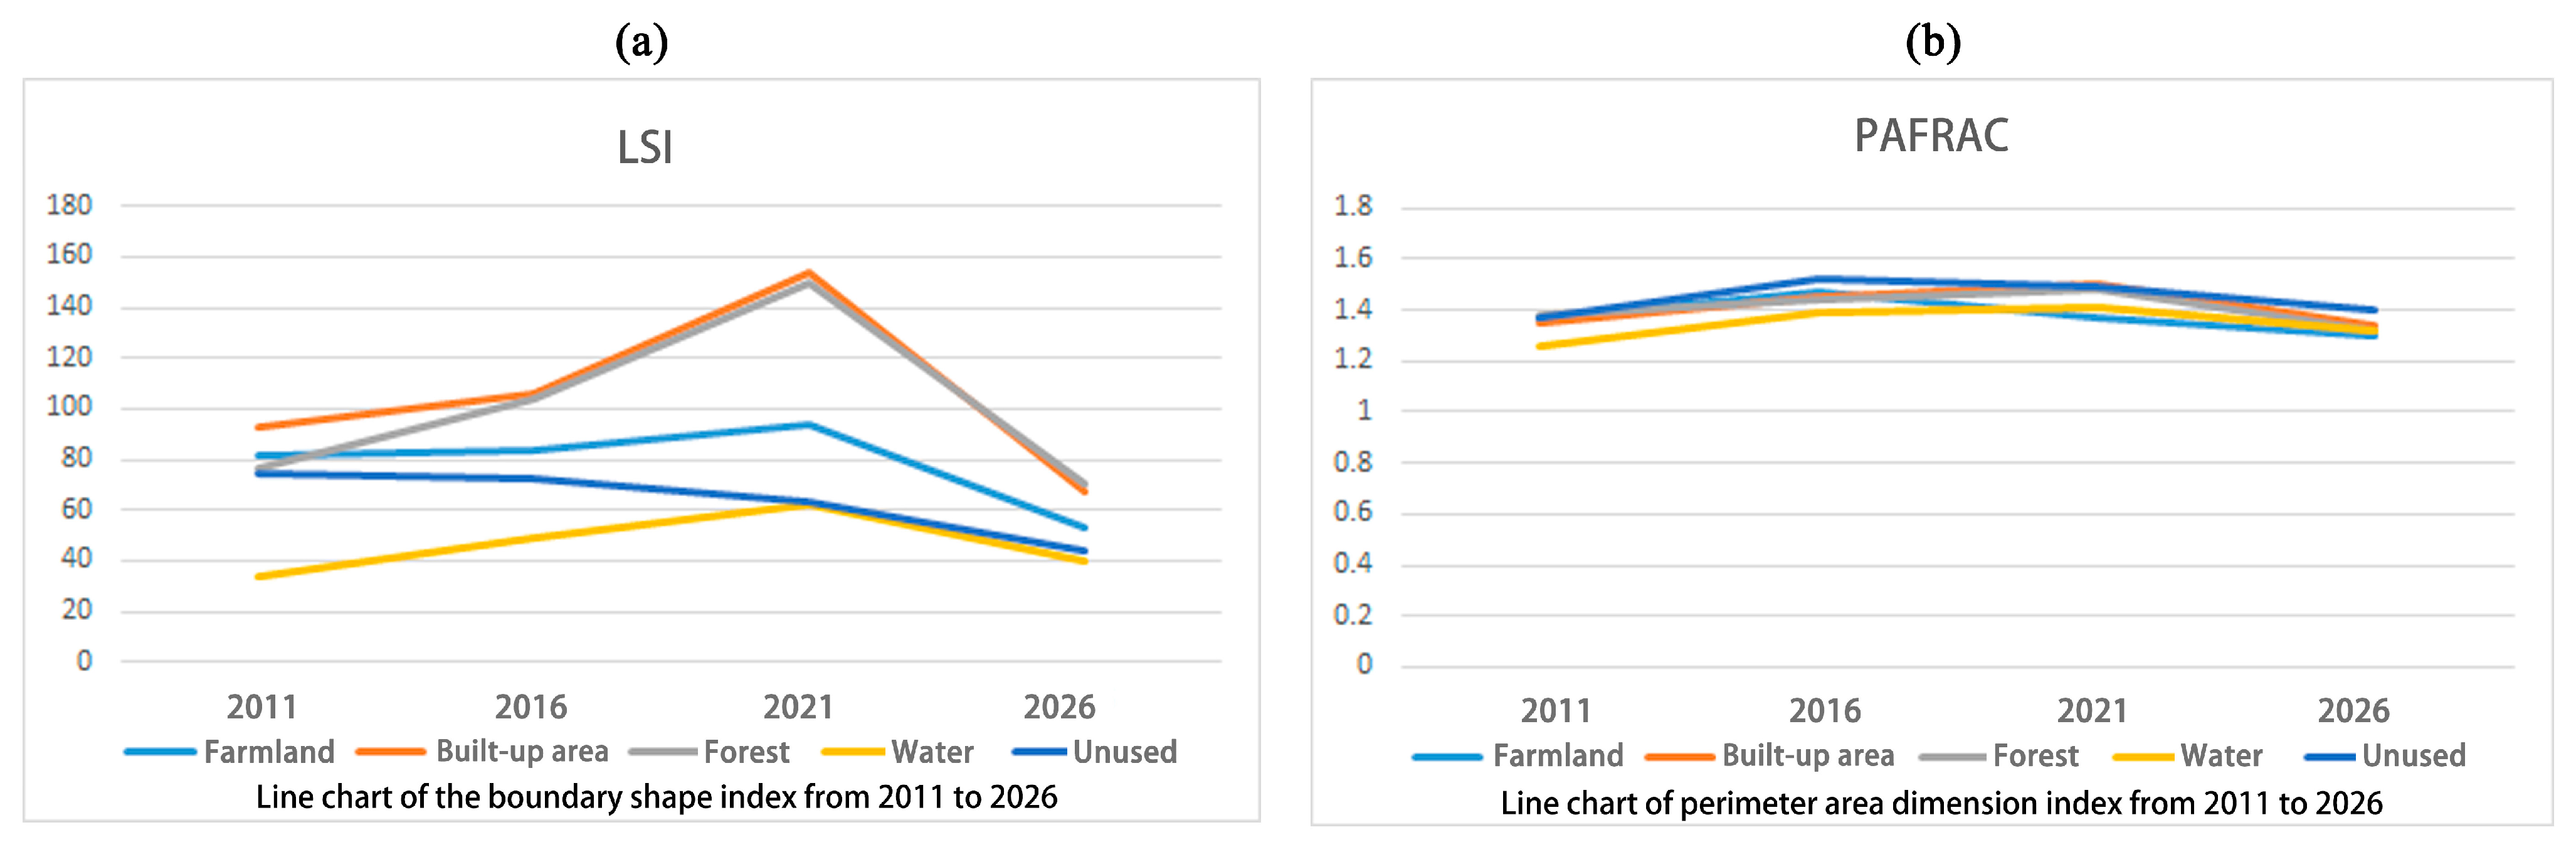
3.3.2. Boundary Shape Characteristics
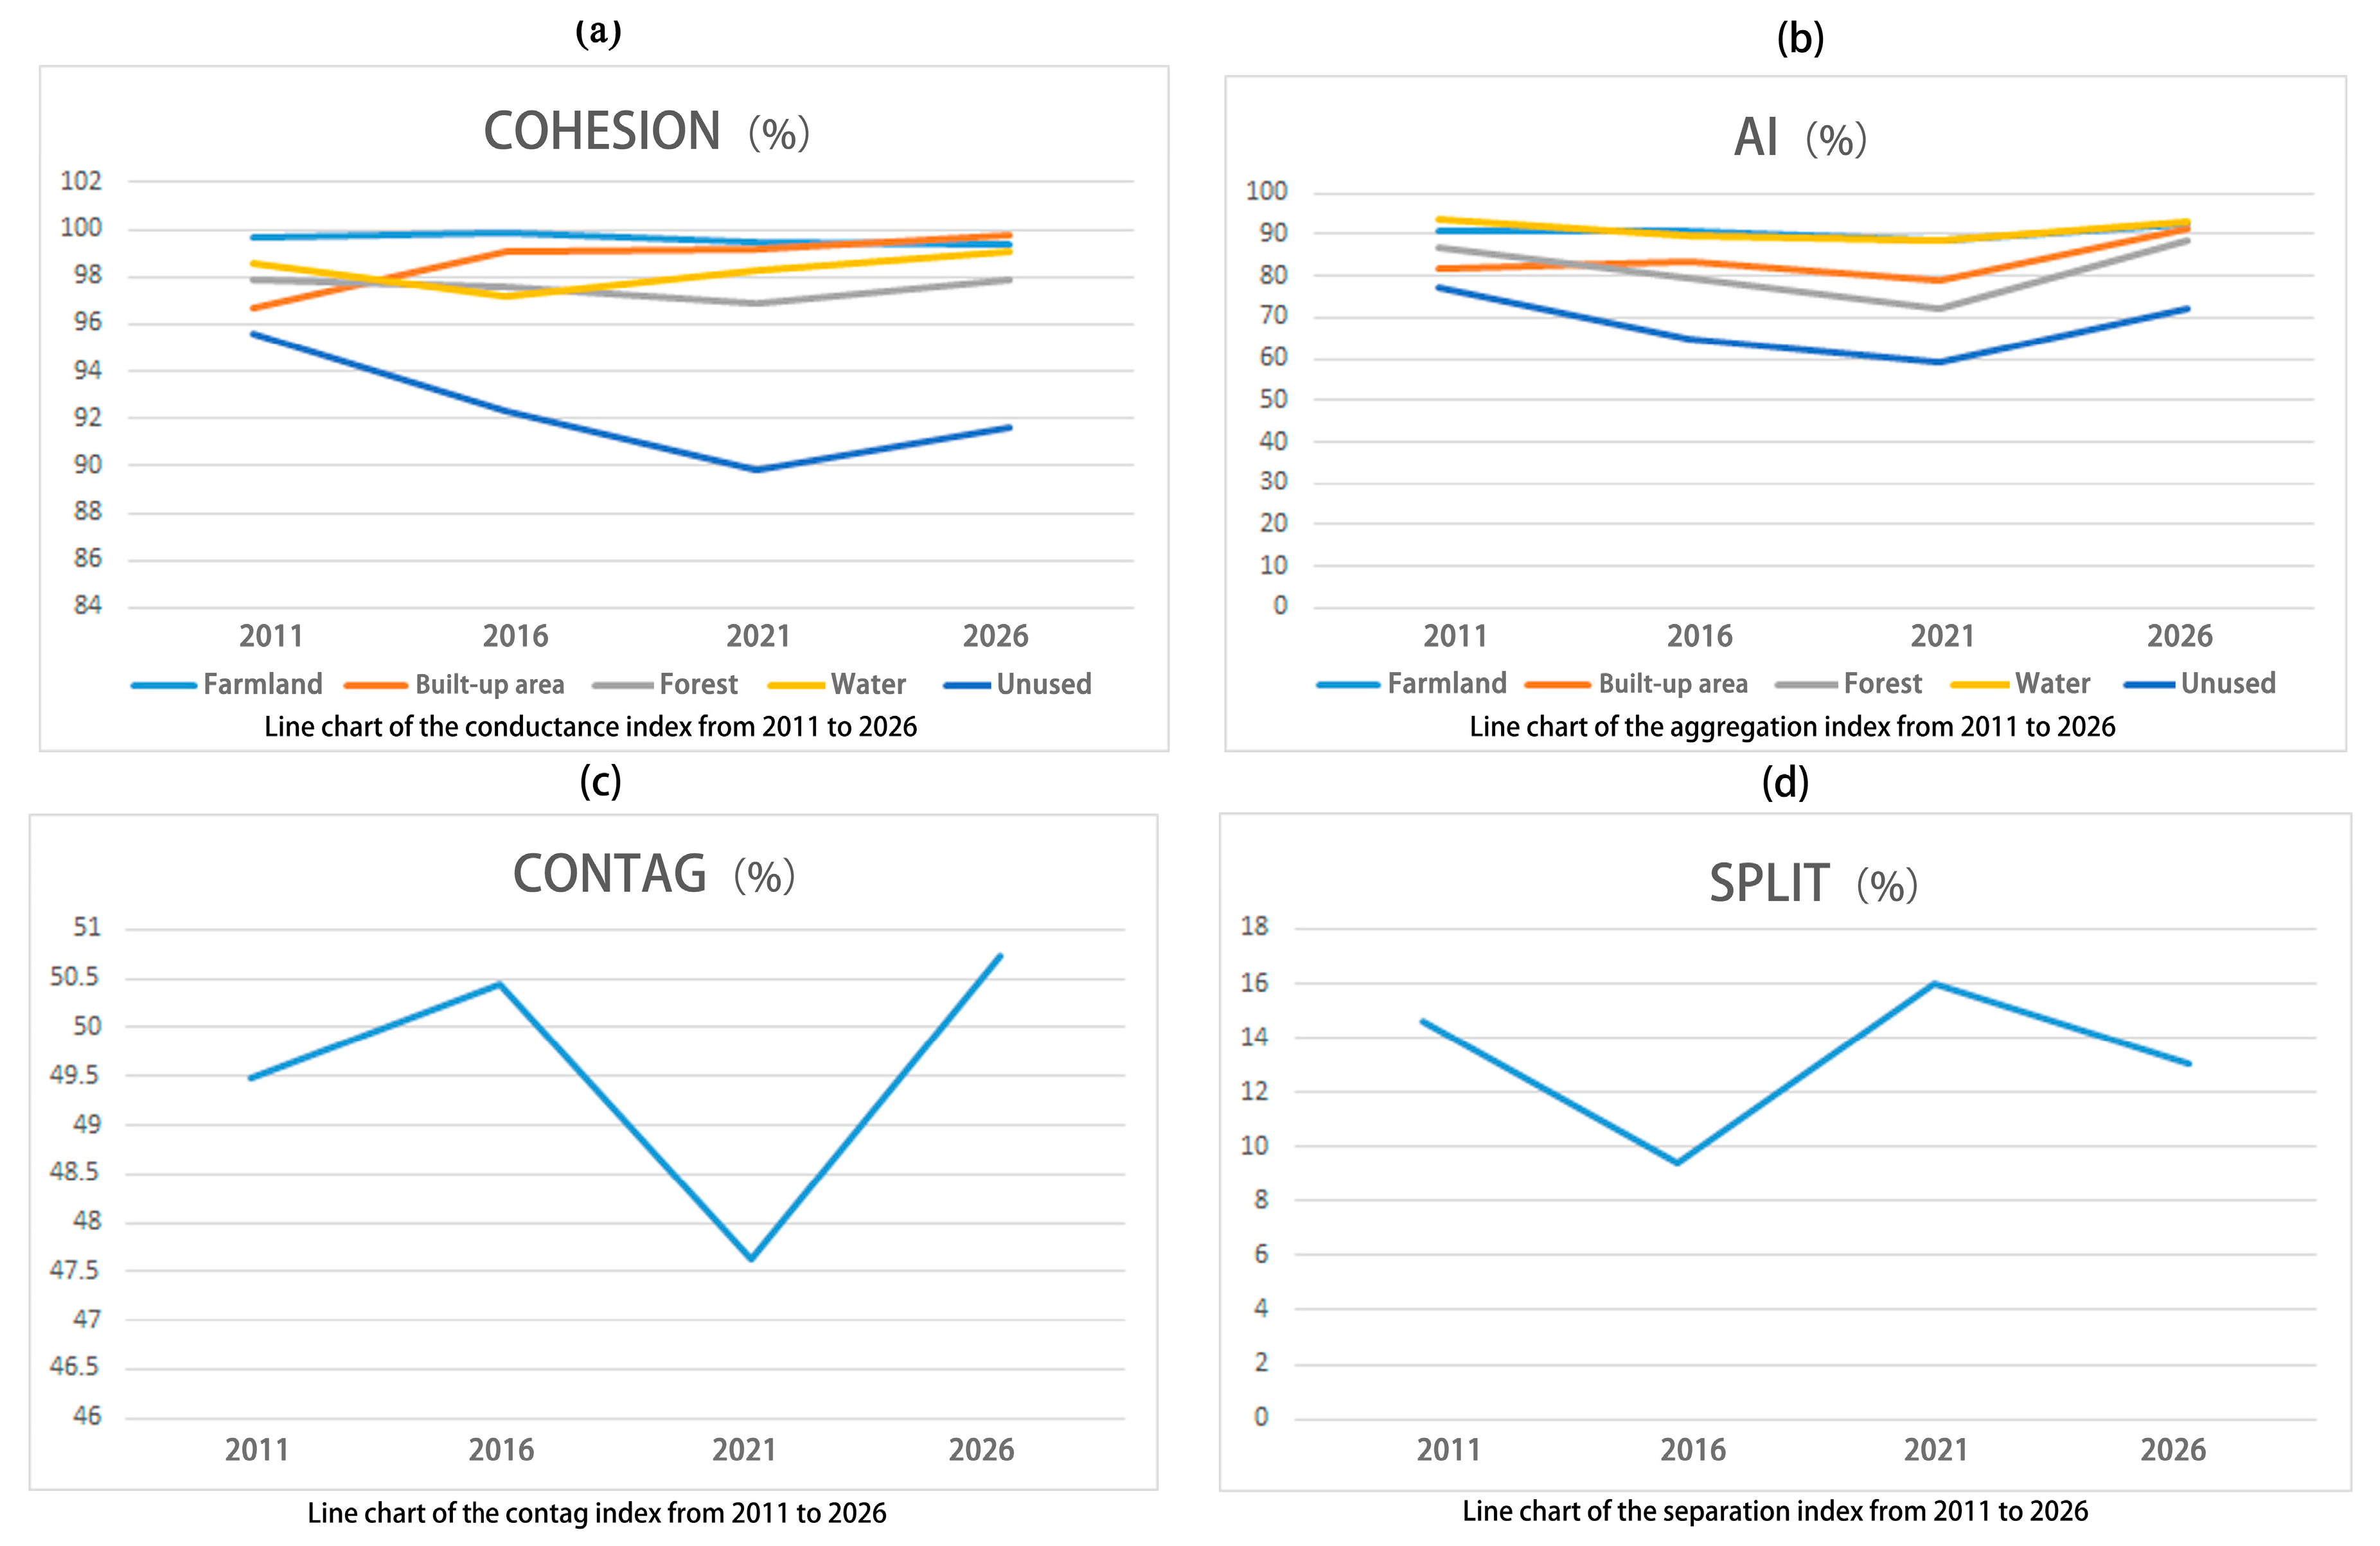
3.3.3. Connectivity Characteristics Analysis
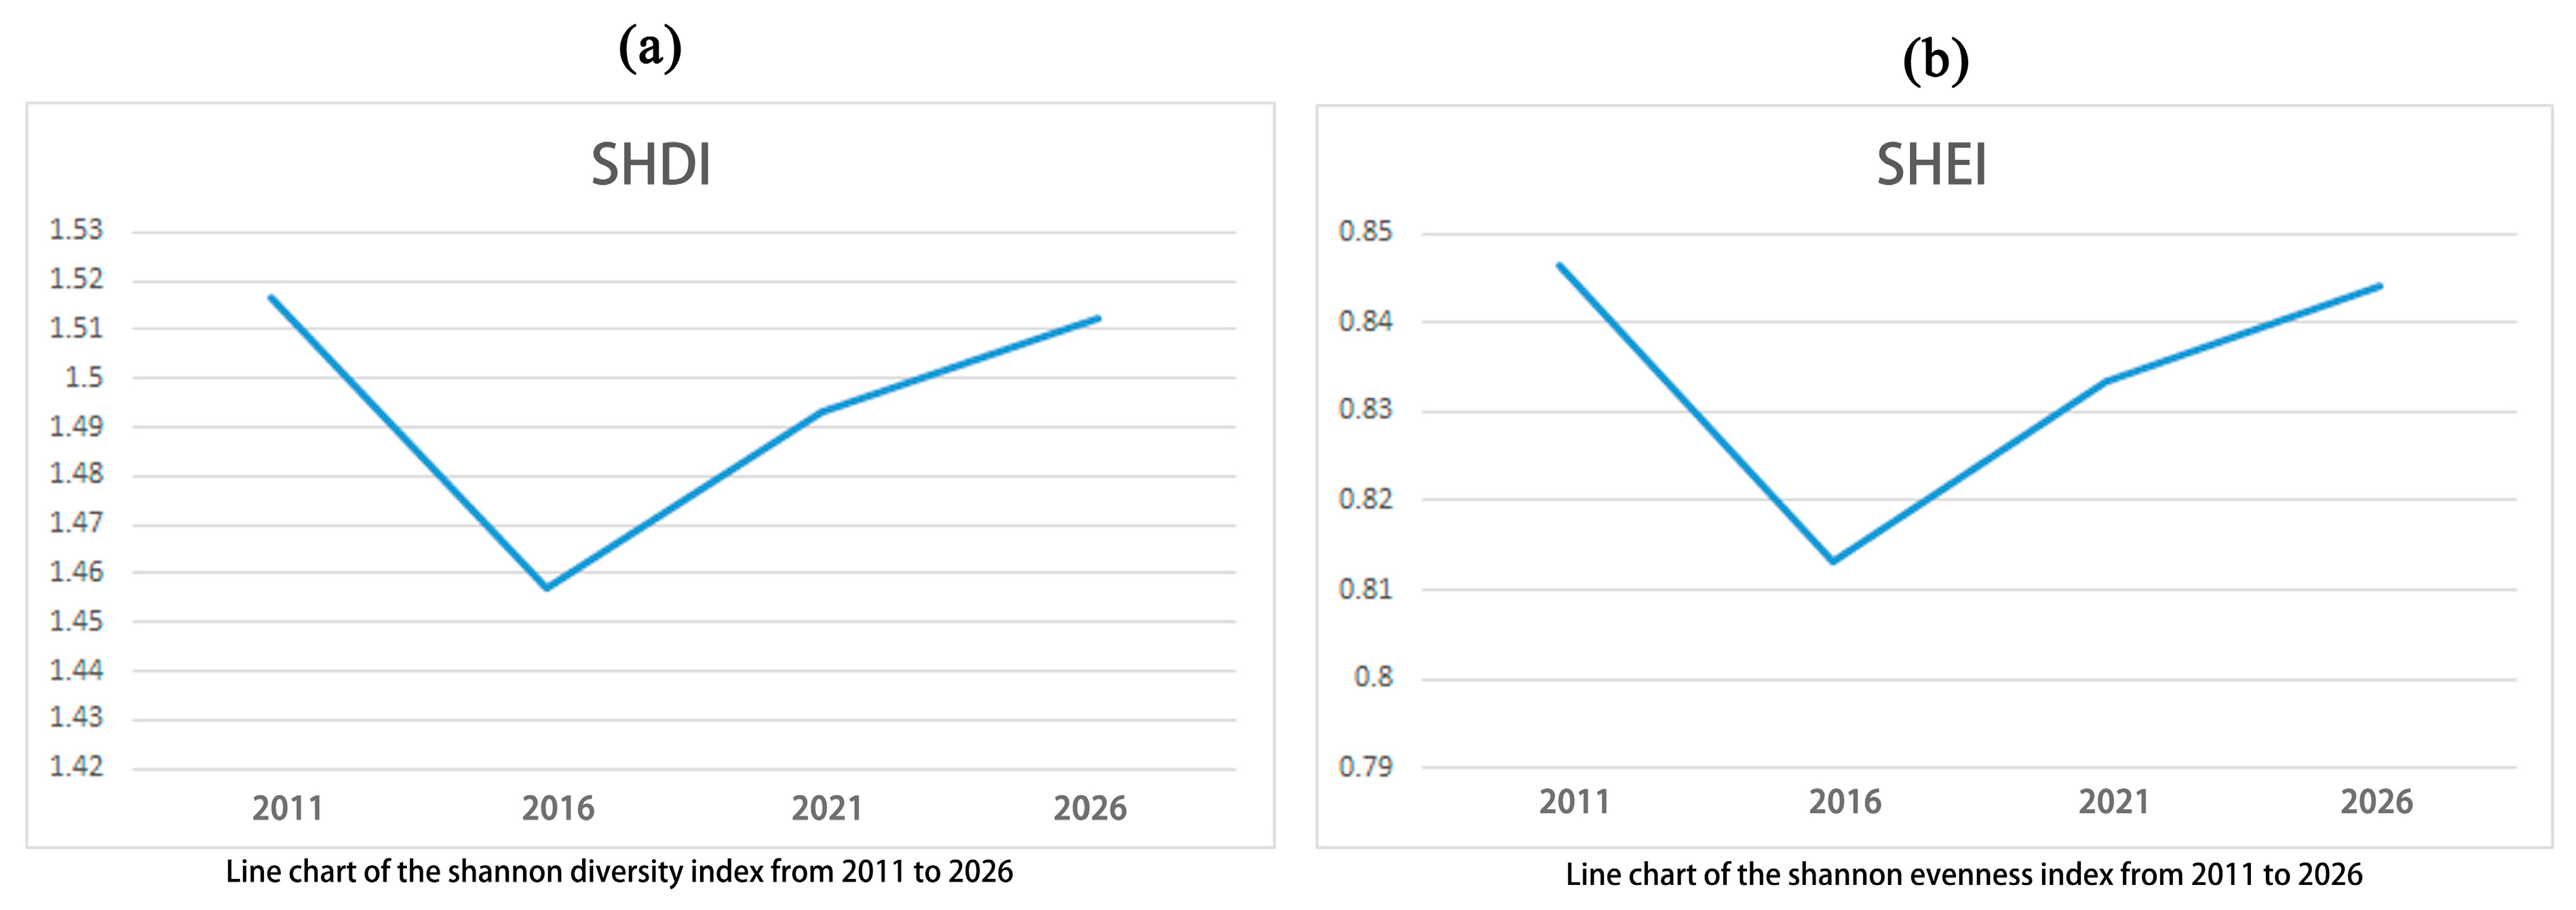
3.3.4. Diversity Characteristics Analysis
4. Discussion
4.1. The Spatiotemporal Evolution Characteristics of the Research Area from the Perspective of Regional Tourism
4.2. Simulation and Prediction Analysis of Land Use and Landscape Patterns in 2026
4.3. Land Structure Optimization Strategies from the Perspective of Regional Tourism
4.3.1. The Government Regulates the Expansion of Building Land
4.3.2. Protect Farmland and Optimize Land Use
4.3.3. Construct the Ecological Corridor Network for Forest Land and Water Areas
5. Conclusions
Author Contributions
Funding
Data Availability Statement
Acknowledgments
Conflicts of Interest
References
- Guan, J.J. Research on Landscape Renewal Strategy of Korean Traditional Villages in Yanbian under the Background of Regional Tourism. Master’s Thesis, Shenyang Jianzhu University, Shenyang, China, 2021. [Google Scholar]
- Yuan, Y.; Zhou, J.; Cheng, X.; Luo, B.; He, J.H. Analysis of the regional tourism development planning of Liuzhou city. Planner 2022, 12, 161–168. [Google Scholar]
- Randelli, F.; Martellozzo, F. Is rural tourism-induced built-up growth a threat for the sustainability of rural areas? The case study of Tuscany. Land Use Policy 2019, 86, 387–398. [Google Scholar] [CrossRef]
- Fons, M.V.S.; Fierro, J.A.M.; Patino, M.G.Y. Rural tourism: A sustainable alternative. Appl. Energy 2011, 88, 551–557. [Google Scholar] [CrossRef]
- Boavida-Portugal, J.F.C.C. Exploring the impacts of future tourism development on land use/cover changes. Appl. Geogr. 2016, 77, 82–91. [Google Scholar] [CrossRef]
- Zhao, J.; Liu, S.; Wang, Z.; Gao, H.; Feng, S.; Wei, B.; Hou, Z.; Xiao, F.; Jing, L.; Liao, X. The impact of land use and landscape pattern on ecosystem services in the dongting lake region, china. Remote Sens. 2023, 15, 2228. [Google Scholar] [CrossRef]
- Zhao, L.; Liu, M. Review and prospect of the development of “regional tourism” from the dual perspective of theory and practice. Bus. Econ. Res. 2018, 10, 183–185. [Google Scholar]
- Moinet, F. Le Tourisme Rural: Comment Créer; Editions France Agricolc: Paris, France, 1993. [Google Scholar]
- Tirnaki, A.; Zhanci, E.; Aklibainda, M. Agricultural landscape pattern and agricultural tourism potential of Nevsehir. Akad. Ziraat Derg. 2018, 7, 237–244. [Google Scholar] [CrossRef]
- Mohammadyari, F.; Pourkhabbaz, H.R.; Aghdar, H.; Tavakoly, M. Modeling land use pattern, city Behbahan city in the period 2000–2028 using remote sensing and GIS. Environ. Res. 2021, 9, 223–238. [Google Scholar]
- Liu, J.; Wang, J.; Wang, S.; Wang, J.; Deng, G. Analysis and simulation of the spatiotemporal evolution pattern of tourism lands at the Natural World Heritage Site Jiuzhaigou, China. Habitat Int. 2018, 79, 74–88. [Google Scholar] [CrossRef]
- Aronsson, L. Sustainable tourism systems: The example of sustainable rural tourism in sweden. J. Sustain. Tour. 2009, 2, 77–92. [Google Scholar] [CrossRef]
- Trono, A.; Castronuovo, V. Cultural landscape and sustainable tourism in rural areas. Case studies from the Puglia region in Southern Italy. In Proceedings of the Budapest International Conference on Tourism and Cultural Landscapes: Towards a Sustainable Approach an English Language Exchange of Experiences, Budapest, Hungary, 12–16 June 2016. [Google Scholar]
- Yang, Z. The connotation of regional tourism and the stage of its development. J. Tour. 2016, 31, 3. [Google Scholar]
- Mao, F. All-region rural tourism: The road and path of rural revitalization in the new era. Agric. Econ. 2019, 1, 3. [Google Scholar]
- Liu, L. Regional tourism of the rural revitalization strategy: An analytical framework. Reform 2017, 12, 13. [Google Scholar]
- Singh, S.K.; Mustak, S.; Srivastava, P.K.; Szabó, S.; Islam, T. Predicting Spatial, Decadal LULC Changes Through Cellular Automata Markov Chain Models Using Earth Observation Datasets and Geo-information. Environ. Process. 2015, 2, 61–78. [Google Scholar] [CrossRef]
- Choudhary, K.; Boori, M.S.; Kupriyanov, A. Spatial modelling for natural and environmental vulnerability through remote sensing and gis in astrakhan, russia. Egypt. J. Remote Sens. Space Sci. 2018, 21, 139–147. [Google Scholar] [CrossRef]
- Li, H.; Peng, J.; Liu, Y.; Hu, Y. Urbanization impact on landscape patterns in Beijing City, China: A spatial heterogeneity perspective. Ecol. Indic. 2017, 82, 50–60. [Google Scholar] [CrossRef]
- Min, K.; Song, K.; Chon, J. Key coastal landscape patterns for reducing flood vulnerability. Sci. Total Environ. 2020, 759, 143454. [Google Scholar]
- Arora, A.; Pandey, M.; Mishra, V.N.; Kumar, R.; Rai, P.K.; Costache, R.; Punia, M.; Di, L. Comparative evaluation of geospatial scenario-based land change simulation models using landscape metrics. Ecol. Indic. 2021, 128, 107810. [Google Scholar] [CrossRef]
- Ajeeb, R.; Aburas, M.M.; Baba, F.; Ali, A.; Alazaiza, M.Y. The Prediction of Urban Growth Trends and Patterns using Spatio-temporal CA-MC Model in Seremban Basin. IOP Conf. Ser. Earth Environ. Sci. 2020, 540, 012028. [Google Scholar] [CrossRef]
- Fu, F.; Deng, S.; Wu, D.; Liu, W.; Bai, Z. Research on the spatiotemporal evolution of land use landscape pattern in a county area based on CA-Markov model. Sustain. Cities Soc. 2022, 80, 103760. [Google Scholar] [CrossRef]
- Zhou, K.Y. Evolution Characteristics and Optimization Strategies of Rural Landscape Pattern in the Suburbs of Central Cities. Master’s Thesis, Huazhong University of Science and Technology, Wuhan, China, 2016. [Google Scholar]
- Liu, W.W. Research on the Evolution and Optimization of Township Landscape Ecological Pattern in the Ecologically Fragile Area of Western Sichuan. Master’s Thesis, Southwest Jiaotong University, Chengdu, China, 2021. [Google Scholar]
- Xiong, X. Research on the Planning and Implementation Strategy of Leisure Agriculture and Rural Tourism Project in Dawa District, Panjin City. Master’s Thesis, Jilin University, Jilin, China, 2017. [Google Scholar]
- Wang, Y.; Wu, K.; Gao, W. Monitoring the changes in land use and landscape pattern in recent 20 years: A case study in Wuhan, China. E3S Web Conf. 2021, 272, 01022. [Google Scholar] [CrossRef]
- Deng, J.S.; Ke, W.; Yang, H.; Qi, J. Spatio-temporal dynamics and evolution of land use change and landscape pattern in response to rapid urbanization. Landsc. Urban Plan. 2009, 92, 187–198. [Google Scholar] [CrossRef]
- Yi, S.-Y.; Li, Q.-Z.; Wu, J.-M.; Xu, D.; Wu, Z.-B.; Zhou, Q.-H. Study on spatial-temporal changes of landscape pattern of land use in yichang-wuhan section of the yangtze river in recent 20 years. Acta Hydrobiol. Sin. 2021, 45, 1308–1315. [Google Scholar]
- Huang, M.; Li, Y.; Ran, C.; Li, M. Dynamic changes and transitions of agricultural landscape patterns in mountainous areas: A case study from the hinterland of the Three Gorges Reservoir Area. J. Geogr. Sci. 2022, 32, 1039–1058. [Google Scholar] [CrossRef]
- Lu, Y.; Laffan, S.; Pettit, C.; Cao, M. Land use change simulation and analysis using a vector cellular automata (CA) model: A case study of Ipswich City, Queensland, Australia. Environ. Plan. B Urban Anal. City Sci. 2019, 47, 1605–1621. [Google Scholar] [CrossRef]
- Memarian, H.; Balasundram, S.K.; Talib, J.B.; Sung, C.T.B.; Sood, A.M.; Abbaspour, K. Validation of ca-markov for simulation of land use and cover change in the langat basin, malaysia. J. Geogr. Inf. Syst. 2012, 44, 542–554. [Google Scholar] [CrossRef]
- Al-Hameedi, W.M.M.; Chen, J.; Faichia, C.; Nath, B.; Al-Shaibah, B.; Al-Aizari, A. Geospatial Analysis of Land Use/Cover Change and Land Surface Temperature for Landscape Risk Pattern Change Evaluation of Baghdad City, Iraq, Using CA–Markov and ANN Models. Sustainability 2022, 14, 8568. [Google Scholar] [CrossRef]
- Zhang, Q.; Chen, C.; Wang, J.; Yang, D.; Zhang, Y.; Wang, Z.; Gao, M. The spatial granularity effect, changing landscape patterns, and suitable landscape metrics in the Three Gorges Reservoir Area, 1995–2015. Ecol. Indic. 2020, 114, 106259. [Google Scholar] [CrossRef]
- Zhou, H.; Chen, Y.; Tian, R. Land-use conflict identification from the perspective of construction space expansion: An evaluation method based on ‘Likelihood-exposure-consequence’. ISPRS Int. J. Geo-Inform. 2021, 10, 433. [Google Scholar] [CrossRef]
- Huang, X.; Wang, H.; Shan, L.; Xiao, F. Constructing and optimizing urban ecological network in the context of rapid urbanization for improving landscape connectivity. Ecol. Indic. 2021, 132, 108319. [Google Scholar] [CrossRef]
- Falcucci, A.; Maiorano, L.; Boitani, L. Changes in land-use/land-coverpatterns in Italy and their implications for biodiversity conservation. Landsc. Ecol. 2007, 22, 617–631. [Google Scholar] [CrossRef]
- Zhou, Y.; Li, X.; Liu, Y. Rural land system reforms in China: History, issues, measures and prospects. Land Use Policy 2020, 91, 104330. [Google Scholar] [CrossRef]
- Zhou, Y.; Li, Y.; Xu, C. Land consolidation and rural revitalization in China: Mechanisms and paths. Land Use Policy 2020, 91, 10437. [Google Scholar] [CrossRef]
- Fantini, A.C.; Bauer, E.; De Valois, C.M.; Siddique, I. The demise of swidden-fallow agriculture in an atlantic rainforest region: Implications for farmers’ livelihood and conservation. Land Use Policy Int. J. Cover. All Asp. Land Use 2017, 69, 417–426. [Google Scholar] [CrossRef]
- Guariguata, M.R.; Sist, P.; Nasi, R. Multiple use management of tropical production forests: How can we move from concept to reality? For. Ecol. Manag. 2012, 263, 170–174. [Google Scholar] [CrossRef]
- Zhou, Y.; Li, X.; Liu, Y. Land use change and driving factors in rural China during the period 1995–2015. Land Use Policy 2020, 99, 105048. [Google Scholar] [CrossRef]
- Baggio, J.A.; Hillis, V. Managing ecological disturbances: Learning and the structure of social- ecological networks. Environ. Model. Softw. 2018, 109, 32–40. [Google Scholar] [CrossRef]


| Satellite | Sensor | Resolution (m) | Path/Row | Acquisition Date | Cloud Cover (%) | Bands |
|---|---|---|---|---|---|---|
| Landsat7 | ETM+ | 30 | 120/32 | 2011-05-26 | 8.03 | 8 |
| Landsat7 | ETM+ | 30 | 120/31 | 2011-10-01 | 27.05 | 8 |
| Landsat7 | ETM+ | 30 | 120/32 | 2016-08-11 | 21.1 | 8 |
| Landsat7 | ETM+ | 30 | 120/31 | 2016-08-27 | 0.97 | 8 |
| Landsat7 | ETM+ | 30 | 120/31 | 2021-06-06 | 1 | 8 |
| Landsat7 | ETM+ | 30 | 120/32 | 2021-07-24 | 2 | 8 |
| Land Type | Included Land Types |
|---|---|
| Built-up area | Urban and rural residential areas and other industrial and mining, transportation, and other land. |
| Forest | Forestry land that grows trees, vegetation, bamboo, and coastal mangroves. |
| Farmland | Cropland, including cultivated land, newly reclaimed land, leisure land, grass land, and crops; beach and marine land that has been cultivated for more than 3 years. |
| Water | Natural waters and land for water conservation facilities. |
| Unused | Currently undeveloped territory, including land that is difficult to use. |
| Land Type | Band Combination | Visual Interpretation | Corresponding Remote Sensing Image Samples |
|---|---|---|---|
| Built-up area | 6,5,3 | Gray-white, color block combination broken, square shape |  |
| Forest | 6,5,2 | Green or dark green, with patches continuous |  |
| Farmland | 5,4,3 | Yellow-green or yellow areas, regular and uniform shape |  |
| Water | 6,5,3 | Large area of dark blue images |  |
| Unused | 6,5,2 | Irregular shaped yellow and white areas, and color messy images |  |
| Land Type Comparison | 2011 Image | 2016 Image | 2021 Image |
|---|---|---|---|
| Built-up area and farmland Built-up area and forest Built-up area and unused | 1.6725 | 1.9873 | 1.8785 |
| 1.9110 | 1.9799 | 1.8478 | |
| 1.8477 | 1.9832 | 1.9464 | |
| Built-up area and water Farmland and forest | 1.9960 | 1.9942 | 1.9928 |
| 1.8089 | 1.9598 | 1.7414 | |
| Farmland and unused Farmland and water Forest and water Forest and unused | 1.8551 | 1.9999 | 1.9999 |
| 1.9999 | 1.9999 | 1.9625 | |
| 1.9999 | 2.0000 | 1.9871 | |
| 1.9959 | 1.9999 | 1.9999 | |
| Water and unused | 1.9889 | 2.0000 | 2.0000 |
| Land Type | Area in 2011 (hm²) | Area in 2016 (hm²) | Area in 2021 (hm²) |
|---|---|---|---|
| Built-up area | 71,970.01477 | 76,714.85897 | 58,605.64768 |
| Forest | 23,670.95002 | 36,928.65714 | 47,425.50111 |
| Farmland | 29,982.20868 | 22,456.09545 | 26,337.96976 |
| Water | 24,340.67049 | 19,668.66897 | 25,028.7234 |
| Unused | 9515.706876 | 3713.39787 | 2083.836433 |
| Land Type | Farmland | Built-Up Area | Forest | Water | Unused |
|---|---|---|---|---|---|
| Built-up area | 67.92% | 18.19% | 10.56% | 2.31% | 1.00% |
| Forest | 16.38% | 61.89% | 16.39% | 1.99% | 3.35% |
| Farmland | 44.38% | 14.00% | 38.29% | 1.79% | 1.55% |
| Water | 12.49% | 21.64% | 1.59% | 58.48% | 5.80% |
| Unused | 24.05% | 40.88% | 12.20% | 11.93% | 10.94% |
| Average | 33.04% | 31.32% | 15.81% | 15.30% | 4.53% |
| Total transfer probability | 165.22% | 156.60% | 79.03% | 76.50% | 22.64% |
| Land Type | Farmland | Built-Up Area | Forest | Water | Unused |
|---|---|---|---|---|---|
| Built-up area | 60.10% | 18.60% | 13.74% | 7.16% | 0.40% |
| Forest | 7.60% | 66.51% | 17.42% | 6.46% | 2.02% |
| Farmland | 12.45% | 31.20% | 53.47% | 2.67% | 0.21% |
| Water | 3.51% | 10.88% | 1.78% | 76.65% | 7.18% |
| Unused | 0.22% | 44.06% | 4.28% | 34.39% | 17.04% |
| Average | 16.78% | 34.25% | 18.14% | 25.47% | 5.37% |
| Total transfer probability | 83.88% | 171.25% | 90.69% | 127.33% | 26.85% |
| Categories of Drivers | Driving Factors | Influence | Modeling or Subjective Analysis |
|---|---|---|---|
| Natural factors | Elevation or slope | The research area’s lowest and highest points are 25 m apart, and the average elevation is 2.7 m. The land is flat with little impact. | No influence |
| Climate | The climate environment has a wide impact, and climate change in a short time and small region is modest. Thus, evolution has minimal impact. | No influence | |
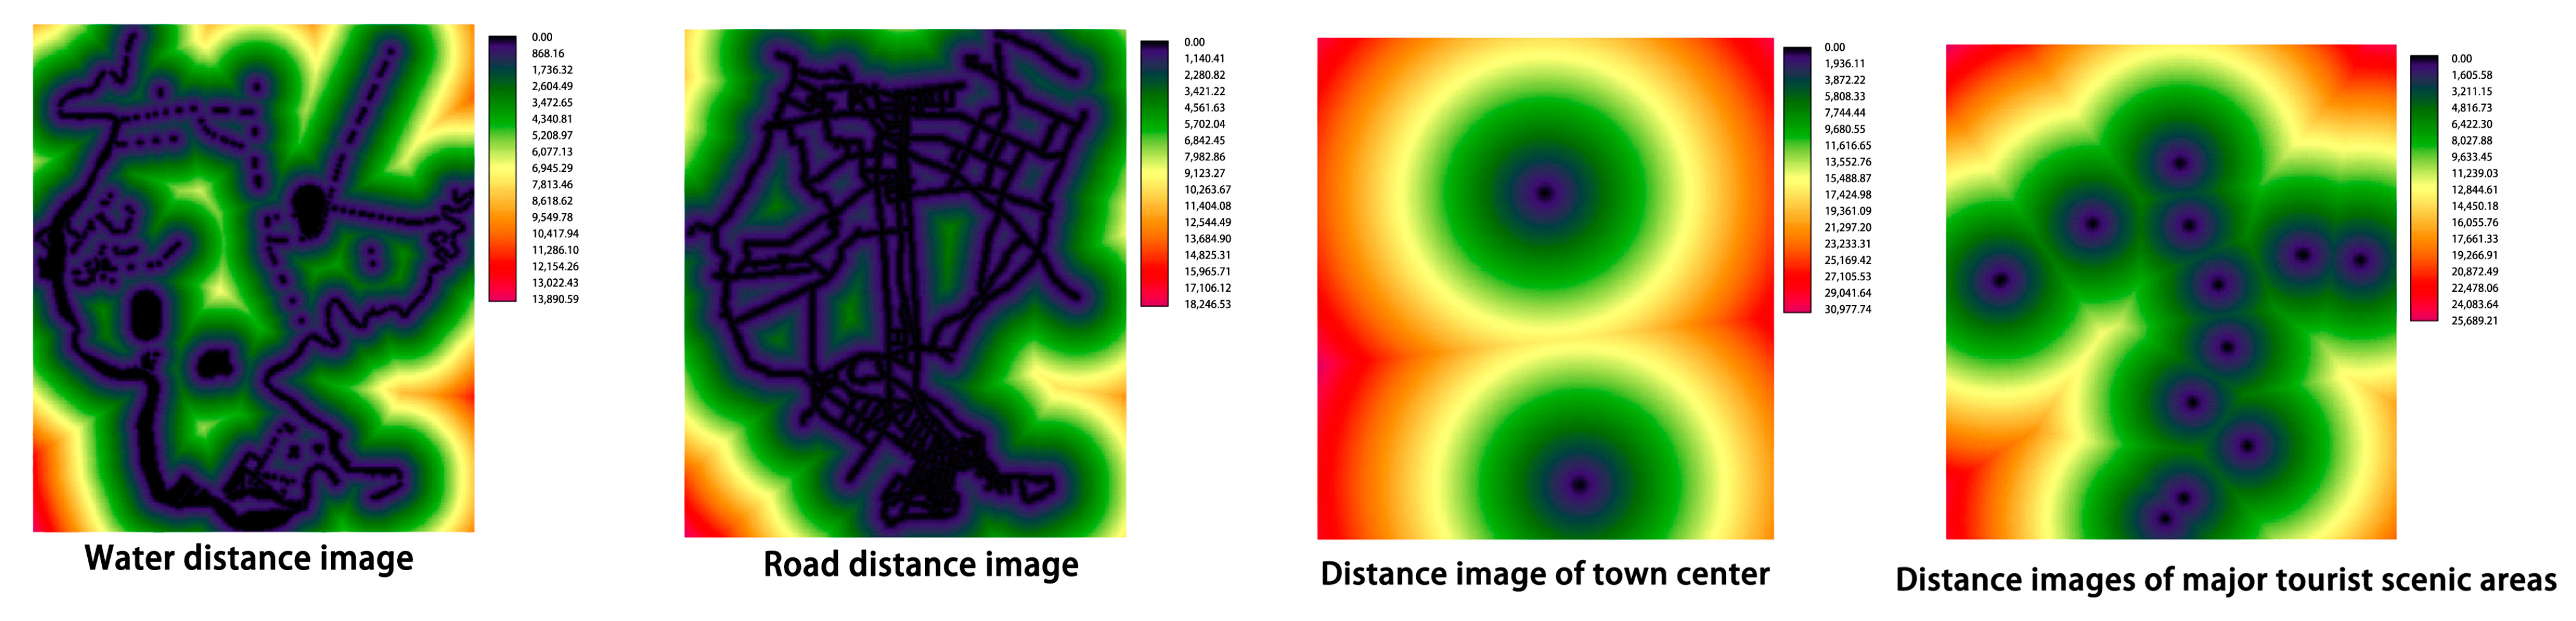
| River system | Water resource development affects settlement location, habitat construction, and tourism development. | Modeling | |
| Road | Outside of the road communication research area, it includes the transportation of tourism resources, construction materials, and tourists, all of which have an effect. | Modeling | |
| Humanistic factors | Population and economy | Tourism depends on population migration and economic support, but regional distribution data are hard to obtain, and thus they are subjectively analyzed. | Subjective analysis |
| Folk culture | Folk culture is the research area’s tourism content and subject of subjective analysis. | Subjective analysis | |
| Policies and regulations | Policies and regulations affect tourist construction and macro-control in the research area. Content subjective analysis. | Subjective analysis | |
| Develop external forces | Town center | Development and building focus on urban centers and constantly expand. Urbanization affects regional tourism. | Modeling |
| Large scenic area | Small tourist areas can benefit from large picturesque sites. | Modeling |
| Land Type | Farmland | Built-Up Area | Forest | Water | Unused |
|---|---|---|---|---|---|
| Farmland | 58.50% | 22.42% | 11.74% | 7.30% | 0.04% |
| Built-up area | 7.14% | 70.44% | 12.66% | 8.74% | 1.01% |
| Forest | 4.86% | 21.34% | 71.63% | 2.17% | 0.00% |
| Water | 0.01% | 14.19% | 0.64% | 74.02% | 11.14% |
| Unused | 0.00% | 19.43% | 0.44% | 10.92% | 69.20% |
| Average | 14.10% | 29.56% | 19.42% | 20.63% | 16.28% |
| Total transfer probability | 70.51% | 147.82% | 97.11% | 103.15% | 81.39% |
| Area in 2026 (hm²) | 43,595.90 | 54,692.09 | 31,603.38 | 27,423.80 | 2088.00 |
Disclaimer/Publisher’s Note: The statements, opinions and data contained in all publications are solely those of the individual author(s) and contributor(s) and not of MDPI and/or the editor(s). MDPI and/or the editor(s) disclaim responsibility for any injury to people or property resulting from any ideas, methods, instructions or products referred to in the content. |
© 2023 by the authors. Licensee MDPI, Basel, Switzerland. This article is an open access article distributed under the terms and conditions of the Creative Commons Attribution (CC BY) license (https://creativecommons.org/licenses/by/4.0/).
Share and Cite
Meng, F.; Dong, L.; Zhang, Y. Spatiotemporal Dynamic Analysis and Simulation Prediction of Land Use and Landscape Patterns from the Perspective of Sustainable Development in Tourist Cities. Sustainability 2023, 15, 14450. https://doi.org/10.3390/su151914450
Meng F, Dong L, Zhang Y. Spatiotemporal Dynamic Analysis and Simulation Prediction of Land Use and Landscape Patterns from the Perspective of Sustainable Development in Tourist Cities. Sustainability. 2023; 15(19):14450. https://doi.org/10.3390/su151914450
Chicago/Turabian StyleMeng, Fanqi, Li Dong, and Yu Zhang. 2023. "Spatiotemporal Dynamic Analysis and Simulation Prediction of Land Use and Landscape Patterns from the Perspective of Sustainable Development in Tourist Cities" Sustainability 15, no. 19: 14450. https://doi.org/10.3390/su151914450