Temporal and Spatial Evolution, Prediction, and Driving-Factor Analysis of Net Primary Productivity of Vegetation at City Scale: A Case Study from Yangzhou City, China
Abstract
:1. Introduction
2. Materials and Methods
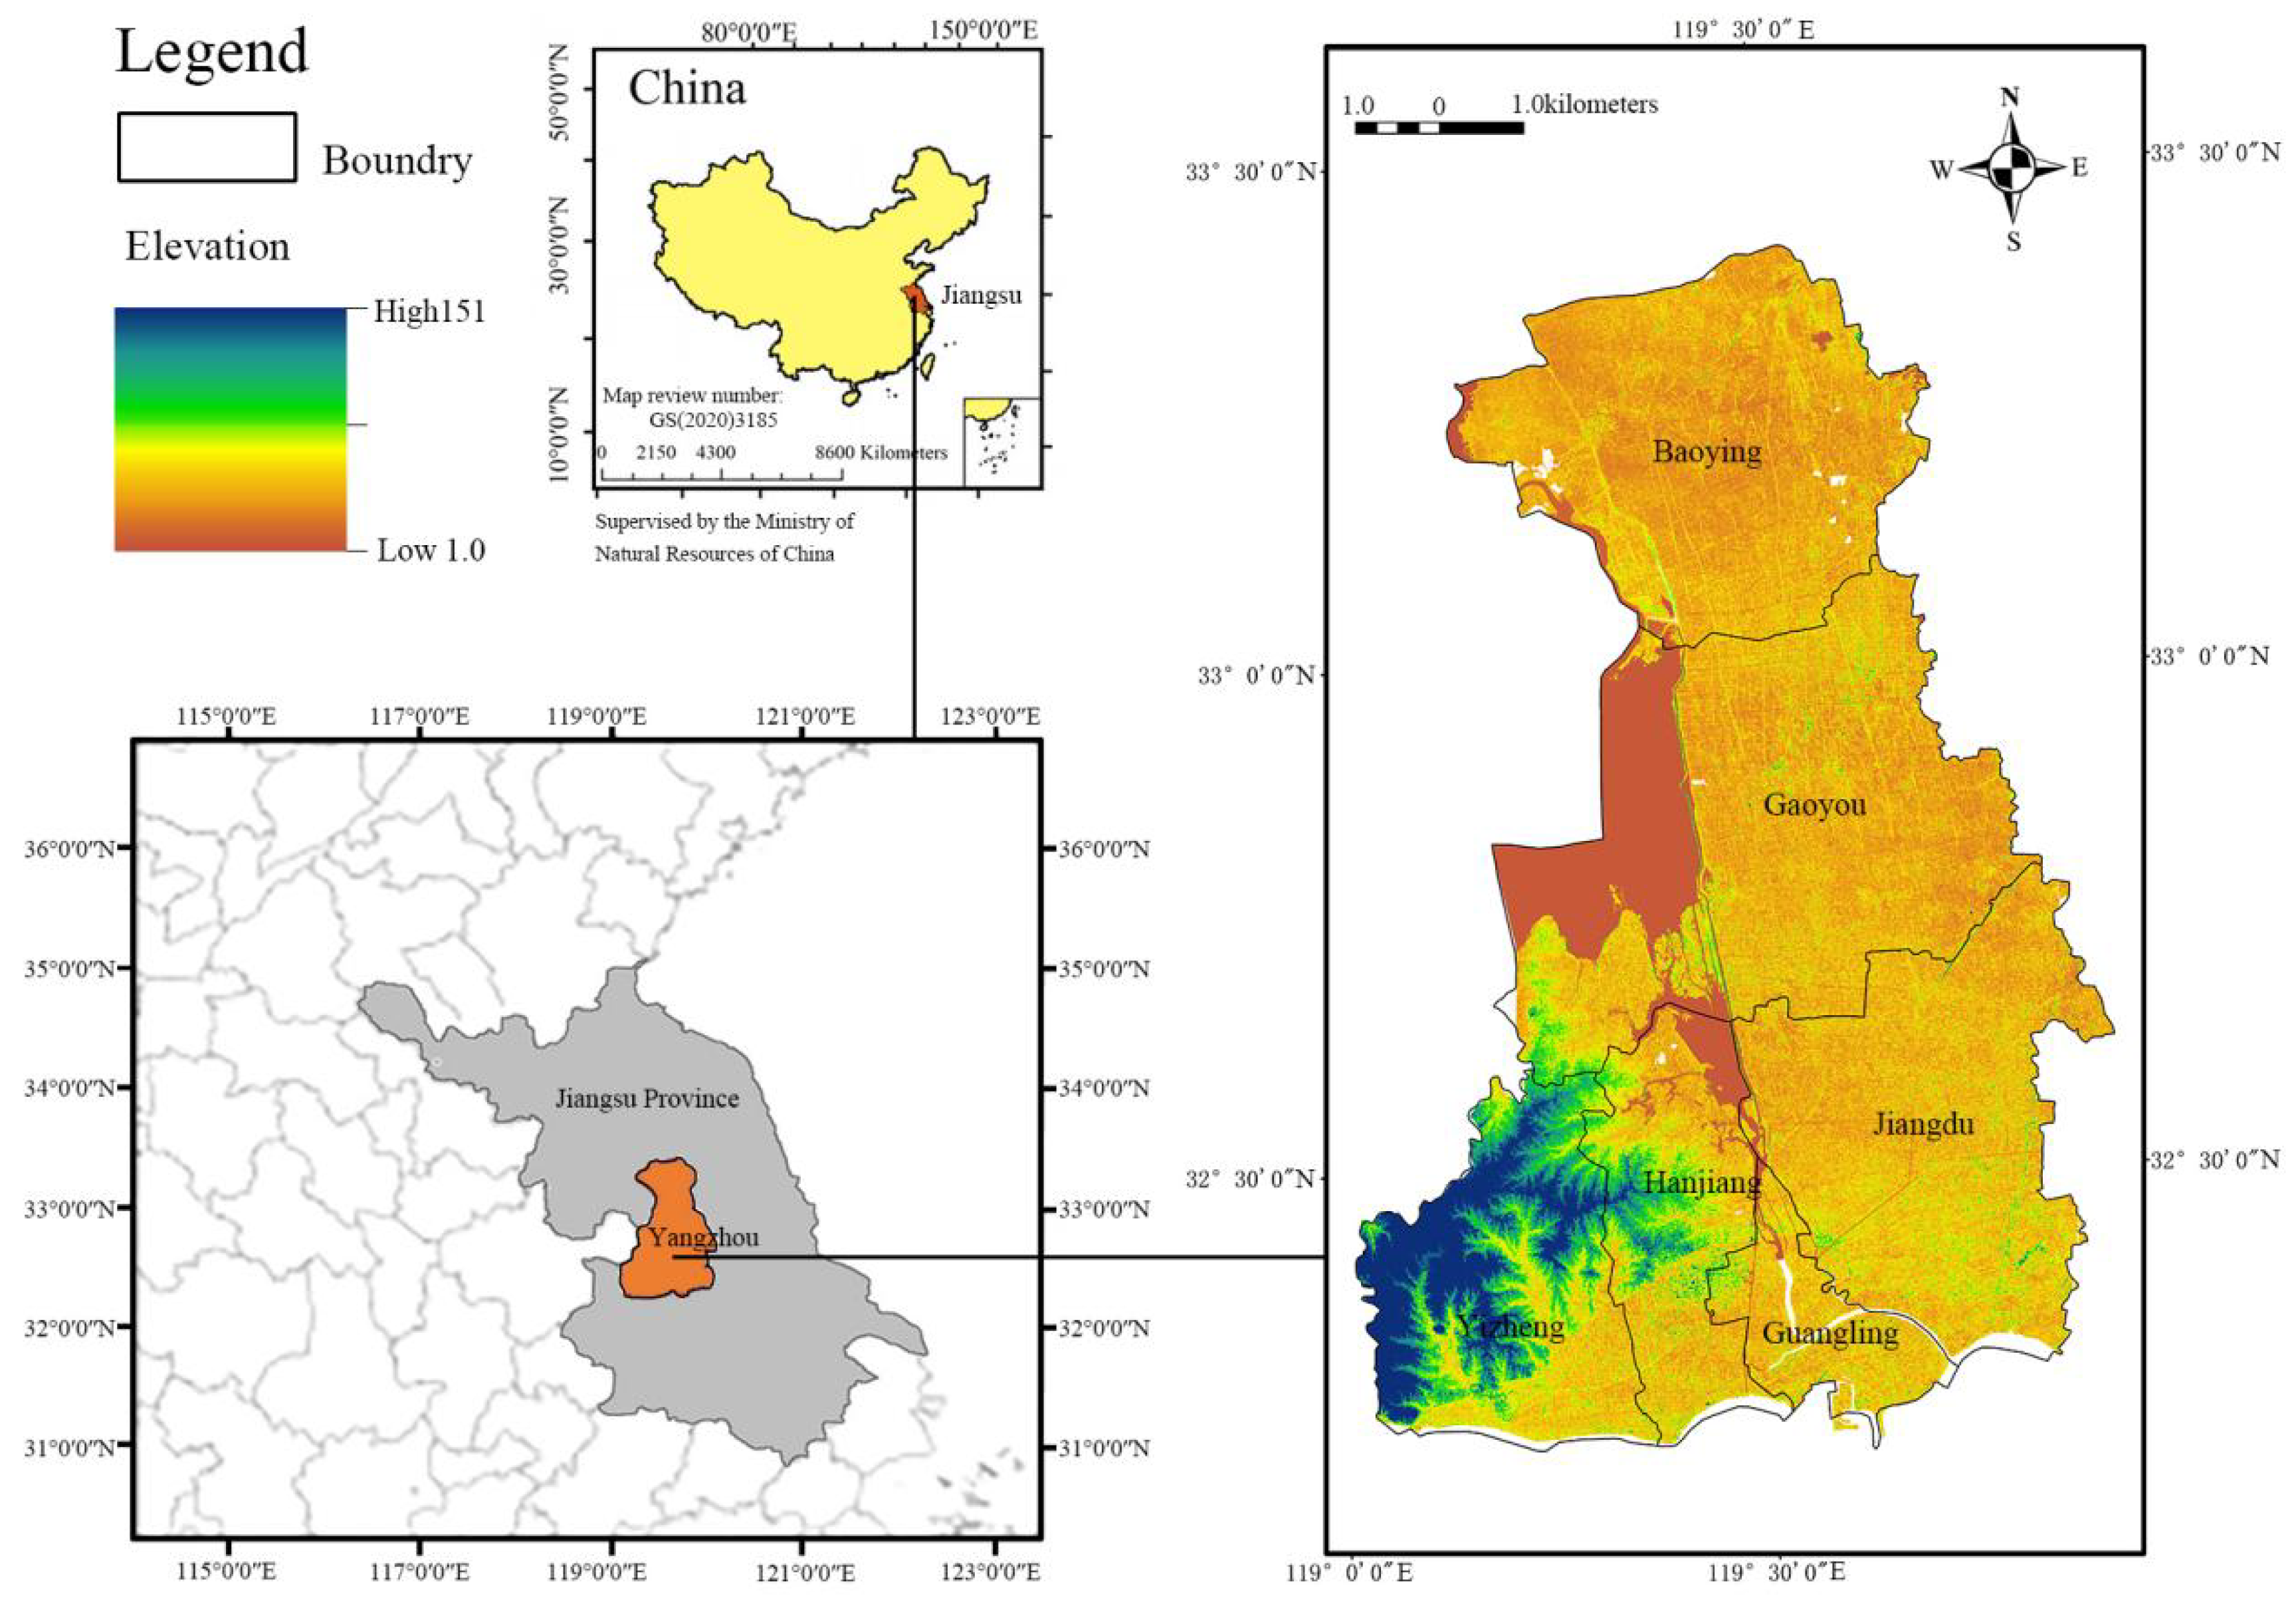
2.1. Study Area
2.2. Data Sources
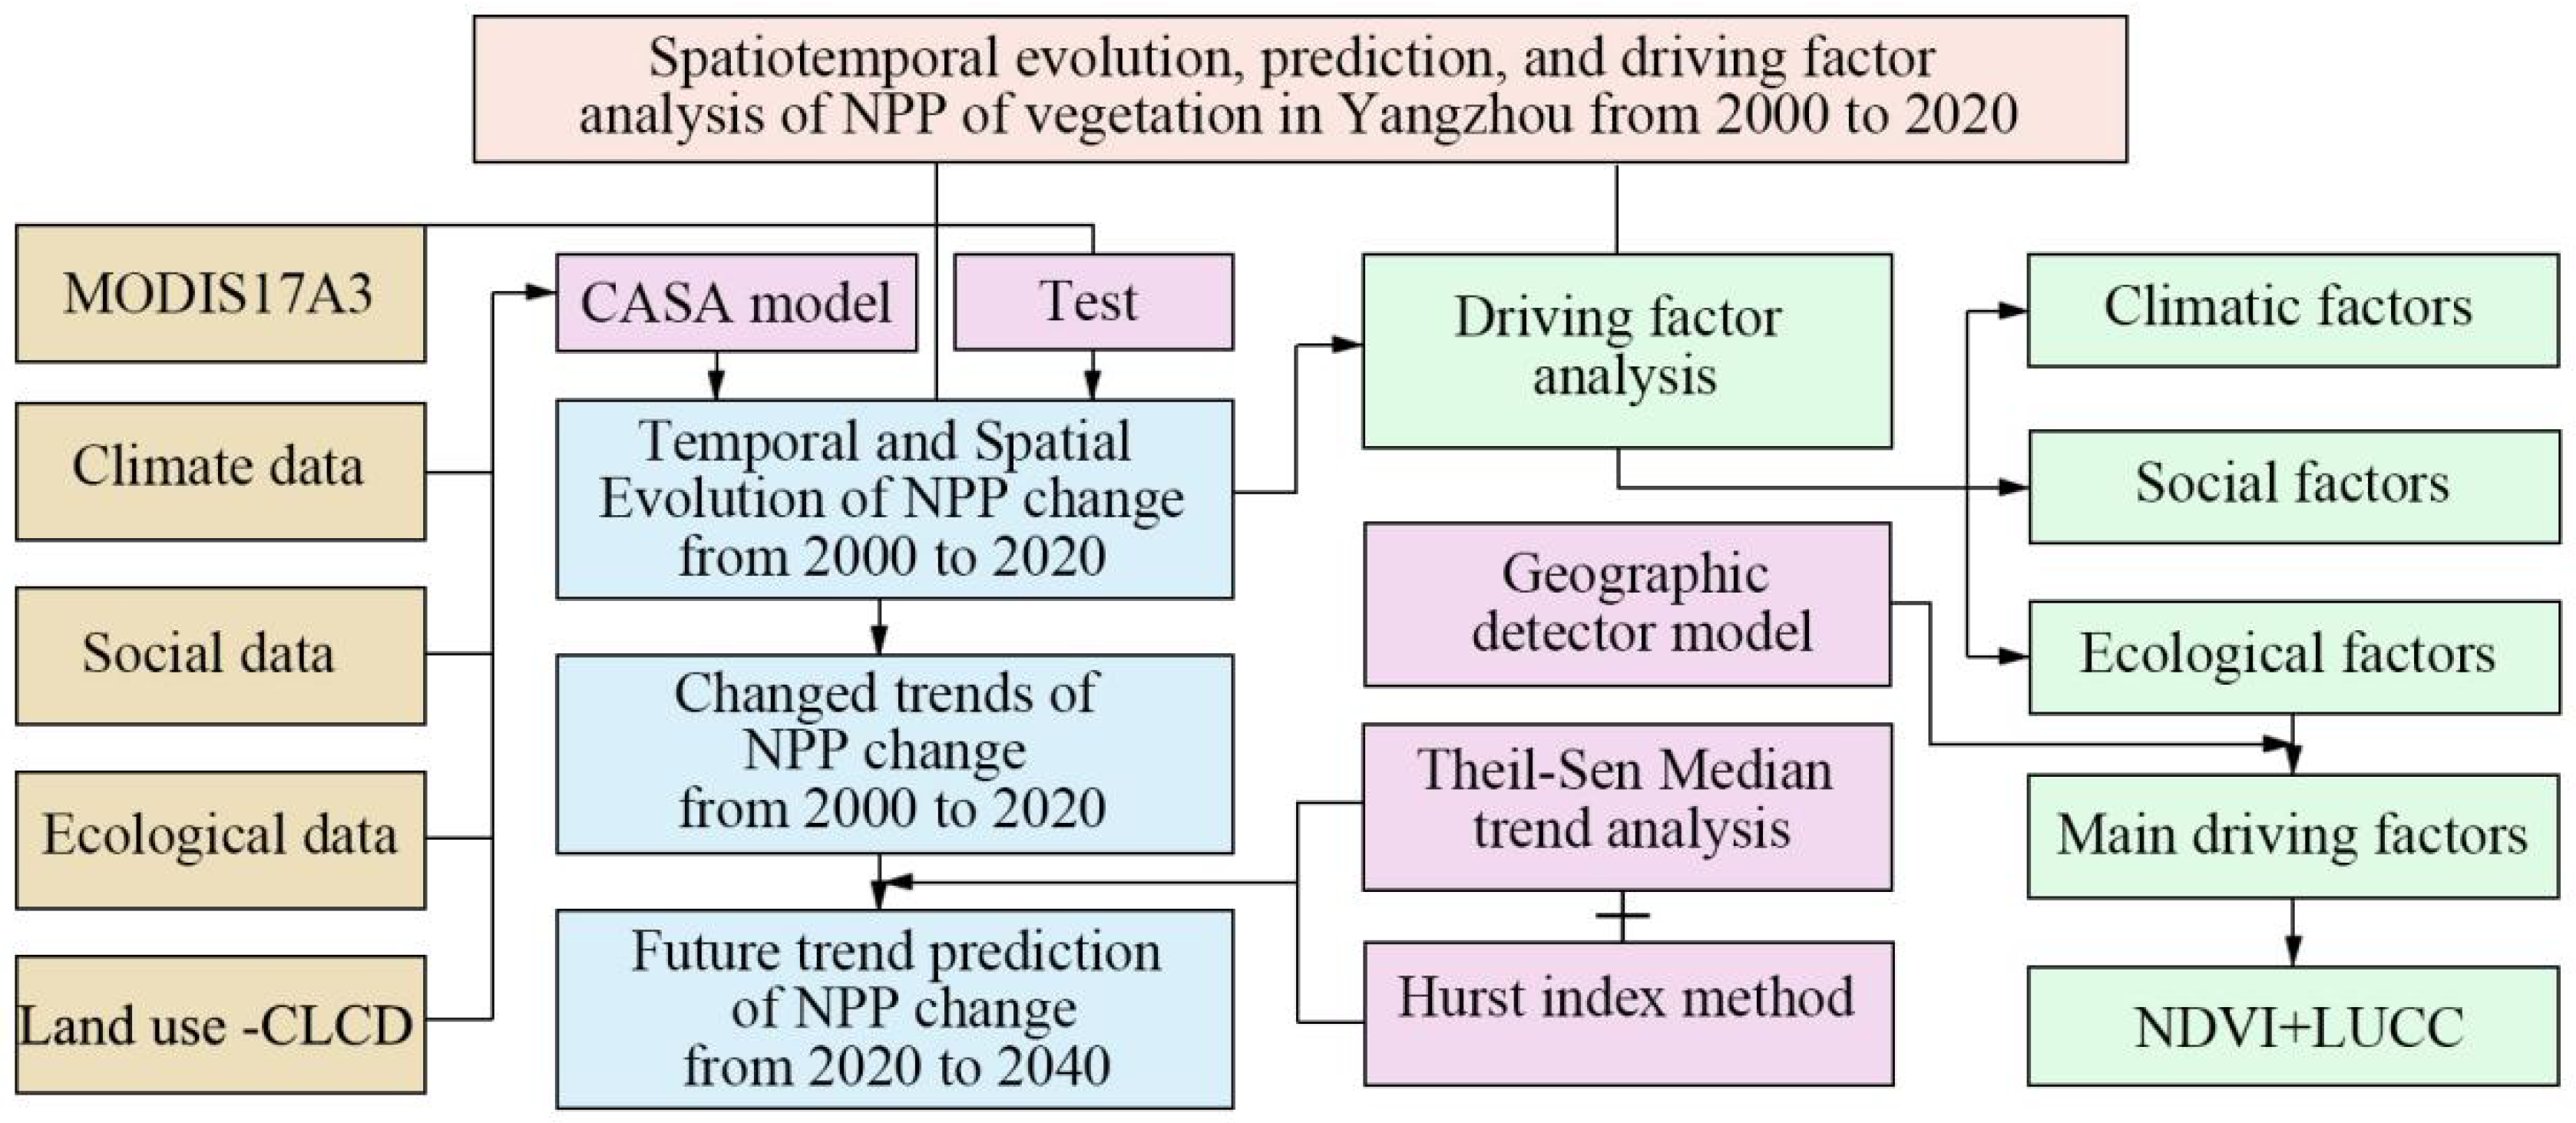
2.3. Methodology
2.3.1. Improved CASA Model
2.3.2. Theil–Sen Median Trend Analysis and Mann–Kendall Significance Test
2.3.3. Rescaled Rang Analysis (R/S Analysis) and Hurst Index Method
2.3.4. Geographic Detectors Model
3. Results
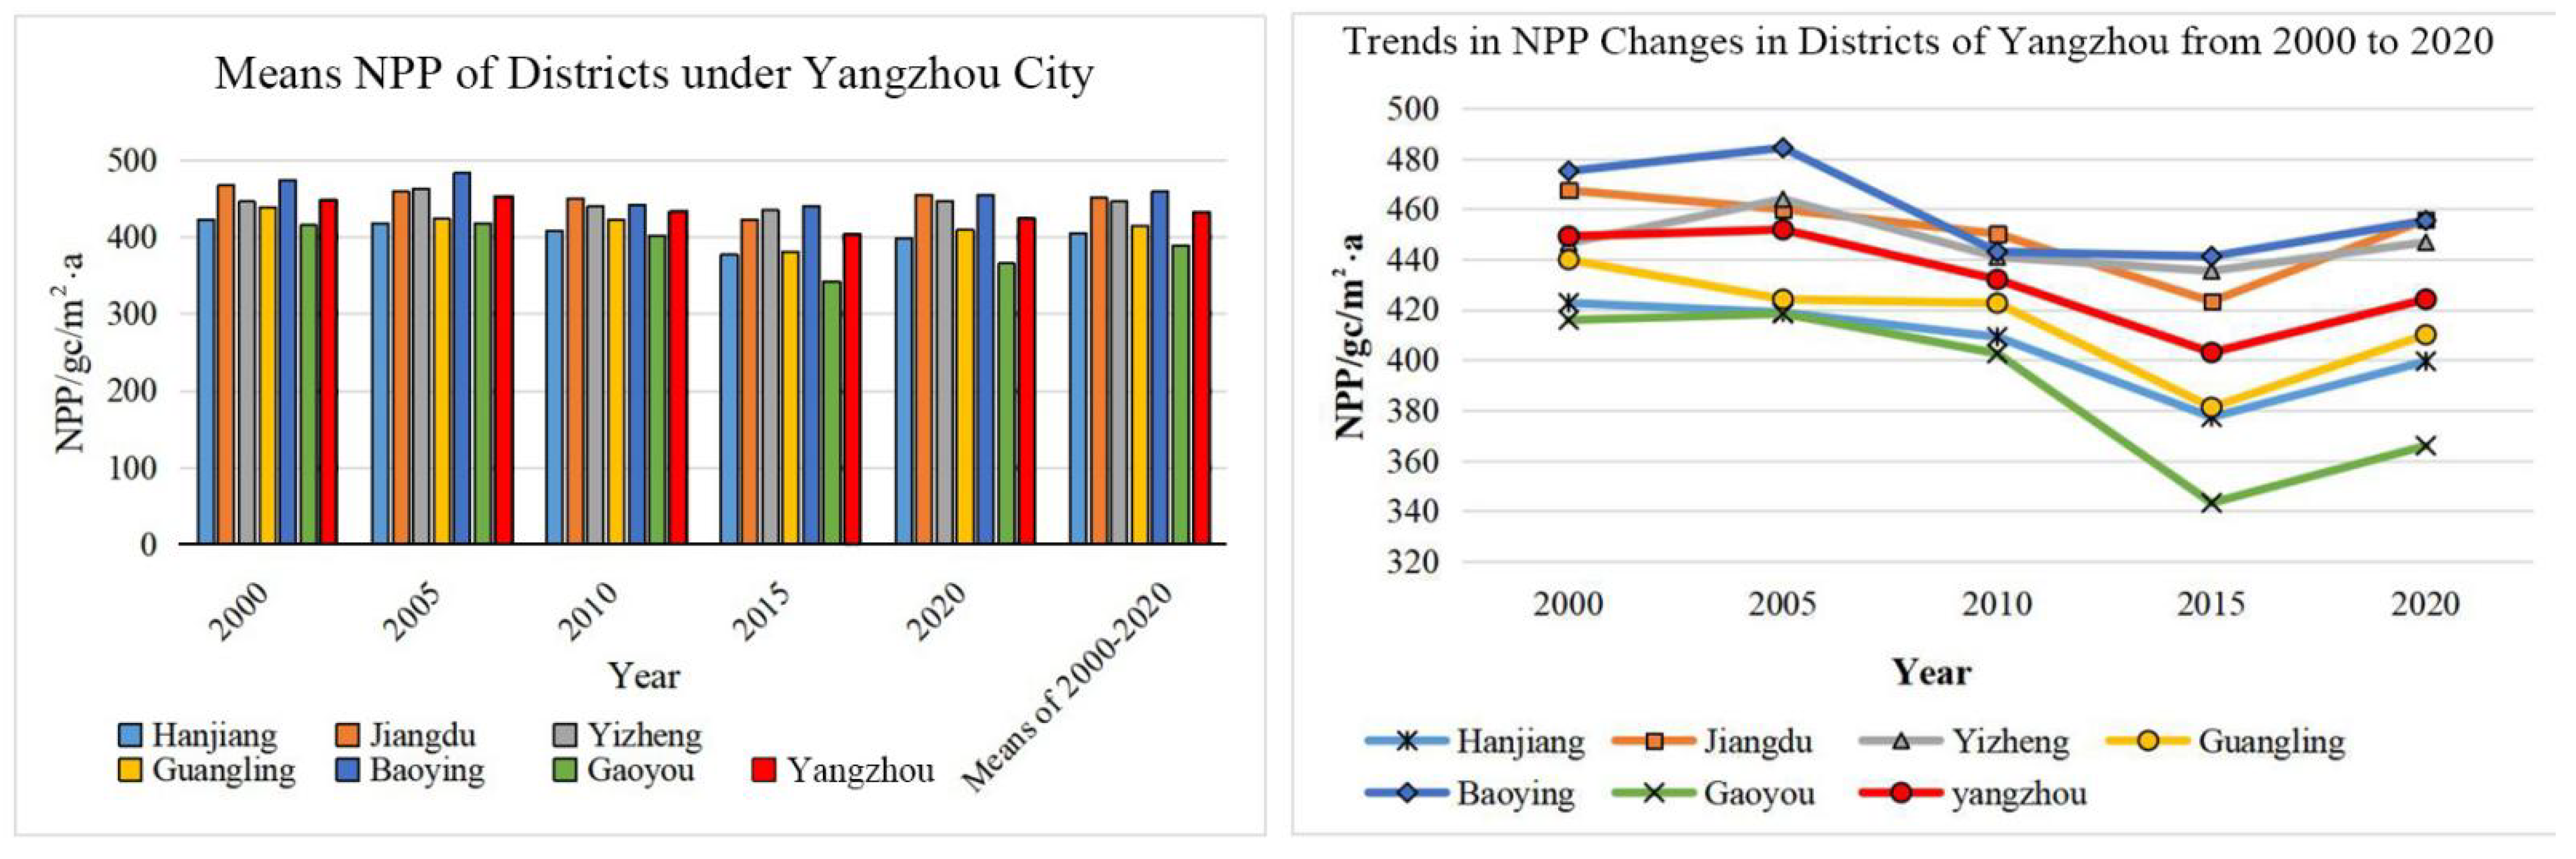
3.1. Spatial and Temporal Variation of Vegetation NPP in Yangzhou City
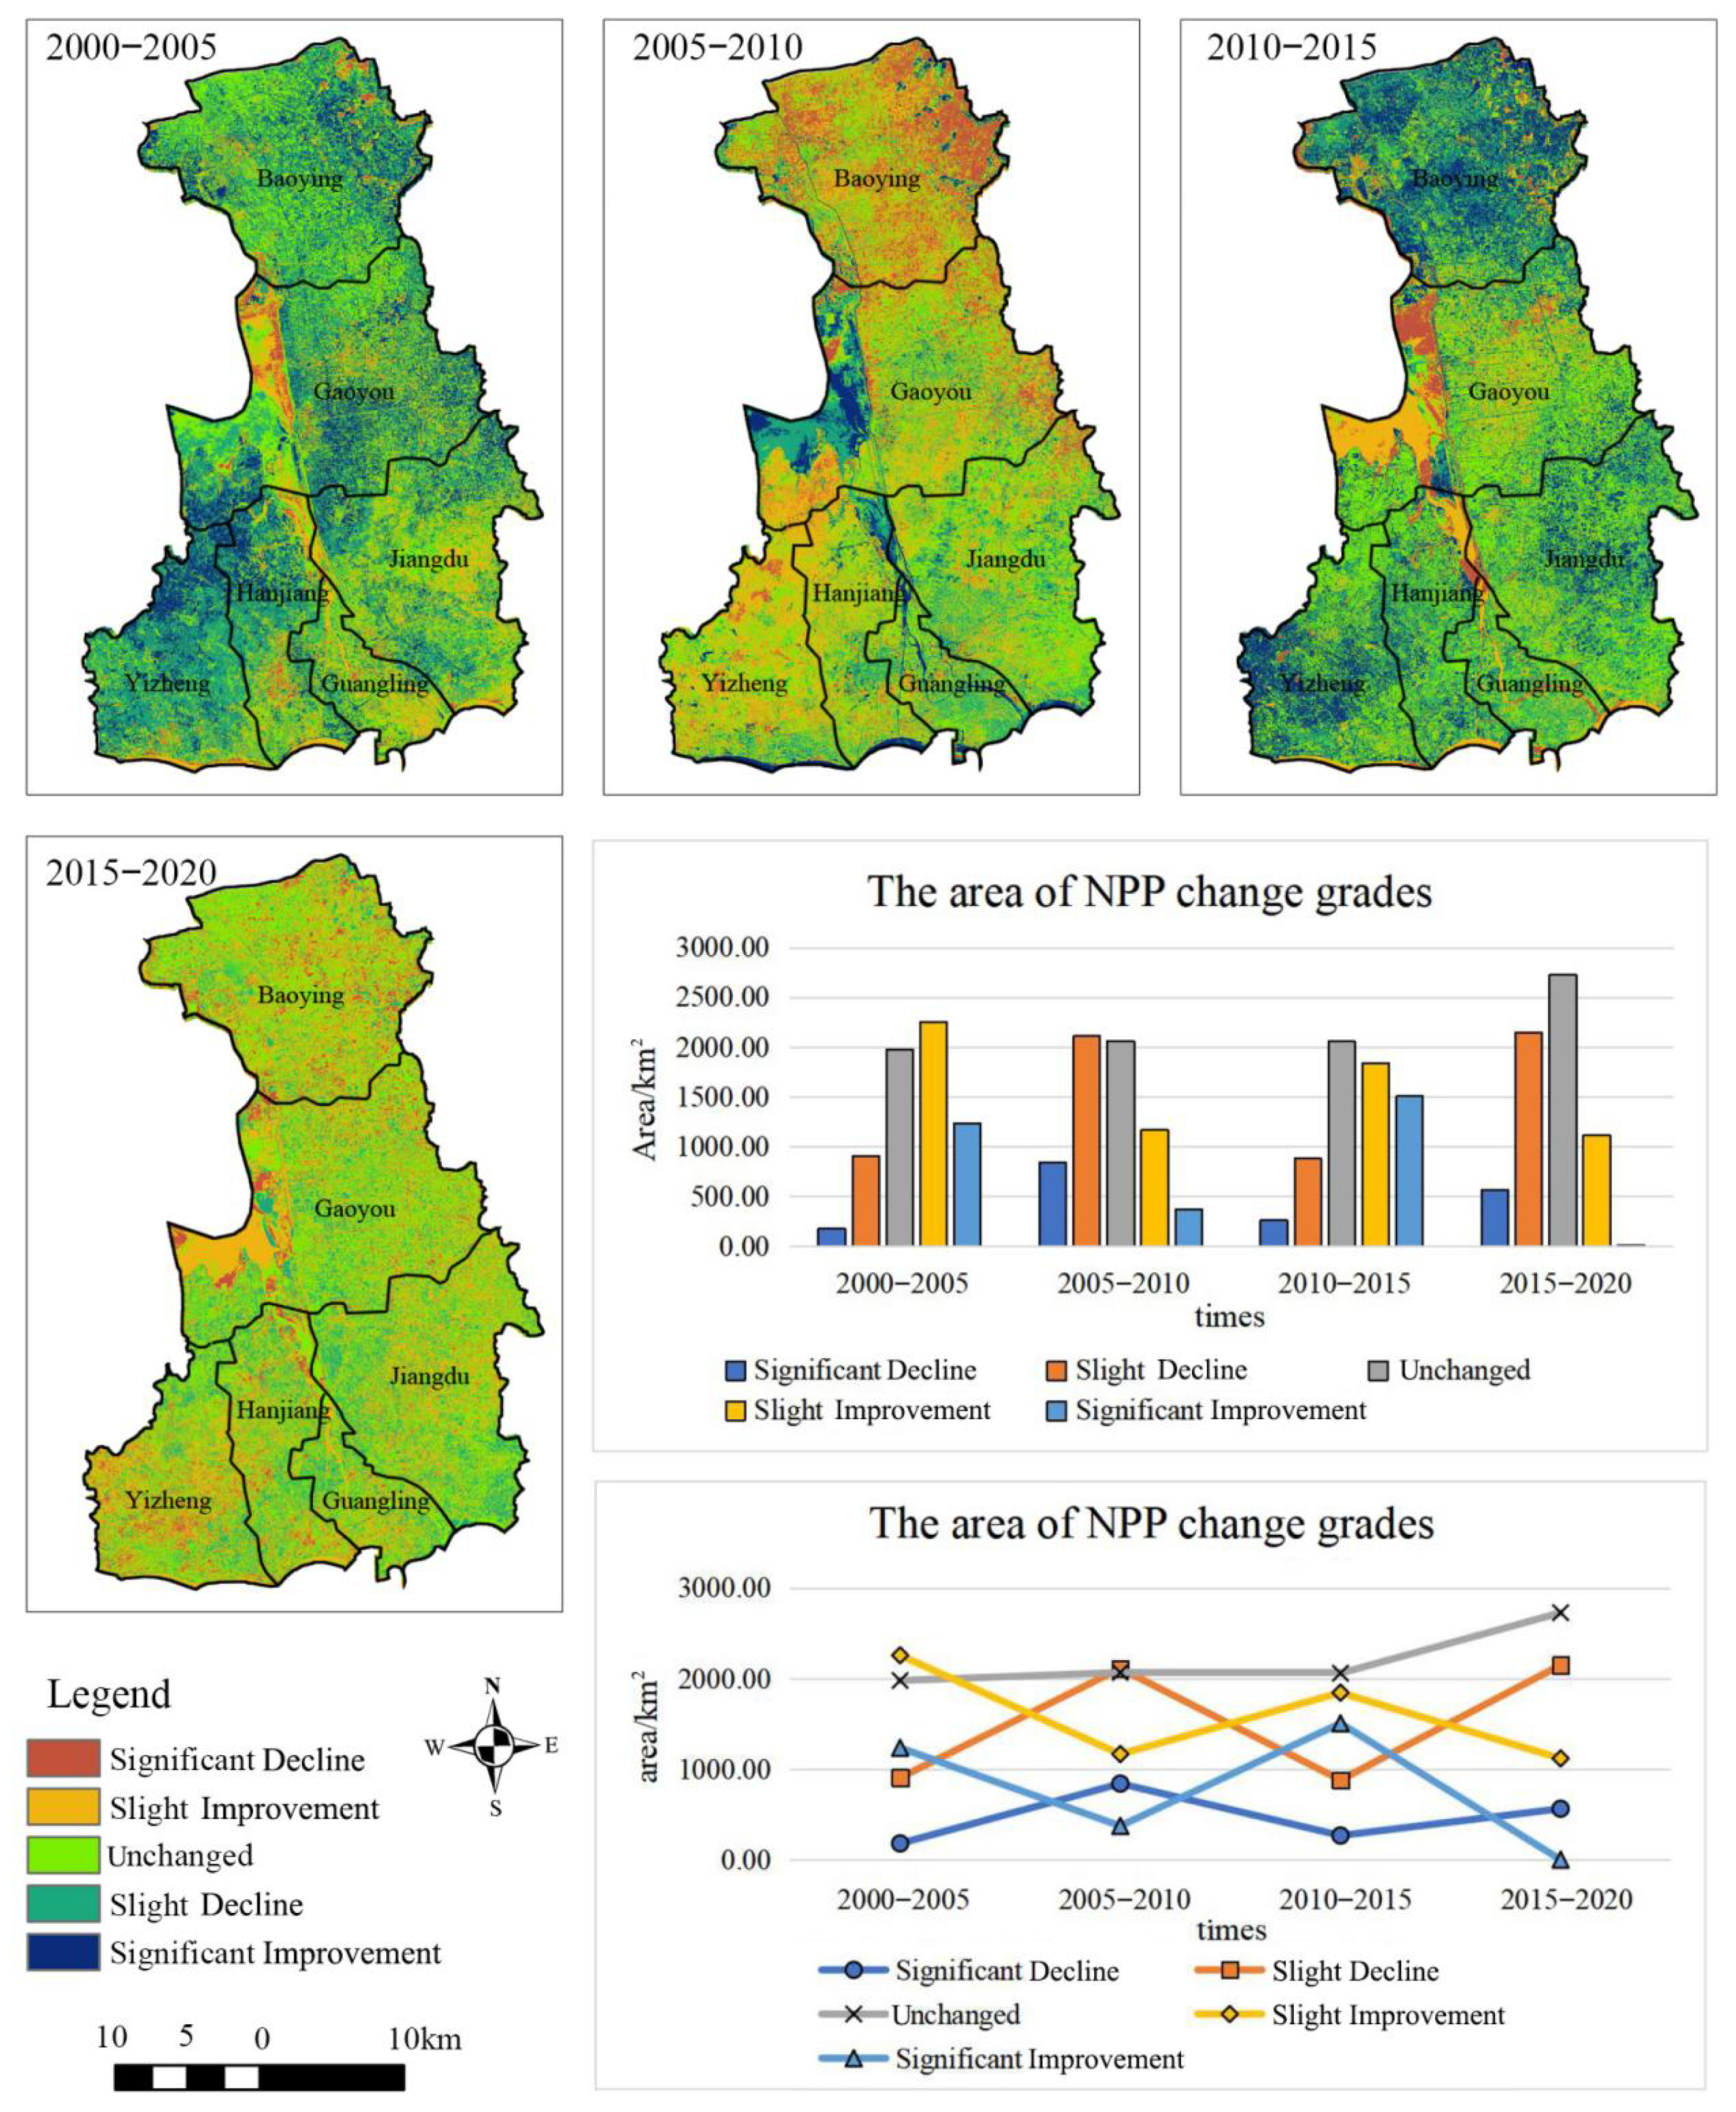
3.2. Spatiotemporal Variation of Vegetation NPP in Yangzhou City
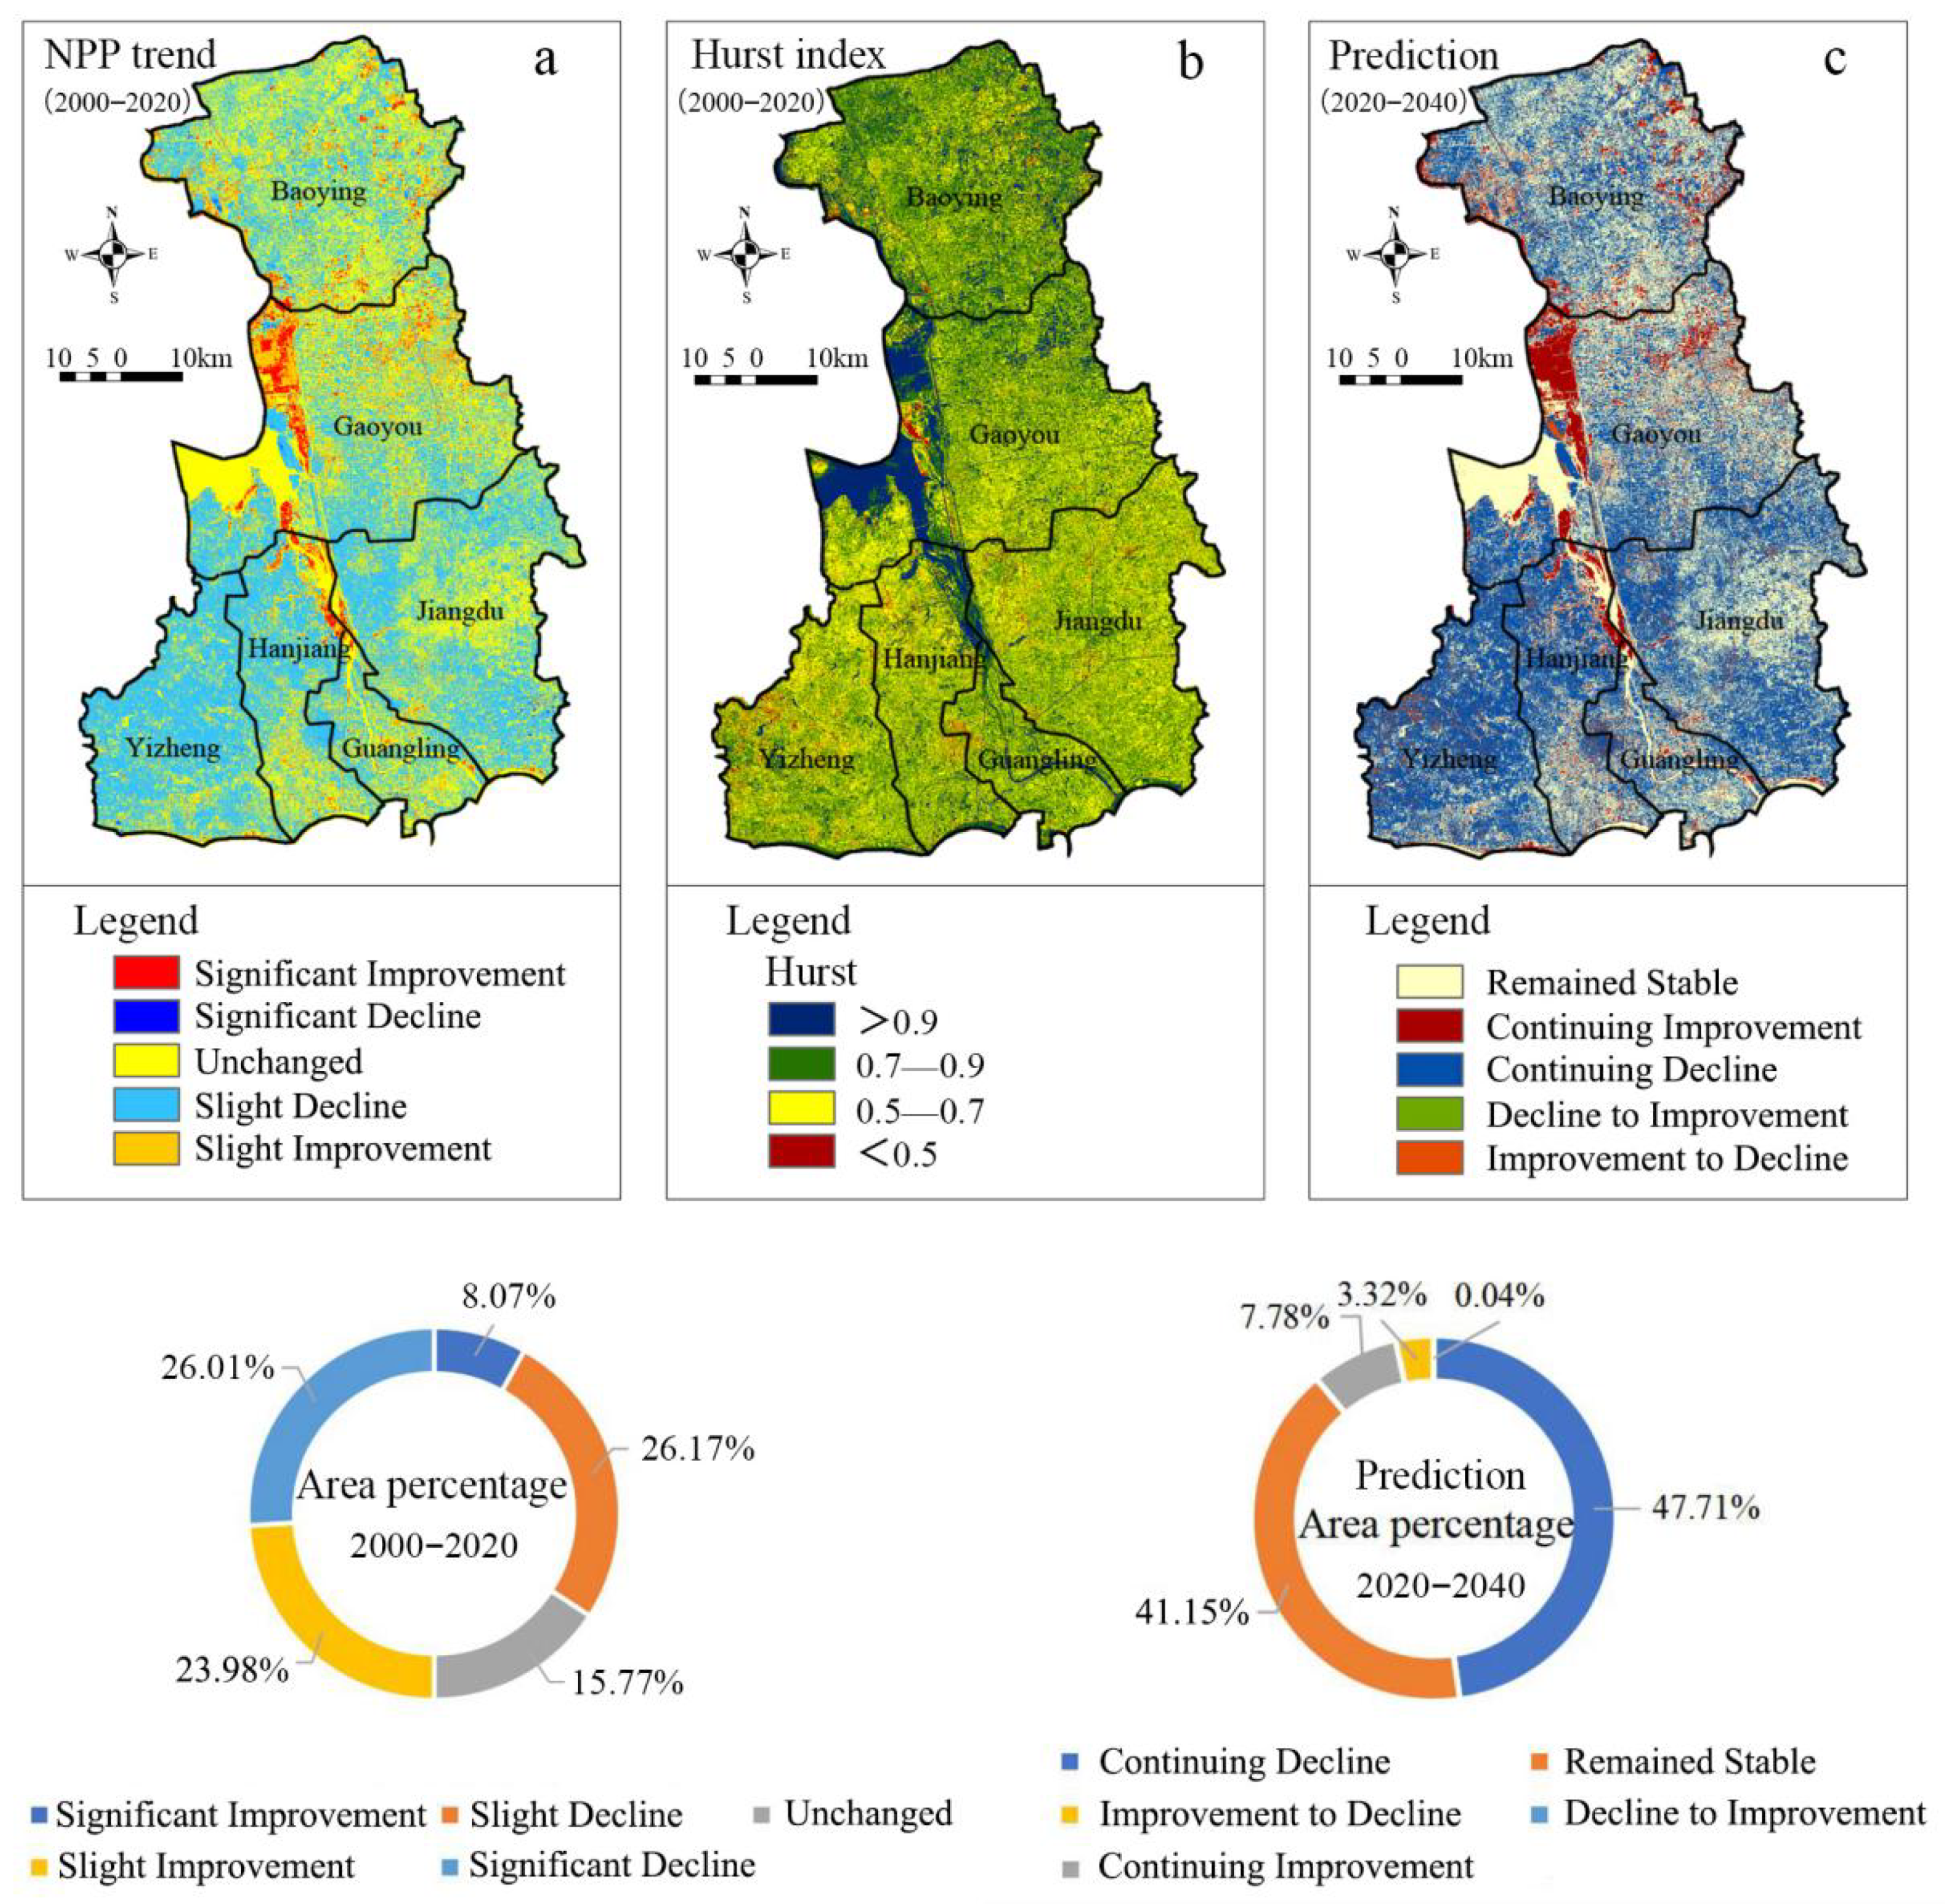
3.3. Prediction of Future Trends in the Evolution of Vegetation NPP in Yangzhou City
3.4. Analysis of Factors Driving the Variation of Vegetation NPP in Yangzhou City
4. Discussion
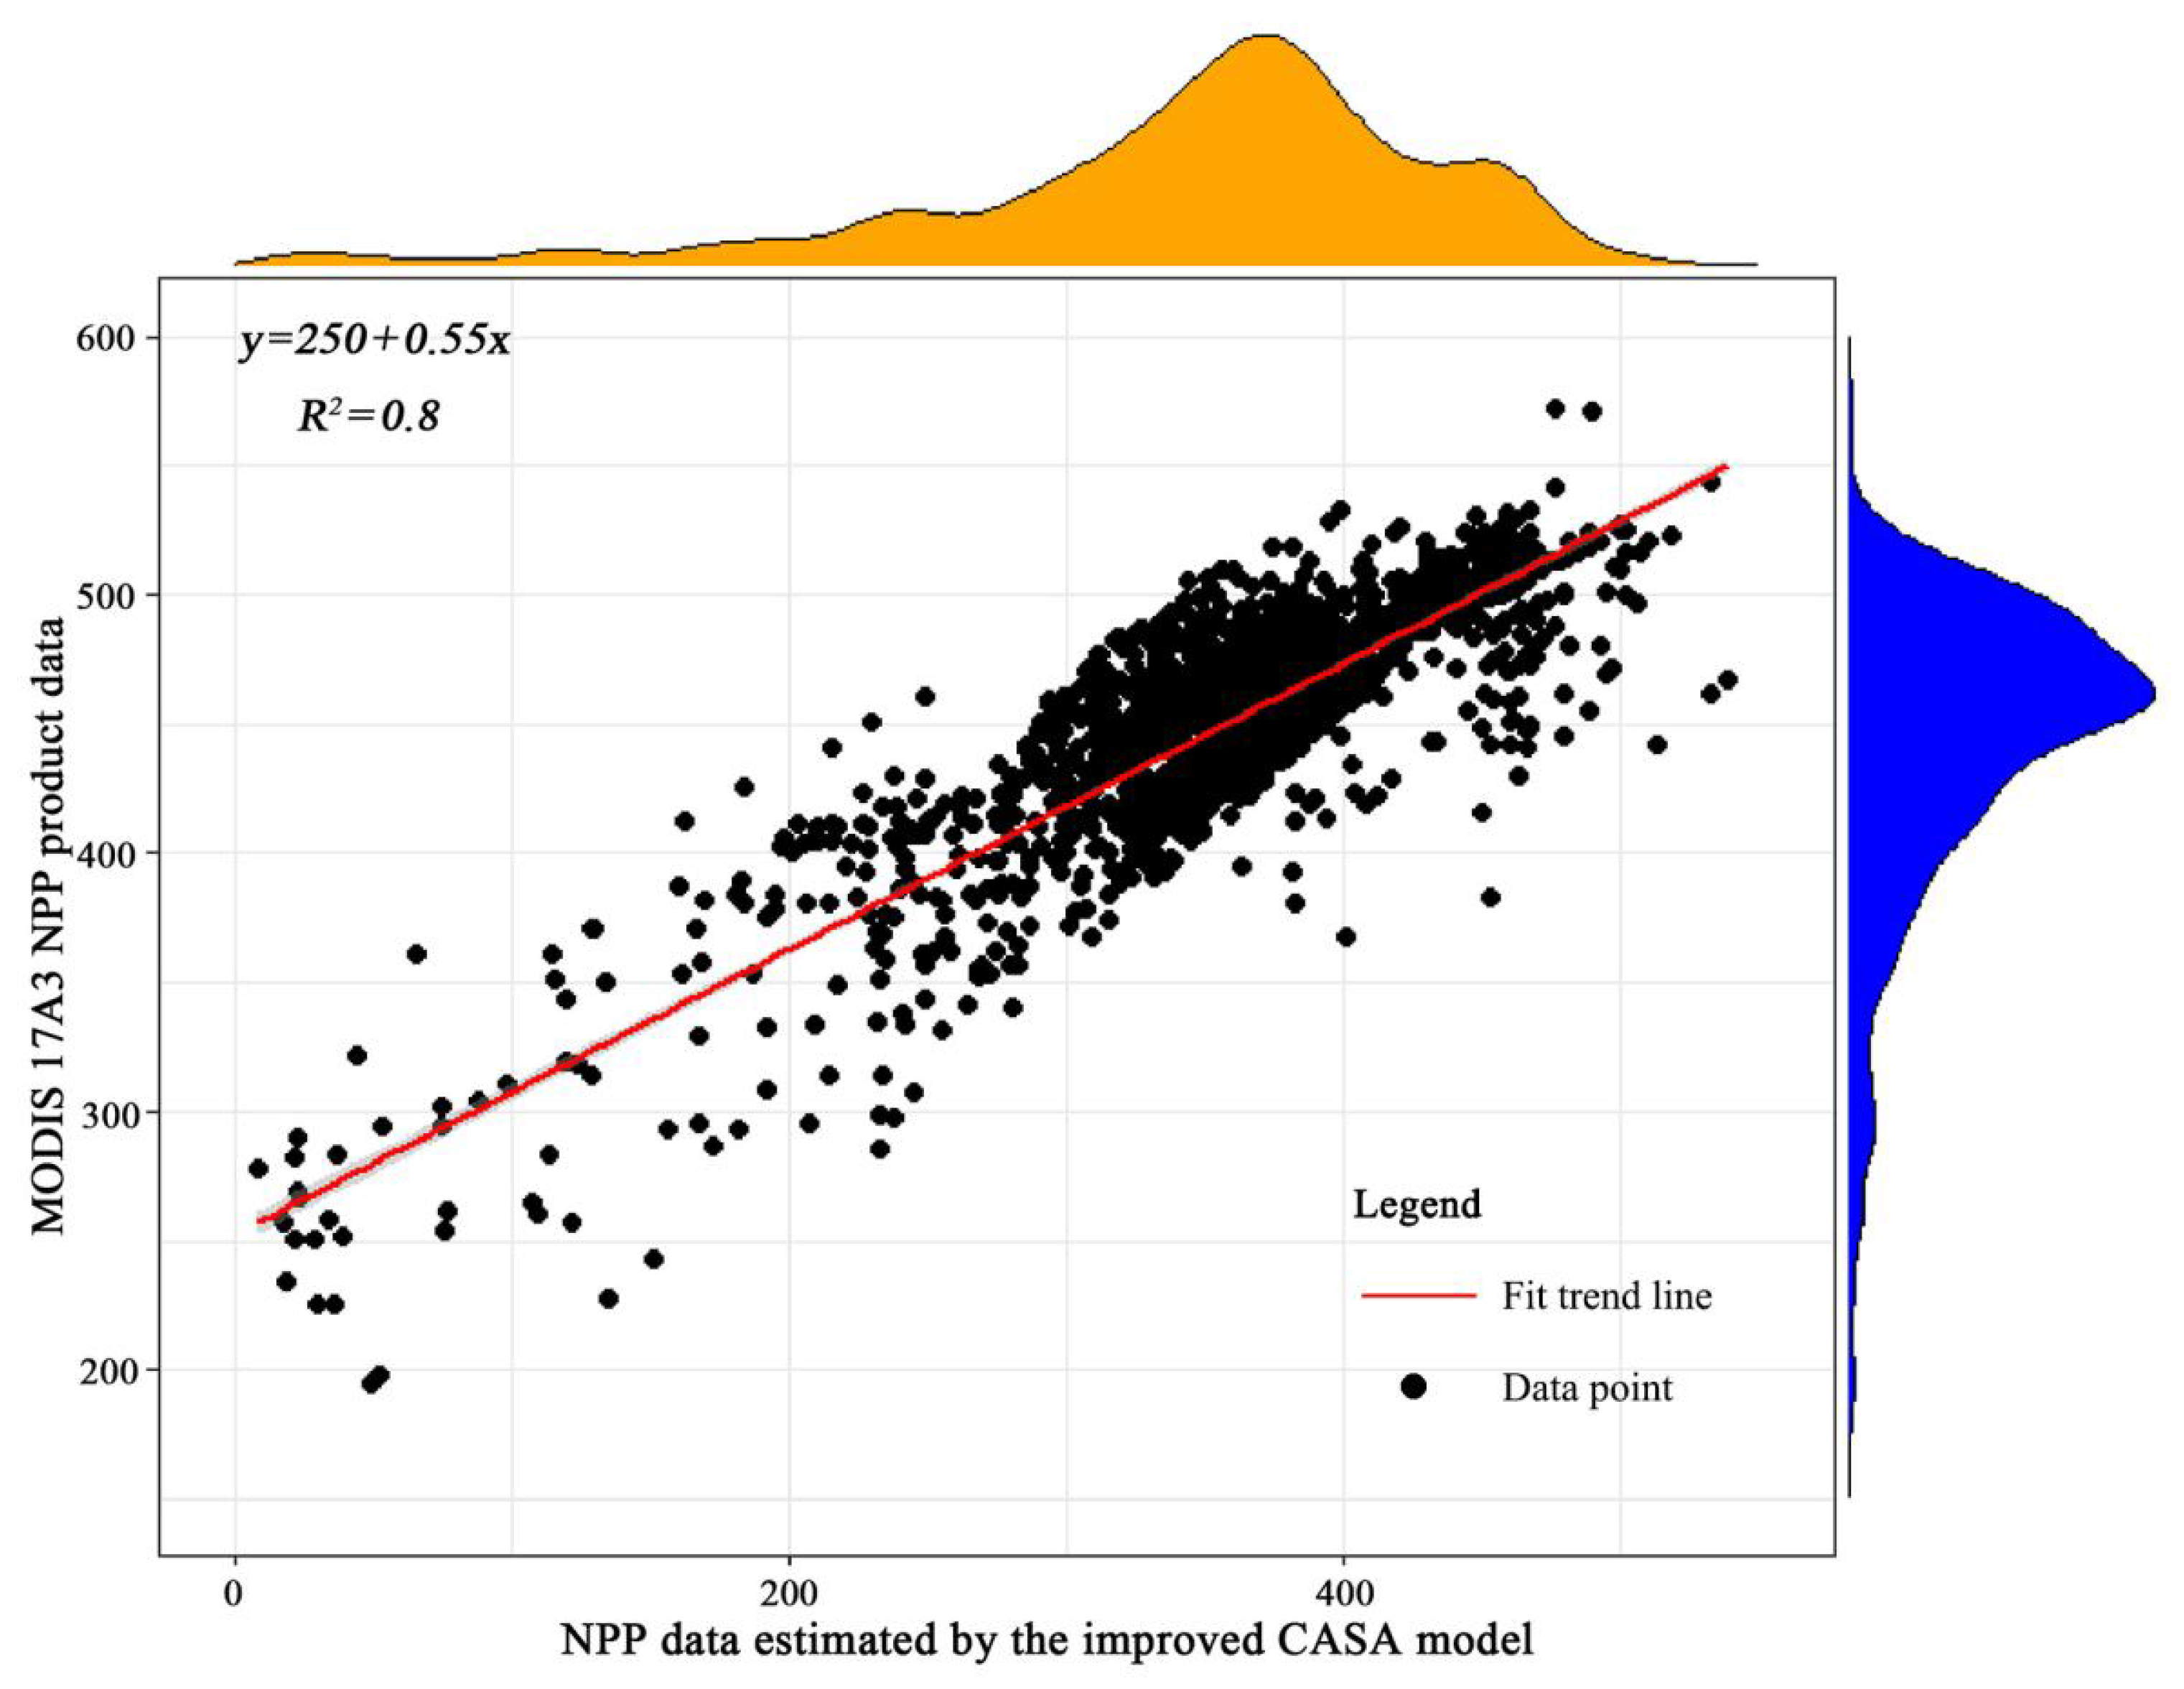
4.1. Validation of Improved CASA Model-Estimation Results
4.2. Spatiotemporal Evolution of NPP and Prediction of Future Trends
4.3. Selection and Analysis of Driving Factors
4.4. Uncertainty and Limitations
5. Conclusions
Author Contributions
Funding
Institutional Review Board Statement
Informed Consent Statement
Data Availability Statement
Conflicts of Interest
References
- Chen, J.; Li, Z.; Dong, Y.; Song, M.; Shahbaz, M.; Xie, Q. Coupling coordination between carbon emissions and the eco-environment in China. J. Clean. Prod. 2020, 276, 123848. [Google Scholar] [CrossRef]
- IPCC. Climate Change 2013: The Physical Science Basis; Working Group I Contribution to the IPCC Fifth Assessment Report (AR5); IPCC: New York, NY, USA, 2013. [Google Scholar]
- Lee, M.; Manning, P.; Rist, J.; Power, S.A.; Marsh, C. A global comparison of grassland biomass responses to CO2 and nitrogen enrichment. Philos. Trans. R. Soc. B Biol. Sci. 2010, 365, 2047. [Google Scholar] [CrossRef] [PubMed]
- Zhu, W.Q.; Pan, Y.Z.; Long, Z.H.; Chen, Y.H.; Li, J.; Hu, H.B. Esti—Mating net primary productivity of terrestrial vegetation based on GIS and RS: A case study in Inner Mongolia, China. J. Remote Sens. 2005, 9, 300–307. [Google Scholar]
- Zhang, M.; Lin, H.; Long, X.R.; Cai, Y.T. Analyzing the spatio—Temporal pattern and driving factors of wetland vegetation chang- es using 2000–2019 time-series Landsat data. Sci. Total Environ. 2021, 780, 146615. [Google Scholar] [CrossRef] [PubMed]
- Wang, S.; Lv, L.H.; Zhang, Z.; Wang, S.Y.; Wu, J.; Fu, J.F.; Luo, H. Low cost carbon peaking and carbon neutrality pathways in China based on multi-objective models. Environ. Sci. Res. 2021, 34, 2044. [Google Scholar]
- Sun, L.; Cui, H.; Ge, Q. Driving factors and future prediction of carbon emissions in the belt and road initiative countries. Energies 2021, 14, 5455. [Google Scholar] [CrossRef]
- Xu, Y.; Huang, W.T.; Zheng, Z.W.; Dai, Q.Y.; Li, X.Y. Detection of NPP influencing factors of vegetation in southwestern China based on spatial scale effects. Environ. Sci. 2023, 44, 900–911. [Google Scholar]
- Liu, Y.Y.; Wang, Q.; Yang, Y.; Gang, C.C.; Zhang, Z.Y.; Tong, L.J.; Li, J.L. The spatiotemporal dynamics and influencing factors of net primary productivity of grasslands on the Loess Plateau. J. Appl. Ecol. 2019, 30, 2309–2319. [Google Scholar]
- Zhu, P.F.; Liu, G.; He, J.; Dai, T.R. Spatiotemporal Variation of Vegetation Net Primary Productivity and Its Driving Factors in Dabie Mountains Area in Recent 20 Years. J. Yangtze River Acad. Sci. 2022, 1–9. Available online: http://kns.cnki.net/kcms/detail/42.1171.TV.20221223.1219.007.html (accessed on 5 May 2023).
- Long, X.; Li, X.; Lin, H.; Zhang, M. Mapping the vegetation distribution and dynamics of a wetland using adaptive stacking and Google Earth Engine based on multi-source remote sensing data. Int. J. Appl. Earth Obs. Geoinf. 2021, 102, 102453. [Google Scholar] [CrossRef]
- Potter, C.S.; Randerson, J.T.; Field, C.B.; Matson, P.A.; Vitouse, P.M.; Mooney, H.A.; Klooster, S.A. Terrestrial ecosystem pro- duction: A process model based on global satellite and surface data. Glob. Biogeochem. Cycles 1993, 7, 811–841. [Google Scholar] [CrossRef]
- Zhu, W.Q.; Pan, Y.Z.; Zhang, J.S. Remote sensing estimation of net primary productivity of terrestrial vegetation in China. J. Plant Ecol. 2007, 31, 413–424. [Google Scholar]
- Ichii, K.; Hashimoto, H.; Nemani, R.; White, M. Modeling the interannual variability and trends in gross and net primary productivity of tropical forests from 1982 to 1999. Glob. Planet. Chang. 2005, 48, 274–286. [Google Scholar] [CrossRef]
- Liu, L.; Peng, S.; AghaKouchak, A.; Huang, Y.; Li, Y.; Qin, D.; Xie, A.; Li, S. Broad consistency between satellite and vegetation model estimates of net primary productivity across global and regional scales. J. Geophys. Res. Biogeosci. 2018, 123, 3603–3616. [Google Scholar] [CrossRef]
- Singh, D. Generation and evaluation of gross primary productivity using Landsat data through blending with MODIS data. Int. J. Appl. Earth Obs. Geoinf. 2011, 13, 59–69. [Google Scholar] [CrossRef]
- Bao, G.; Bao, Y.H.; Qin, Z.H.; Xin, X.P.; Bao, Y.L.; Bayarsaikan, S.; Zhou, Y.; Chuntai, B. Modeling net primary productivity of terrestrial ecosystems in the semi-arid climate of the Mongolian Plateau using LSWI based CASA ecosystem model. Int. J. Appl. Earth Obs. Geoinf. 2016, 46, 84–93. [Google Scholar] [CrossRef]
- Mu, S.J.; Zhou, S.X.; Chen, Y.Z.; Li, J.L.; Ju, W.M.; Odeh, I.O.A. Assessing the impact of restoration-induced land conversion and management alternatives on net primary productivity in Inner Mongolian grassland, China. Glob. Planet. Change 2013, 108, 29–41. [Google Scholar] [CrossRef]
- Piao, S.L.; Fang, J.Y.; Zhou, L.M.; Zhu, B.; Tan, K.; Tao, S. Changes in vegetation net primary productivity from 1982 to 1999 in China. Glob. Biogeochem. Cycles 2005, 19, GB2027. [Google Scholar] [CrossRef]
- Field, C.B.; Randerson, J.T.; Malmström, C.M. Global net primary production:combining ecology and remote sensing. Remote Sens. Environ. 1995, 51, 74–88. [Google Scholar]
- Shao, J.H.; Li, J.; Yan, X.G.; Ma, T.Y.; Yan, R. Analysis of spatiotemporal changes and driving forces of NPP in Shanxi Province from 2000 to 2020 based on geographic detectors. Environ. Sci. 2023, 44, 312–322. [Google Scholar]
- Wang, J.T.; Yang, Y.C.; Yang, M.H. Spatial and temporal variation and driving forces of NPP on the Loess Plateau based on Geodetector. J. Xi’an Univ. Technol. 2023, 1–10. Available online: http://kns.cnki.net/kcms/detail/61.1294.N.20221213.0940.001.html (accessed on 5 May 2023).
- Nemani, R.R.; Keeling, C.D.; Hashimoto, H.; Jolly, W.M.; Piper, S.C.; Tucker, C.J.; Myneni, R.B.; Running, S.W. Climate-driven increases in global terrestrial net primary production from 1982 to 1999. Science 2003, 300, 1560–1563. [Google Scholar] [CrossRef] [PubMed]
- Zhu, Z.; Piao, S.; Myneni, R.B.; Huang, M.; Zeng, Z.; Canadell, J.G.; Ciais, P.; Sitch, S.; Friedlingstein, P.; Arneth, A.; et al. Greening of the Earth and its drivers. Nat. Clim. Change 2016, 6, 791–795. [Google Scholar] [CrossRef]
- Cleveland, C.C.; Houlton, B.Z.; Smith, W.K.; Marklein, A.R.; Reed, S.C.; Parton, W.; Del Grosso, S.J.; Running, S.W. Patterns of new versus recycled primary production in the terrestrial biosphere. Proc. Natl. Acad. Sci. USA 2013, 110, 12733–12737. [Google Scholar] [CrossRef]
- Zhang, J.; Qi, Y.; Yang, R.; Ma, X.; Zhang, J.; Qi, W.; Guo, Q.; Wang, H. Impacts of Climate Change and Land Use/Cover Change on the Net Primary Productivity of Vegetation in the Qinghai Lake Basin. Int. J. Environ. Res. Public Health 2023, 20, 2179. [Google Scholar] [CrossRef]
- Tian, H.W.; Liu, S.Z.; Wen, B.; Zhang, J.H.; Zheng, Y.P.; Shi, J.Q.; Bi, R.T. Deciphering the Drivers of Net Primary Productivity of Vegetation in Mining Areas. Remote Sens. 2022, 14, 4177. [Google Scholar] [CrossRef]
- Jia, L.; Yu, K.X.; Deng, M.J.; Li, P.; Li, Z.B.; Shi, P.; Xu, G.C. The spatial-temporal change of annual NPP in the Heihe River basin and its response to climate factors. J. Appl. Basic Eng. Sci. 2023, 31, 523–540. [Google Scholar]
- Hurst, H.E. Long-term storage capacity of reservoirs. Trans. Am. Soc. Civ. Eng. 1951, 116, 770–799. [Google Scholar] [CrossRef]
- Rehman, S. Study of Saudi Arabian climatic conditions using Hurst exponent and climatic predictability index. Chaos Solitons Fractals 2009, 39, 499–509. [Google Scholar] [CrossRef]
- Dou, Z.X.; Sun, Y.M.; Zhu, J.H.; Zhou, Z.J. The Evaluation Prediction System for Urban Advanced Manufacturing Development. Systems 2023, 11, 392. [Google Scholar] [CrossRef]
- Yangzhou Municipal Government. Available online: http://www.yangzhou.gov.cn/yangzhou/zrdl/202203/345ceddd6476432f93591296563cbe29.shtml (accessed on 22 March 2022).
- Xu, H.Q. A remote sensing urban ecological index and its application. Acta Ecol. Sin. 2013, 33, 7853–7862. [Google Scholar]
- Yang, J.; Huang, X. The 30 m annual land cover dataset and its dynamics in China from 1990 to 2019. Earth Syst. Sci. Data 2021, 13, 3907–3925. [Google Scholar] [CrossRef]
- Tian, Y.C.; Huang, Y.L.; Zhang, Q.; Tao, J.; Zhang, Y.L.; Huang, H.; Zhou, G.Q. Spatial and temporal distribution of net primary productivity of vegetation in the Nanliu River basin of the Gulf of Tonkin and its driving factors. Acta Ecol. Sin. 2019, 39, 8156–8171. [Google Scholar]
- Zhou, G.S.; Zhang, X.S. Study on climate vegetation classification for global change in China. Acta Botanica Sinica 1996, 38, 8–17. [Google Scholar]
- Running, S.W.; Thornton, P.E.; Nemani, R.; Glassy, J.M. Global Terrestrial Gross and Net Primary Productivity from the Earth Observing System, in Methods in Ecosystem Science; Sala, O., Jackson, R., Mooney, H., Eds.; Springer: Berlin/Heidelberg, Germany, 2000; pp. 44–57. [Google Scholar]
- Yuan, L.; Jiang, W.; Shen, W.; Liu, Y.; Wang, W.; Tao, L.; Zheng, H.; Liu, X. The spatio-temporal variations of vegetation cover in the Yellow River Basin from 2000 to 2010. Acta Ecol. Sin. 2013, 33, 7798–7806. [Google Scholar]
- Chen, Y.H.; Wang, J.; Xiong, N.N.; Sun, L.; Xu, J.Q. Impacts of Land Use Changes on Net Primary Productivity in Urban Agglomerations under Multi-Scenarios Simulation. Remote Sens. 2022, 14, 1755. [Google Scholar] [CrossRef]
- Ray, R.; Khondekar, M.H.; Ghosh, K.; Bhattacharjee, A.K. Scaling and nonlinear behaviour of daily mean temperature time series across India. Chaos Solitons Fractals 2016, 84, 9–14. [Google Scholar] [CrossRef]
- Li, C.; Dou, T.; Wang, Y.; Zhu, T.; Yin, H.; Zhou, M.; Liu, L.; Wu, X. A Method for Quantifying the Impacts of Human Activities on Net Primary Production of Grasslands in Northwest China. Remote. Sens. 2021, 13, 2479. [Google Scholar] [CrossRef]
- Du, L.T.; Gong, F.; Zeng, Y.J.; Ma, L.L.; Qiao, C.L.; Wu, H.Y. Carbon use efficiency of terrestrial ecosystems in desert/grassland biome transition zone: A case in Ningxia province, northwest China. Ecol. Indic. 2021, 120, 106971. [Google Scholar] [CrossRef]
- Wang, J.F.; Xu, C.D. Geographic detectors: Principles and prospects. J. Geogr. 2017, 72, 116–134. [Google Scholar]
- Gong, C.; Wang, S.X.; Lu, H.C.; Chen, Y.; Liu, J.F. Research progress on spatial differentiation and influencing factors of soil heavy etectors. Environ. Sci. 2023, 44, 2799–2816. [Google Scholar]
- Yuan, Z.; Jiang, Q.Q.; Yin, J. Impact of climate change and land use change on ecosystem net primary productivity in the Yangtze River and Yellow River Source Region, China. Watershed Ecol. Environ. 2023, 5, 125–133. [Google Scholar] [CrossRef]
- Li, X.C.; Luo, Y.H.; Wu, J.H. Decoupling Relationship between Urbanization and Carbon Sequestration in the Pearl River Delta from 2000 to 2020. Remote Sens. 2022, 14, 526. [Google Scholar] [CrossRef]
- Liu, W.R.; Li, X.T.; Li, T.; Jia, B.Q. Spatiotemporal variations of forest NPP and related driving factors based on MODIS and CASA models in Yichun. Chin. J. Ecol. 2022, 41, 150–158. [Google Scholar] [CrossRef]
- Yin, K.; Tian, Y.C.; Yuan, C.; Zhang, F.F.; Fan, Q.Z.; Hua, L.Z. NPP spatial and temporal pattern of vegetation in Beijing and its factor explanation based on CASA model. Remote Sens. Land Resour. 2015, 27, 133–139. [Google Scholar]
- Li, J.G.; Wang, H.; Wang, J.; Li, Q.; Zhang, Z.Q.; Liu, L.L.; Pu, L.J. The impact of urbanization process on the productivity of Terrestrial ecosystem based on linear fitting—Taking Jiangsu Province as an example. Resour. Sci. 2018, 40, 32–43. [Google Scholar]
- Li, Y.; Xie, Z.; Qin, Y.; Zheng, Z. Estimating relations of vegetation, climate change, and human activity: A case study in the 400mm annual precipitation fluctuation zone. China Remote Sens. 2019, 11, 1159. [Google Scholar] [CrossRef]
- Qi, S.Y.; Chen, S.D.; Long, X.R.; An, X.X.; Zhang, M. Quantitative contribution of climate change and anthropological activities to vegetation carbon storage in the Dongting Lake basin in the last two decades. Adv. Space Res. 2023, 71, 845–868. [Google Scholar] [CrossRef]
- Gong, H.B.; Li, C.; Ya, F.D.; Jiao, F.S.; Xu, X.J.; Zhang, M.Y.; Wang, K.L.; Liu, H.Y. Multiple effects of climate changes and human activities on NPP increase in the Three-north Shelter Forest Program area. For. Ecol. Manag. 2023, 529, 120732. [Google Scholar] [CrossRef]
- Yang, A.L.; Zhang, H.; Yang, X.J.; Zhang, X.P. Quantitative analysis of the impact of climate change and human activities on vegetation NPP in the Qilian Mountain. Hum. Ecol. Risk Assess. Int. J. 2023, 29, 202–221. [Google Scholar] [CrossRef]
- Wang, Z.Q.; Wang, H.; Wang, T.F.; Wang, L.N.; Huang, X.T.; Zheng, K.; Liu, X. Effects of Environmental Factors on the Changes in MODIS NPP along DEM in Global Terrestrial Ecosystems over the Last Two Decades. Remote Sens. 2022, 14, 713. [Google Scholar] [CrossRef]

| Data Type | Data Content | Spatial Resolution | Data Coordinate System | Data Sources |
|---|---|---|---|---|
| Climate data | Monthly temperature | 1 km | WGS84-UTM-50 | https://data.tpdc.ac.cn/ (accessed on 22 February 2023) |
| Monthly rainfall | 1 km | WGS84-UTM-50 | https://data.tpdc.ac.cn/ (accessed on 22 February 2023) | |
| Monthly solar radiation | 1 km | WGS84-UTM-50 | https://data.cma.cn/ (accessed on 22 February 2023) | |
| Social data | GDP of Yangzhou City | 1 km | WGS84-UTM-50 | https://www.resdc.cn/ (accessed on 25 February 2023) |
| POP of Yangzhou City | 1 km | WGS84-UTM-50 | https://www.resdc.cn/ (accessed on 25 February 2023) | |
| Distance to road | 30 m | WGS84-UTM-50 | https://www.openstreetmap.org/ (accessed on 25 February 2023) | |
| Land-use CLCD | 30 m | WGS84-UTM-50 | https://doi.org/10.5194/essd-13-3907-2021/ (accessed on 26 February 2023) | |
| Ecological data | NDVI | 30 m | WGS84-UTM-50 | Google Earth Engine-based inversion |
| NDBSI | 30 m | WGS84-UTM-50 | Google Earth Engine-based inversion | |
| WET | 30 m | WGS84-UTM-50 | Google Earth Engine-based inversion | |
| Other data | DEM data | 30 m | WGS84-UTM-50 | NASA DEM30 m Type Dataset |
| Administrative division Map of Yangzhou City | — | WGS84-UTM-50 | https://www.resdc.cn/ (accessed on 22 February 2023) | |
| Historical and cultural data of Yangzhou City | — | — | http://www.yangzhou.gov.cn/yangzhou/zrdl/ (accessed on 28 February 2023) and the annals of statistics |
| No. | Land use | NDVIi,max | NDVIi,min | εmax |
|---|---|---|---|---|
| 1 | Farmland | 0.634 | 0.023 | 0.604 |
| 2 | Forest | 0.676 | 0.023 | 1.295 |
| 3 | Water | 0.634 | 0.023 | 0.542 |
| 4 | Urban | 0.634 | 0.023 | 0.542 |
| 5 | Unused land | 0.634 | 0.023 | 0.542 |
| The Value Range of β and Hurst Index | Future Trends |
|---|---|
| β > 0, H > 0.5 | Continuing Improvement |
| β < 0, H > 0.5 | Continuing Decline |
| β > 0, H < 0.5 | Improvement to Decline |
| β < 0, H < 0.5 | Decline to Improvement |
| Β = 0 | Remained Stable |
| NPP Level | 2000 | 2005 | 2010 | 2015 | 2020 | |||||
|---|---|---|---|---|---|---|---|---|---|---|
| Area/km2 | % | Area/km2 | % | Area/km2 | % | Area/km2 | % | Area/km2 | % | |
| Worst | 345.07 | 5.26% | 472.15 | 7.20% | 469.75 | 7.17% | 496.23 | 7.57% | 545.52 | 8.32% |
| Poor | 478.12 | 7.29% | 555.04 | 8.47% | 805.80 | 12.29% | 515.31 | 7.86% | 599.44 | 9.15% |
| Medium | 3341.66 | 50.98% | 1963.81 | 29.96% | 3470.35 | 52.95% | 2663.92 | 40.64% | 2816.01 | 42.96% |
| Better | 2388.46 | 36.44% | 3562.32 | 54.35% | 1807.41 | 27.57% | 2877.85 | 43.91% | 2592.19 | 39.55% |
| Best | 1.22 | 0.02% | 1.22 | 0.02% | 1.22 | 0.02% | 1.22 | 0.02% | 1.37 | 0.02% |
| District | 2000 NPP | Rank | 2005 NPP | Rank | 2010 NPP | Rank | 2015 NPP | Rank | 2020 NPP | Rank | Mean of NPP 2000–2020 | Rank |
|---|---|---|---|---|---|---|---|---|---|---|---|---|
| Hanjiang | 422.72 | 5 | 418.92 | 6 | 409.22 | 5 | 377.34 | 5 | 399.53 | 5 | 405.55 | 5 |
| Jiangdu | 467.45 | 2 | 459.86 | 3 | 450.15 | 1 | 423.35 | 3 | 455.82 | 1 | 451.32 | 2 |
| Yizheng | 446.49 | 3 | 463.93 | 2 | 440.99 | 3 | 435.40 | 2 | 446.83 | 3 | 446.73 | 3 |
| Guangling | 439.91 | 4 | 424.14 | 4 | 422.65 | 4 | 381.25 | 4 | 410.08 | 4 | 415.61 | 4 |
| Baoying | 475.10 | 1 | 484.33 | 1 | 443.05 | 2 | 441.23 | 1 | 455.42 | 2 | 459.82 | 1 |
| Gaoyou | 415.92 | 6 | 418.45 | 5 | 402.62 | 6 | 343.27 | 6 | 365.99 | 6 | 389.25 | 6 |
| Yangzhou | 449.20 | / | 451.84 | / | 432.02 | / | 403.02 | / | 424.17 | / | 432.05 | / |
| Class | Grade | 2000–2005 | 2005–2010 | 2010–2015 | 2015–2020 | ||||||||
|---|---|---|---|---|---|---|---|---|---|---|---|---|---|
| Grade Area /km2 | Class Area /km2 | Percentage% | Grade Area /km2 | Class Area /km2 | Percentage% | Grade Area /km2 | Class Area /km2 | Percentage% | Grade Area /km2 | Class Area /km2 | Percentage% | ||
| Degradation | 1 | 180.74 | 1086.45 | 16.58 | 840.19 | 2950.33 | 45.01 | 267.94 | 1148.54 | 17.52 | 563.29 | 2710.47 | 41.35 |
| 2 | 905.71 | 2110.13 | 880.60 | 2147.18 | |||||||||
| NO change | 3 | 1977.28 | 1977.28 | 30.17 | 2065.09 | 2065.09 | 31.51 | 2057.48 | 2057.48 | 31.39 | 2724.99 | 2724.99 | 41.57 |
| Improvement | 4 | 2255.65 | 3490.81 | 53.26 | 1165.48 | 1539.13 | 23.48 | 1843.32 | 3348.52 | 51.09 | 1117.65 | 1119.08 | 17.07 |
| 5 | 1235.16 | 373.65 | 1505.21 | 1.43 | |||||||||
| Driving Factors | Ecological Factors | Climatic Factors | Social Factors | |||||||
|---|---|---|---|---|---|---|---|---|---|---|
| NDVI | WET | NDBSI | Rainfall | TEM | RAD | LUCC | DTR | POP | GDP | |
| q statistic | 0.7287 | 0.3923 | 0.2085 | 0.0163 | 0.0343 | 0.0124 | 0.5601 | 0.0266 | 0.0651 | 0.0275 |
| p-value | 0.000 | 0.000 | 0.000 | 0.000 | 0.000 | 0.000 | 0.000 | 0.000 | 0.000 | 0.000 |
| Land-Use Type | 2000 | 2005 | 2010 | 2015 | 2020 |
|---|---|---|---|---|---|
| Mean values of NPP | 449.2002 | 451.8444 | 432.0215 | 403.0195 | 424.1662 |
| Farmland | 456.5331 | 455.7672 | 438.6139 | 407.8482 | 411.9065 |
| Forest | 478.0433 | 489.3618 | 461.6351 | 449.2652 | 472.9257 |
| Water | 292.51 | 263.4293 | 284.5288 | 158.4521 | 156.6578 |
| Urban | 242.5894 | 317.584 | 301.0946 | 257.5867 | 290.9038 |
| Unused land | 435.5329 | 260.052 | 362.058 | 276.519 | 223.492 |
| 2000–2020 | Farmland | Forest | Water | Unused Land | Urban |
|---|---|---|---|---|---|
| Farmland | 4564.5777 | 1.71 | 188.4123 | 0.0108 | 456.525 |
| Forest | 6.5232 | 6.0462 | 1.629 | 0.0000 | 0.7218 |
| Water | 108.9126 | 0.423 | 707.8401 | 0.0036 | 20.0673 |
| Urban | 1.5939 | 0.0000 | 3.5703 | 0.0000 | 505.5921 |
| q | LUCC | NDVI | WET | NDBSI | Rainfall | TEM | RAD | DTR | POP | GDP |
|---|---|---|---|---|---|---|---|---|---|---|
| LUCC | 0.5601 | |||||||||
| NDVI | 0.7777 | 0.7287 | ||||||||
| WET | 0.6269 | 0.7491 | 0.3923 | |||||||
| NDBSI | 0.6283 | 0.7327 | 0.6467 | 0.2085 | ||||||
| Rainfall | 0.5742 | 0.7343 | 0.4145 | 0.2872 | 0.0163 | |||||
| TEM | 0.5820 | 0.7407 | 0.4243 | 0.2913 | 0.0688 | 0.0343 | ||||
| RAD | 0.5871 | 0.7405 | 0.4166 | 0.2652 | 0.0918 | 0.0481 | 0.0124 | |||
| DTR | 0.5714 | 0.7348 | 0.4101 | 0.2642 | 0.0582 | 0.0849 | 0.0896 | 0.0266 | ||
| POP | 0.5740 | 0.7348 | 0.4354 | 0.2882 | 0.0900 | 0.0904 | 0.0775 | 0.0953 | 0.0651 | |
| GDP | 0.5678 | 0.7334 | 0.4173 | 0.2847 | 0.0361 | 0.0570 | 0.0469 | 0.0484 | 0.0707 | 0.0275 |
| Pearson Correlation | NPP | NDVI | WET | NDBSI | Rainfall | TEM | RAD | DTR | POP | GDP |
|---|---|---|---|---|---|---|---|---|---|---|
| NPP | 1.000 ** | |||||||||
| NDVI | 0.854 ** | 1.000 ** | ||||||||
| WET | −0.385 ** | −0.237 ** | 1.000 ** | |||||||
| NDBSI | −0.484 ** | −0.709 ** | −0.424 ** | 1.000 ** | ||||||
| Rainfall | 0.017 ** | −0.012 | −0.382 ** | 0.375 ** | 1.000 ** | |||||
| TEM | −0.108 ** | −0.116 ** | −0.249 ** | 0.372 ** | 0.804 ** | 1.000 ** | ||||
| RAD | 0.095 ** | 0.099 ** | 0.272 ** | −0.363 ** | −0.857 ** | −0.914 ** | 1.000 ** | |||
| Distance to road | −0.017 ** | 0.008 | 0.163 ** | −0.162 ** | −0.341 ** | −0.564 ** | 0.587 ** | 1.000 ** | ||
| POP | 0.003 | −0.061 ** | −0.202 ** | 0.244 ** | 0.534 ** | 0.529 ** | −0.539 ** | −0.443 ** | 1.000 ** | |
| GDP | −0.048 ** | −0.103 ** | −0.204 ** | 0.289 ** | 0.606 ** | 0.621 ** | −0.640 ** | −0.423 ** | 0.921 ** | 1.000 ** |
Disclaimer/Publisher’s Note: The statements, opinions and data contained in all publications are solely those of the individual author(s) and contributor(s) and not of MDPI and/or the editor(s). MDPI and/or the editor(s) disclaim responsibility for any injury to people or property resulting from any ideas, methods, instructions or products referred to in the content. |
© 2023 by the authors. Licensee MDPI, Basel, Switzerland. This article is an open access article distributed under the terms and conditions of the Creative Commons Attribution (CC BY) license (https://creativecommons.org/licenses/by/4.0/).
Share and Cite
Zhou, Y.; Shao, M.; Li, X. Temporal and Spatial Evolution, Prediction, and Driving-Factor Analysis of Net Primary Productivity of Vegetation at City Scale: A Case Study from Yangzhou City, China. Sustainability 2023, 15, 14518. https://doi.org/10.3390/su151914518
Zhou Y, Shao M, Li X. Temporal and Spatial Evolution, Prediction, and Driving-Factor Analysis of Net Primary Productivity of Vegetation at City Scale: A Case Study from Yangzhou City, China. Sustainability. 2023; 15(19):14518. https://doi.org/10.3390/su151914518
Chicago/Turabian StyleZhou, Yinqiao, Ming Shao, and Xiong Li. 2023. "Temporal and Spatial Evolution, Prediction, and Driving-Factor Analysis of Net Primary Productivity of Vegetation at City Scale: A Case Study from Yangzhou City, China" Sustainability 15, no. 19: 14518. https://doi.org/10.3390/su151914518
APA StyleZhou, Y., Shao, M., & Li, X. (2023). Temporal and Spatial Evolution, Prediction, and Driving-Factor Analysis of Net Primary Productivity of Vegetation at City Scale: A Case Study from Yangzhou City, China. Sustainability, 15(19), 14518. https://doi.org/10.3390/su151914518


