Article

Temporal and Spatial Evolution, Prediction, and Driving-Factor Analysis of Net Primary Productivity of Vegetation at City Scale: A Case Study from Yangzhou City, China

School of Landscape Architecture, Beijing Forestry University, Beijing 100083, China
*
Author to whom correspondence should be addressed.
Sustainability 2023, 15(19), 14518; https://doi.org/10.3390/su151914518
Submission received: 22 August 2023 / Revised: 22 September 2023 / Accepted: 22 September 2023 / Published: 6 October 2023

Abstract

:
Net primary productivity (NPP) is an important index with which to evaluate the safety and quality of regional carbon sinks. Based on the improved CASA model, climate data, social data, remote-sensing ecological data, and other multi-source data types, this article took a Chinese city, Yangzhou, as the research object, used Theil–Sen medium-trend analysis and the Hurst index to analyze its spatial–temporal-evolution characteristics and future change trends, and used geographical detectors to analyze the impact of climate, social, ecological, and other factors on the change in NPP in the study area, with the intention of providing a theoretical exploration and practical basis for achieving the “dual carbon” goals in the region. The results showed that the annual average NPP levels of the vegetation in Yangzhou in the five sampling years were 445.343 gc/m2·a, 447.788 gc/m2·a, 427.763 gc/m2·a, 398.687 gc/m2·a, and 420.168 gc/m2·a, respectively, exhibiting a trend that first decreases and then increases, with a slight overall decrease from 2000 to 2020. The area in which the vegetation in Yangzhou had the higher grades of NPP increased by 203,874 km², and an increase of 321,769 km² in the lower levels was observed. The NPP level of vegetation showed polarization, with relatively high levels in the surrounding farmland and mountain–forest areas and relatively low levels in densely populated urban areas. The ranking was highest in Baoying and lowest in Gaoyou. From the average NPP of all the land types in the study area, the following trend was exhibited: forest land > farmland > bare soil > impermeable surface > water. The future change in vegetation NPP in Yangzhou City will mainly follow the trend of the past 20 years, with a slow decrease. The NDVI (q = 0.728) and LUCC (q = 0.5601) were the leading driving factors of vegetation NPP change in Yangzhou City, and the interaction effect of double driving factors was greater than that of single driving factors.

1. Introduction

With the acceleration of urbanization, CO2 emissions derived from urban development activities, such as deforestation, land reclamation, and the large-scale extraction of fossil fuels, have disrupted the original carbon balance of ecosystems, had a significant impact on regional vegetation systems, and caused a series of environmental problems [1,2,3]. Net primary productivity (NPP) not only reflects the impact of climate change, social activities, and ecological factors on vegetation productivity to a certain extent but also serves as an important ecological indicator for the sustainable development level of vegetation ecosystems [4,5]. China has committed to reaching its carbon peak by 2030 and achieving carbon neutrality by 2060 [6,7]. To achieve these goals, the trends in and driving factors of NPP in different regions of China will be explored for sustainable low-carbon development. The timely and accurate monitoring of the changing trend in NPP in a region and its leading driving factors are crucial for low-carbon and sustainable development in the region. Since 1960, scholars from various countries have begun to attach importance to the study of NPP. The International Biological Program (IBP) conducted extensive measurements of plant NPP from 1965 to 1974. The subsequent International Geo Biosphere Program (IGBP), Global Change and Terrestrial Ecosystems (GCTE), the Kyoto Protocol, and others have identified NPP research on vegetation as one of their core contents. After the signing of the Paris Agreement in 2015, the estimation of vegetation NPP, its spatiotemporal differentiation characteristics, and the analysis of its driving factors have become important research topics [8].
The methods for estimating vegetation NPP comprise two categories: the measured-biomass method and the model-estimation method. The former is a method based on the on-site measurement of sample sites. Due to limitations in on-site conditions, it is usually suitable for small-scale areas. For larger-scale research areas, model-estimation methods are often used. With the development of remote-sensing and computer technology, satellite remote-sensing images have been widely used for estimating NPP due to their advantages of strong timeliness, convenient data collection, high efficiency, and large coverage [9,10]. Due to the low resolution of early remote-sensing data sources, remote-sensing-based NPP estimation methods were usually only applicable to large-scale spaces, and the estimation results did not present sufficient spatial details. Due to factors such as climate change and human interference, the fragmentation of vegetation systems is becoming increasingly severe, and high-resolution remote-sensing images are particularly important for estimating NPP. With the rapid development of remote-sensing technology, there are currently abundant sources of high-resolution optical remote-sensing image data. Landsat data are among the most widely used for long-term series NPP estimation [11]. At the same time, the remote-sensing cloud-computing platform GEE (Google Earth Engine) provides support for the acquisition, rapid processing, and analysis of long-term Landsat data, changing the traditional mode of remote-sensing data acquisition and analysis and greatly improving computational efficiency.
In recent years, research on NPP has mainly focused on two directions. One is the establishment and optimization of NPP estimation models [12,13], and the other is exploring the response mechanism of NPP, with climate factors and human activities as the main driving factors [14,15]. Among numerous NPP estimation models, the CASA (Carnegie–Ames–Stanford approach) model based on the principle of vegetation light efficiency is one of the most effective research methods [12,16,17]. In the CASA model, NPP is represented by the product of two factors: the absorbed photosynthetically active radiation of vegetation (APAR) and the light-use-efficiency factor ε [18,19]. In particular, the value of the maximum light-energy utilization rate of vegetation has a significant impact on the estimation of NPP. Early studies focused on the maximum utilization of light energy in global vegetation, where εmax is assumed to be a constant, with a value of 0.389 gC·MJ−1 [20]. Later research found that the maximum solar energy utilization rate varies among different plants. In 2007, the CASA model was improved by Zhu et al. [13]. Using measured data from China’s NPP, the maximum solar energy utilization efficiency of different types of vegetation was calculated as εmax, and combined with existing regional evapotranspiration models and meteorological data from China, simplifying the estimation of water-stress factors and enhancing the operability of the CASA model [13]. On the other hand, the research on the driving factors of NPP mainly focuses on the impact of climate change and human activities on regional NPP. The research results indicate that natural factors, such as temperature, water content, and CO2 concentration, are the main driving factors leading to changes in NPP in some regions [21,22,23]. Moderate warming can improve the efficiency of NPP [24]. Furthermore, the increase in water content in arid areas can promote plant growth [25]. The fertilization effect of CO2 can increase the carbon sequestration capacity of vegetation [24]. In addition, artificial factors such as land-use change and human activities also have a significant impact on NPP changes. For example, Zhang et al. used the R-contribution ratio and partial correlation analysis to study the impact of land use and climate change on the spatiotemporal evolution characteristics of vegetation NPP in the Qinghai Lake Basin from 2000 to 2020. They found that climate change was the main driving factor for NPP change, and at the same time, the impact of land-use type change on NPP gradually increased [26]. Tian et al. studied the effects of climate, human activities, and soil factors on the spatial differentiation of vegetation NPP in the Changhe Basin based on the moving window method and Pearson correlation analysis method. The results showed that NPP in the western part of the study area was mainly influenced by climate human activities, while in the eastern part, it was mainly influenced by soil properties and climate [27]. The study of the future development trend of NPP has an important monitoring and warning role for the low-carbon and sustainable development of the region. At present, the main models for analyzing the trend of NPP changes are the combination of the Theil–Sen median trend analysis and the Mann–Kendall test [28]. The prediction of future development is mainly achieved through R/S analysis and the Hurst index method [26,28]. However, current research cannot fully explain the interaction between NPP changes and many driving factors. In particular, the research on predicting the future development of vegetation NPP at the city scale is relatively limited.
The innovation of this study comprises: (1) Currently, there is relatively little research on high-precision spatiotemporal differentiation characteristics and future development trend prediction of urban-scale NPP using long-term series and high-resolution Landsat images. This article utilizes 30 m resolution Landsat8-OLI data from the GEE cloud platform to estimate the vegetation NPP values in Yangzhou City, China, from 2000 to 2020 using an improved CASA model. The spatiotemporal variation characteristics are summarized, and the Theil–Sen Median trend analysis method [29] and Hurst index analysis method [30,31] are used to predict the future trend of vegetation NPP in Yangzhou City, filling the gap in high-precision vegetation NPP research in Yangzhou City; (2) From the perspective of driving-factor analysis, existing research mostly focuses on the impact of climate factors and human activities on NPP, while there is insufficient research on other ecological factors. This article refers to the sociological PPM (push–pull–mooring) theory [28] and adds NDVI (Normalized Difference Vegetation Index) and LUCC (land-use cover change) factors. From multiple perspectives such as ecology, society, economy, climate, etc., it fully analyzes the positive factors (push), negative factors (pull), and key factors (mooring) of vegetation NPP changes, analyzes the relative contribution values of various driving factors, identifies key constraints, and explores research methods to provide theoretical and data support for improving carbon-sink levels and low-carbon sustainable development of future urban vegetation; (3) From the perspective of research scale, current NPP research is mostly focused on large-scale spaces such as the global, national, or watershed. There is relatively insufficient research on small-scale, long-term, and high-precision NPP. The research object of this article is Yangzhou City, located in the central part of Jiangsu Province, China, adjacent to the Yangtze River to the south. It is a famous ecological garden city in the Yangtze River Delta and a livable city for the United Nations. With the continuous development of urbanization, ecological problems such as vegetation degradation, increased carbon emissions, and deepening landscape fragmentation are becoming increasingly prominent. At present, research on vegetation NPP in Yangzhou City is still blank, and the results of this study have important practical value for low-carbon and sustainable development in Yangzhou City.
The purpose of this study is to predict the development trend of urban vegetation NPP. The research framework is shown in Figure 1.
The research steps are as follows:
Step 1: Data collection and processing;
Step 2: Based on the improved CASA model, estimate the vegetation NPP value and analyze the spatiotemporal pattern of vegetation NPP in the study area;
Step 3: Analyze the trend of vegetation NPP changes in the study area from 2000 to 2020;
Step 4: Predict the development trend of vegetation NPP in the research area in the next 20 years;
Step 5: Introduce the PPM theory of sociology and analyze the positive (push) factors, restrictive factors (pull), and key factors (mooring) that affect the changes in vegetation NPP in the study area;
Step 6: Suggestions for low-carbon sustainable development in the research area.

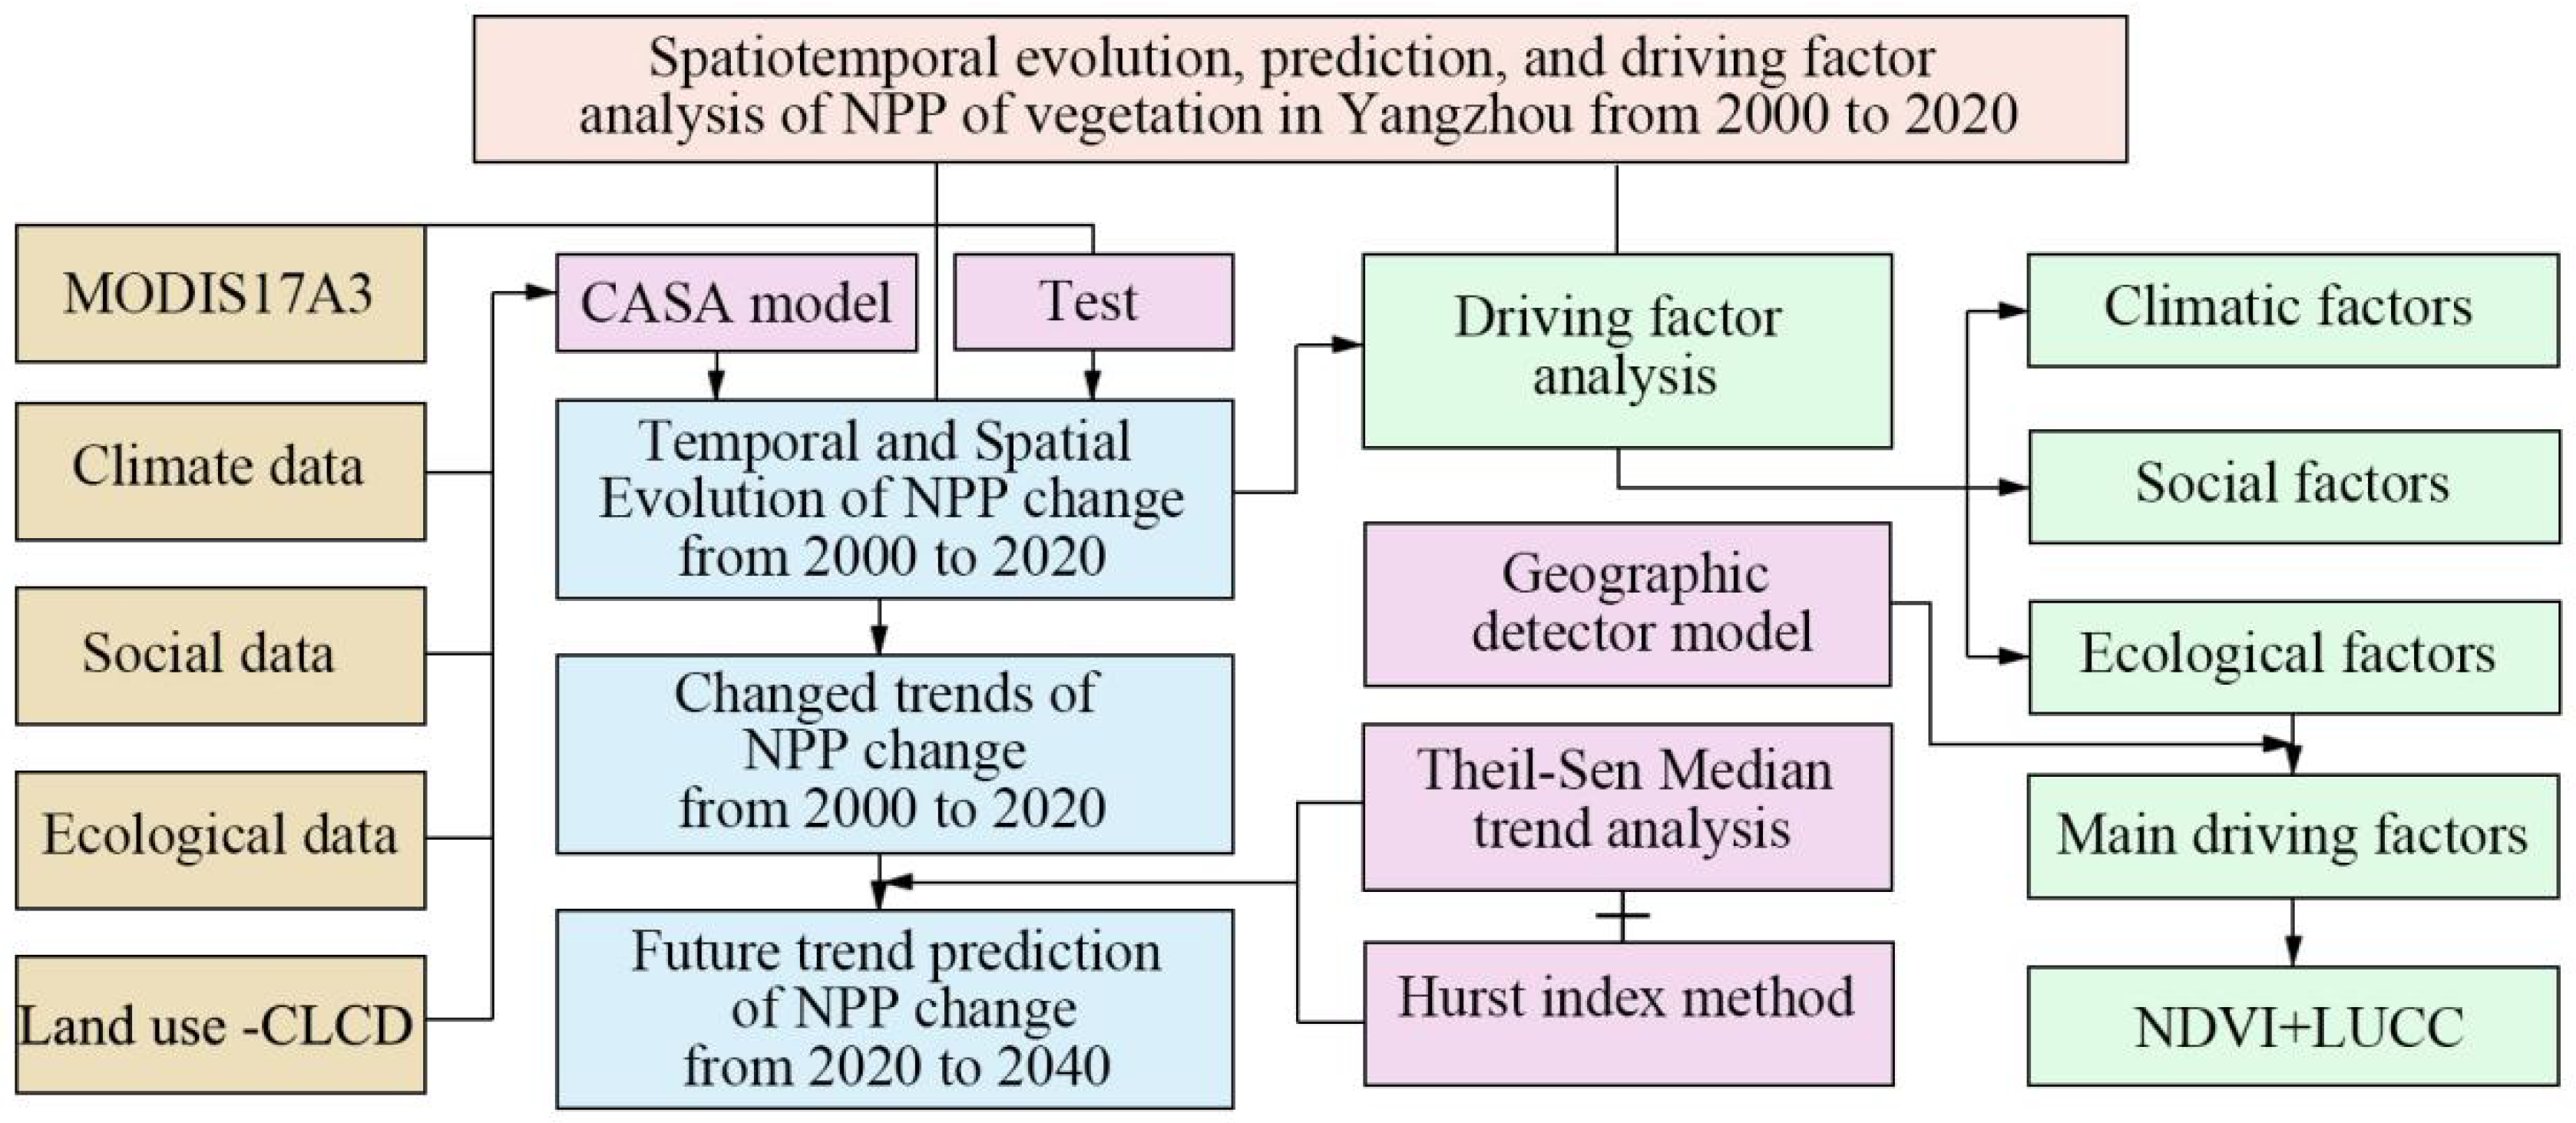
2. Materials and Methods
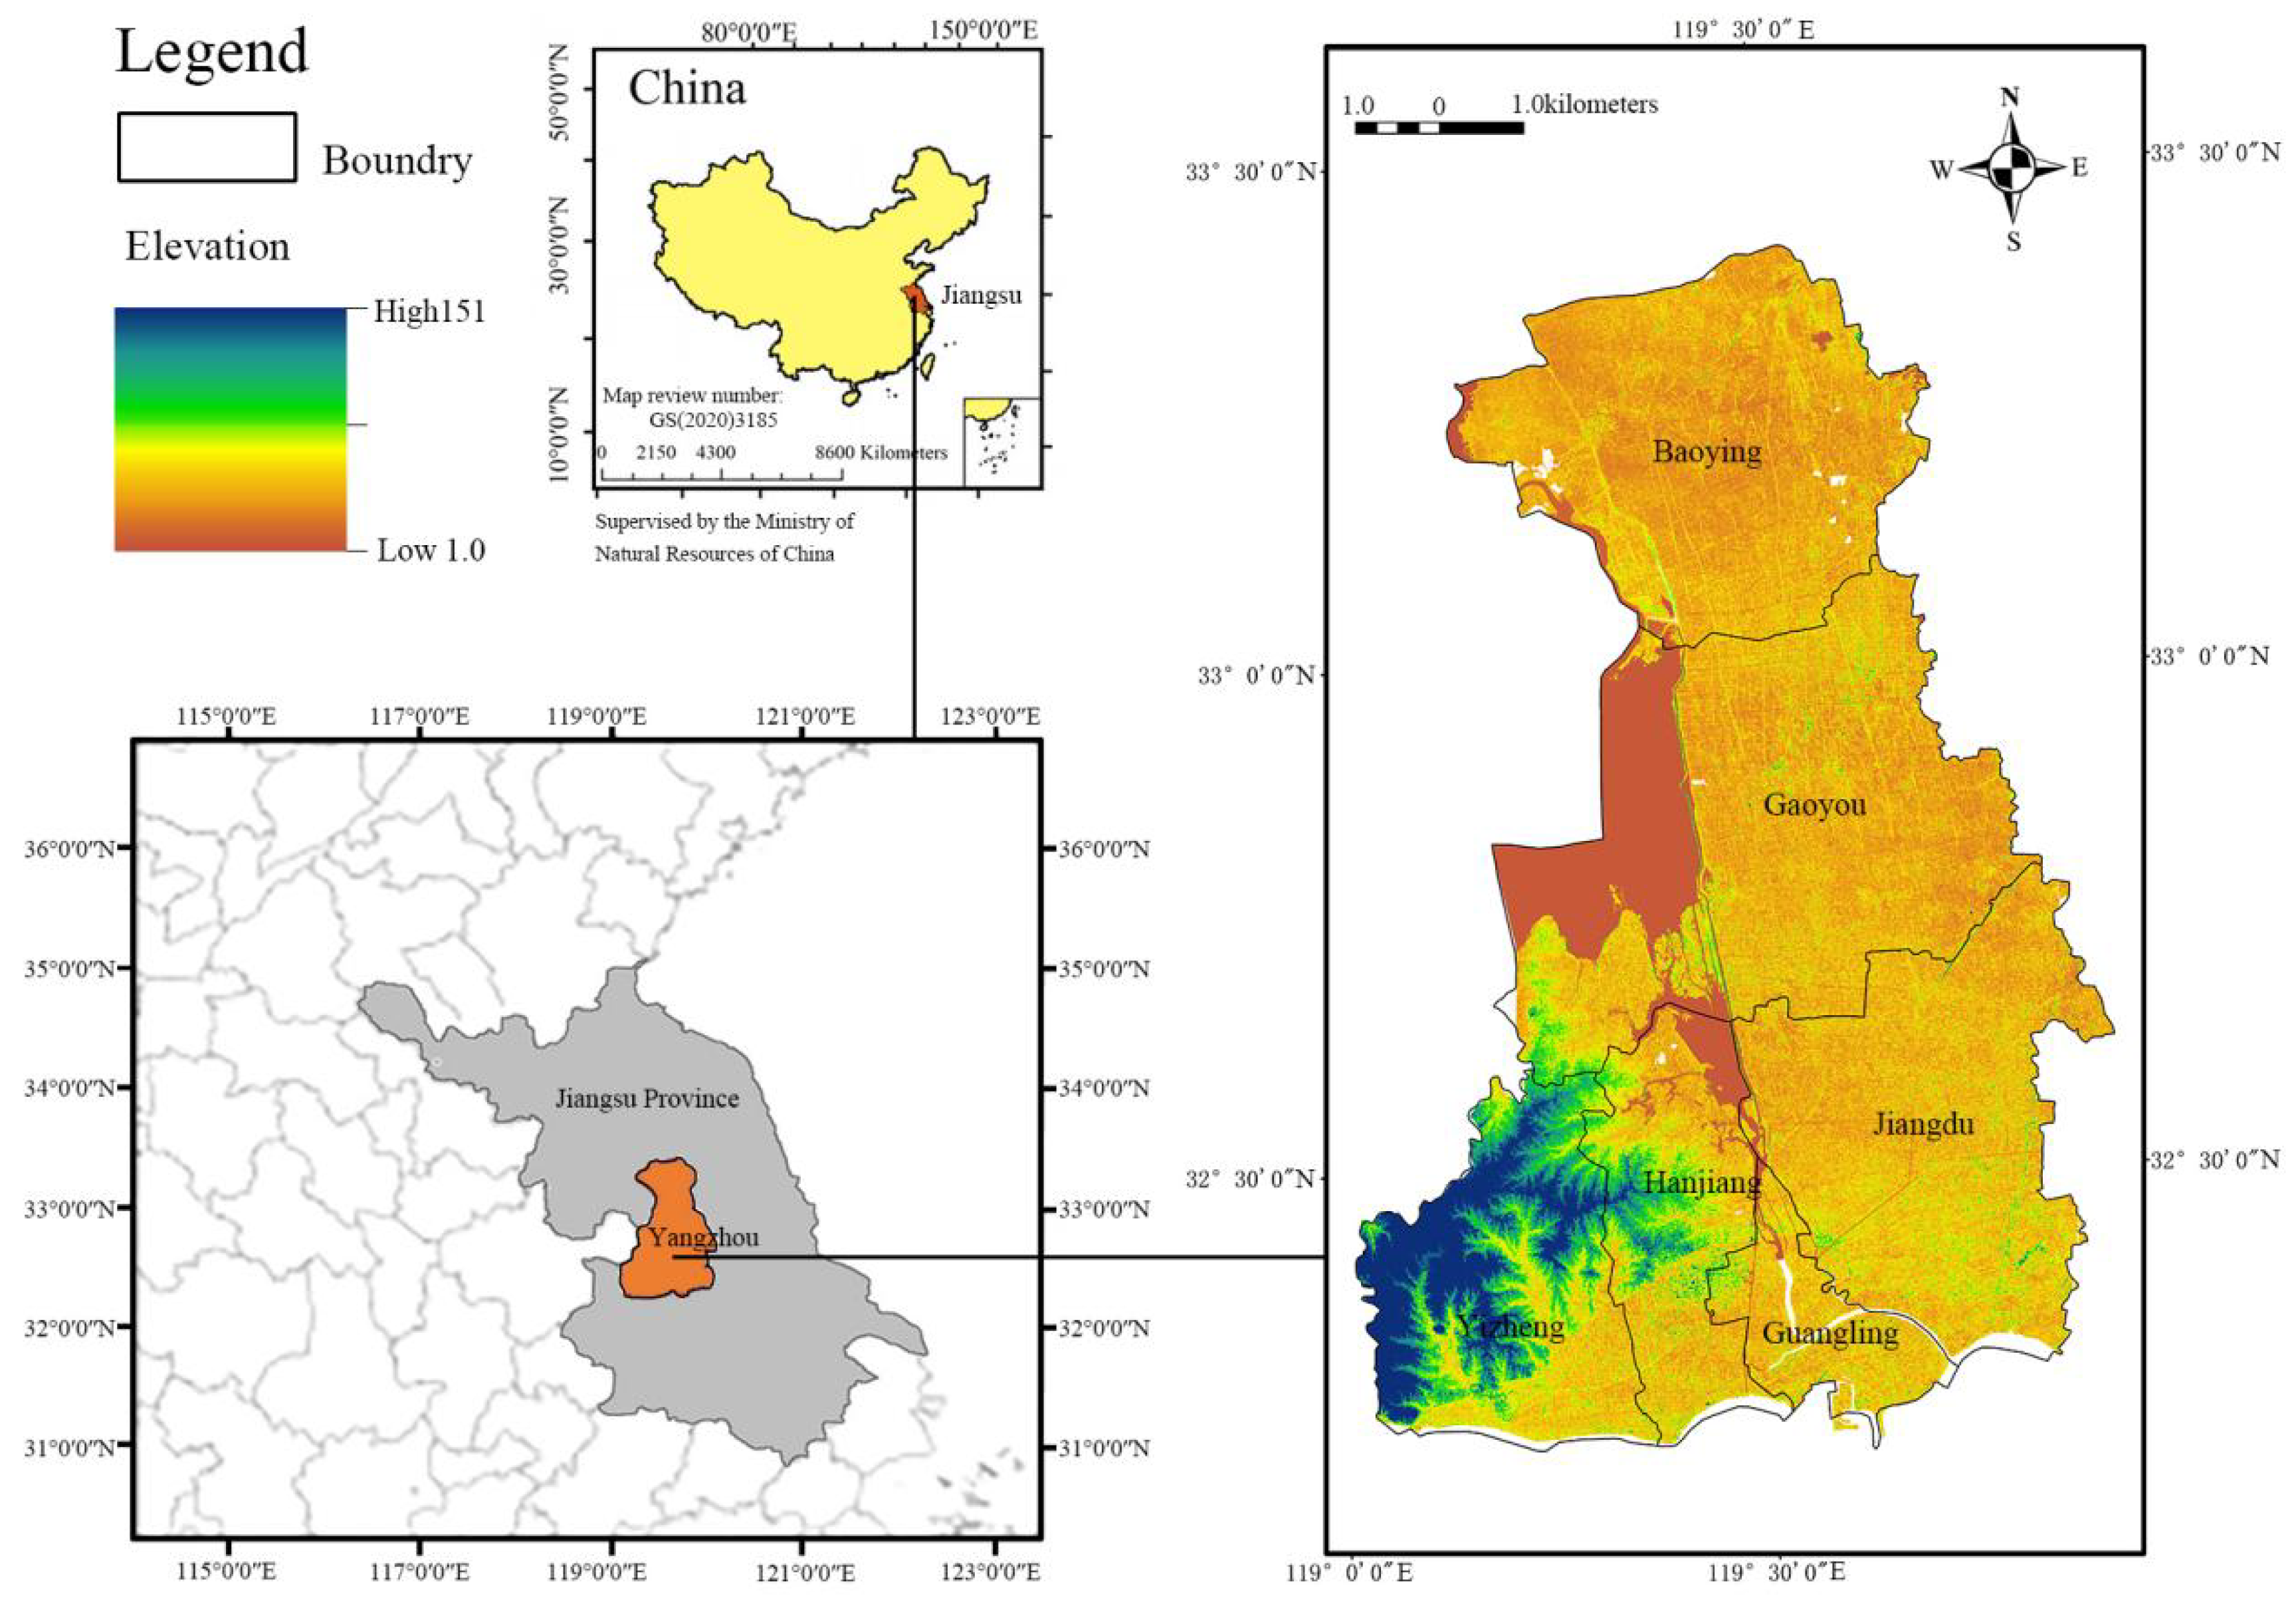
2.1. Study Area

This study selects Yangzhou City as the research object. Yangzhou is in the middle of Jiangsu Province, bordering the Yangtze River in the south, Gaoyou Lake in the west, and the Beijing Hangzhou Grand Canal runs through it. It is important for the Yangtze River Delta Economic Belt. Its total area is 6554.539 km², with three districts and one county in its jurisdiction, and two county-level cities, namely Baoying County, Gaoyou, Yizheng, Hanjiang District, Guangling District, and Jiangdu District, covering 66 streets/towns. The geographical location is between 119°01′–119°54′ E and 31°56′–33°25′ N. The overall terrain is dominated by plains, high in the west and low in the east. The mountain area in Yizheng City in the west has the highest elevation of about 150 m. In contrast, Baoying County, Gaoyou and Jiangdu District in the east have the lowest terrain, which is a shallow lake area (Figure 2). Yangzhou City belongs to the subtropical humid monsoon climate zone, with four distinct seasons: sufficient heat, abundant rainfall, and hot and rainy seasons. The vegetation status in the research area is relatively rich [32].

2.2. Data Sources

This article uses data including land-use data from 2000, 2005, 2010, 2015, and 2020, with ecological index data provided by the normalized difference vegetation index (NDVI), normalized difference built-up and soil index (NDBSI), wetness component of the tasseled cap transformation (WET); climate data comes from average annual temperature (TEM), average annual rainfall, average annual solar radiation (RAD); and socio-economic data is GDP, population density of Yangzhou City (POP), and Euclidean distance to main roads (DTR). Among them, the ecological index data are based on the calculation method proposed by Xu Hanqiu [33], using the GEE platform to invert the 30 m spatial-resolution Landsat8-OLI remote-sensing image-calculation results. Land-use data are derived from the 30 m precision land-cover data product of Wuhan University from 1985 to 2021. The overall classification accuracy of these data is as high as 80%, which has a high reference value for land-type-related research. In this article, the land use of Yangzhou City is divided into six categories: farmland, forest, grassland, bare soil, water, and impermeable pavement [34]. Meteorological data are sourced from the National Qinghai Tibet Plateau Science Data Center and the National Meteorological Science Data Center, and raster image data are formed using the interpolation method. All data were unified to a 30 m grid accuracy using the ArcGIS10.8 resampling tool (Table 1).

2.3. Methodology

2.3.1. Improved CASA Model

In this paper, the improved CASA model [13] based on the light-energy utilization method is used to estimate the NPP of vegetation in Yangzhou City. By coupling the ecosystem productivity, soil carbon, and nitrogen flux, the vegetation NPP of Yangzhou City is estimated from the Rasterization dataset of climate, radiation, soil, and NDVI. In the model, NPP (x, t) is the NPP (gC·m−2·month−1) of pixel x in month t, which is the product of the photosynthetic effective radiation APAR (MJ/m2·month−1) absorbed by vegetation and the light-energy utilization efficiency coefficient ε (gC·MJ−1) [35]. The specific formula is as follows:
N P P ( x , t ) = A P A R ( x , t ) × ε ( x , t )
A P A R ( x , t ) = S O L ( x , t ) × F P A R ( x , t ) × 0.5
ε ( x , t ) = ε m a x × T ε 1 ( x , t ) × T ε 2 ( x , t ) × W ε ( x , t )
F P A R ( x , t ) = ( N D V I ( x , t ) N D V I i , m i n ) ( N D V I i , m a x N D V I i , m i n ) × ( F P A R m a x F P A R m i n ) + F P A R m i n
T ε 1 ( x , t ) = 0.8 + 0.02 × T o p t ( x ) 0.0005 × T o p t ( x ) 2
T ε 2 ( x , t ) = 1.184 / 1 + e x p [ 0.2 × ( T o p t ( x ) 10 T ( x , t ) ) ] × 1 / 1 + e x p [ 0.3 × ( T o p t ( x ) 10 T ( x , t ) ) ]
where SOL(x, t) is the total solar radiation at x pixels in month t, and FPAR(x, t) is the absorption ratio of incident photosynthetic effective radiation by the vegetation canopy at x pixels in month t. Within a certain range, there is a linear relationship between FPAR(x, t) and NDVI. The values of FPARmax and FPARmax are independent of vegetation type, with values of 0.95 and 0.001, respectively. The values of NDVIi,max, and NDVIi,min are shown in Table 2. The constant 0.5 represents the proportion of effective solar radiation available to vegetation to total solar radiation, εmax is the maximum light-energy utilization efficiency under ideal conditions, and the values are shown in Table 2. Tε1(x, t) and Tε2(x, t), respectively, represent the stress effects of low and high temperatures on light-energy utilization efficiency, which are influenced by the optimal temperature Topt (x). Topt(x) refers to the monthly average temperature (℃) in the study area when the NDVI value reaches its maximum within a year. When the average temperature of a month is less than or equal to −10 °C, Tε1(x, t) is 0; When the average temperature of a month is 10 °C higher or 13 °C lower than the optimal temperature Topt(x), Tε2(x, t) is taken as half of the value of the optimal temperature [13]. The month when the NDVI value in the research area reaches its highest is August. Wε(x, t) is a water-stress factor that reflects the impact of the available water conditions that plants can utilize on light-energy utilization efficiency. The study area belongs to a subtropical climate. According to the research results of Zhou et al. [36], this paper states εmax is taken as 0.83. This article uses Zhu Wenquan et al. [13] and Running [37] to configure vegetation static parameters based on measured data of different vegetation types in China (Table 2). The detailed calculation steps for each coefficient can be seen in previous studies [12,37].

2.3.2. Theil–Sen Median Trend Analysis and Mann–Kendall Significance Test

The Theil–Sen trend analysis method combined with the Mann–Kendall significance test is a nonparametric calculation method widely used in spatiotemporal trend analysis of long time series at the grid pixel scale [28,38]. The combined method has the advantage that the data do not need to follow a specific distribution law and are less affected by an Outlier. This method quantifies the trend of change by calculating the median slope of n (n1)/2 data combinations:
β = m e d i a n N P P j N P P i j i ,   2000 i < j 2020
where β is the trend of NPP changes, β > 0 represents an upward trend, β < 0 represents a downward trend, NPPi and NPPj represent the NPP values of pixels in the i year, and j year, respectively.
S = j = 1 n 1 i = j + 1 n s g n N P P j N P P i ,   2000 i < j 2020
s g n N P P j N P P i = 1 , N P P j N P P i > 0 0 , N P P j N P P i = 0 1 , N P P j N P P i < 0  
Z = S 1 v a r ( S ) ,   S > 0 0 ,   S = 0 S + 1 v a r ( S ) ,   S > 0  
v a r ( S ) = n ( n 1 ) ( 2 n + 5 ) 18  
where the Z value of the Mann–Kendall significance test method [39] is used to test the significance of the NPP change trend of vegetation. By specifying the significance level a, if |Z| > Z1a/2, it is considered that the trend of data change is significant, and vice versa. It indicates that the trend of change is not significant. If Z > 0, the sequence shows an upward trend, and if Z < 0, it shows a downward trend [40]. This paper takes a = 0.05, and when |Z| > 1.65, the data passes the 90% confidence test.

2.3.3. Rescaled Rang Analysis (R/S Analysis) and Hurst Index Method

R/S analysis, also known as rescaled range analysis, is commonly used to analyze the classification features and memory processes of a long time series. The Hurst index can predict future development trends based on past trends of long time series data [29,30]. It can be applied to the study of vegetation cover changes [39,41]. The calculation steps are as follows:
Δ N P P i = N P P i N P P i 1 ,
Δ N P P ( m ) ¯ = i = 1 m Δ N P P i m ,   m = 1,2 , n
X ( t ) = i = 1 m ( Δ N P P i Δ N P P ( m ) ¯ ) , 1 t m
R ( m ) = m a x X ( t ) 1 m n m i n X ( t ) 1 m n
S ( m ) = i = 1 m Δ N P P i Δ N P P ( m ) ¯ 2 m  
R ( m ) S ( m ) = k m H
where NPPi represents the vegetation NPP value in the i year; K represents a constant; H represents the Hurst index. The norm of the Hurst exponent is 0–1. When 0< H < 0.5, it indicates that NPP will exhibit the opposite trend from the past; when H = 0.5, the changes in NPP are independent of each other and are a random event; when 0.5 < H < 1, it indicates a long-term correlation, and NPP will be consistent with the previous trend [40,42].
β is the superposition of the Hurst index and Theil–Sen trend analysis results. The change trend is divided into five categories: Continuing Improvement, Continuing Decline, Improvement to Decline, Decline to Improvement, and Remained Stable (Table 3), used to determine the continuity of future change trends.

2.3.4. Geographic Detectors Model

The geographic detector model is a statistical method that analyzes the spatial stratification and differentiation of geographical phenomena, explores the driving factors and operating mechanisms behind the dependent variables [43], and has strong explanatory power in the study of multi-driving-factor correlation problems. The specific formula is as follows:
q = 1 h = 1 L N h δ h 2 N σ 2
where q is the differentiation factor (0 < q < 1). The closer the q value is to 1, the more significant the impact of this driving factor is on the spatial differentiation of vegetation NPP; L is the number of variable categories, h = 1, 2,... is a specific type; Nh and N represent the number of h category units and the total number of units in the study area, respectively; σh2 and σ2 represent the variance of category h and the total variance of the study area [44].
In terms of driving-factor selection, this article draws on the famous PPM theory in sociology. It divides many driving factors into three categories: positive driving factors, negative driving factors, and individual driving factors [31]. According to previous research, there are many driving factors for NPP, which can be summarized as climate factors, social factors, ecological factors, and other major categories. Temperature, rainfall, and solar radiation are important components of climate factors that directly affect the accumulation of NPP in regional vegetation [45]. In social factors, the Euclidean distance to the road reflects the scope of human activities, and GPD and population density represent the level of economic development and the degree of urban expansion [22]. The above three indicators can reflect the increasingly prominent impact of human activities on vegetation NPP changes in the context of urbanization development in recent years. Currently, there is little attention paid to ecological factors in current research. This paper uses NDVI, NDBSI, and WET selected by Xu Hanqiu’s Remote-Sensing Ecological Index (RSEI) [33] as the ecological factors for this study, representing vegetation coverage, urban impervious surface coverage, and soil and vegetation humidity, respectively. Due to the high correlation between land surface temperature (LST) and TEM indicators in meteorological factors, the LST factor is omitted from the ecological indicators to avoid duplication and exaggerate the impact of temperature. In summary, this article selects 10 driving factors covering climate, human activities, and ecological perspectives, including TEM, Rainfall, RAD, LUCC, GDP, POP, DTR, NDVI, NDBSI, and WET from 2000 to 2020, as independent variable factors. Factor detection and interaction detection are used to analyze the impact of each driving factor on regional vegetation NPP changes.

3. Results

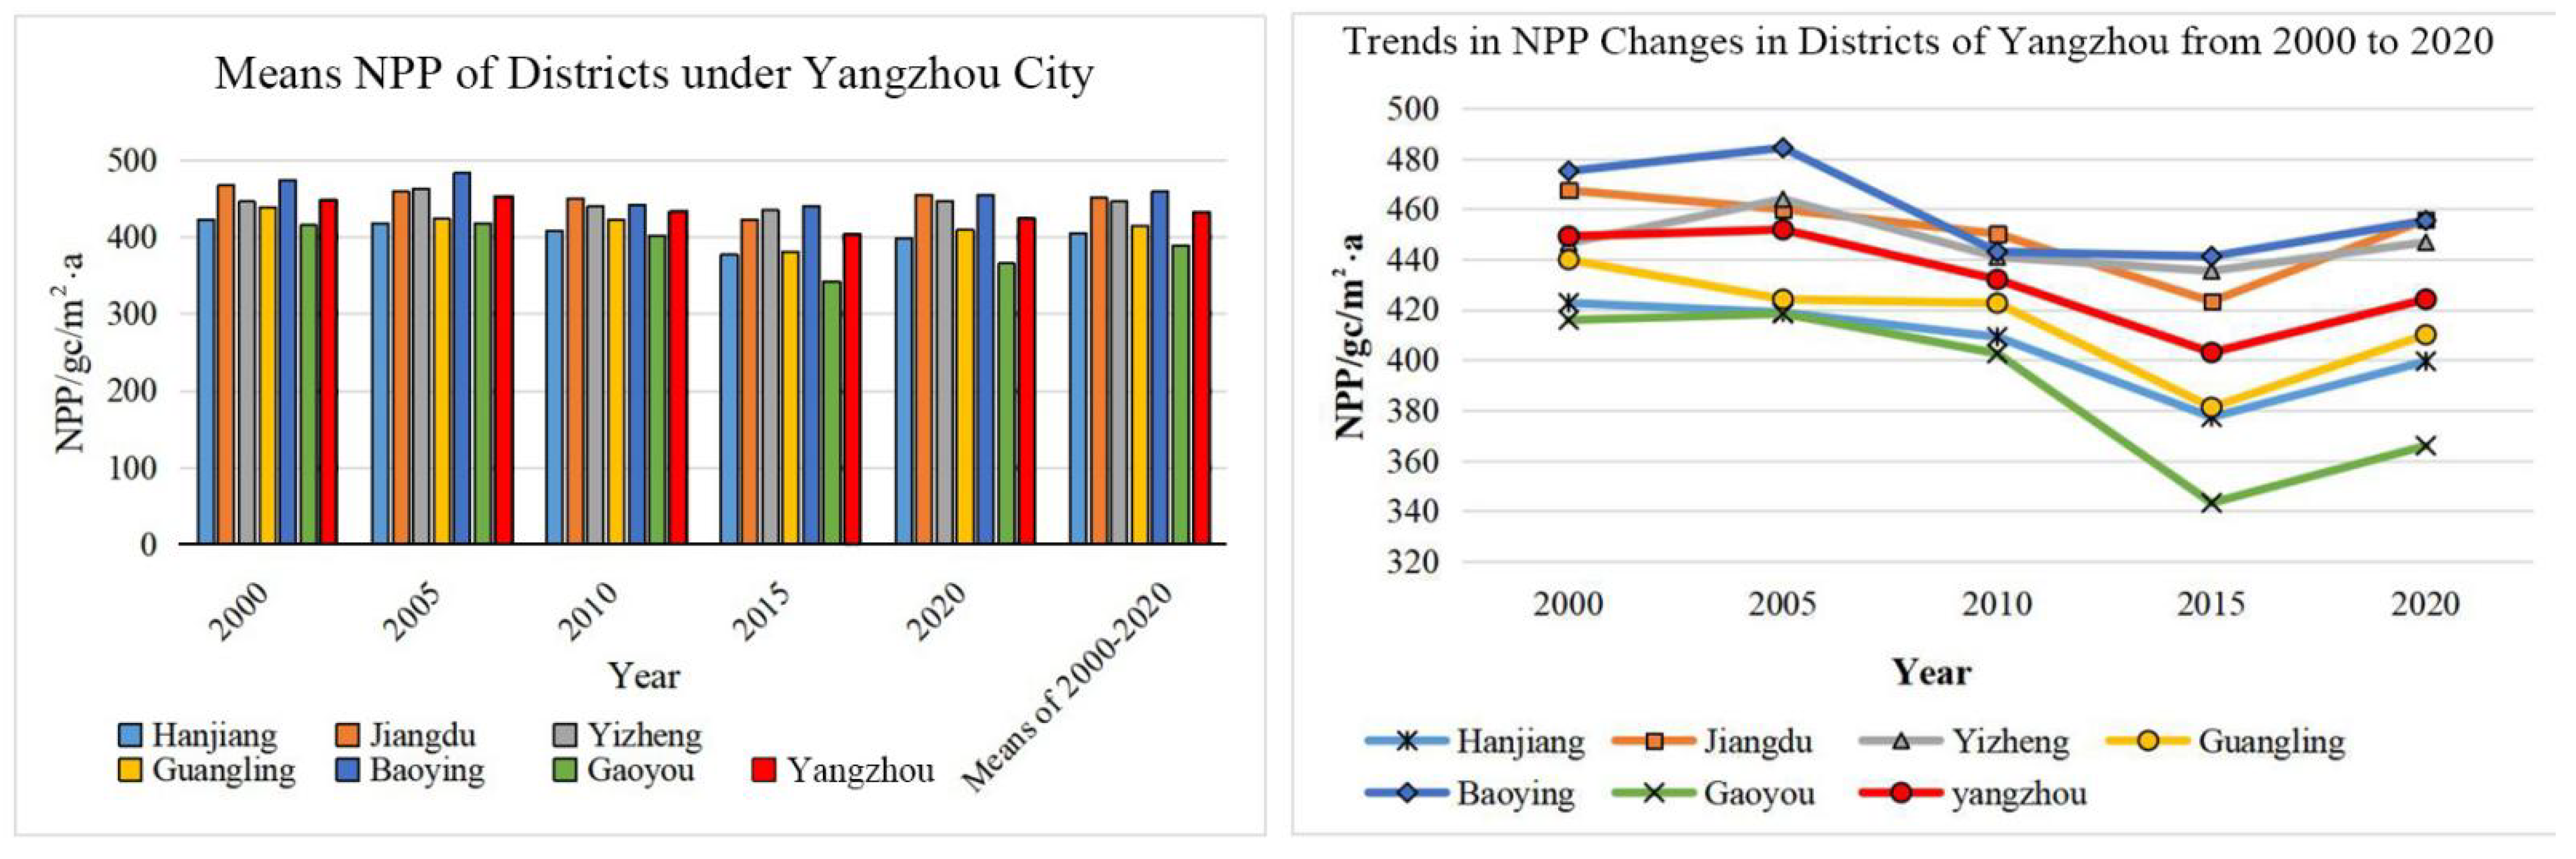
3.1. Spatial and Temporal Variation of Vegetation NPP in Yangzhou City

To be able to understand more intuitively the temporal and spatial changes of vegetation NPP in Yangzhou, the NPP inversion results were divided into five grades according to the following classification: Worst (0–200 gC/m2·a), Poor (200–400 gC/m2·a), Medium (400–600 gC/m2·a), Better (600–800 gC/m2·a), and Best (>800 gC/m2·a). As shown in Table 4, the annual mean NPP values of vegetation in Yangzhou City from 2000 to 2020 were 445.343 gC/m2·a, 447.788 gC/m2·a, 427.763 gC/m2·a, 398.687 gC/m2·a, and 420.168 gC/m2·a. At the time level, the vegetation NPP level fluctuates first decreases and then increases, with an overall slight decrease. The vegetation NPP levels in Yangzhou City belonged predominantly to the Medium and Better categories. The proportion of Better level area shows a trend of first increasing, then decreasing, then increasing and then decreasing, with the highest in 2005 and a slight increase overall. The Medium level area fluctuated significantly in the early stage but stabilized after 2015, with a slight overall decrease. The area of Worst, Poor, and Best levels is generally relatively small, but the proportion of area remains relatively stable, with a slight increase overall. Spatially, as shown in Figure 3 and Figure 4, and Table 5, the average NPP of vegetation in Yangzhou City shows a high spatial pattern in the surrounding regions and a low one in the central regions, with Baoying County having the highest NPP (459.824 gC/m2·a) among all county-level administrative regions, followed by Jiangdu District (451.324 gC/m2·a) and Yizheng District(446.727 gC/m2·a). The lowest is Gaoyou (389.247 gC/m2·a). In terms of ranking, the average NPP values in urban construction-intensive areas centered around Hanjiang and Guangling districts from 2000 to 2020 were lower. Gaoyou, which is characterized by a large water area, has been at the bottom of the list for many years. The average annual NPP values of Baoying, Yizheng, and Jiangdu, which are mainly characterized by farmland and forest land, fluctuated but remained among the highest. The inversion calculation results were consistent with the actual values, which further confirmed the reliability of the CASA model.

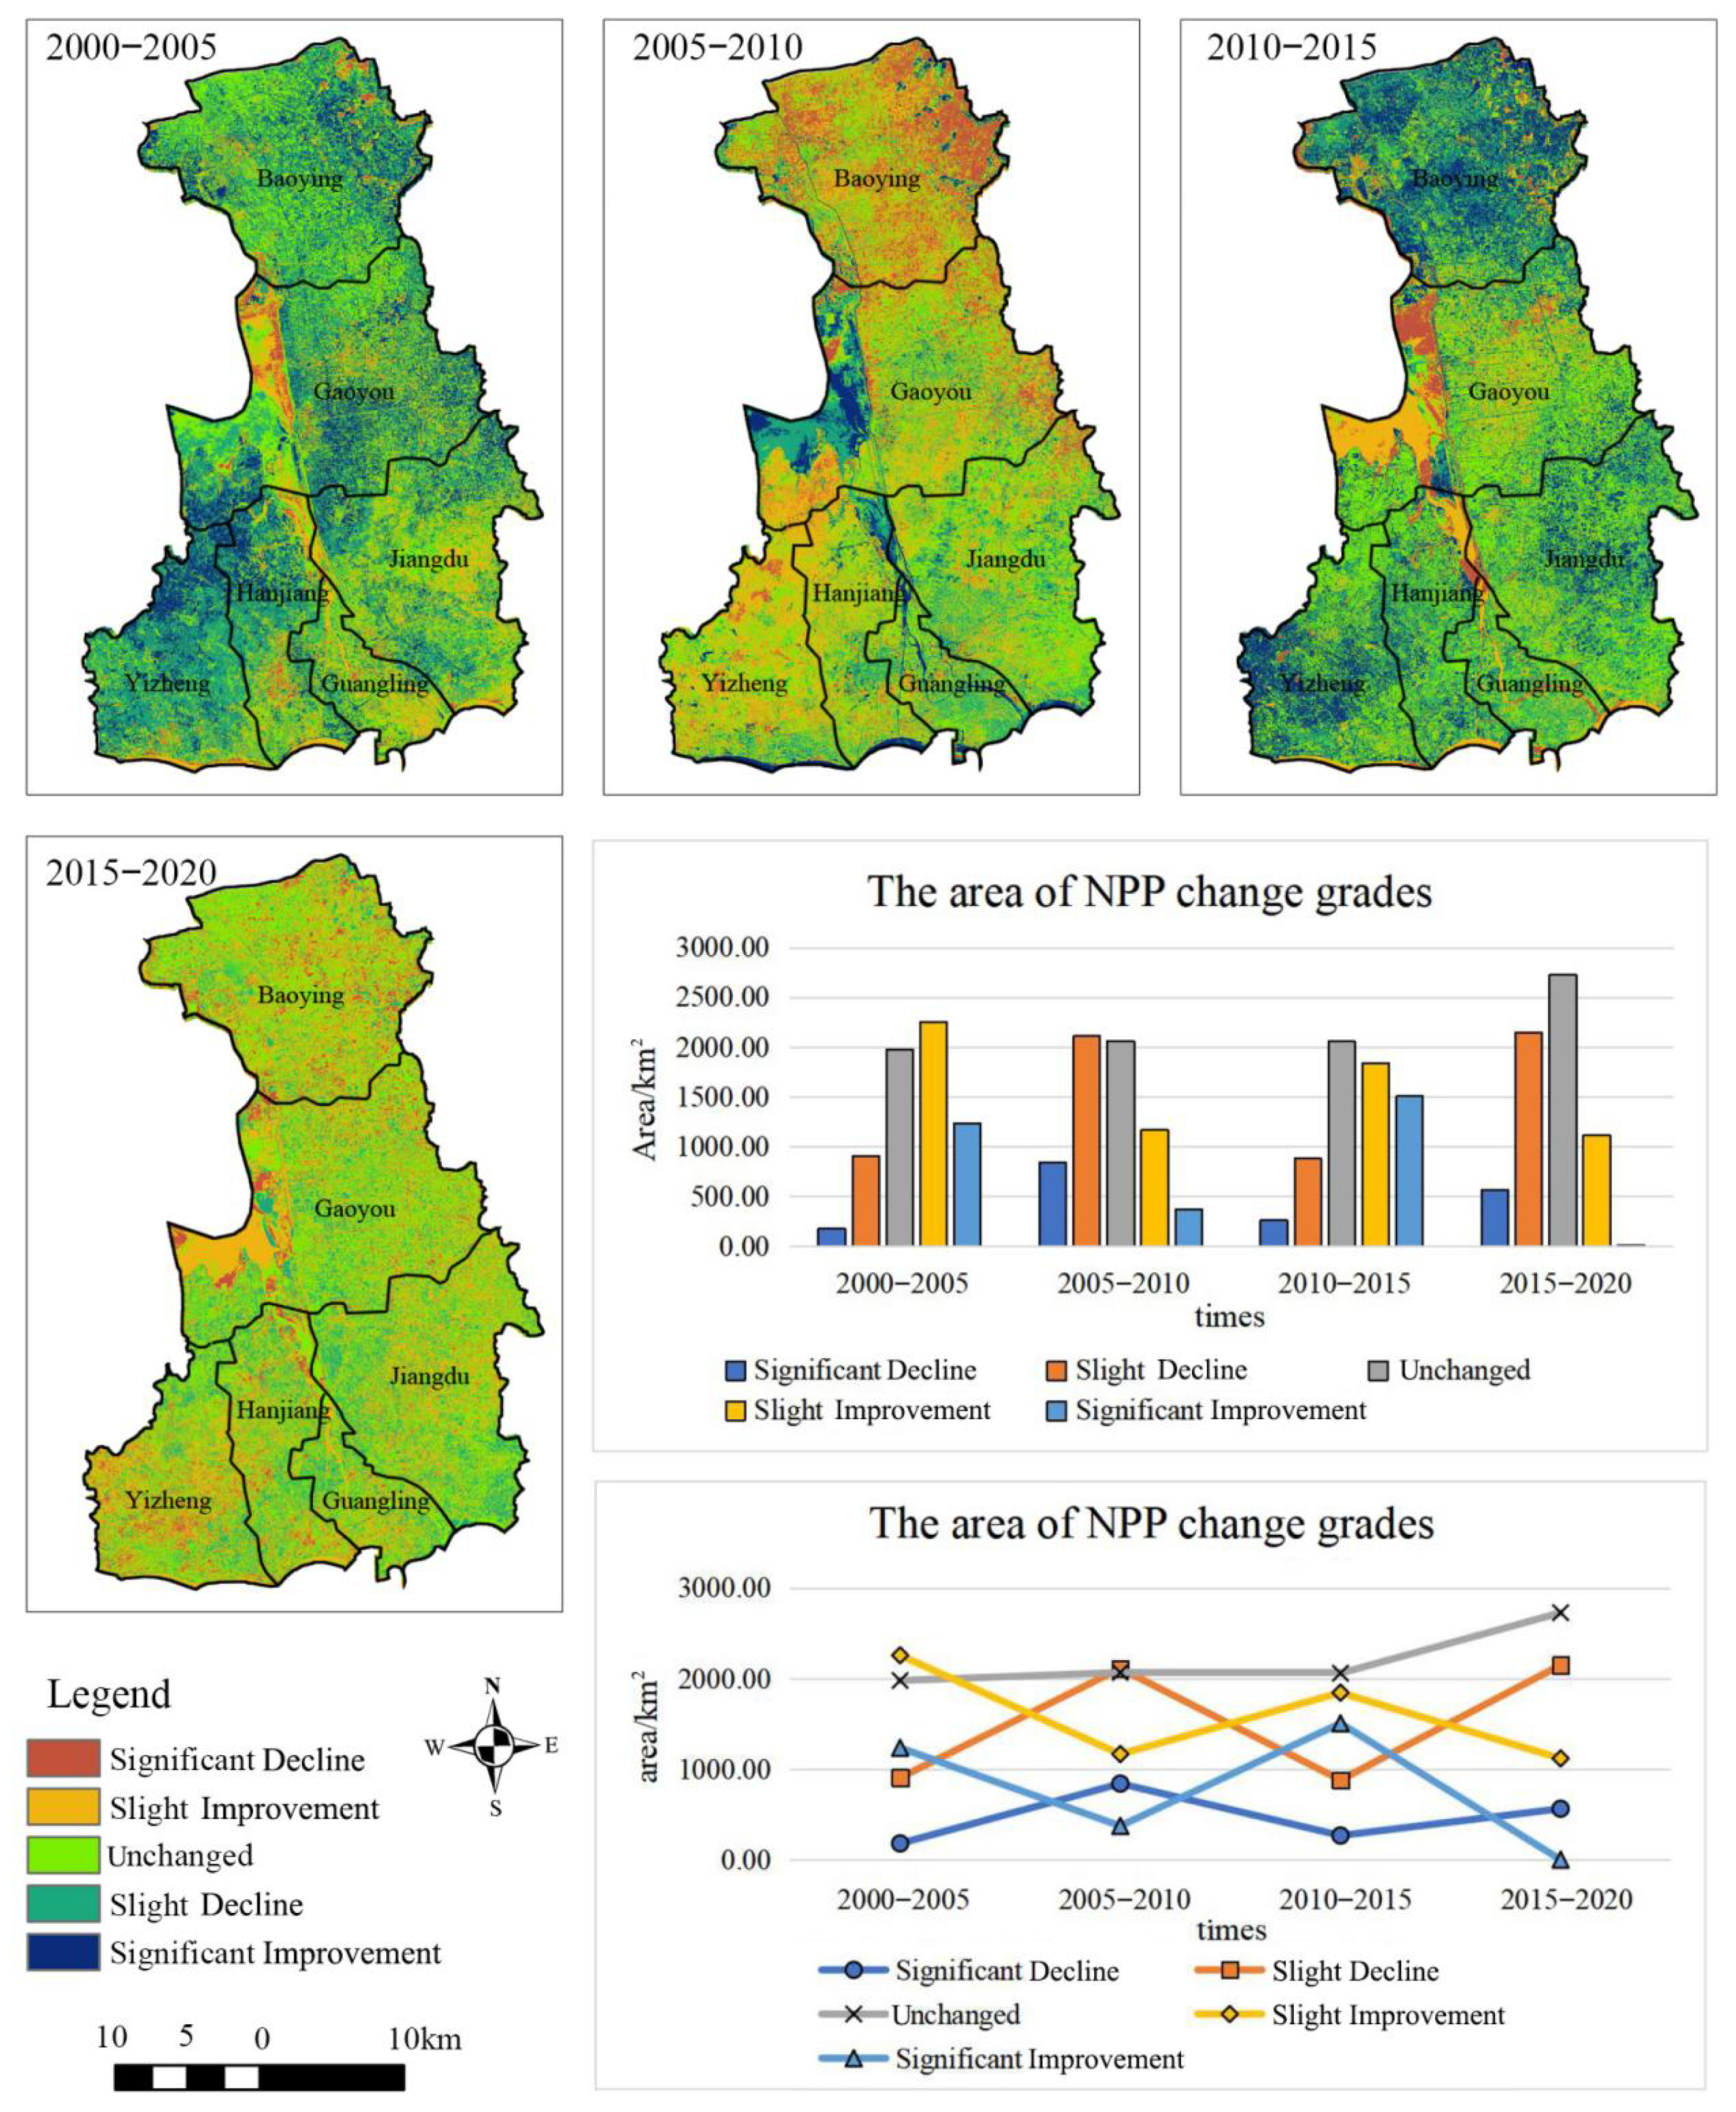
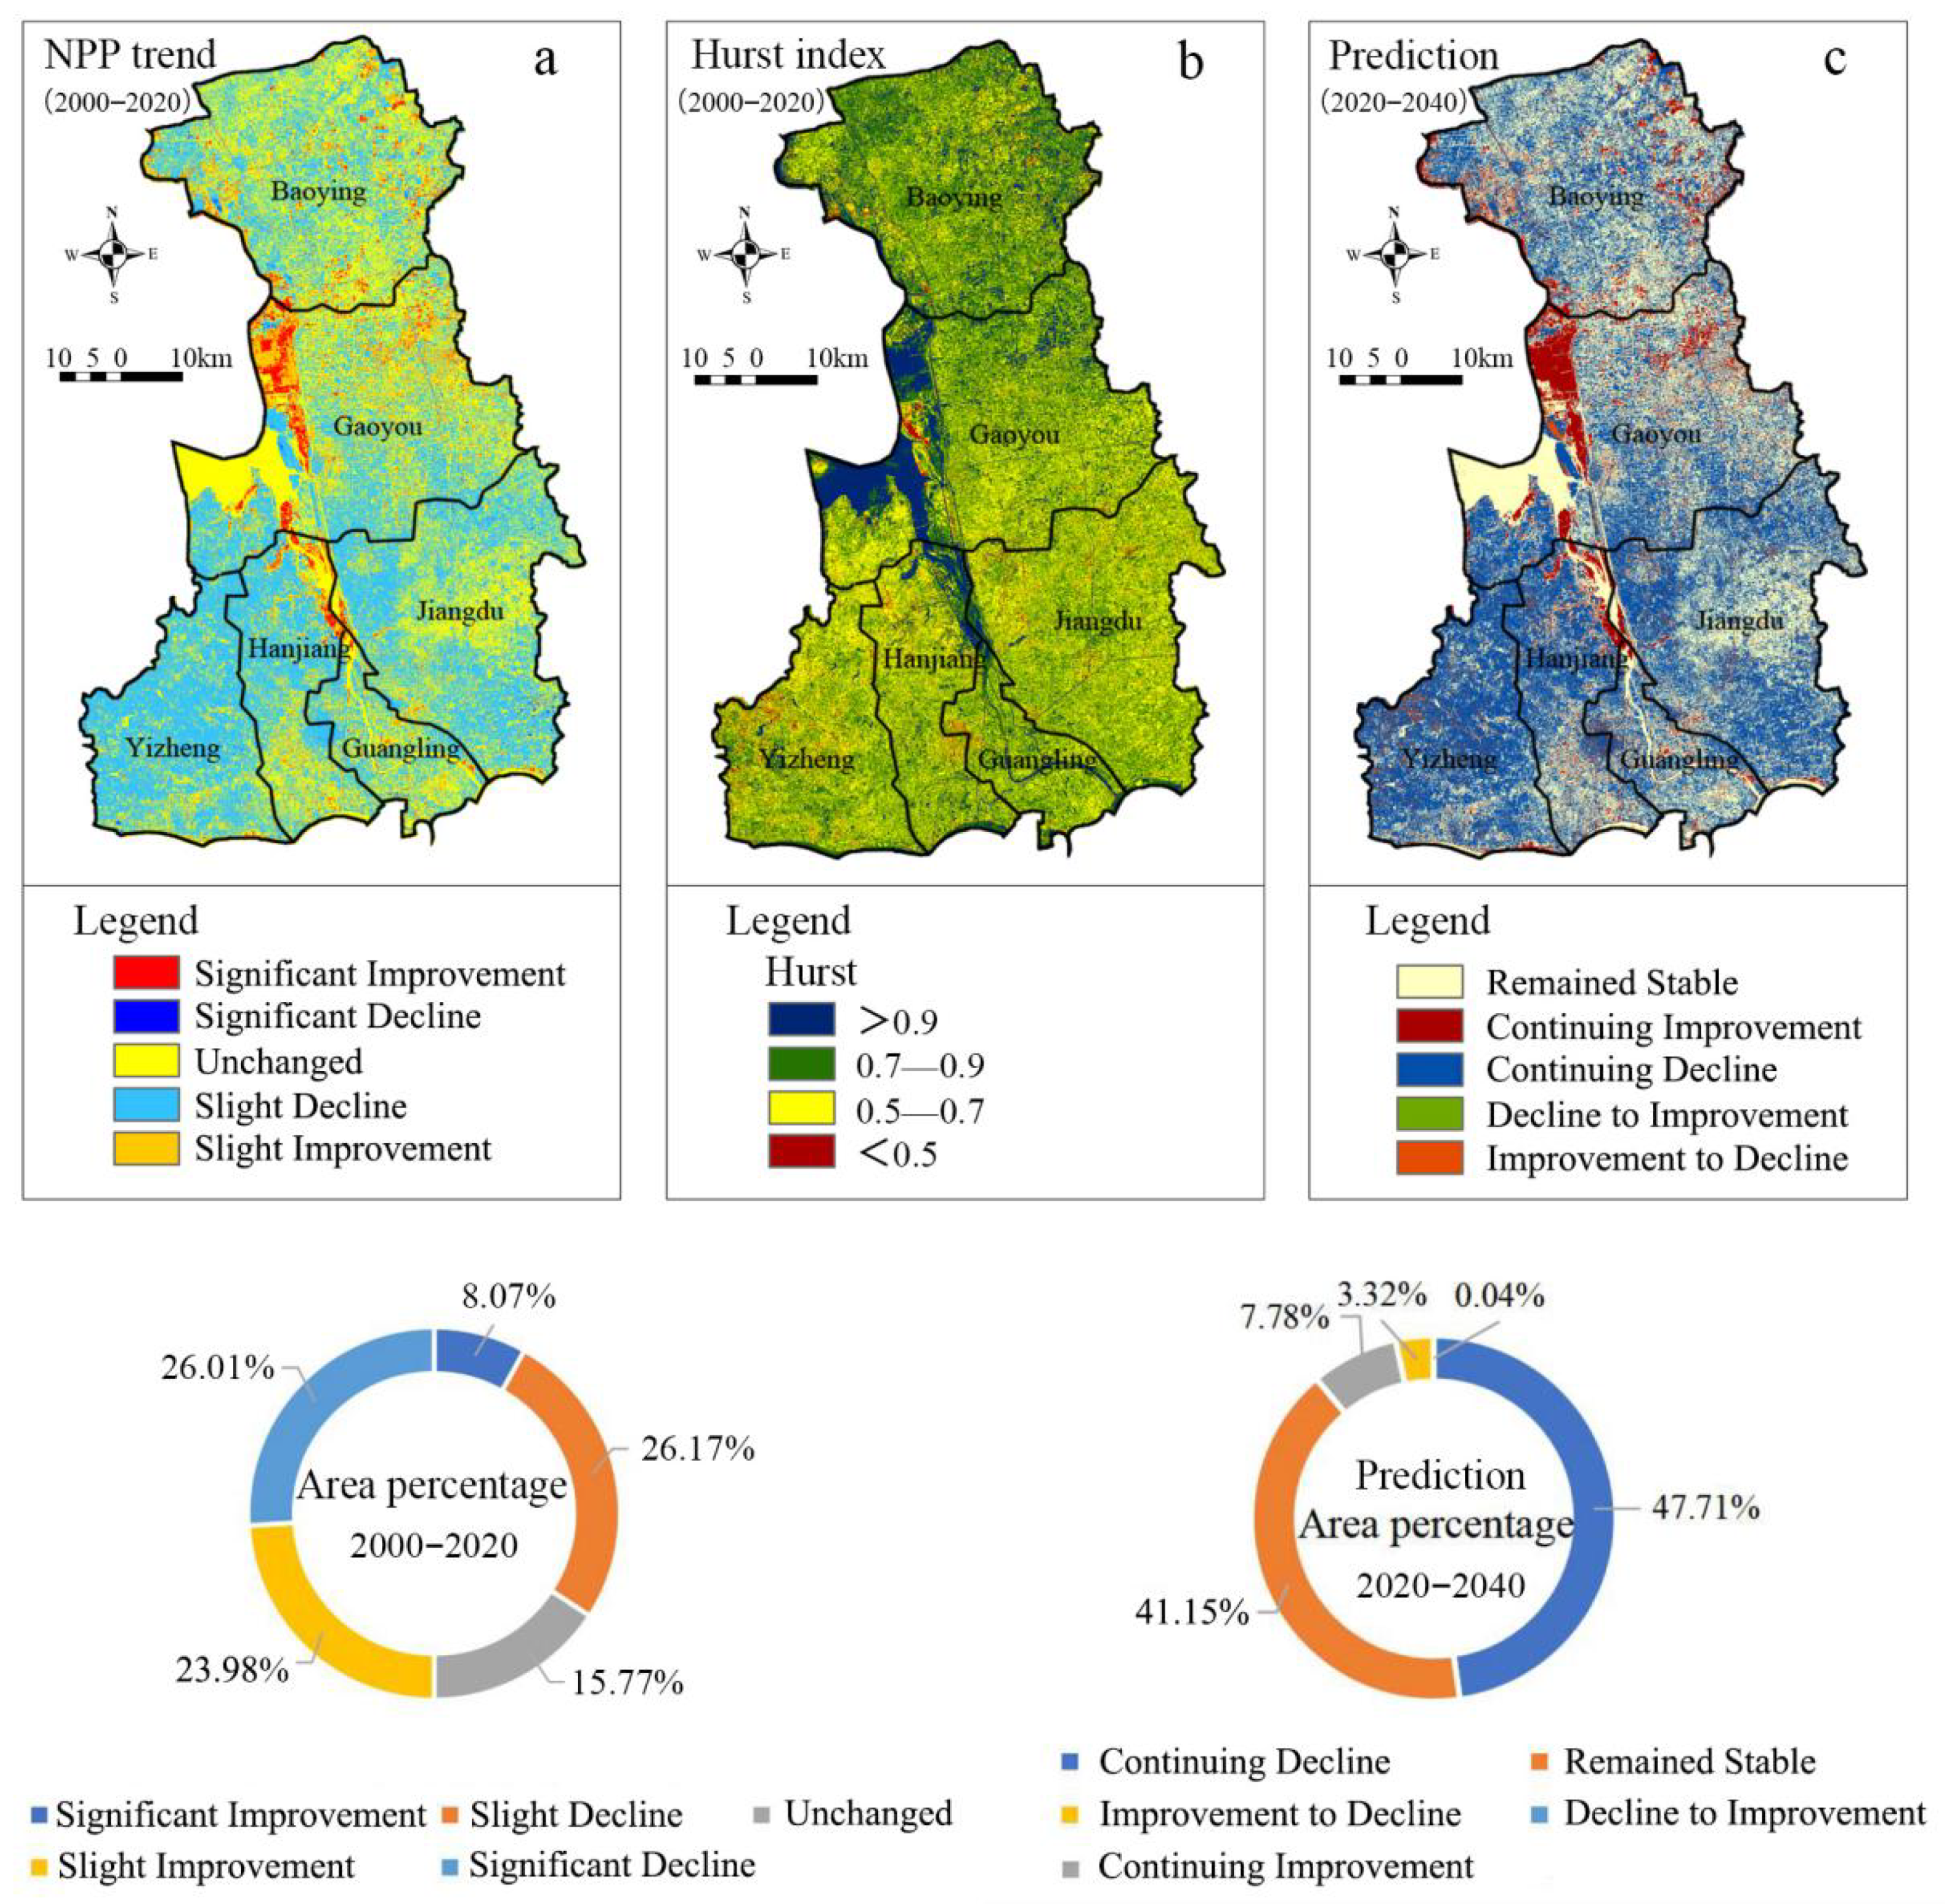
3.2. Spatiotemporal Variation of Vegetation NPP in Yangzhou City

To further explore the temporal and spatial evolution of vegetation NPP in Yangzhou City from 2000 to 2020, data were interpolated in ArcGIS10.8 to obtain the vegetation NPP level change maps of Yangzhou City: 2000–2005, 2005–2010, 2010–2015, and 2015–2020 (Figure 5). In addition, the natural breakpoint classification method was applied to categorize the NPP variation into Significantly Declined, Slightly Declined, Unchanged, Slightly Improved, and Significantly Improved.
The results of the Theil–Sen trend analysis reported in Table 6 and Figure 5 show that the NPP of vegetation in Yangzhou City fluctuated in different sub-periods between 2000 and 2020. Specifically, the proportion of Unchanged areas increased from 30.17% to 41.57% and continued to expand, while that of Improved areas initially decreased, then increased, and finally decreased again. The rate of increase was relatively large in the 2000–2005 and 2010–2015 periods and relatively small in 2005–2010 and 2015–2020. The Improved area decreased by 2371.731 km2 from 2000 to 2020. Among these areas, the Significantly Improved area showed the largest decrease, while the Declined area showed “increase–decrease–increase” changes. Among them, there was a significant decrease in 2005–2010 and 2015–2020. The Significantly Declined and Slightly Declined areas increased by 1624.022 km2 and 1243.47 km2, respectively. In summary, the vegetation NPP in Yangzhou City fluctuated from 2000 to 2020, with an overall slight downward trend.
Spatially, vegetation NPP in Yangzhou City from 2000 to 2020 fluctuated significantly in Yizheng in the southwest and Baoying in the north, with the most significant fluctuations detected in the areas northwest of Yizheng bordering Gaoyou Lake and in the farmland area northeast of Baoying (Figure 5). NPP variation in the central region of Gaoyou was relatively low, and values were stable overall. In the southwestern districts of Jiangdu, Hanjiang, and Guangling, this parameter showed a fluctuating downward trend. Among the districts of Yangzhou City, Hanjiang and Yizheng exhibited a consistent NPP variation overall, with the trend first increasing, then decreasing, stabilizing, and then increasing again. In the four regions of Baoying, Gaoyou, Guangling, and Jiangdu, the NPP variation decreased at first and then increased. In general, the overall NPP values in all districts in Yangzhou City from 2000 to 2015 were mainly in the Slightly Declined category, while from 2015 to 2020, they fell mainly within the Slightly Improved category. Specifically, the proportion of the Unchanged areas was the highest (72.58%), indicating that most regions still had stable and unchanged NPP values. The area of the Significantly Improved category was the smallest (only 1.43 km2 by 2020) and was mainly distributed along the coast of Gaoyou Lake. In summary, from 2000 to 2020, vegetation NPP values were significantly different among various regions of Yangzhou City. In general, they varied obviously in the surrounding regions, such as the mountainous areas of Baoying, Jiangdu, and Yizheng, and remained relatively stable in the central regions, such as Hanjiang, Guangling, and Gaoyou.

3.3. Prediction of Future Trends in the Evolution of Vegetation NPP in Yangzhou City

The Hurst index method was used to calculate the sustainability of the future variation of vegetation NPP in Yangzhou City and, therefore, predict its evolution. The results revealed an average Hurst index value of 0.722, indicating that in most areas of Yangzhou City, the variation of NPP will be sustainable (Figure 6b). An area of 6312.305 km2 had a Hurst index value > 0.5, accounting for 96.30% of the total Yangzhou area. A total of 11.48% of the regions have a Hurst index > 0.9, while areas < 0.5 only account for 3.70% of the total area, indicating that the variation of NPP in Yangzhou is predicted to be mostly continuous based on past trends.
By superimposing Hurst index values and the results of Theil–Sen trend analysis, the study area was divided into five categories based on NPP values: Remained Stable, Continuing Improvement, Continuing Decline, Improvement to Decline, and Decline to Improvement (Figure 6).
The prediction chart of the evolution of vegetation NPP in Yangzhou in the next 20 years (Figure 6c) indicates that the largest proportion of area in Yangzhou City will be the Continuing Decline category (47.71%), followed by the Remained Stable category (41.15%). The proportions of Continuing Improvement, Improvement to Decline, and Decline to Improvement areas will be relatively small, at 7.78%, 3.32%, and 0.04%, respectively. This indicates that the NPP level of vegetation in most areas of Yangzhou City will be in the Remained Stable or Continuing Decline categories in the future (2020–2040).
Spatially, NPP levels will continue to decrease mainly in the Yizheng area southwest of Yangzhou City and the surrounding area of Jiangdu to the east. The Gaoyou, Baoying, and urban areas are generally predicted to remain within the Remained Stable category, and NPP in the waterfront areas along Gaoyou Lake and the Grand Canal will continuously and significantly improve. These model predictions indicate that changes in land-use types, especially within the urbanization process, have a significant impact on vegetation NPP.

3.4. Analysis of Factors Driving the Variation of Vegetation NPP in Yangzhou City

In this study, a 500 × 500 m grid was used for sampling, resulting in the collection of a total of 2500 sampling points. Geographical detectors were used to analyze 10 driving factors related to climate, society, and ecology. The main climate factors were temperature (TEM), rainfall, and solar radiation (RAD), which were highly correlated with vegetation growth [26]. The ecological factors were NDVI, WET, NDBSI, etc., which reflect the environmental ecological quality in the remote-sensing ecological index proposed by Xu Hanqiu [33]. The social factors were indicators such as LUCC data, Euclidean distance to roads (DTR), population density (POP), and GDP [46].
The results showed that all factors were significant at p < 0.05, meeting the confidence requirements. This indicated that there were significant differences in the spatial distribution of the impact of each driving factor on the mean NPP of vegetation in Yangzhou City. As shown in Table 7, the q values of each driving factor were ordered as follows: NDVI (0.728) > LUCC (0.5601) > WET (0.392) > NDBSI (0.208) > POP (0.065) > TEM (0.034) > GDP (0.027) > DTR (0.026) > Rainfall (0.016) > RAD (0.012), which indicated that social and ecological factors were the main drivers of NPP variation in Yangzhou City. Among the social factors, LUCC had the strongest effect, while POP, DTR, GDP, and others had a relatively weak impact on vegetation NPP. Among the ecological factors, NDVI was the dominant factor playing a major role, indicating that NPP value was mainly influenced by vegetation coverage, followed by NDBSI, which reflected the level of urban construction in the study area. These findings revealed that ecological factors exerted a significant effect on NPP variation in Yangzhou. Among the climate factors, TEM, Rainfall, and RAD had a relatively weak impact on NPP. Overall, the main driving factors of NPP variation in Yangzhou City were NDVI, among the ecological factors, and LUCC, among the social factors. Significant differences in the annual NPP of vegetation were detected among different land-use types (Table 8). Specifically, mean values varied in descending order as follows: forest > farmland > unused land > urban area > water area. The stochastic matrix of land use in Yangzhou City from 2000 to 2020 showed that during the process of urbanization, land-use changes indirectly affected vegetation coverage, further influencing the variation of NPP (Table 9).
The interaction detector results showed that the q value for the interaction of two factors was higher than that for a single factor, indicating that vegetation NPP in Yangzhou City was more affected by multiple factors (Table 10). The impact of each factor after the interaction was a nonlinear or two-factor enhancement. Among the factors examined, NDVI and LUCC had the strongest impact after an interaction, with an explanatory power of 77.78%. In contrast, solar radiation and air temperature had the weakest impact, with an explanatory power of 4.81%.
To further analyze the impact of various driving factors on NPP, the data of the aforementioned sampling points were subjected to Pearson correlation analysis using SPSS27 software. The results showed that the changes in vegetation NPP in Yangzhou City were positively correlated with NDVI, TEM, and RAD, and negatively correlated with Rainfall, WET, GDP, NDBSI, and DTR (Table 11). These findings were consistent with the results obtained from geographical detectors. A high correlation was detected between ecological factors (NDVI, WET, and NDBSI) and changes in NPP, with NDVI showing the strongest positive correlation. Except for LUCC, the correlation between social factors and NPP was weak and mostly negative, indicating that this group of factors, especially the degree of urbanization, mainly had a negative impact on NPP variation. WET was found to be negatively correlated with vegetation NPP in Yangzhou, which may be related to the characteristics of the climate zone where this city is located. The climate here is characterized by abundant annual rainfall [32], and more than 70% of the city consists of farmland areas. The excessively wet environment inhibits the growth of vegetation, which in turn has a negative impact on vegetation NPP.

4. Discussion

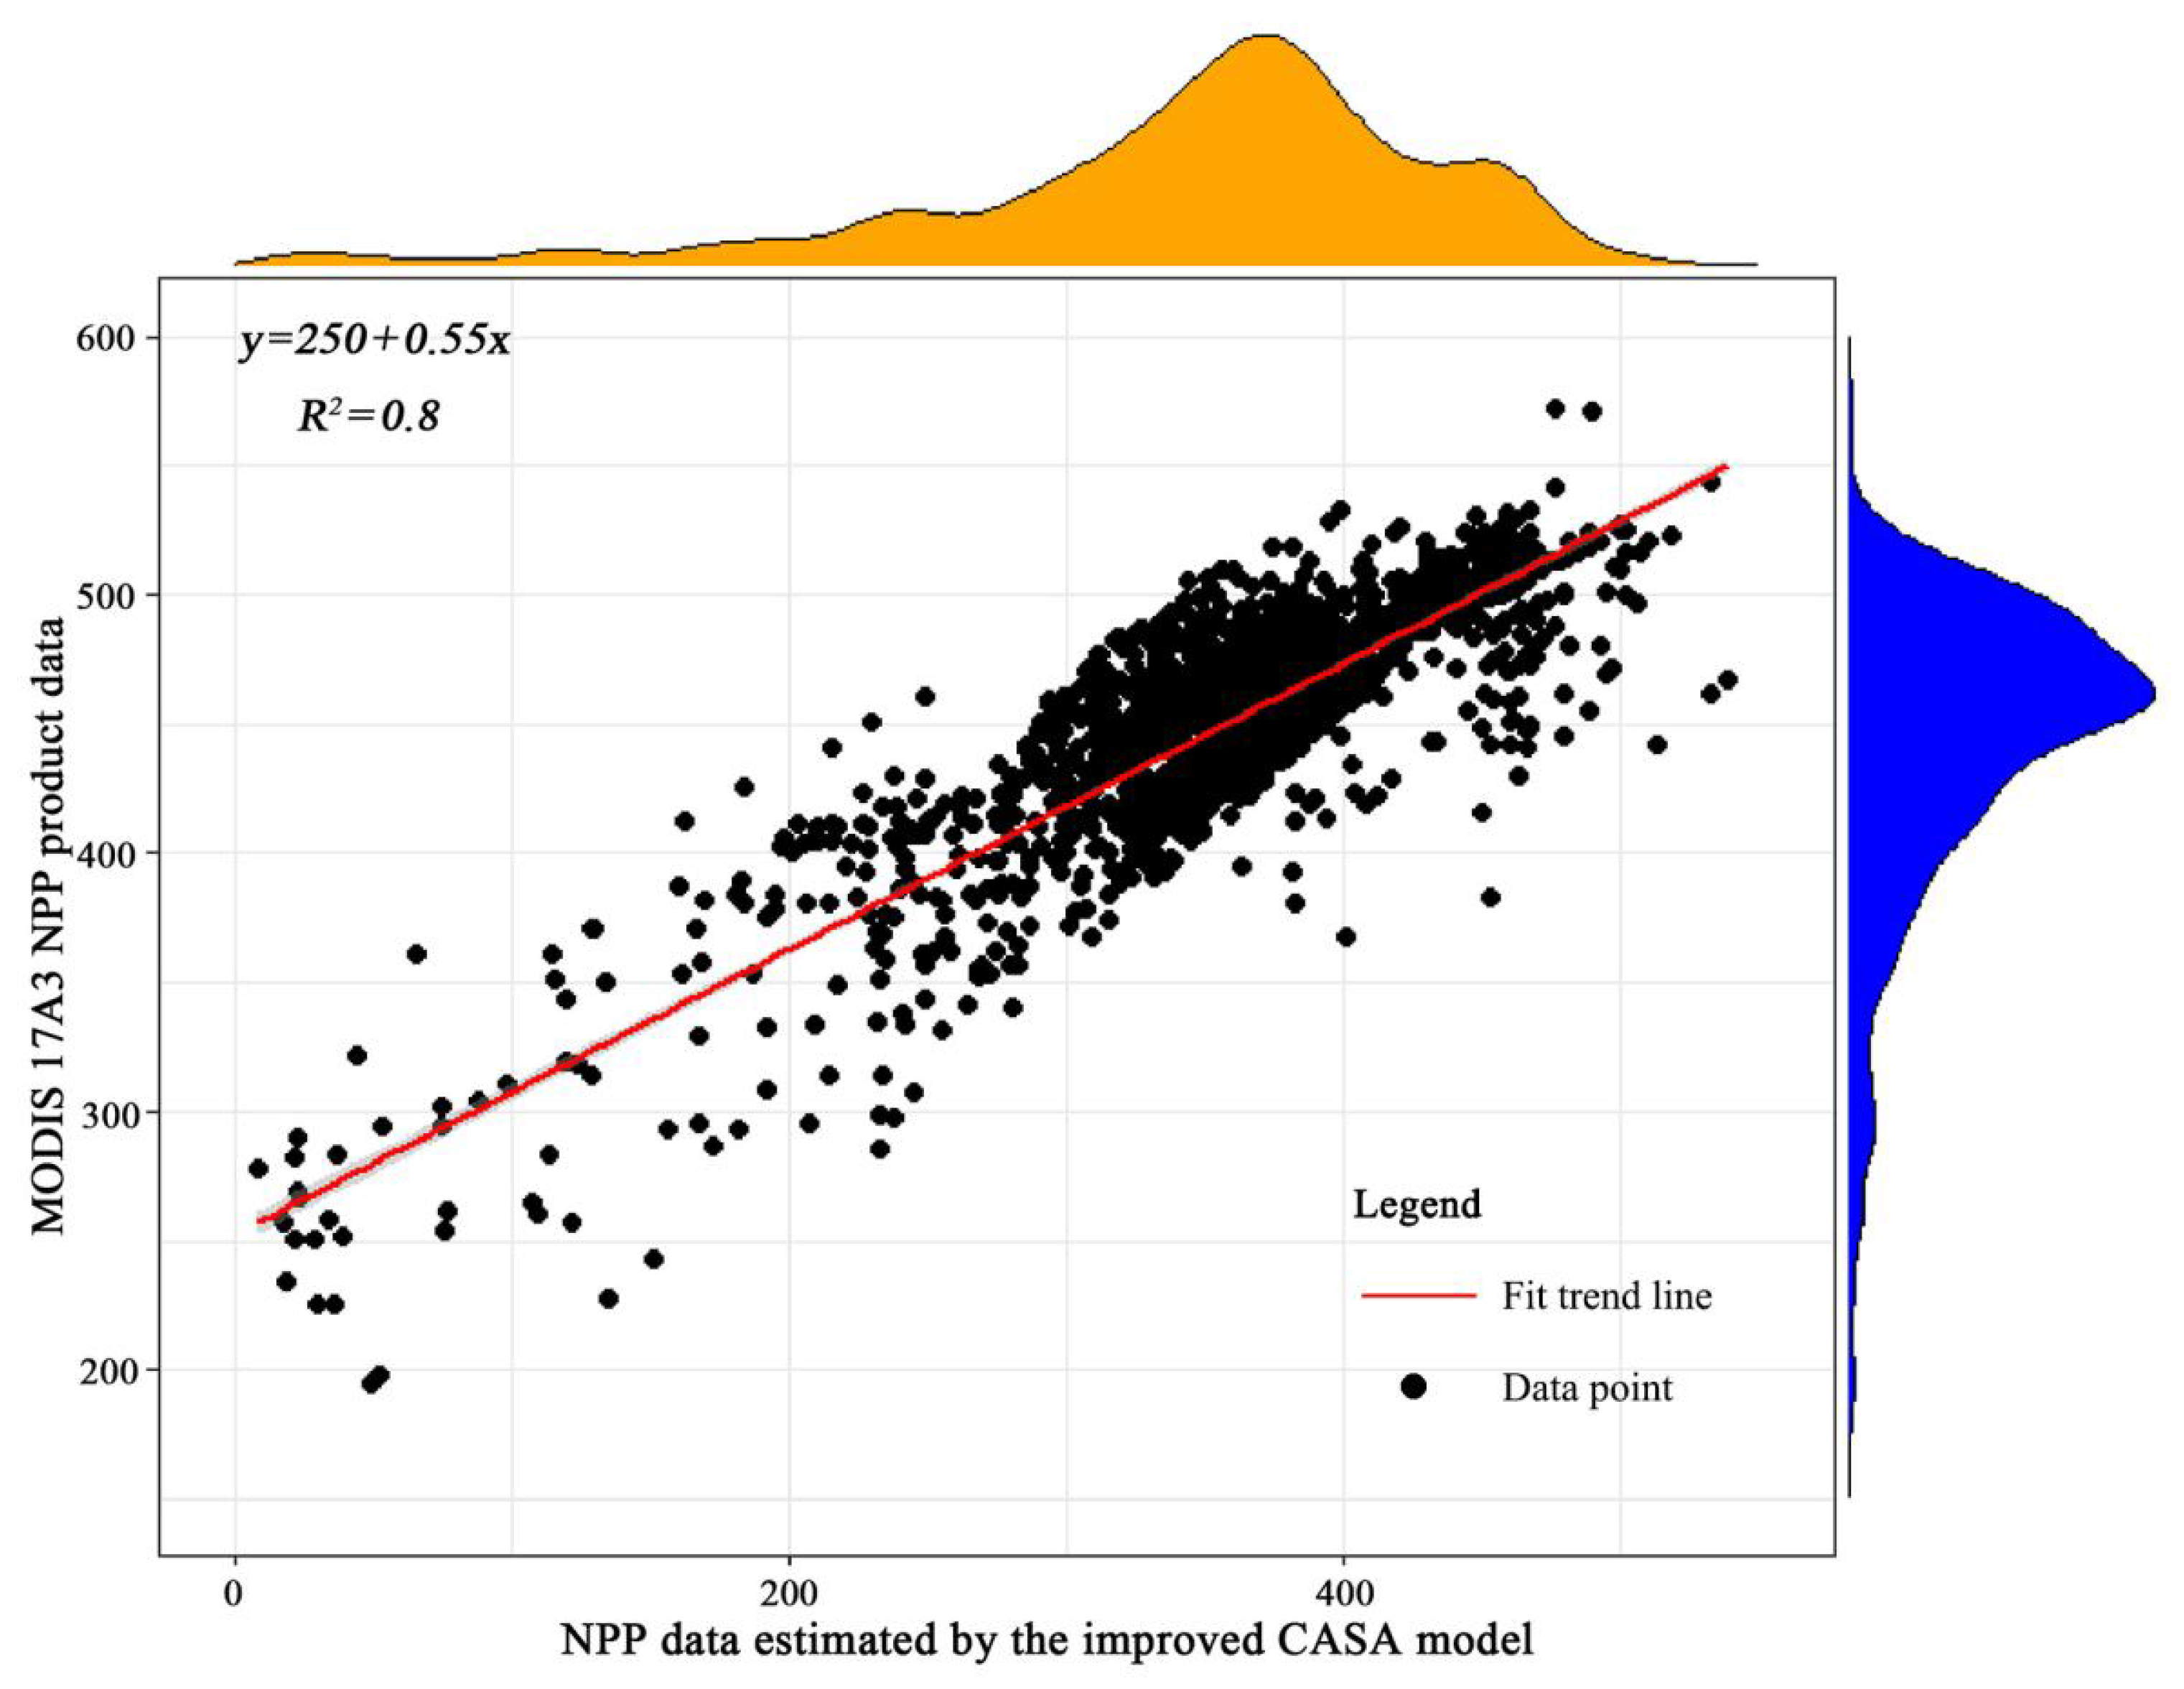
4.1. Validation of Improved CASA Model-Estimation Results

Various models exist for estimating NPP using remote-sensing data, and among them, the CASA model is the most widely used [47,48]. However, the original model has many disadvantages, such as the difficulty of obtaining basic data, the presence of many outliers, and the low accuracy of estimation results [13]. In the present study, the improved CASA model reported by Zhu et al. [13] and based on the light-energy utilization method was used to estimate the vegetation NPP of Yangzhou City from the rasterized NDVI dataset of climate, radiation, soil, and greenness variables by coupling ecosystem productivity, soil carbon, and nitrogen flux. The 500 × 500 m precision MODIS17A3 NPP product dataset for the 2000–2019 period, which was released by NASA (http://earthdata.nasa.gov), was used to verify the accuracy of the inversion results obtained from the improved CASA model and make comparisons. The data were extracted to the same size according to the mask range of the research area, set by a 1 km × 1 km fishing net, and extracted to the improved CASA model estimated NPP data and MODIS17A3 NPP data using fishing-net grid points. At the same time, due to the abnormal values of MODIS17A3 NPP product data in the water areas and impermeable pavement, this article conducted correlation, RMSE, and bias analysis on the remaining 2192 pixel values after excluding the abnormal data.
The results indicate that the values estimated by the improved CASA model are generally smaller than the MODIS17A3 NPP product data, which is consistent with existing research results [13,47]. The RMSE value between the extracted data is 109.84, and the bias value is −0.22. There is a significant positive correlation between the data (R2 = 0.8, p < 0.01) (Figure 7), which has statistical value. At the same time, the vegetation NPP data obtained using the improved CASA model and the product data used for comparison had similar characteristics in terms of spatial distribution. The 2192 pixel values extracted were highly similar, indicating that the improved CASA model yielded NPP inversion results that were highly reliable. This result is consistent with the relevant research conducted by Zhu et al. in 2007, which compared the inversion data with the measured data, with a slightly smaller difference of 43 gC·m−2·a−1, and an average bias value of −4.5%. The two have high consistency [13].

4.2. Spatiotemporal Evolution of NPP and Prediction of Future Trends

NPP is an essential parameter within the current global “carbon neutrality” strategy and an important indicator for the evaluation of urban green and low-carbon development. The results of this study revealed the presence of obvious differences in the average NPP of different land-use types in Yangzhou City from 2000 to 2020. Specifically, the values were ranked in descending order as forest > farmland > unused land > urban > water, indicating that the NPP level was related to land-use type, which is consistent with previous research results [26,39,45]. Vegetation NPP values in Yangzhou City exhibited significant temporal and spatial differentiation. Spatially, they were low in the central urban area and high in the surrounding fields and rural areas, which is basically consistent with existing research [46,49,50]. Temporally, vegetation NPP in Yangzhou City fluctuated over the past 20 years, decreasing at first and then increasing, with an overall slightly declining trend. From 2000 to 2005, NPP values remained stable. From 2005 to 2015, they slightly declined, and from 2015 to 2020, they slightly increased (Table 5). The slightly declining NPP from 2005 to 2015 may be related to the increasing urban area and decrease in vegetation coverage due to the rapid expansion of Yangzhou’s urbanization in this period. In contrast, the increase from 2015 to 2020 may be due to the gradual implementation of environmental governance policies and the strengthening of ecological greening projects in the main urban area and along roads and rivers in Yangzhou, taking the World Garden Expo as an opportunity. The above trends indicate that urban development policies and land-use change can, on the one hand, promote the increase of vegetation NPP and, on the other, inhibit it, which is consistent with the results of existing research [8,26,50].
Previous studies have often focused on analyzing the temporal and spatial changes in NPP in the past, but future trends and their sustainability have rarely been discussed. In this study, in addition to determining the spatiotemporal evolution and trends of vegetation NPP in Yangzhou City from 2000 to 2020, their sustainability in the future is also predicted using the Hurst index method. The future vegetation NPP in most regions of Yangzhou will be mainly within the Remained Stable (41.15%) or Continuing Decline (47.71%) categories. Overall, 96.61% of the regions will maintain the past trends, and only along the Gaoyou Lake and the Grand Canal will NPP values continuously increase. The above predictions may be influenced by the urban development and environmental policies of the city [51]. In recent years, urban areas have actively promoted the construction of ecological garden cities, expanded green spaces, and increased the level of greenness to increase vegetation NPP. In Yangzhou, the Baoying and Jiangdu Districts, located in the east and north, respectively, are characterized by higher NPP levels due to the presence of large farmland areas, and they belong mainly to the Remained Stable or partially Continuing Decline categories. It is worth noting that the Decline to Improve areas are mainly distributed along the Gaoyou Lake and the Grand Canal, which may be related to the launch of the construction of the “Yangtze Huaihe River Ecological Corridor” in Yangzhou in recent years. To address the threat of land degradation, it is necessary to strengthen dynamic monitoring, improve relevant policies, and promote green and low-carbon development in the region.

4.3. Selection and Analysis of Driving Factors

When selecting driving factors, previous studies have mostly focused on climate and human activities [37,39], but the impact of ecological environment quality on NPP changes has rarely been explored. Based on previous studies, three groups of driving factors (climate, ecology, and society) were selected and analyzed using the geographical detector model. The results show that NDVI and LUCC were the main ecological and social factors, respectively, playing a decisive role in the variation of vegetation NPP in Yangzhou. In contrast, the influence of other social factors (such as GDP) and climate factors (such as Rainfall) were generally lower, which were not in line with previous research results [34,51]. Although climate factors directly affect and are an important guarantee of vegetation NPP, the research scale considered in this study is relatively small. The average annual climate change amplitude within the study area over the past 20 years was also minimal and had a relatively weak effect on NPP variation. At the same time, during the period researched, with the rapid development of urbanization, a large amount of farmland and forest land have been converted into urban construction land, resulting in significant changes in land use and the indirect reduction of vegetation coverage. Therefore, NDVI and LUCC have become key indicators of changes in vegetation NPP in Yangzhou in recent years. Compared to the influence of a single driving factor, the interaction of multiple factors was shown to exert a stronger effect. Specifically, the interaction between NDVI and LUCC in Yangzhou had the strongest impact, with an explanatory power of 77.78%. The interaction between RAD and TEM had the weakest impact, with an explanatory power of only 4.81%. These results suggested that the main factors affecting vegetation NPP varied in different regions. In areas with higher levels of urbanization, NPP variation has been shown to be mainly driven by the dual interaction of land-use change and vegetation cover reduction [45,49]. In remote and mountainous areas less affected by anthropogenic activities, the interaction between climate and ecological factors constitutes the main driving force [10,52,53]. Studying the differences in dominant driving factors in different regions can assist managers in making targeted scientific decisions.

4.4. Uncertainty and Limitations

In terms of research data and methods, due to the limitations of remote-sensing technology, early research mostly focused on large-scale research scope, with low accuracy of data and many details in the research area that cannot be reflected. This article uses satellite remote-sensing data with a resolution of 30 m, which provides the possibility for studying high-precision NPP products at relatively small city scales. Although the improved CASA model can relatively accurately estimate the vegetation NPP, the model itself cannot fully explain the impact mechanism of soil nutrients and water factors on vegetation NPP values. There is also a certain degree of uncertainty in the simulated values of the CASA model in water areas. These are common problems among many models (Zhu et al., 2007; Bao et al., 2016; Liu et al., 2022) [13,17,47].
The improved Hurst index method used in this study, which was based on past trends, has the advantages of high accuracy and wide applicability in predicting the evolution of future trends [41]. The prediction and analysis of the future NPP variation based on this method is a useful exploration of the “low-carbon” development theory and associated practical applications. However, these predictions contain many uncertainties, such as those related to future climate change scenarios, economic development trends, and land-use policies. All these will affect the evolution of future trends, and the influencing factors considered in this study will all present a degree of uncertainty. Especially in terms of social factors, it should be noted that while those selected in this study (LUCC, GDP, POP, and DTR) represent most human activities, the actual impact of these activities on NPP goes far beyond this. On the other hand, the socio-economic situation and policies to support urban development are also constantly changing, directly affecting the aforementioned driving factors. NDVI and NDBSI are both ecological factors and important indicators of land-use change. The analysis of the interaction between driving factors may exaggerate the influence of some of them. There are studies showing that elevation indirectly affects NPP by affecting the distribution of vegetation [54]. Since the research area is mainly composed of plains, although the southeastern part is hilly terrain, the overall elevation difference is relatively less, and the impact on NPP is not significant. This study did not systematically discuss the impact of elevation changes on NPP. In addition, the scale dependence of the variation of climate factors requires further exploration in the future. We hope to develop more comprehensive and accurate prediction models in the future, address the aforementioned uncertainties, assist managers in scientific decision-making, and provide a reference or early warning for the formulation of low-carbon development plans and policies in the Yangzhou region in the future.

5. Conclusions

In this study, the temporal and spatial evolution of vegetation NPP in Yangzhou City from 2000 to 2020 was analyzed, and future trends were predicted. At the same time, the main driving factors of NPP variation in this city were also examined. The results revealed that: (1) temporally, the vegetation NPP values in Yangzhou City from 2000 to 2020 mainly manifested as the Slightly Declined (51.04%) and Remained Stable (41.15%) categories, and this trend is predicted to continue in the future; and (2) spatially, NPP values were generally higher in the city’s surrounding areas and lower in the central area. Significant differences in NPP were observed among land types. Specifically, values were ranked in the following descending order: forest > farmland > unused land > urban > water. In most areas, NPP values were within the Remained Stable category. In the future, the NPP of vegetation along Gaoyou Lake and the Grand Canal will improve significantly. In general, the values of this parameter in Yangzhou City are predicted to fall within the Continuing Decline (47.71%) and Remained Stable (41.15%) categories. The main driving factors of NPP variation in Yangzhou were NDVI (among the ecological factors) and the LUCC (among the social factors). Climate factors played a relatively minor role, and the interaction of multiple driving factors exerted a more significant influence than single factors. These findings indicated that it is necessary to consider the influence of multiple factors in the analysis and prediction of future NPP trends in rapidly developing coastal areas, identify the dominant factors driving these trends, and provide theoretical exploration and practical basis for achieving the “dual carbon” goals in the Yangzhou region.

Author Contributions

Conceptualization, Y.Z. and Xiong Li; methodology, Y.Z.; software, Y.Z.; validation, Y.Z., M.S. and X.L.; formal analysis, Y.Z.; investigation, Y.Z.; resources, Y.Z.; data curation, Y.Z.; writing—original draft preparation, Y.Z.; writing—review and editing, Y.Z.; visualization, M.S.; supervision, X.L.; project administration, X.L.; funding acquisition, X.L. All authors have read and agreed to the published version of the manuscript.

Funding

This research was funded by the National Key R&D Plan of China, Rural Ecological Landscape Creation Model. Grant number 2019YFD1100402. The APC was funded by the aforementioned fund.

Institutional Review Board Statement

Not applicable.

Informed Consent Statement

Not applicable.

Data Availability Statement

Data will be made available on request.

Conflicts of Interest

The authors declare no conflict of interest.

References

  1. Chen, J.; Li, Z.; Dong, Y.; Song, M.; Shahbaz, M.; Xie, Q. Coupling coordination between carbon emissions and the eco-environment in China. J. Clean. Prod. 2020, 276, 123848. [Google Scholar] [CrossRef]
  2. IPCC. Climate Change 2013: The Physical Science Basis; Working Group I Contribution to the IPCC Fifth Assessment Report (AR5); IPCC: New York, NY, USA, 2013. [Google Scholar]
  3. Lee, M.; Manning, P.; Rist, J.; Power, S.A.; Marsh, C. A global comparison of grassland biomass responses to CO2 and nitrogen enrichment. Philos. Trans. R. Soc. B Biol. Sci. 2010, 365, 2047. [Google Scholar] [CrossRef] [PubMed]
  4. Zhu, W.Q.; Pan, Y.Z.; Long, Z.H.; Chen, Y.H.; Li, J.; Hu, H.B. Esti—Mating net primary productivity of terrestrial vegetation based on GIS and RS: A case study in Inner Mongolia, China. J. Remote Sens. 2005, 9, 300–307. [Google Scholar]
  5. Zhang, M.; Lin, H.; Long, X.R.; Cai, Y.T. Analyzing the spatio—Temporal pattern and driving factors of wetland vegetation chang- es using 2000–2019 time-series Landsat data. Sci. Total Environ. 2021, 780, 146615. [Google Scholar] [CrossRef] [PubMed]
  6. Wang, S.; Lv, L.H.; Zhang, Z.; Wang, S.Y.; Wu, J.; Fu, J.F.; Luo, H. Low cost carbon peaking and carbon neutrality pathways in China based on multi-objective models. Environ. Sci. Res. 2021, 34, 2044. [Google Scholar]
  7. Sun, L.; Cui, H.; Ge, Q. Driving factors and future prediction of carbon emissions in the belt and road initiative countries. Energies 2021, 14, 5455. [Google Scholar] [CrossRef]
  8. Xu, Y.; Huang, W.T.; Zheng, Z.W.; Dai, Q.Y.; Li, X.Y. Detection of NPP influencing factors of vegetation in southwestern China based on spatial scale effects. Environ. Sci. 2023, 44, 900–911. [Google Scholar]
  9. Liu, Y.Y.; Wang, Q.; Yang, Y.; Gang, C.C.; Zhang, Z.Y.; Tong, L.J.; Li, J.L. The spatiotemporal dynamics and influencing factors of net primary productivity of grasslands on the Loess Plateau. J. Appl. Ecol. 2019, 30, 2309–2319. [Google Scholar]
  10. Zhu, P.F.; Liu, G.; He, J.; Dai, T.R. Spatiotemporal Variation of Vegetation Net Primary Productivity and Its Driving Factors in Dabie Mountains Area in Recent 20 Years. J. Yangtze River Acad. Sci. 2022, 1–9. Available online: http://kns.cnki.net/kcms/detail/42.1171.TV.20221223.1219.007.html (accessed on 5 May 2023).
  11. Long, X.; Li, X.; Lin, H.; Zhang, M. Mapping the vegetation distribution and dynamics of a wetland using adaptive stacking and Google Earth Engine based on multi-source remote sensing data. Int. J. Appl. Earth Obs. Geoinf. 2021, 102, 102453. [Google Scholar] [CrossRef]
  12. Potter, C.S.; Randerson, J.T.; Field, C.B.; Matson, P.A.; Vitouse, P.M.; Mooney, H.A.; Klooster, S.A. Terrestrial ecosystem pro- duction: A process model based on global satellite and surface data. Glob. Biogeochem. Cycles 1993, 7, 811–841. [Google Scholar] [CrossRef]
  13. Zhu, W.Q.; Pan, Y.Z.; Zhang, J.S. Remote sensing estimation of net primary productivity of terrestrial vegetation in China. J. Plant Ecol. 2007, 31, 413–424. [Google Scholar]
  14. Ichii, K.; Hashimoto, H.; Nemani, R.; White, M. Modeling the interannual variability and trends in gross and net primary productivity of tropical forests from 1982 to 1999. Glob. Planet. Chang. 2005, 48, 274–286. [Google Scholar] [CrossRef]
  15. Liu, L.; Peng, S.; AghaKouchak, A.; Huang, Y.; Li, Y.; Qin, D.; Xie, A.; Li, S. Broad consistency between satellite and vegetation model estimates of net primary productivity across global and regional scales. J. Geophys. Res. Biogeosci. 2018, 123, 3603–3616. [Google Scholar] [CrossRef]
  16. Singh, D. Generation and evaluation of gross primary productivity using Landsat data through blending with MODIS data. Int. J. Appl. Earth Obs. Geoinf. 2011, 13, 59–69. [Google Scholar] [CrossRef]
  17. Bao, G.; Bao, Y.H.; Qin, Z.H.; Xin, X.P.; Bao, Y.L.; Bayarsaikan, S.; Zhou, Y.; Chuntai, B. Modeling net primary productivity of terrestrial ecosystems in the semi-arid climate of the Mongolian Plateau using LSWI based CASA ecosystem model. Int. J. Appl. Earth Obs. Geoinf. 2016, 46, 84–93. [Google Scholar] [CrossRef]
  18. Mu, S.J.; Zhou, S.X.; Chen, Y.Z.; Li, J.L.; Ju, W.M.; Odeh, I.O.A. Assessing the impact of restoration-induced land conversion and management alternatives on net primary productivity in Inner Mongolian grassland, China. Glob. Planet. Change 2013, 108, 29–41. [Google Scholar] [CrossRef]
  19. Piao, S.L.; Fang, J.Y.; Zhou, L.M.; Zhu, B.; Tan, K.; Tao, S. Changes in vegetation net primary productivity from 1982 to 1999 in China. Glob. Biogeochem. Cycles 2005, 19, GB2027. [Google Scholar] [CrossRef]
  20. Field, C.B.; Randerson, J.T.; Malmström, C.M. Global net primary production:combining ecology and remote sensing. Remote Sens. Environ. 1995, 51, 74–88. [Google Scholar]
  21. Shao, J.H.; Li, J.; Yan, X.G.; Ma, T.Y.; Yan, R. Analysis of spatiotemporal changes and driving forces of NPP in Shanxi Province from 2000 to 2020 based on geographic detectors. Environ. Sci. 2023, 44, 312–322. [Google Scholar]
  22. Wang, J.T.; Yang, Y.C.; Yang, M.H. Spatial and temporal variation and driving forces of NPP on the Loess Plateau based on Geodetector. J. Xi’an Univ. Technol. 2023, 1–10. Available online: http://kns.cnki.net/kcms/detail/61.1294.N.20221213.0940.001.html (accessed on 5 May 2023).
  23. Nemani, R.R.; Keeling, C.D.; Hashimoto, H.; Jolly, W.M.; Piper, S.C.; Tucker, C.J.; Myneni, R.B.; Running, S.W. Climate-driven increases in global terrestrial net primary production from 1982 to 1999. Science 2003, 300, 1560–1563. [Google Scholar] [CrossRef] [PubMed]
  24. Zhu, Z.; Piao, S.; Myneni, R.B.; Huang, M.; Zeng, Z.; Canadell, J.G.; Ciais, P.; Sitch, S.; Friedlingstein, P.; Arneth, A.; et al. Greening of the Earth and its drivers. Nat. Clim. Change 2016, 6, 791–795. [Google Scholar] [CrossRef]
  25. Cleveland, C.C.; Houlton, B.Z.; Smith, W.K.; Marklein, A.R.; Reed, S.C.; Parton, W.; Del Grosso, S.J.; Running, S.W. Patterns of new versus recycled primary production in the terrestrial biosphere. Proc. Natl. Acad. Sci. USA 2013, 110, 12733–12737. [Google Scholar] [CrossRef]
  26. Zhang, J.; Qi, Y.; Yang, R.; Ma, X.; Zhang, J.; Qi, W.; Guo, Q.; Wang, H. Impacts of Climate Change and Land Use/Cover Change on the Net Primary Productivity of Vegetation in the Qinghai Lake Basin. Int. J. Environ. Res. Public Health 2023, 20, 2179. [Google Scholar] [CrossRef]
  27. Tian, H.W.; Liu, S.Z.; Wen, B.; Zhang, J.H.; Zheng, Y.P.; Shi, J.Q.; Bi, R.T. Deciphering the Drivers of Net Primary Productivity of Vegetation in Mining Areas. Remote Sens. 2022, 14, 4177. [Google Scholar] [CrossRef]
  28. Jia, L.; Yu, K.X.; Deng, M.J.; Li, P.; Li, Z.B.; Shi, P.; Xu, G.C. The spatial-temporal change of annual NPP in the Heihe River basin and its response to climate factors. J. Appl. Basic Eng. Sci. 2023, 31, 523–540. [Google Scholar]
  29. Hurst, H.E. Long-term storage capacity of reservoirs. Trans. Am. Soc. Civ. Eng. 1951, 116, 770–799. [Google Scholar] [CrossRef]
  30. Rehman, S. Study of Saudi Arabian climatic conditions using Hurst exponent and climatic predictability index. Chaos Solitons Fractals 2009, 39, 499–509. [Google Scholar] [CrossRef]
  31. Dou, Z.X.; Sun, Y.M.; Zhu, J.H.; Zhou, Z.J. The Evaluation Prediction System for Urban Advanced Manufacturing Development. Systems 2023, 11, 392. [Google Scholar] [CrossRef]
  32. Yangzhou Municipal Government. Available online: http://www.yangzhou.gov.cn/yangzhou/zrdl/202203/345ceddd6476432f93591296563cbe29.shtml (accessed on 22 March 2022).
  33. Xu, H.Q. A remote sensing urban ecological index and its application. Acta Ecol. Sin. 2013, 33, 7853–7862. [Google Scholar]
  34. Yang, J.; Huang, X. The 30 m annual land cover dataset and its dynamics in China from 1990 to 2019. Earth Syst. Sci. Data 2021, 13, 3907–3925. [Google Scholar] [CrossRef]
  35. Tian, Y.C.; Huang, Y.L.; Zhang, Q.; Tao, J.; Zhang, Y.L.; Huang, H.; Zhou, G.Q. Spatial and temporal distribution of net primary productivity of vegetation in the Nanliu River basin of the Gulf of Tonkin and its driving factors. Acta Ecol. Sin. 2019, 39, 8156–8171. [Google Scholar]
  36. Zhou, G.S.; Zhang, X.S. Study on climate vegetation classification for global change in China. Acta Botanica Sinica 1996, 38, 8–17. [Google Scholar]
  37. Running, S.W.; Thornton, P.E.; Nemani, R.; Glassy, J.M. Global Terrestrial Gross and Net Primary Productivity from the Earth Observing System, in Methods in Ecosystem Science; Sala, O., Jackson, R., Mooney, H., Eds.; Springer: Berlin/Heidelberg, Germany, 2000; pp. 44–57. [Google Scholar]
  38. Yuan, L.; Jiang, W.; Shen, W.; Liu, Y.; Wang, W.; Tao, L.; Zheng, H.; Liu, X. The spatio-temporal variations of vegetation cover in the Yellow River Basin from 2000 to 2010. Acta Ecol. Sin. 2013, 33, 7798–7806. [Google Scholar]
  39. Chen, Y.H.; Wang, J.; Xiong, N.N.; Sun, L.; Xu, J.Q. Impacts of Land Use Changes on Net Primary Productivity in Urban Agglomerations under Multi-Scenarios Simulation. Remote Sens. 2022, 14, 1755. [Google Scholar] [CrossRef]
  40. Ray, R.; Khondekar, M.H.; Ghosh, K.; Bhattacharjee, A.K. Scaling and nonlinear behaviour of daily mean temperature time series across India. Chaos Solitons Fractals 2016, 84, 9–14. [Google Scholar] [CrossRef]
  41. Li, C.; Dou, T.; Wang, Y.; Zhu, T.; Yin, H.; Zhou, M.; Liu, L.; Wu, X. A Method for Quantifying the Impacts of Human Activities on Net Primary Production of Grasslands in Northwest China. Remote. Sens. 2021, 13, 2479. [Google Scholar] [CrossRef]
  42. Du, L.T.; Gong, F.; Zeng, Y.J.; Ma, L.L.; Qiao, C.L.; Wu, H.Y. Carbon use efficiency of terrestrial ecosystems in desert/grassland biome transition zone: A case in Ningxia province, northwest China. Ecol. Indic. 2021, 120, 106971. [Google Scholar] [CrossRef]
  43. Wang, J.F.; Xu, C.D. Geographic detectors: Principles and prospects. J. Geogr. 2017, 72, 116–134. [Google Scholar]
  44. Gong, C.; Wang, S.X.; Lu, H.C.; Chen, Y.; Liu, J.F. Research progress on spatial differentiation and influencing factors of soil heavy etectors. Environ. Sci. 2023, 44, 2799–2816. [Google Scholar]
  45. Yuan, Z.; Jiang, Q.Q.; Yin, J. Impact of climate change and land use change on ecosystem net primary productivity in the Yangtze River and Yellow River Source Region, China. Watershed Ecol. Environ. 2023, 5, 125–133. [Google Scholar] [CrossRef]
  46. Li, X.C.; Luo, Y.H.; Wu, J.H. Decoupling Relationship between Urbanization and Carbon Sequestration in the Pearl River Delta from 2000 to 2020. Remote Sens. 2022, 14, 526. [Google Scholar] [CrossRef]
  47. Liu, W.R.; Li, X.T.; Li, T.; Jia, B.Q. Spatiotemporal variations of forest NPP and related driving factors based on MODIS and CASA models in Yichun. Chin. J. Ecol. 2022, 41, 150–158. [Google Scholar] [CrossRef]
  48. Yin, K.; Tian, Y.C.; Yuan, C.; Zhang, F.F.; Fan, Q.Z.; Hua, L.Z. NPP spatial and temporal pattern of vegetation in Beijing and its factor explanation based on CASA model. Remote Sens. Land Resour. 2015, 27, 133–139. [Google Scholar]
  49. Li, J.G.; Wang, H.; Wang, J.; Li, Q.; Zhang, Z.Q.; Liu, L.L.; Pu, L.J. The impact of urbanization process on the productivity of Terrestrial ecosystem based on linear fitting—Taking Jiangsu Province as an example. Resour. Sci. 2018, 40, 32–43. [Google Scholar]
  50. Li, Y.; Xie, Z.; Qin, Y.; Zheng, Z. Estimating relations of vegetation, climate change, and human activity: A case study in the 400mm annual precipitation fluctuation zone. China Remote Sens. 2019, 11, 1159. [Google Scholar] [CrossRef]
  51. Qi, S.Y.; Chen, S.D.; Long, X.R.; An, X.X.; Zhang, M. Quantitative contribution of climate change and anthropological activities to vegetation carbon storage in the Dongting Lake basin in the last two decades. Adv. Space Res. 2023, 71, 845–868. [Google Scholar] [CrossRef]
  52. Gong, H.B.; Li, C.; Ya, F.D.; Jiao, F.S.; Xu, X.J.; Zhang, M.Y.; Wang, K.L.; Liu, H.Y. Multiple effects of climate changes and human activities on NPP increase in the Three-north Shelter Forest Program area. For. Ecol. Manag. 2023, 529, 120732. [Google Scholar] [CrossRef]
  53. Yang, A.L.; Zhang, H.; Yang, X.J.; Zhang, X.P. Quantitative analysis of the impact of climate change and human activities on vegetation NPP in the Qilian Mountain. Hum. Ecol. Risk Assess. Int. J. 2023, 29, 202–221. [Google Scholar] [CrossRef]
  54. Wang, Z.Q.; Wang, H.; Wang, T.F.; Wang, L.N.; Huang, X.T.; Zheng, K.; Liu, X. Effects of Environmental Factors on the Changes in MODIS NPP along DEM in Global Terrestrial Ecosystems over the Last Two Decades. Remote Sens. 2022, 14, 713. [Google Scholar] [CrossRef]
Figure 1. The research framework.
Sustainability 15 14518 g001
Figure 2. Locations of the study area.
Sustainability 15 14518 g002
Figure 3. Spatial and temporal pattern of NPP in Yangzhou City from 2000 to 2020.
Sustainability 15 14518 g003
Figure 4. Average NPP of districts under Yangzhou City from 2000 to 2020.
Sustainability 15 14518 g004
Figure 5. The spatiotemporal pattern of NPP change levels in Yangzhou City from 2000 to 2020.
Sustainability 15 14518 g005
Figure 6. Trends and future prediction of vegetation NPP changes in Yangzhou.
Sustainability 15 14518 g006
Figure 7. Fitting relationship between CASA model-estimation results and MODIS product NPP data.
Sustainability 15 14518 g007
Table 1. Driving-factor data information.
Data TypeData Content Spatial ResolutionData Coordinate SystemData Sources
Climate dataMonthly temperature1 kmWGS84-UTM-50https://data.tpdc.ac.cn/ (accessed on 22 February 2023)
Monthly rainfall1 kmWGS84-UTM-50https://data.tpdc.ac.cn/ (accessed on 22 February 2023)
Monthly solar radiation1 kmWGS84-UTM-50https://data.cma.cn/ (accessed on 22 February 2023)
Social dataGDP of Yangzhou City1 kmWGS84-UTM-50https://www.resdc.cn/ (accessed on 25 February 2023)
POP of Yangzhou City1 kmWGS84-UTM-50https://www.resdc.cn/ (accessed on 25 February 2023)
Distance to road30 mWGS84-UTM-50https://www.openstreetmap.org/ (accessed on 25 February 2023)
Land-use CLCD30 mWGS84-UTM-50https://doi.org/10.5194/essd-13-3907-2021/ (accessed on 26 February 2023)
Ecological dataNDVI30 mWGS84-UTM-50Google Earth Engine-based inversion
NDBSI30 mWGS84-UTM-50Google Earth Engine-based inversion
WET30 mWGS84-UTM-50Google Earth Engine-based inversion
Other dataDEM data30 mWGS84-UTM-50NASA DEM30 m Type Dataset
Administrative division Map of Yangzhou CityWGS84-UTM-50https://www.resdc.cn/ (accessed on 22 February 2023)
Historical and cultural data of Yangzhou Cityhttp://www.yangzhou.gov.cn/yangzhou/zrdl/ (accessed on 28 February 2023)
and the annals of statistics
Table 2. Values of different vegetation types of NDVIi,max, NDVIi,min, and εmax.
No.Land useNDVIi,maxNDVIi,minεmax
1Farmland0.6340.0230.604
2Forest0.6760.0231.295
3Water0.6340.0230.542
4Urban0.6340.0230.542
5Unused land0.6340.0230.542
Note: This table is organized based on reference [13,37].
Table 3. The value range of β and Hurst index to judge future trends.
The Value Range of β and Hurst IndexFuture Trends
β > 0, H > 0.5Continuing Improvement
β < 0, H > 0.5Continuing Decline
β > 0, H < 0.5Improvement to Decline
β < 0, H < 0.5Decline to Improvement
Β = 0Remained Stable
Table 4. Area and proportion of NPP at different levels from 2000 to 2020.
NPP Level20002005201020152020
Area/km2%Area/km2%Area/km2%Area/km2%Area/km2%
Worst345.075.26%472.157.20%469.757.17%496.237.57%545.528.32%
Poor478.127.29%555.048.47%805.8012.29%515.317.86%599.449.15%
Medium3341.6650.98%1963.8129.96%3470.3552.95%2663.9240.64%2816.0142.96%
Better2388.4636.44%3562.3254.35%1807.4127.57%2877.8543.91%2592.1939.55%
Best1.220.02%1.220.02%1.220.02%1.220.02%1.370.02%
Table 5. Average NPP and ranking of districts under Yangzhou City from 2000 to 2020.
District2000
NPP
Rank2005
NPP
Rank2010
NPP
Rank2015
NPP
Rank2020
NPP
RankMean of NPP 2000–2020Rank
Hanjiang422.725418.926409.225377.345399.535405.555
Jiangdu467.452459.863450.151423.353455.821451.322
Yizheng446.493463.932440.993435.402446.833446.733
Guangling439.914424.144422.654381.254410.084415.614
Baoying475.101484.331443.052441.231455.422459.821
Gaoyou415.926418.455402.626343.276365.996389.256
Yangzhou449.20/451.84/432.02/403.02/424.17/432.05/
Table 6. Area and proportion of vegetation NPP change level in Yangzhou City from 2000 to 2020.
ClassGrade2000–20052005–20102010–20152015–2020
Grade Area
/km2
Class Area
/km2
Percentage%Grade Area
/km2
Class Area
/km2
Percentage%Grade Area
/km2
Class Area
/km2
Percentage%Grade Area
/km2
Class Area
/km2
Percentage%
Degradation1180.741086.4516.58840.192950.3345.01267.941148.5417.52563.292710.4741.35
2905.712110.13880.602147.18
NO change31977.281977.2830.172065.092065.0931.512057.482057.4831.392724.992724.9941.57
Improvement42255.653490.8153.261165.481539.1323.481843.323348.5251.091117.651119.0817.07
51235.16373.651505.211.43
Note: Grade: 1—Significant Decline; 2—Slight Decline; 3—Unchanged; 4—Slight Improvement; 5—Significant Improvement.
Table 7. The q value of driving factors on spatial differentiation of vegetation NPP in Yangzhou City.
Driving FactorsEcological FactorsClimatic FactorsSocial Factors
NDVIWETNDBSIRainfallTEM RADLUCCDTRPOPGDP
q statistic0.72870.39230.20850.01630.03430.01240.56010.02660.06510.0275
p-value0.0000.0000.0000.0000.0000.0000.0000.0000.0000.000
Table 8. NPP mean values and NPP values of land types in Yangzhou City from 2000 to 2020.
Land-Use Type20002005201020152020
Mean values of NPP449.2002451.8444432.0215403.0195424.1662
Farmland456.5331455.7672438.6139407.8482411.9065
Forest478.0433489.3618461.6351449.2652472.9257
Water292.51263.4293284.5288158.4521156.6578
Urban242.5894317.584301.0946257.5867290.9038
Unused land435.5329260.052362.058276.519223.492
Table 9. Land transition matrix of Yangzhou City from 2000 to 2020.
2000–2020FarmlandForestWaterUnused LandUrban
Farmland4564.57771.71188.41230.0108456.525
Forest6.52326.04621.6290.00000.7218
Water108.91260.423707.84010.003620.0673
Urban1.59390.00003.57030.0000505.5921
Table 10. The q value of interaction among driving factors of vegetation NPP in Yangzhou.
qLUCCNDVIWETNDBSIRainfallTEMRADDTRPOPGDP
LUCC0.5601
NDVI0.77770.7287
WET0.62690.74910.3923
NDBSI0.62830.73270.64670.2085
Rainfall0.57420.73430.41450.28720.0163
TEM0.58200.74070.42430.29130.06880.0343
RAD0.58710.74050.41660.26520.09180.04810.0124
DTR0.57140.73480.41010.26420.05820.08490.08960.0266
POP0.57400.73480.43540.28820.09000.09040.07750.09530.0651
GDP0.56780.73340.41730.28470.03610.05700.04690.04840.07070.0275
Table 11. Pearson correlation analysis of driving factors of vegetation NPP change in Yangzhou.
Pearson CorrelationNPPNDVIWETNDBSIRainfallTEMRADDTRPOPGDP
NPP1.000 **
NDVI0.854 **1.000 **
WET−0.385 **−0.237 **1.000 **
NDBSI−0.484 **−0.709 **−0.424 **1.000 **
Rainfall0.017 **−0.012−0.382 **0.375 **1.000 **
TEM−0.108 **−0.116 **−0.249 **0.372 **0.804 **1.000 **
RAD0.095 **0.099 **0.272 **−0.363 **−0.857 **−0.914 **1.000 **
Distance to road−0.017 **0.0080.163 **−0.162 **−0.341 **−0.564 **0.587 **1.000 **
POP0.003−0.061 **−0.202 **0.244 **0.534 **0.529 **−0.539 **−0.443 **1.000 **
GDP−0.048 **−0.103 **−0.204 **0.289 **0.606 **0.621 **−0.640 **−0.423 **0.921 **1.000 **
Note: ** mean p < 0.01.
Disclaimer/Publisher’s Note: The statements, opinions and data contained in all publications are solely those of the individual author(s) and contributor(s) and not of MDPI and/or the editor(s). MDPI and/or the editor(s) disclaim responsibility for any injury to people or property resulting from any ideas, methods, instructions or products referred to in the content.

