Abstract
By 2050, a majority of the global population will reside in urban agglomerations. Intensifying natural hazards are posing serious challenges to populations within the urban agglomerations. Therefore, it is critical to evaluate the resilience of urban agglomerations to natural hazards. However, the urban resilience of China’s three major urban agglomerations, Beijing–Tianjin–Hebei (BTH), the Yangtze River Delta (YRD), and Guangdong–Hong Kong–Macao Greater Bay Area (GHMB), is not properly determined. To enhance the evaluation of comprehensive resilience in complex urban agglomerations and improve adaptability in the face of uncertain risks, this paper adopts the theory of complex adaptive systems to reveal the driving factors behind resilience. We developed a model for measuring disaster severity, exposure, bearing capacity, recoverability, and learnability. Furthermore, spatial autocorrelation analysis was employed to explore the distribution patterns of resilience and devise strategies for enhancement. The results indicate that the average urban resilience value of the three major urban agglomerations was 0.5061. The average urban resilience values for BTH, YRD, and GHMB are 0.5331, 0.5116, and 0.4612. We found BTH having the highest resilience level, followed by YRD and GHMB. Within BTH, the resilience level was the highest in the northern part of BTH, but the overall resilience of the southern cities should be improved by enhancing Shijiazhuang’s central role. We also found higher resilience level in northwest YRD than in southeast YRD due to lower population density and lower disaster exposure in northwest YRD. However, we found obscure spatial patterns of urban resilience within GHMB, i.e., higher urban resilience in east and west GHMB and lower urban resilience level in central GHMB. This study presents different urban resilience levels over three urban agglomerations, providing background information for urban planning and urban mitigation to natural disasters in a warming climate.
1. Introduction
By 2050, over 60% of the global population will find their homes within bustling urban agglomerations [1]. Urban agglomeration is a term used to describe the actual population residing in a continuous area with a high level of urban density, irrespective of administrative divisions. With rapidly- growing urbanization, cities are becoming increasingly vulnerable to natural disasters, climate change, resource scarcity, and environmental degradation [2,3,4]. Global warming due to anthropogenic influences renders urban systems highly sensitive to risks of natural hazards. Building resilient cities is becoming essential in order to mitigate the negative impacts of urbanization and climate change [5]. Increasing frequency of extreme weather events and natural disasters further accentuate the need for urban resilience. It has been documented that resilient cities greatly reduce the disastrous effects of natural hazards [6,7], thus necessitating the evaluation of the resilience of urban agglomerations [8]. This point constitutes the motivation for the current study.
The term resilience was proposed to reflect the ability of a system to recover its original state [9]. Holling (1973) extended the concept of resilience to describe the steady state of ecosystems [10]. In 1990, the resilience concept was introduced into urban systems such as urban planning and construction, broadening the scope of urban disaster research [11]. Originally, urban resilience was defined from the perspective of ecology [12], engineering [13], environmental sciences [14] and management studies [15]. It defines the ability of cities to resist the negative effects of natural hazards and to recover from the after-effects of disaster events [16,17,18]. The evaluation of resilience focuses on the capacity of recovery of a city from economic, social, and urban planning perspectives [5]. Current research on the evaluation methods is transitioning from qualitative research to quantitative research [16]. For example, Zheng et al. [19] used factor analysis to establish an urban resilience assessment model for Beijing. Dong et al. [20] employed the entropy assessment technique and the geographic weight regression model to compute the holistic index of smart cities’ resilience. Wang et al. [21] introduces the exploratory spatial data analysis and the obstacle diagnosis model to explore the spatio-temporal evolution of urban resilience in China. However, previous studies neglected the influence of interactions between intra-city components on urban resilience, so mechanisms and causes behind changes in urban resilience were not fully unraveled from an urban agglomeration perspective. In this study, we used the complex adaptive systems (CAS) theory to evaluate urban resilience and unravel the underlying mechanisms having an impact on the resilience of urban agglomerations [22].
Urban agglomerations occupy an important place in regional socio-economic development [23]. However, these densely- populated areas are also highly susceptible to the risk of natural disasters, threatening the sustainable development of the socio-economy [24]. The CAS theory focuses on the mechanism of generation of complexity and emergence of complex systems [25]. Nonlinear flow of population, resources, technology, culture, policies, politics, and other elements in urban space tend to possess a dynamic balance under external disturbances and self-regulation [22]. Thus, as complex networks with organization, cities conform to the main characteristics of complex adaptive systems [26,27]. In the context of various uncertainties and compound disasters having an impact on urban social, economic, and technological systems and infrastructure, the CAS theory can be used to explore the complex characteristics, self-organizing evolutionary processes, and internal mechanisms of urban systems, and help better study the response of urban systems to risks [28,29]. Combined with Moran’s I analysis of spatial clustering and distribution characteristics of urban resilience, strategies for the resilience enhancement of urban agglomerations call for further investigation [7].
Here, we focus on the evaluation of resilience of three major urban agglomerations in China, i.e., BTH, YRD, and GHMB. These agglomerations are densely populated and contribute nearly half of China’s GDP. Due to the differences in geographic location, climate changes, underlying features, and industrial structure, urban resilience is varying within these agglomerations. This study, therefore, addresses: (1) how to propose and develop an urban resilience evaluation system for these urban agglomerations; (2) what the potential drivers behind different urban resilience levels of these agglomerations are; and (3) how to differentiate urban resilience levels within these agglomerations.
The primary aim of this research is to explore the resilience factors of urban agglomerations and their impact on enhancing urban resilience in the face of increasing natural hazards caused by climate change. In response to the complexity and systemic nature of cities, we have incorporated CAS theory and spatial autocorrelation analysis to assess the multidimensional resilience of urban agglomerations from external environment, overall structure, and internal composition.This study makes contributions to society’s adaptation to risks and disasters, while also promoting sustainable socio-economic development within urban agglomerations. The data required for this study are available and easily accessible, increasing the efficiency of resilience assessment. It can also serve as a reference for studies on urban agglomerations in other regions.
2. Study Regions and Data
2.1. Study Regions
We evaluated the urban resilience of China’s three major urban agglomerations, BTH, YRD, and GHMB (Figure 1). These three urban agglomerations are among the first batch of world-class urban agglomerations proposed for construction in China [30]. They also represent the economic centers in the northern, central, and southern regions, accounting for nearly half of China’s GDP, and they are home to more than 20% of China’s population [31]. They include the administrative or economic centers of relevant provinces and municipalities [32].
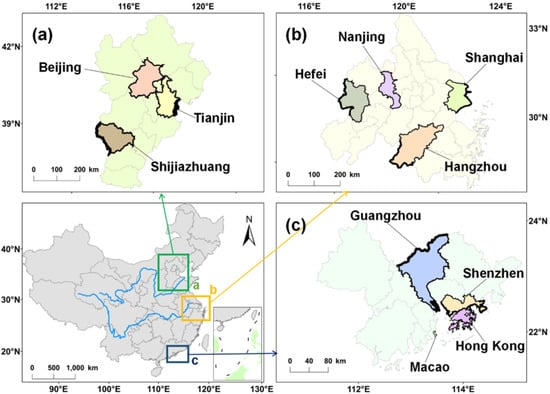
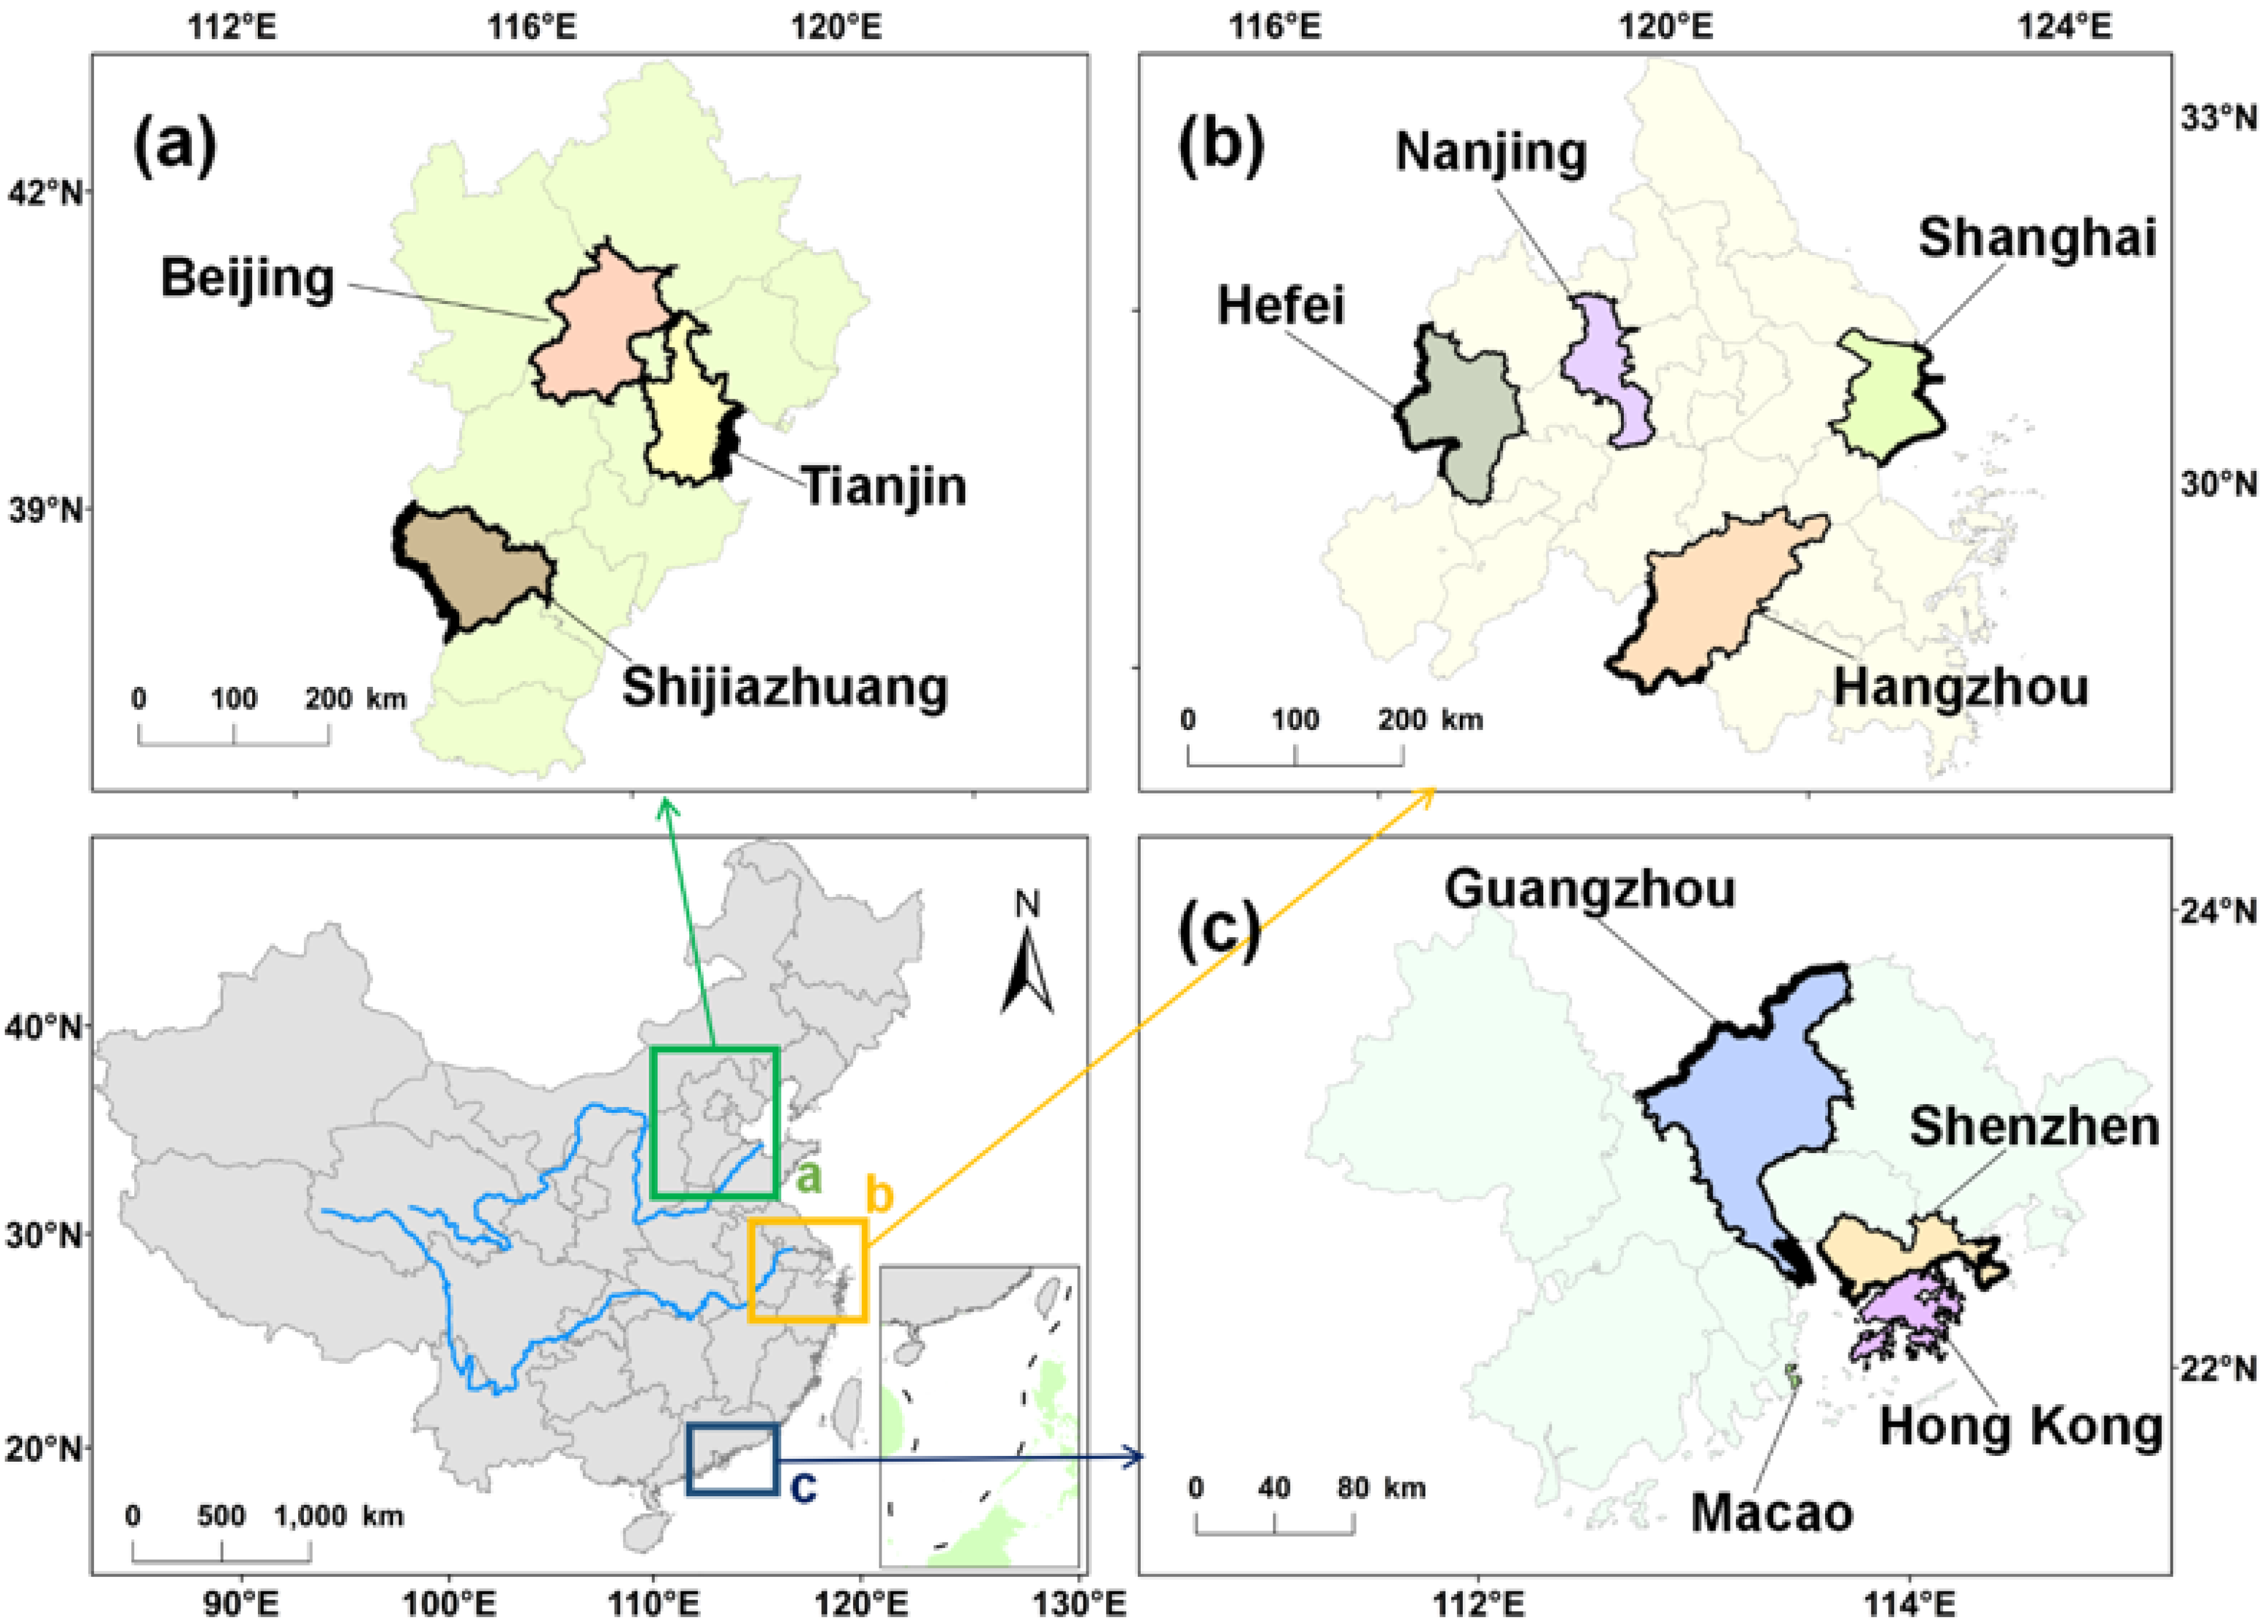
Figure 1.
Locations of (a) the Beijing-–Tianjin-–Hebei urban agglomeration (BTH), (b) the Yangtze River Delta urban agglomeration (YRD), and (c) the Guangdong-–Hong Kong-–Macao Greater Bay Area (GHMB).
BTH includes Beijing, Tianjin, and 11 cities in Hebei province [33]. YRD is adjacent to the East China Sea and the Yangtze River basin with a complex climate system. YRD is a highly economically developed region with high urbanization rate [34]. GHMB, with a rapid urbanization rate and high density of population, in the vicinity of the southeast coast of China, is making an important contribution to the socio-economic development of China [35]. The cities highlighted in Figure 1 are the administrative and economic canters of their respective urban agglomerations. Differing in geographic locations, climatic conditions, and urbanization, these three urban agglomerations differ in their sensitivity to natural hazards and weather extremes.
2.2. Data
During the resilience assessment process, the acquisition of actual data required for calculating certain indicators can pose challenges. Therefore, the data in this study are available and can be found in the statistical yearbooks of China. The economic, social, and educational data from 2020 were sourced mainly from the statistical yearbooks of the study regions (Supplementary Table S1).
3. Methods
3.1. Complex Adaptive Systems Theory for Urban Resilience Evaluation
CAS theory has been widely used in life sciences, sociology, ecology, and management, and helps the understanding and managing of complex systems [36]. The theory-based procedure is shown in Figure 2.
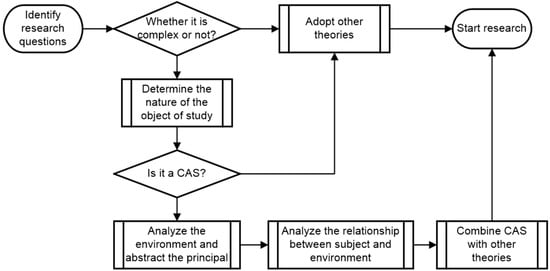
Figure 2.
Analysis procedure of CAS theory.
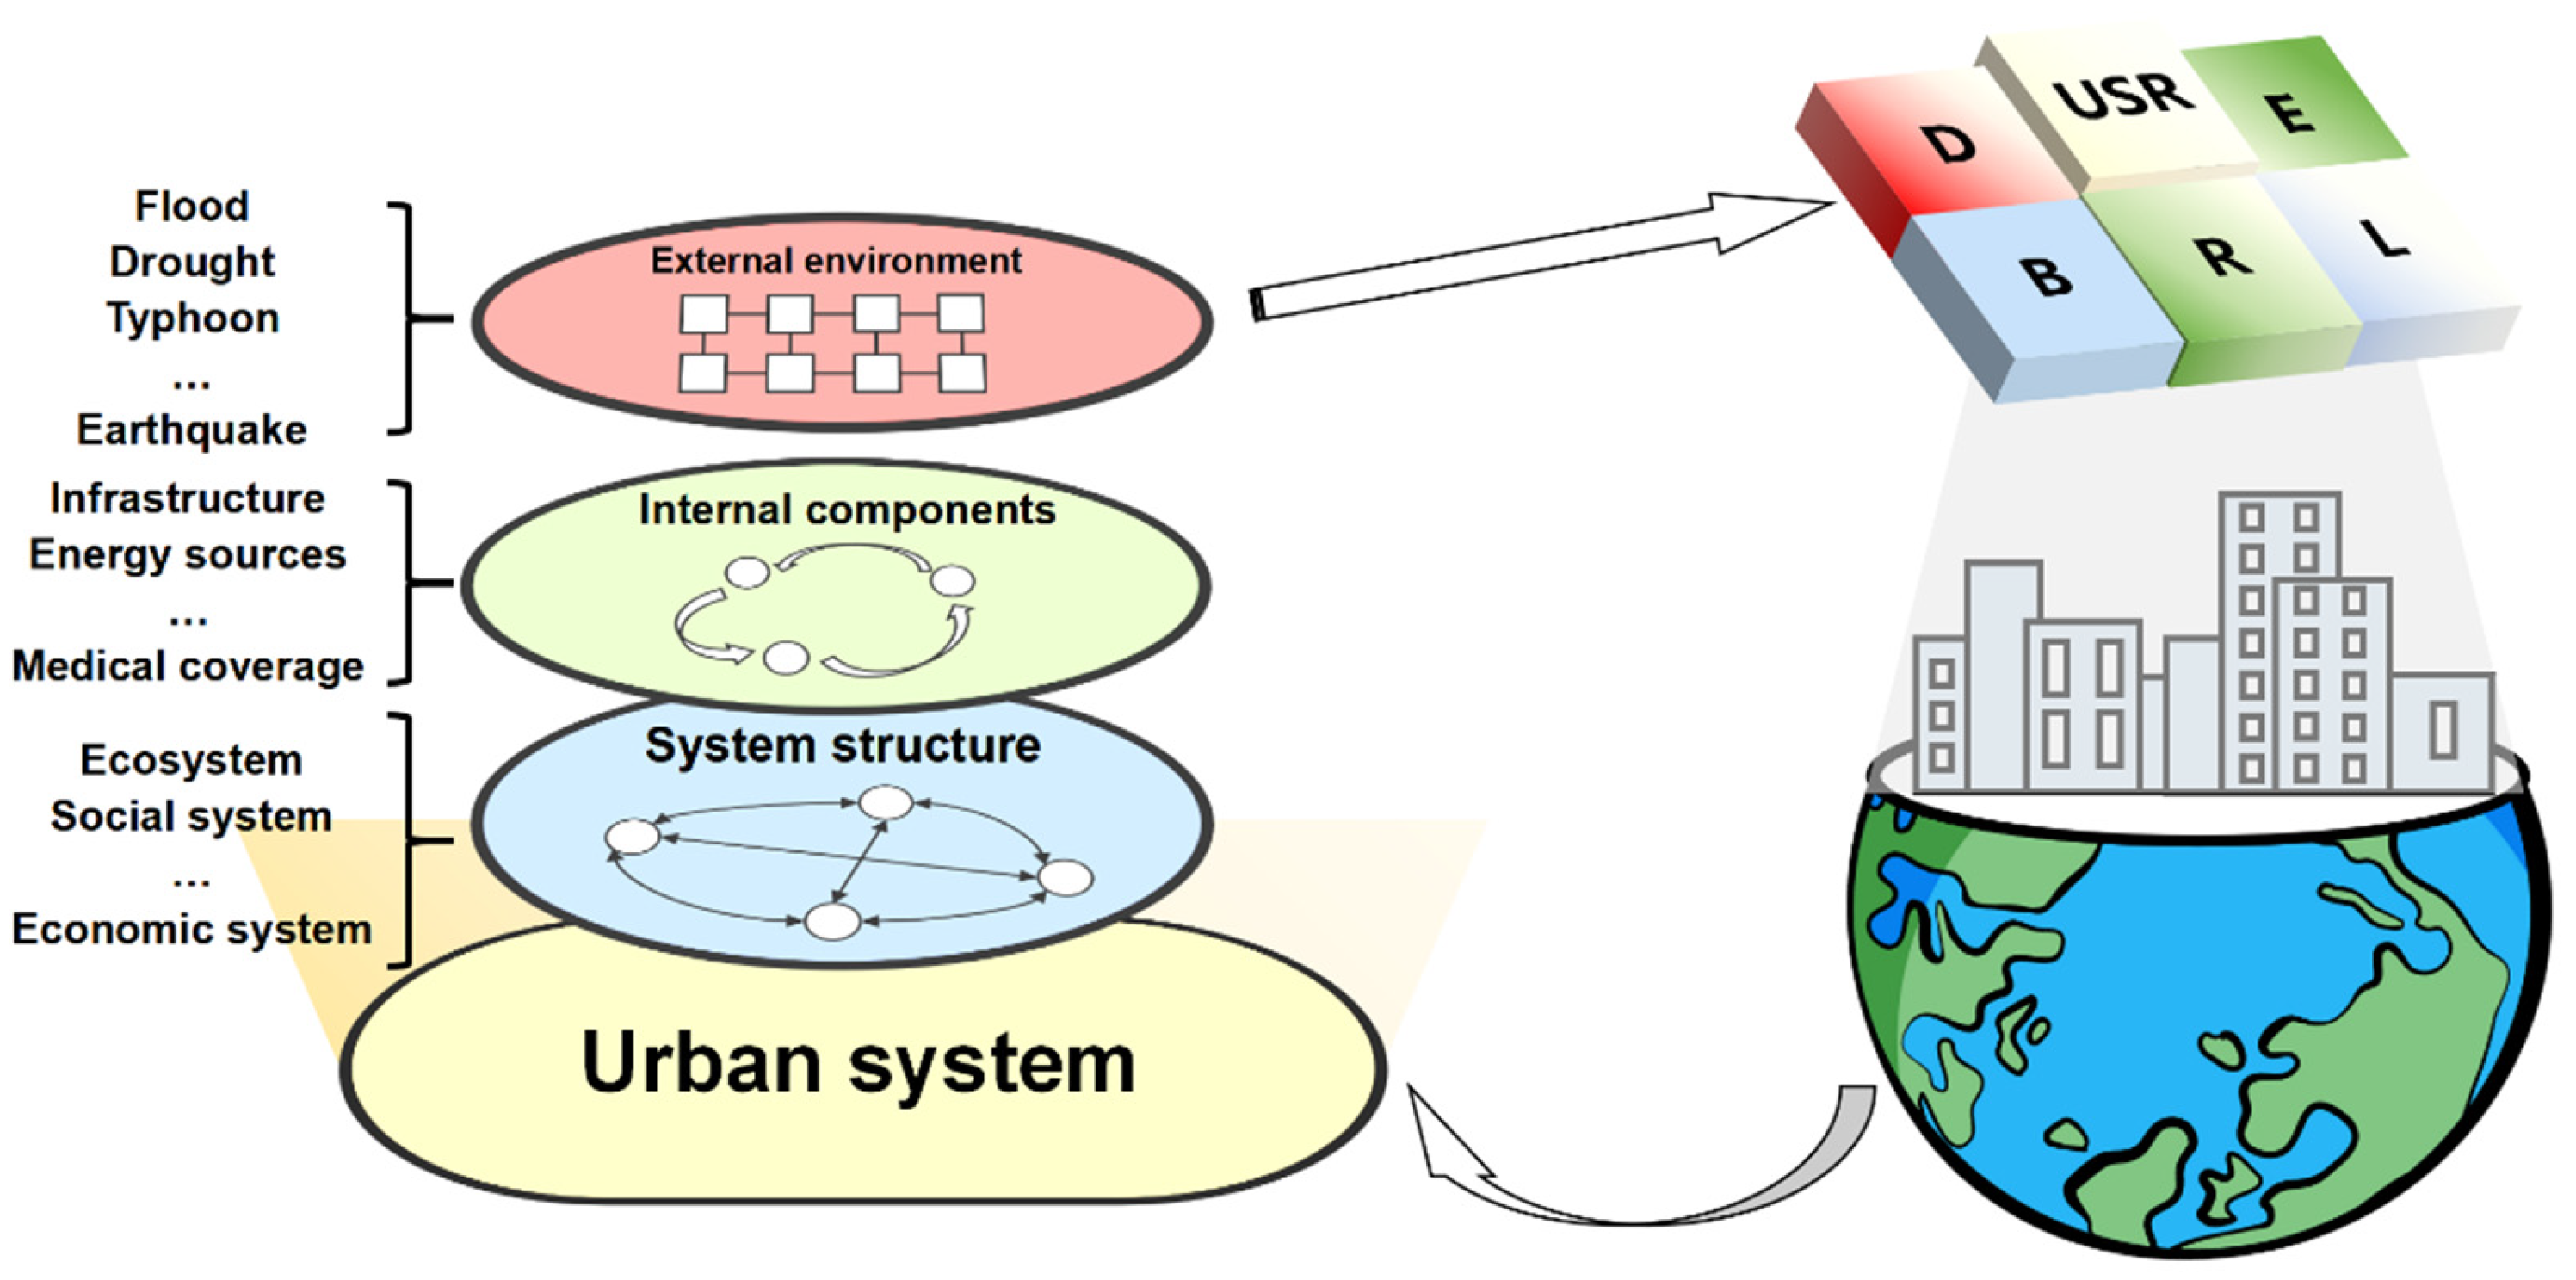
The city, as an entity, encompasses various subsystems such as housing, transportation, and healthcare. These subsystems interact with each other in a nonlinear manner. Therefore, in this study, the city conforms to the characteristics of a complex adaptive system. Based on the application process in Figure 2 and the definition of complex adaptive systems, the city system can be deconstructed into a complex system consisting of internal components, external environment, and system structure [22]. The CAS theory and resilience theory can be combined to understand the adaptive capacity and resilience of urban systems under natural disaster risks. CAS theory shows that the city, as a complex adaptive object, consists of three parts (Figure 3): the external environment of the system, the overall structure of the system, and the internal components of the system [33]. The system’s external environment encompasses the surroundings in which the urban system and its various elements exist and operate throughout the process of urbanization. The components of the urban system, in turn, represent the fundamental units that constitute the urban system [37,38].
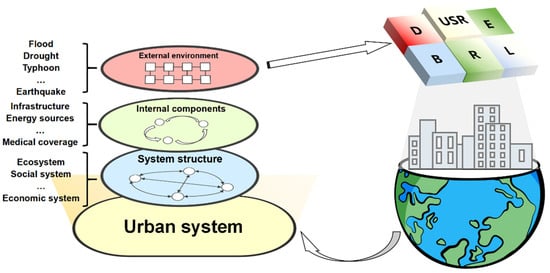
Figure 3.
CAS theory and deconstruction of an urban system.
In the realm of social sciences and environmental sciences, researchers globally aspire to quantify various human, social, and natural aspects. As a result, within the context of CAS theory, researchers also need to understand what exactly we are managing when measuring parameters such as economics, health, and innovation in urban resilience assessment of uncertain quality and significance [39]. Defining resilience indicators within the practice of resilience assessment is the first step in measuring. Here, we quantified the impacts of external environment on the system as urban disaster severity D, the ability to represent the resilience of building blocks in the CAS theory as bearing capacity B, and learnability L, and the properties of the internal model in the face of system disturbance as exposure E and recuperability R, as shown in Figure 3.
3.2. Urban Resilience Assessment Index
The urban system exhibits distinctive attributes of structure, function, and inter-regional connectivity through the intricate interplay and interaction among human beings, economy, resources, and the environment. Urban resilience, regarded as a multifaceted and evolving aspect of security, is influenced by both internal and external factors associated with the urban system [40]. Considering the intricate non-linear relationships within the CAS theory and the profound philosophical realism assumptions that underlie measurement theory, much like the realm of physics, an undeniable verity emerges: even in the absence of instrumentation, the numerical expression of urban resilience persists in some form or another [41,42]. Building high-quality models that incorporate explanatory and predictive constructs based on CAS theory should lead to more targeted management of measurements [43]. The five influencing factors of disaster severity, exposure, bearing capacity, recuperability, and learnability embody the complete mechanism of urban resilience, while coinciding with the theory of urban system as a complex adaptive system. To simulate the adaptive behavior of cities in the face of risks and enhance the comprehensiveness of resilience factors, this paper refines the elements proposed in the complex systems theory models. In the context of this study, we have the opportunity to incorporate Hooke’s law of physics in resilience researches, thereby endowing urban systems with the characteristics of an elastic body [41,44]. This approach enables the simplification of the intricate non-linear constitutive relationships found in the real world into a linear framework. When facing disaster disruptions, cities exhibit certain capacities for disaster prevention, relief, and learning, as evidenced by the analysis of their disaster response [45]. Hence, we can deduce that the value of urban resilience is directly proportional to bearing capacity B, recuperability R, and learnability L, while inversely proportional to disaster severity D and exposure E. Based on the aforementioned discourse, we have constructed a model for assessing urban resilience:
where IUR denotes the initial value of urban resilience; D, E, B, R, and L denote, respectively, the urban disaster severity, exposure, bearing capacity, recuperability, and learnability. The definition of the symbols appearing below are defined in Table 1. To eliminate the influence of different magnitudes on the evaluation indices, subsequent equations were made dimensionless.

Table 1.
Definition of symbols in resilience assessment.
Disaster severity refers to the probability of damage or loss the natural disasters may cause to the cities. Disaster events can be divided into natural and technical disasters. Due to the unique disaster environments of each city, employing the C expenditure on disaster management to quantify the severity of disasters in comprehensive resilience assessments proves to be more universally applicable. We used the expenditure ED of urban expenditure on disaster management to characterize disaster severity D. ED is an available dataset.
According to the definition provided by the United Nations International Strategy for Disaster Reduction (UNISDR), “exposure” is individuals, assets, systems, or other components that are located in hazard-prone areas and are susceptible to damage [46]. The measurement of exposure elements can be quantified by the number of people or types of assets in a particular area. The higher the urban exposure, the higher the urban system risk under the same hazard intensity. The population densities and were used to characterize the urban exposure E:
The bearing capacity is the ability to ensure the security of a city and the efficiency of evacuation of people during natural disasters and can be composed of two parts: the amount of urban public safety input DPI, which can characterize the city’s disaster preparedness; and the proportion of urban cell phone subscribers MPS, which can characterize the early warning capacity, and which can better represent the resilience of urban facilities and people to characterize urban bearing capacity B:
Recuperability refers to the ability of urban systems to return to a normal functioning state through self-regulation after a disaster. The urban population health insurance ratio MIP and per capita gross domestic product PCG can visualize the recuperability R of cities after an unexpected disaster:
Learnability is the experience-based response performance of an urban system to the impacts of a disaster. Learnability of a city is mainly related to the educational level of population. Therefore, the learnability L is characterized by the proportion of urban population with higher education HEP. HEP is an available dataset where the numerical value is derived by dividing the population of highly educated individuals by the total population of the city.
Based on the collected data, the values of disaster severity D, exposure E, bearing capacity B, recuperability R, learnability L, and resilience value IUR were calculated for all cities considered in the study. In order to decrease the dispersion of values and facilitate the elastic grading process in resilience assessment and disaster loss evaluation, a transformation function is commonly utilized to convert resilience values into normalized numeric values, denoted as EUR [47,48]:
3.3. Spatial Autocorrelation Analysis
Spatial autocorrelation was used here to evaluate the spatial agglomeration, showing spatial patterns of urban resilience [49]. The resilience correlation of neighboring geographical units was calculated using Moran I [50]:
where is the variance of sample data, m is the total number of cities within a specific agglomeration, and are the resilience of city k and that of city k1, is the mean of elasticities, and is the spatial adjacency matrix, where = 1 when cities k and k1 are adjacent, otherwise, = 0.
4. Results
4.1. Resilience Assessment
The values of disaster severity D, exposure E, bearing capacity B, recuperability R, learnability L, initial value of urban resilience IUR and normalized value of urban resilience EUR for each city are shown in Supplementary Table S2. The level of urban resilience and relevant drivers were graded using the Jenks natural breaks algorithm. Under the condition of determining the number of levels, this method iteratively calculates data breakpoints between classes to achieve the most suitable grouping for similar values in the data [51]. Jenks natural breaks algorithm effectively preserves the statistical characteristics of the data.
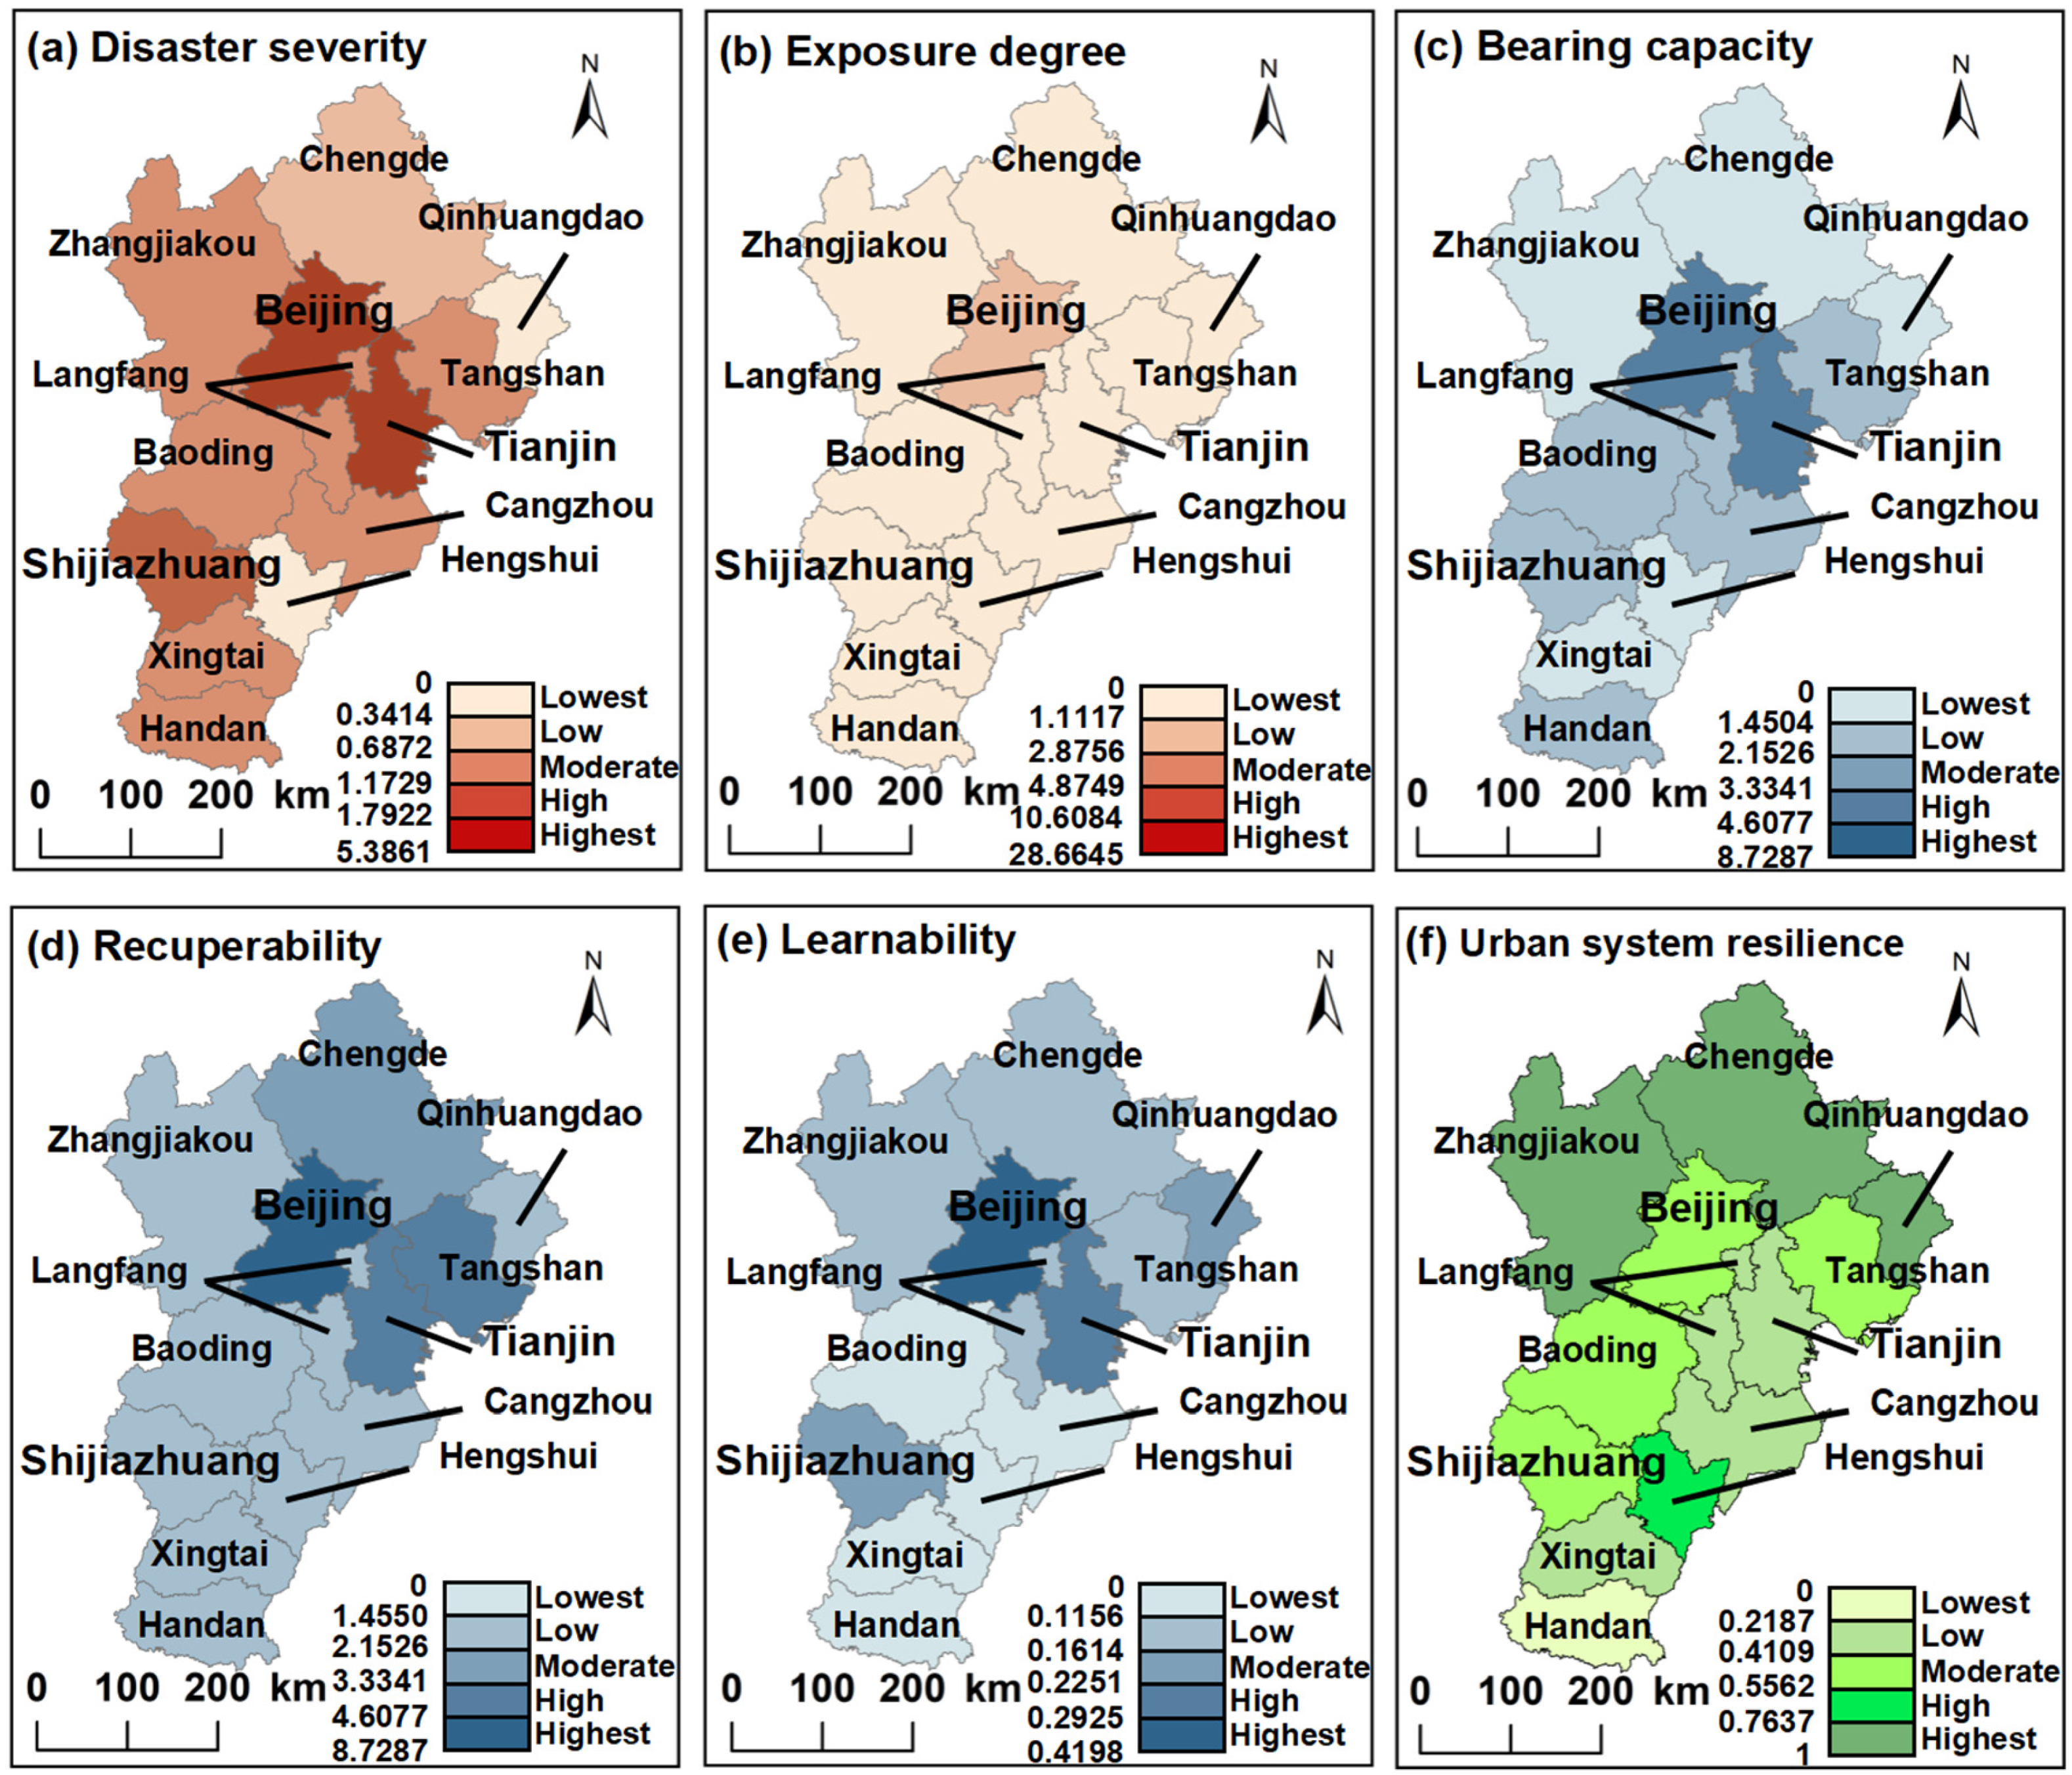
The average comprehensive resilience value for the BTH urban agglomeration is 0.5331. Overall, the urban resilience level of the BTH urban agglomeration was high in the north and low in the south. Figure 4 shows the highest resilience in Zhangjiakou, Chengde, and Qinhuangdao in the northern part of BTH, while moderate resilience was found in Beijing, Baoding, and Tangshan in the central part, and low resilience was observed in Xingtai and Handan in the southern part. This was also related to the functional positioning of BTH as an “ecological environment dominant area” in North China, where the resilient northern part of the agglomeration has high forest and grassland coverage, and ecological land use is dominant and population density is low, so they have lower disaster exposure and show better resilience [52]. In contrast, BTH urban agglomeration has been gradually densely populated from north to south, and the urbanization of the region has been gradually increasing. Especially, the central cities of Beijing, Tianjin, Langfang, and Baoding play a critical role in regional socio-economic development. Therefore, these cities have higher resistance and resilience, however, exposure of these cities to disasters is still high and the urban resilience is not yet acceptable [53].The cities in south BTH, such as Xingtai and Handan, have been experiencing rapid urbanization in recent years with higher population densities, hence, the level of social security and education of population is relatively low compared to other cities, so the resilience level is not high yet [54,55]. Furthermore, in the surrounding region, the cities of Beijing and Tianjin exhibit a remarkable capacity to radiate and contribute to the construction and advancement of resilient urban centers. However, Shijiazhuang, while being a core city in the area and serving as the capital of Hebei province, experiences limitations in terms of its connectivity to the neighboring regions. This is primarily due to its comparatively lower levels of economic development and population density when compared to the vibrant dynamics of Beijing and Tianjin [56].
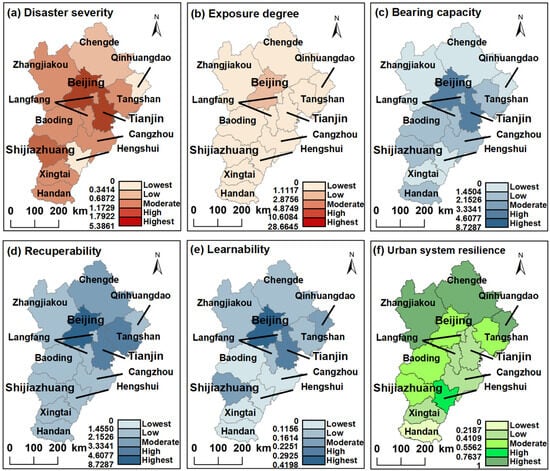
Figure 4.
Spatial pattern of the prime drivers and urban resilience levels over the BTH urban agglomeration.
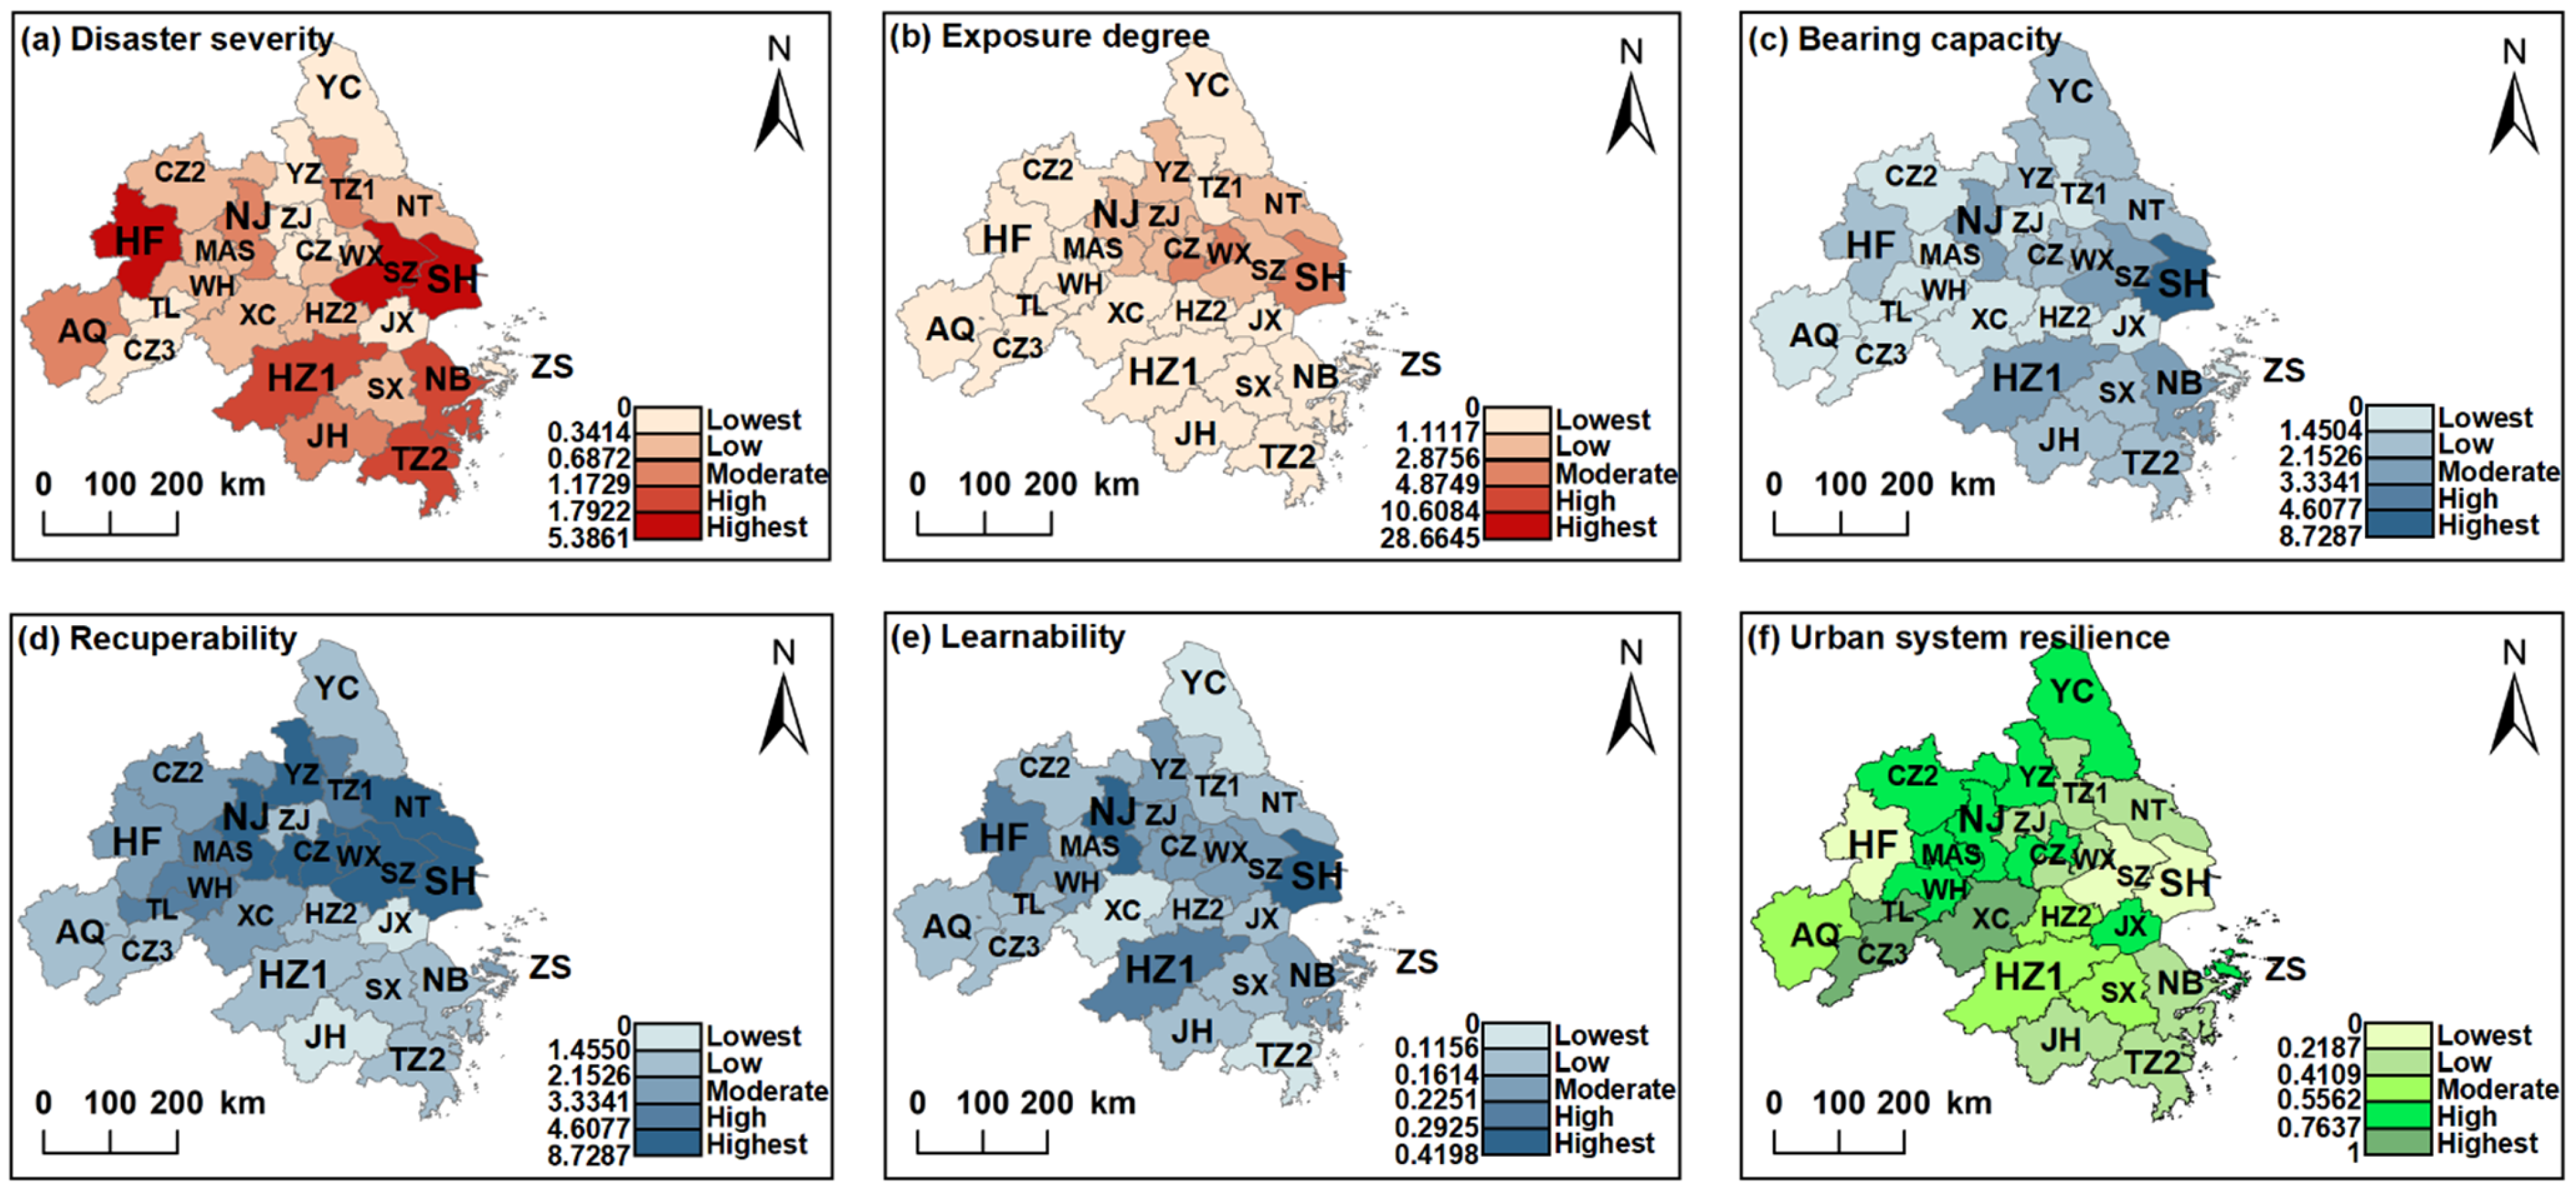
The average comprehensive resilience value for YRD urban agglomeration is 0.5116. The urban resilience level of YRD urban agglomeration was higher in the northwest and lower in the southeast. Figure 5 shows significantly higher urban resilience of YRD in Yan-cheng, Chizhou, Nanjing, and Tongling, the cities in the northwest, than in Jinhua, Ningbo and Taizhou, the cities in the southeast. Attributing to this is that the cities in the northwest of the YRD are less densely populated and economically developed with relatively low disaster exposure while the coastal cities in the southeast have ports and labor-intensive enterprises with higher disaster exposure [4]. Moreover, cities in the southeast are dominated by rivers, lakes, and low-lying and flat topography, rendering them vulnerable to natural disasters, such as floods, typhoons, and storm surges, and, therefore, the disaster severity is high [57]. Because of the high degree of economic development of these cities in the southeastern part of YRD, the coastal export trade and manufacturing industries are more developed, attracting a large number of employed people, who have a lower proportion of higher education, and, thus, the learnability of the cities is lower [58,59]. YRD is a massive urban agglomeration in China, being characterized by disproportionate inter-city development [7]. The level of resistance exhibited by Shanghai, Jiangsu, and Zhejiang provinces surpasses that of Anhui province, underscoring the need to bolster disaster prevention and mitigation efforts in Anhui. In comparison, the resilience levels of Shanghai and Jiangsu Province outshine those of the remaining two provinces in general. Besides, the learnability of Shanghai, Nanjing, Hangzhou, and Hefei in the YRD urban agglomeration was higher, showing an obvious siphon effect, which, in disguise, hindered the development of the learnability of other surrounding cities [60].
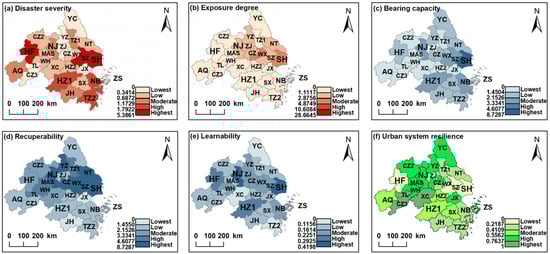
Figure 5.
Spatial pattern of prime drivers and urban resilience levels over the Yangtze River Delta (YRD) urban agglomeration. SH: Shanghai; NJ: Nanjing; WX: Wuxi; CZ: Changzhou; SZ: Suzhou; NT: Nantong; YC: Yancheng; YZ: Yangzhou; ZJ: Zhenjiang; TZ1: Taizhou; HZ1: Hangzhou; NB: Ningbo; JX: Jiaxing; HZ2: Huzhou; SX: Shaoxing; JH: Jinhua; ZS: Zhoushan; TZ2: Taizhou; HF: Hefei; WH: Wuhu; MAS: Maanshan; TL: Tongling; AQ: Anqing; CZ1: Chuzhou; CZ2: Chizhou; XC: Xuancheng.
The average comprehensive resilience value for the GHMB urban agglomeration is 0.4612. The resilience level of the GHMB urban agglomeration showed high values in the east and west, and low values in the central part. Figure 6 indicates no obvious spatial patterns of resilience of GHMB. The resilience levels of Zhaoqing and Jiangmen in the west and Huizhou in the east were higher due to larger administrative areas, and smaller population density and economic density than other cities, and lower levels of disaster risk and urban exposure (Figure 6). Guangzhou, Shenzhen, Dongguan, Foshan, and other cities have higher urbanization levels, high population density and economic density, high urban disaster severity and disaster exposure levels, and more developed transportation networks between cities, so the resilience levels of these cities were similar [61]. In contrast, both Hong Kong and Macau stand out as highly developed economic hubs, boasting robust social security systems and substantial investments in disaster prevention measures. As a result, they experience a significantly lower degree of risk from natural calamities, including floods [62]. It can be seen from Figure 6 that the administrative size of Macau is too small, resulting in significantly high disaster exposure. Hong Kong had a higher resilience level while Macau had a lower resilience level. GHMB includes two special administrative regions and one special economic zone, playing a key role in export-oriented economy [63]. Moreover, among the four core cities in the region, the city network formed by Guangzhou and Shenzhen as the center has high synergy, while Hong Kong and Macau, as special administrative regions of China, have different social systems and immigration restrictions leading to their limited connections with surrounding cities. Therefore, regional integration of GHMB needs to be pushed forward to enhance its resilience.
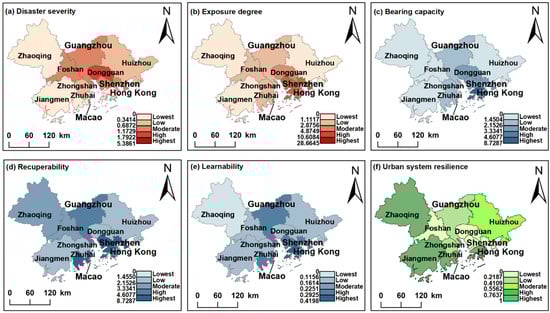
Figure 6.
Spatial pattern of prime drivers and urban resilience levels over the Guangdong-–Hong Kong-–Macao Greater Bay Area (GHMB) urban agglomeration.
4.2. Resilience Enhancement Strategy
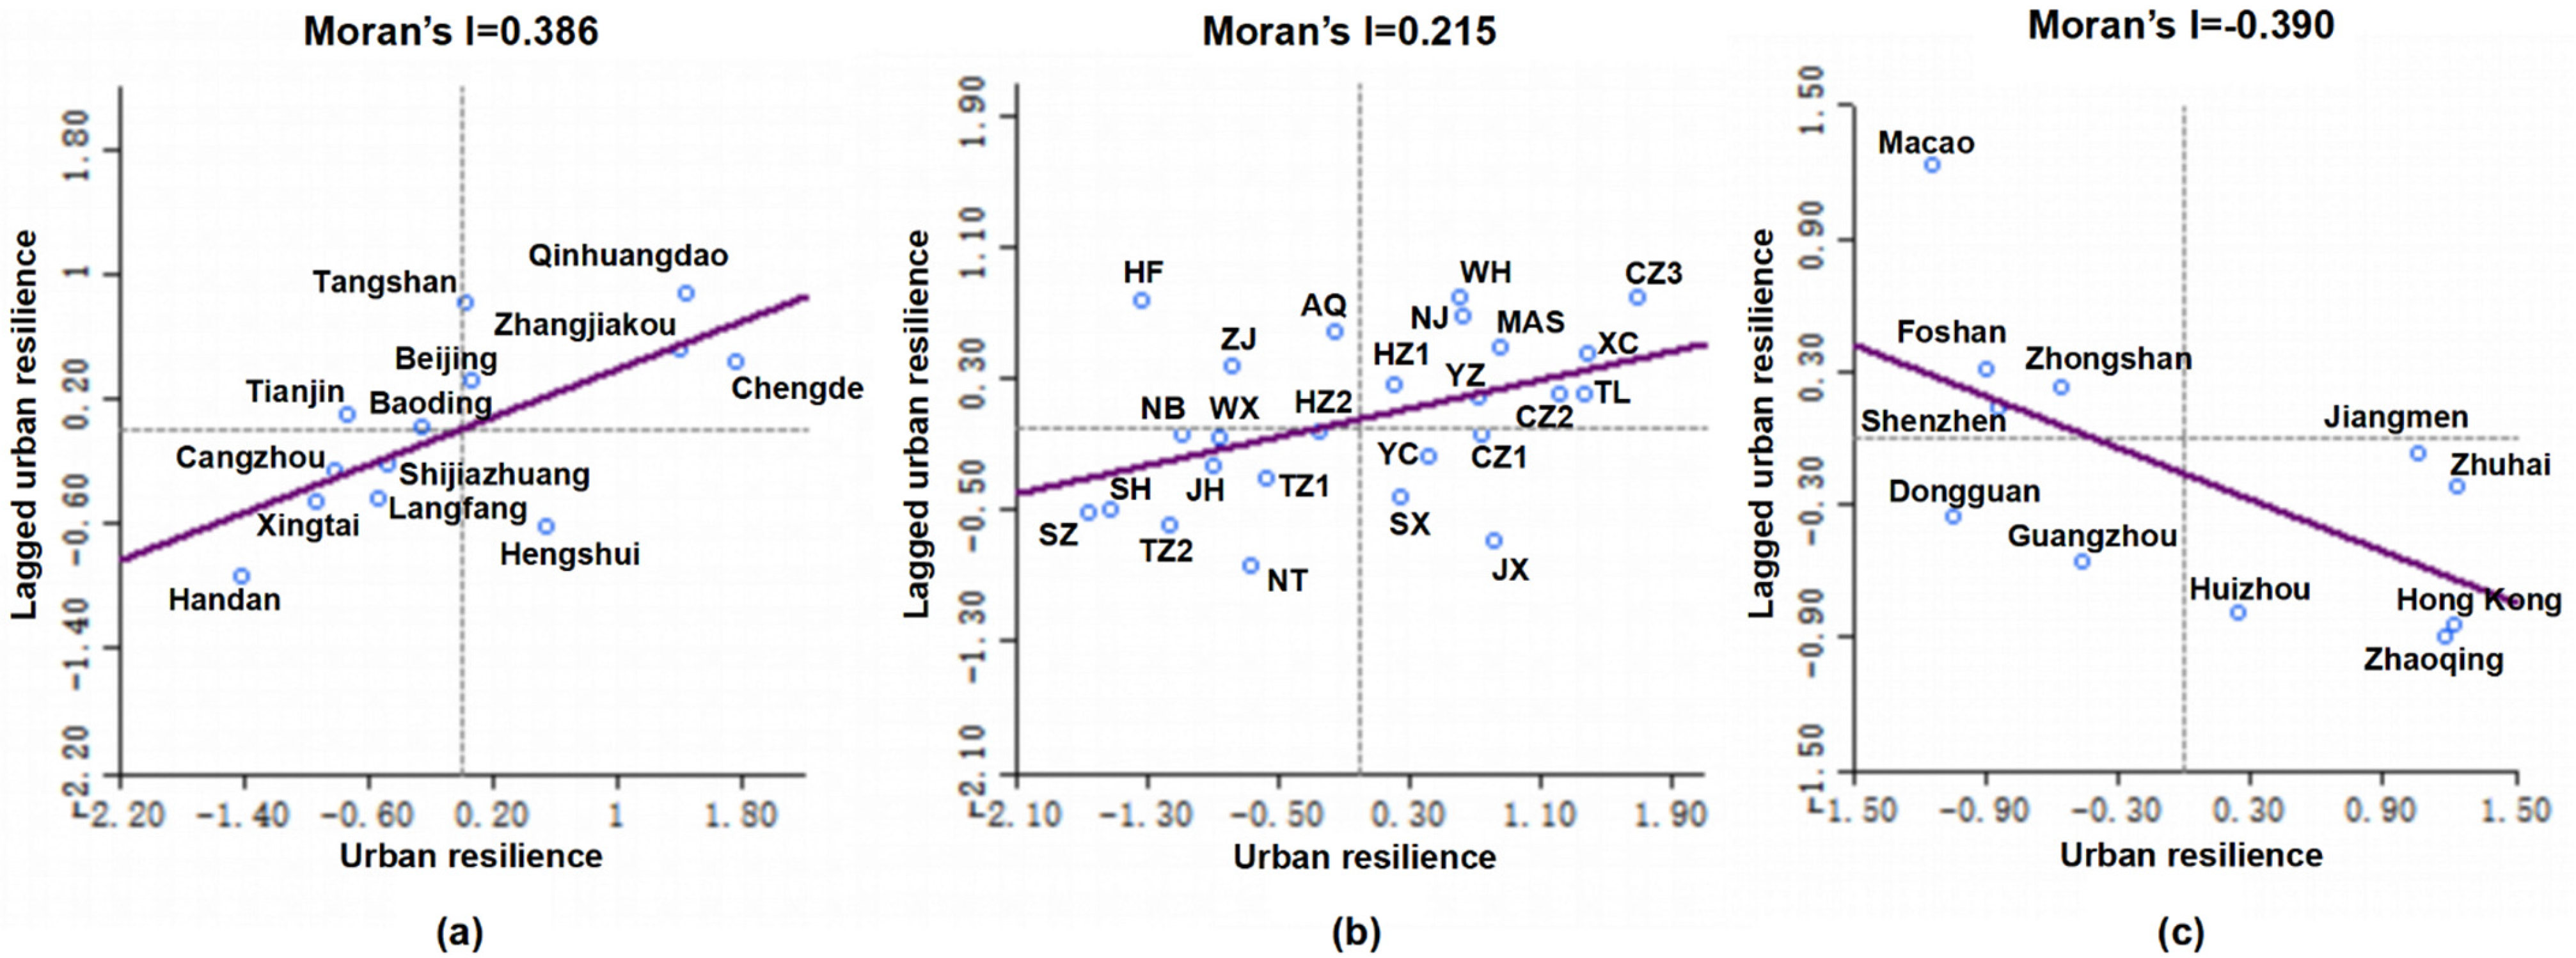
According to Supplementary Table S2 and Equations (6) and (7), the spatial autocorrelation of resilience of the three major urban agglomerations using Moran’s I and GeoDa software v1.20 was determined as shown in Figure 7. It can be seen that the resilience levels of BTH and YRD were spatially positively correlated, while the resilience of GHMB was spatially negatively correlated. According to Moran’s I, urban resilience was divided into four spatial correlation patterns: four types of diffusion effect zones (HH), transition zones (LH), low-resilience zones (LL), and polarization effect zones (HL) [64]. (1) Diffusion effect area (HH): The “high–high” agglomeration type indicates that the observed area and the surrounding areas are relatively high in resilience, showing a significant positive correlation and the spatial association is manifested as the diffusion effect; (2): transition zone (LH): the “low–high” agglomeration type indicates that the observed area has low resilience, but the surrounding area has relatively high resilience, showing a negative correlation and the spatial correlation is manifested as a transition zone; (3) low-resilience zone (LL): the “low–low” agglomeration type indicates that the resilience of both the observed area and the surrounding areas is relatively low, showing positive correlation and the spatial correlation is expressed as a low-level region; and (4) polarization effect area (HL): the “high–low” agglomeration type indicates that the observed area has high resilience, but the surrounding area has low resilience, showing a negative correlation and the spatial correlation shows a polarization effect.
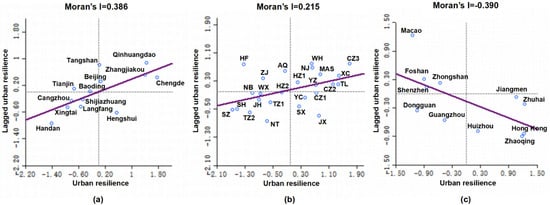
Figure 7.
Resilience Moran’s I of three major urban agglomerations: (a) the Beijing-–Tianjin-–Hebei urban agglomeration, (b) the Yangtze River Delta urban agglomeration, and (c) the Guangdong-–Hong Kong-–Macao Greater Bay Area urban agglomeration. SH: Shanghai; NJ: Nanjing; WX: Wuxi; CZ1: Changzhou; SZ: Suzhou; NT: Nantong; YC: Yancheng; YZ: Yangzhou; ZJ: Zhenjiang; TZ1: Taizhou; HZ1: Hangzhou; NB: Ningbo; JX: Jiaxing; HZ2: Huzhou; SX: Shaoxing; JH: Jinhua; TZ2: Taizhou; HF: Hefei; WH: Wuhu; MAS: Maanshan; TL: Tongling; AQ: Anqing; CZ1: Chuzhou; CZ2: Chizhou; XC: Xuancheng.
Beijing, Zhangjiakou, Qinhuangdao, and Tangshan in the BTH urban agglomeration showed significant diffusion effects, radiating and driving up the resilience level of the surrounding areas, while most of the other cities in BTH were in the transition zone and low-resilience zone. It can be seen from Figure 4 that low-resilience cities of BTH were clustered in the south. From the perspective of resilience enhancement, Beijing, Tianjin, and Shijiazhuang all had the potential to drive up the resilience of BTH. Currently, Shijiazhuang, as the capital city of the province, has limited resilience to disasters driving surrounding cities, and the difference in resilience between the southern and northern cities was significant, which requires proactive enhancement of a collaborative resilience development strategy [53]. Some environmental issues, such as air and water pollution, exist within BTH, requiring in-depth pollution prevention, control, and management [65]. BTH, as a region with a high probability of earthquakes, should attract considerable attention for earthquake prevention [66]. It should promote the rational layout of communication infrastructure and the simultaneous investment of disaster prevention funds to achieve a region-wide coverage of efficient communication networks and a unified emergency management mechanism [67]. Meanwhile, we should strengthen policy support for Hebei, and promote the rapid flow of capital, technology, education resources, medical resources, and other elements within the urban agglomeration, and enhance the ability to resist risks through effective regional co-operation [68].
Several cities in YRD are in the diffusion effect area, and these cities are mainly located in the western part. The regional resilience around Hefei, Anqing, and Zhenjiang was relatively high, but their own resilience was low, and they were in a transitional state of being driven by neighboring cities. Shanghai, Suzhou, and other cities are in the low developing area and have formed a low-resilience sub-city network with spatial correlation. Yancheng, Changzhou, Shaoxing, and Jinhua were more resilient, but their influence on the surrounding cities was limited. YRD is in the lower reaches of the Yangtze River basin, which is a key area for flooding, and the entire urban agglomeration should have a co-ordinated comprehensive management of water systems to improve the cross-regional water allocation pattern. The YRD urban agglomeration should develop a reasonable plan according to the type of disaster and further strengthen the construction of human defense projects and infrastructure in response to the characteristics of Shanghai, Suzhou, and other cities with high population density and high economic density [69]. YRD has also made efforts to improve urban resilience by developing policies to eliminate uneven urban economic development [70].
The poor spatial correlation of resilience levels in the GHMB urban agglomeration was related to the special location and political environment of the urban agglomeration. Six cities, including Shenzhen and Macau, were in the transition zone and low-resilience zone. Hong Kong, Zhuhai, Huizhou, Zhaoqing, and Jiangmen were located in the “high–low” agglomeration siphon effect area, and the spatial pattern was obviously unbalanced [7]. The GHMB undergoes intensifying hydrometeorological extremes and geological disasters such as floods, typhoons, heat waves, ground subsidence, and other disasters, so it should rely on the natural geographical pattern to reasonably avoid disaster risks from the perspective of urban planning [71]. Moreover, the economic development level in the eastern part of GHMB is higher than that in the western part, so the spatial structure of GHMB should be promoted in a polycentric direction, to reduce the disaster exposure of low-resilience cities, and comprehensively improve the resistance and resilience of cities in the face of disasters [72]. From a governance perspective, the process of regional resilience enhancement provids an important opportunity to establish a co-ordination mechanism across administrative regions. The central government can determine resilient urban planning of GHMB through legislation to achieve efficient allocation of resources and guarantee the steady improvement of the overall resilience of urban agglomerations [63].
5. Discussion
Urban agglomerations are complex multidimensional systems, requiring the co-ordination of their internal components and subsystems to maintain the functioning of cities. Resilience plays a crucial role in urban management, helping urban agglomerations to mitigate various risks. This paper establishes a resilience assessment index based on disaster severity, exposure, bearing capacity, recuperability, and learnability to assess the resilience of 50 cities in three urban agglomerations, which can provide guiding recommendations for government administrators.
In terms of theoretical contributions, this study constructs a framework of urban agglomeration resilience based on complex systems theory, and proposes five important dimensions of integrated urban agglomeration resilience. In previous studies, different regions must use different evaluation indexes for different hazards to describe a city’s disaster severity [73,74,75,76,77]. In contrast, this study used expenditure of urban disaster relief, recovery, and reconstruction and emergency management to characterize disaster severity, rendering the data easier to access and calculate. In the realm of research dimensions, previous studies have primarily concentrated on aspects such as the economy, society, institutions, environment, and infrastructure [78,79]. Assessing urban resilience in terms of these dimensions is challenging for cities with different characteristics. From the perspective of evaluating urban resilience of complex systems, the introduction of indicators such as learnability and recuperability can enhance the applicability of the resilience assessment framework [80,81]. We also analyzed the reasons for the spatial heterogeneity in different urban agglomerations based on the results of assessment, which further improves our understanding of the systematic differences in urban agglomerations.
In terms of resilience assessment results and resilience enhancement strategies, we find that even within the same urban agglomeration, differences in conditions such as geographic location, population distribution, and administrative status can lead to unbalanced development of resilience [82]. According to the results above, resilient cities with radiation function, such as Beijing, should pursue the diffusion effect to deliver talents, capital, and other resources to the whole urban agglomeration, which can improve the comprehensive resilience of the urban agglomeration. And the key point of urban resilience improvement has shifted from explicit factors such as economy and population to implicit factors such as education and technology. Similar conclusions have been found in other studies [21,83]. Enhancing the collaborative development of public services in urban agglomerations can also accelerate the integration between core cities and neighboring cities, thereby improving the co-ordinated resilience of urban agglomerations [84].
In this study, it is important to note that experimental controls were not included. The basis of comparison for evaluating urban resilience in China’s three major urban agglomerations was determined based on the developed model for measuring disaster severity, exposure, bearing capacity, recuperability, and learnability. The assertions of differences in urban resilience levels among these agglomerations are justified by analyzing the spatial autocorrelation patterns and considering the differences in geographic location, climate changes, underlying features, and industrial structure. This study, though it possesses certain limitations, could be enhanced by integrating experimental controls to further authenticate and fortify the findings. The conceptualization of urban resilience utilized in this research primarily pertains to the overarching resilience demonstrated by China’s urban agglomerations. Subsequent studies can be approached from two vantage points. Firstly, an examination of the distribution of urban agglomeration resilience can be explored through the lens of county-level administrative regions. Secondly, a focused investigation into the resilience of distinct urban agglomerations in the face of diverse disasters can be undertaken.
6. Conclusions
We developed a comprehensive resilience assessment model for cities using the complex adaptive systems model. Using this model, we analyzed the resilience levels and drivers of three major urban agglomerations in China. We obtained the following findings:
- (1)
- The average urban resilience value of the three major urban agglomerations in China was 0.5061. Among them, BTH had the highest resilience level at 0.5331, followed by YRD at 0.5116, and GHMB at 0.4612. The results indicate significant regional variations in urban resilience across different cities. To address the deficiencies in some cities within an agglomeration, urban planning should consider specific disaster situations, allocate resources effectively, and enhance disaster prevention awareness among the population;
- (2)
- The resilience levels of cities within the BTH urban agglomeration vary among the northern, central, and southern regions. The cities in the northern part, benefiting from Hebei province’s role as an “ecological environment support area”, exhibit a higher level of resilience. However, the densely populated and economically developed cities in the agglomeration face greater vulnerability;
- (3)
- In the YRD urban agglomeration, the resilience levels of cities in the northwest surpass those in the southeast. The southeast cities, with their abundance of rivers and lakes, are more susceptible to the impact of natural disasters, thereby exhibiting a lower learnability;
- (4)
- The cities in the east and west of the GHMB urban agglomeration demonstrate higher levels of resilience. Augmenting regional resilience presents a unique chance to forge a harmonious mechanism encompassing administrative boundaries. Legislative endeavors can shape resilient urban planning and optimize resource allocation, ultimately culminating in a holistic transformation of urban agglomerations.
Supplementary Materials
The following supporting information can be downloaded at: https://www.mdpi.com/article/10.3390/su151914537/s1, Table S1. Sources of data; Table S2. Parameters of urban resilience model.
Author Contributions
Conceptualization, Q.Z.; Methodology, C.H.; Validation, S.C.; Resources, V.P.S.; Writing—original draft, C.H.; Writing—review & editing, Q.Z., G.W. and T.L. All authors have read and agreed to the published version of the manuscript.
Funding
This research was funded by the China National Key R&D Program, grant number 2019YFA0606900.
Institutional Review Board Statement
Not applicable.
Informed Consent Statement
Not applicable.
Data Availability Statement
Not applicable.
Acknowledgments
Our cordial gratitude will be extended to the editors and anonymous reviewers for their invaluable insights and assistance in this article. Their guidance and feedback have significantly enhanced the quality and impact of this work.
Conflicts of Interest
The authors declare no conflict of interest.
References
- McCarthy, M.P.; Best, M.J.; Betts, R.A. Climate change in cities due to global warming and urban effects. Geophys. Res. Lett. 2010, 37. [Google Scholar] [CrossRef]
- Wang, G.; Zhang, Q.; Yu, H.Q.; Shen, Z.X.; Sun, P. Double increase in precipitation extremes across China in a 1.5 °C/2.0 °C warmer climate. Sci. Total. Environ. 2020, 746, 140807. [Google Scholar] [CrossRef]
- Wang, G.; Zhang, Q.; Luo, M.; Singh, V.P.; Xu, C.-Y. Fractional contribution of global warming and regional urbanization to intensifying regional heatwaves across Eurasia. Clim. Dyn. 2022, 59, 1521–1537. [Google Scholar] [CrossRef]
- Xue, Q.R.; Yang, X.H.; Wu, F.F. A three-stage hybrid model for the regional assessment, spatial pattern analysis and source apportionment of the land resources comprehensive supporting capacity in the Yangtze River Delta urban agglomeration. Sci. Total. Environ. 2020, 711, 134428. [Google Scholar] [CrossRef] [PubMed]
- Jabareen, Y. Planning the resilient city: Concepts and strategies for coping with climate change and environmental risk. Cities 2013, 31, 220–229. [Google Scholar] [CrossRef]
- Birhanu, Z.; Ambelu, A.; Berhanu, N.; Tesfaye, A.; Woldemichael, K. Understanding Resilience Dimensions and Adaptive Strategies to the Impact of Recurrent Droughts in Borana Zone, Oromia Region, Ethiopia: A Grounded Theory Approach. Int. J. Environ. Res. Public Health 2017, 14, 118. [Google Scholar] [CrossRef] [PubMed]
- Lu, H.; Lu, X.; Jiao, L.; Zhang, Y. Evaluating urban agglomeration resilience to disaster in the Yangtze Delta city group in China. Sustain. Cities Soc. 2021, 76, 103464. [Google Scholar] [CrossRef]
- Huang, G.Y.; Li, D.Z.; Zhu, X.W.; Zhu, J. Influencing factors and their influencing mechanisms on urban resilience in China. Sustain. Cities Soc. 2021, 74, 103210. [Google Scholar] [CrossRef]
- Zhou, H.; Wang, J.A.; Wan, J.; Jia, H. Resilience to natural hazards: A geographic perspective. Nat. Hazards 2009, 53, 21–41. [Google Scholar] [CrossRef]
- Holling, C.S. Resilience and stability of ecological systems. Annu. Rev. Ecol. Syst. 1973, 4, 1–23. [Google Scholar] [CrossRef]
- Lu, P.; Stead, D. Understanding the notion of resilience in spatial planning: A case study of Rotterdam, The Netherlands. Cities 2013, 35, 200–212. [Google Scholar] [CrossRef]
- Alberti, M.; Marzluff, J.M.; Shulenberger, E.; Bradley, G.; Ryan, C.; Zumbrunnen, C. Integrating humans into ecology: Opportunities and challenges for studying urban ecosystems. BioScience 2003, 53, 1169–1179. [Google Scholar] [CrossRef]
- Godschalk, D.R. Urban Hazard Mitigation: Creating Resilient Cities. Nat. Hazards Rev. 2003, 4, 136–143. [Google Scholar] [CrossRef]
- Pickett, S.T.A.; Cadenasso, M.L.; Grove, J.M. Resilient cities: Meaning, models, and metaphor for integrating the ecological, socio-economic, and planning realms. Landsc. Urban Plan. 2004, 69, 369–384. [Google Scholar] [CrossRef]
- Wardekker, J.A.; de Jong, A.; Knoop, J.M.; van der Sluijs, J.P. Operationalising a resilience approach to adapting an urban delta to uncertain climate changes. Technol. Forecast. Soc. Change 2010, 77, 987–998. [Google Scholar] [CrossRef]
- Meerow, S.; Newell, J.P.; Stults, M. Defining urban resilience: A review. Landsc. Urban Plan. 2016, 147, 38–49. [Google Scholar] [CrossRef]
- Kim, D.; Lim, U. Urban Resilience in Climate Change Adaptation: A Conceptual Framework. Sustainability 2016, 8, 405. [Google Scholar] [CrossRef]
- Ribeiro, P.J.G.; Goncalves, L. Urban resilience: A conceptual framework. Sustain. Cities Soc. 2019, 50, 101625. [Google Scholar] [CrossRef]
- Zheng, Y.; Xie, X.-L.; Lin, C.-Z.; Wang, M.; He, X.-J. Development as adaptation: Framing and measuring urban resilience in Beijing. Adv. Clim. Chang. Res. 2018, 9, 234–242. [Google Scholar] [CrossRef]
- Dong, X.J.; Shi, T.; Zhang, W.; Zhou, Q. Temporal and Spatial Differences in the Resilience of Smart Cities and Their Influencing Factors: Evidence from Non-Provincial Cities in China. Sustainability 2020, 12, 1321. [Google Scholar] [CrossRef]
- Wang, H.; Liu, Z.; Zhou, Y. Assessing urban resilience in China from the perspective of socioeconomic and ecological sustainability. Environ. Impact Assess. Rev. 2023, 102, 107163. [Google Scholar] [CrossRef]
- Shi, Y.; Zhai, G.; Xu, L.; Zhou, S.; Lu, Y.; Liu, H.; Huang, W. Assessment methods of urban system resilience: From the perspective of complex adaptive system theory. Cities 2021, 112, 103141. [Google Scholar] [CrossRef]
- Fang, C.L.; Yu, D.L. Urban agglomeration: An evolving concept of an emerging phenomenon. Landsc. Urban Plan. 2017, 162, 126–136. [Google Scholar] [CrossRef]
- Huang, J.; Sun, Z.; Du, M. Differences and Drivers of Urban Resilience in Eight Major Urban Agglomerations: Evidence from China. Land 2022, 11, 1470. [Google Scholar] [CrossRef]
- Levin, S.; Xepapadeas, T.; Crépin, A.-S.; Norberg, J.; de Zeeuw, A.; Folke, C.; Hughes, T.; Arrow, K.; Barrett, S.; Daily, G.; et al. Social-ecological systems as complex adaptive systems: Modeling and policy implications. Environ. Dev. Econ. 2012, 18, 111–132. [Google Scholar] [CrossRef]
- Grimm, V.; Revilla, E.; Berger, U.; Jeltsch, F.; Mooij, W.M.; Railsback, S.F.; Thulke, H.H.; Weiner, J.; Wiegand, T.; DeAngelis, D.L. Pattern-oriented modeling of agent-based complex systems: Lessons from ecology. Science 2005, 310, 987–991. [Google Scholar] [CrossRef]
- Wu, J. Urban ecology and sustainability: The state-of-the-science and future directions. Landsc. Urban Plan. 2014, 125, 209–221. [Google Scholar] [CrossRef]
- Li, H.B.; Jin, X.B.; Liu, J.; Feng, D.Y.; Xu, W.Y.; Zhou, Y.K. Analytical framework for integrating resources, morphology, and function of rural system resilience-An empirical study of 386 villages. J. Clean. Prod. 2022, 365, 132738. [Google Scholar] [CrossRef]
- Shi, Y.; Zhai, G.; Zhou, S.; Lu, Y.; Chen, W.; Deng, J. How Can Cities Respond to Flood Disaster Risks under Multi-Scenario Simulation? A Case Study of Xiamen, China. Int. J. Environ. Res. Public Health 2019, 16, 618. [Google Scholar] [CrossRef] [PubMed]
- Zhang, Q.; Wu, Z.X.; Yu, H.Q.; Zhu, X.D.; Shen, Z.X. Variable Urbanization Warming Effects across Metropolitans of China and Relevant Driving Factors. Remote Sens. 2020, 12, 1500. [Google Scholar] [CrossRef]
- Shao, Y.; Wu, J.; Ye, J.; Liu, Y. Frequency analysis and its spatiotemporal characteristics of precipitation extreme events in China during 1951–2010. Theor. Appl. Climatol. 2015, 121, 775–787. [Google Scholar] [CrossRef]
- Wang, S.; Song, Y.; Feng, Z.; Jiang, L. Pattern and Progress of Large Urban Agglomerations and Urban Flows Intensity in Northeast China. Sci. Geogr. Sin. 2011, 31, 287–294. [Google Scholar]
- Qiu, B. Methods and Principles of Designing Resilient City Based on Complex Adaptive System Theory. Urban Stud. 2018, 25, 1–3. [Google Scholar]
- Jia, Y.G.; Zhang, B.; Zhang, Y.Z.; Tang, M.; Ma, B.; Wang, G.; Liu, X.; Luo, Z. Effect of Urbanization on Spatial and Temporal Variation of Extreme Temperature Events in the Yangtze River Delta. J. Nat. Resour. 2017, 32, 814–828. [Google Scholar]
- Xu, Q.; Dong, Y.-X.; Yang, R. Urbanization impact on carbon emissions in the Pearl River Delta region: Kuznets curve relationships. J. Clean. Prod. 2018, 180, 514–523. [Google Scholar] [CrossRef]
- Schlüter, M.; Haider, L.J.; Lade, S.J.; Lindkvist, E.; Martin, R.; Orach, K.; Wijermans, N.; Folke, C. Capturing emergent phenomena in social-ecological systems: An analytical framework. Ecol. Soc. 2019, 24, 1–26. [Google Scholar] [CrossRef]
- Andrew, A.M. Systems: An Introductory Analysis with Applications to Biology, Control, and Artificial Intelligence, by John H. Holland MIT Press (Bradford Books), Cambridge, Mass., 1992, xiv + 211 pp. (Paperback £13.50, cloth £26.95). Robotica 1993, 11, 489. [Google Scholar] [CrossRef]
- Braverman, M.; Moitra, A. An information complexity approach to extended formulations. In Proceedings of the ACM Symposium on Theory of Computing, Palo Alto, CA, USA, 1–4 June 2013; p. 161. [Google Scholar]
- Fisher, W.P. Invariance and traceability for measures of human, social, and natural capital: Theory and application. Measurement 2009, 42, 1278–1287. [Google Scholar] [CrossRef]
- Yi, P.T.; Wang, S.N.; Li, W.W.; Dong, Q.K. Urban resilience assessment based on “window” data: The case of three major urban agglomerations in China. Int. J. Disaster Risk Reduct. 2023, 85, 103528. [Google Scholar] [CrossRef]
- Cano, S.J.; Vosk, T.; Pendrill, L.R.; Stenner, A.J. On Trial: The Compatibility of Measurement in the Physical and Social Sciences. J. Physics Conf. Ser. 2016, 772, 012025. [Google Scholar] [CrossRef]
- Tong, P. Characteristics, dimensions and methods of current assessment for urban resilience to climate-related disasters: A systematic review of the literature. Int. J. Disaster Risk Reduct. 2021, 60, 102276. [Google Scholar] [CrossRef]
- Cano, S.J.; Pendrill, L.R.; Melin, J.; Fisher, W.P. Towards consensus measurement standards for patient-centered outcomes. Measurement 2019, 141, 62–69. [Google Scholar] [CrossRef]
- Chandler, H.W. A finite-element implementation of a mixed extremum principle for linear elasticity. Commun. Appl. Numer. Methods 1992, 8, 9–15. [Google Scholar] [CrossRef]
- Chen, C.K.; Xu, L.L.; Zhao, D.Y.; Xu, T.; Lei, P. A new model for describing the urban resilience considering adaptability, resistance and recovery. Saf. Sci. 2020, 128, 104756. [Google Scholar] [CrossRef]
- Qingliang, Z.H.A.; Shiyuan, X.U.; Jun, W.; Beibei, H.U.; Mingwu, Y.E.; Yaolong, L.I.U. A Review of Risk Assessment of Storm Surge on Coastal Cities. Prog. Geogr. 2007, 26, 32–40. [Google Scholar]
- Zhao, D.; Chen, C.; Yi, L.; Lei, P.; Xu, L. Research on comprehensive assessment model of urban resilience with multi-factor. J. Saf. Sci. Technol. 2022, 18, 54–59. [Google Scholar]
- Xue, Y.; Chen, B.; Huang, C.; Yan, J. Soft Hierarchical Model of Integrated Risk Assessment for Multi-hazards: Taking Earthquake and Flood Disasters in Lijiang, Yunnan as a Case Study. Prog. Geogr. 2012, 31, 353–360. [Google Scholar]
- Zhang, Z.X.; Li, Y. Coupling coordination and spatiotemporal dynamic evolution between urbanization and geological hazards—A case study from China. Sci. Total. Environ. 2020, 728, 138825. [Google Scholar] [CrossRef]
- Tepanosyan, G.; Sahakyan, L.; Zhang, C.; Saghatelyan, A. The application of Local Moran’s I to identify spatial clusters and hot spots of Pb, Mo and Ti in urban soils of Yerevan. Appl. Geochem. 2019, 104, 116–123. [Google Scholar] [CrossRef]
- Deroliya, P.; Ghosh, M.; Mohanty, M.P.; Ghosh, S.; Rao, K.; Karmakar, S. A novel flood risk mapping approach with machine learning considering geomorphic and socio-economic vulnerability dimensions. Sci. Total. Environ. 2022, 851, 158002. [Google Scholar] [CrossRef] [PubMed]
- Shi, C.; Zhu, X.; Wu, H.; Li, Z. Assessment of Urban Ecological Resilience and Its Influencing Factors: A Case Study of the Beijing-Tianjin-Hebei Urban Agglomeration of China. Land 2022, 11, 921. [Google Scholar] [CrossRef]
- Wang, Z.B.; Liang, L.W.; Sun, Z.; Wang, X.M. Spatiotemporal differentiation and the factors influencing urbanization and ecological environment synergistic effects within the Beijing-Tianjin-Hebei urban agglomeration. J. Environ. Manag. 2019, 243, 227–239. [Google Scholar] [CrossRef] [PubMed]
- Wang, H.; Zhang, B.; Liu, Y.; Liu, Y.; Xu, S.; Deng, Y.; Zhao, Y.; Chen, Y.; Hong, S. Multi-dimensional analysis of urban expansion patterns and their driving forces based on the center of gravity-GTWR model: A case study of the Beijing-Tianjin-Hebei urban agglomeration. Acta Geogr. Sin. 2018, 73, 1076–1092. [Google Scholar]
- Chen, M.; Guo, S.; Lu, D. Characteristics and spatial patterns of floating population in the Beijing- Tianjin-Hebei urban agglomeration under the background of new urbanization. Prog. Geogr. 2018, 37, 363–372. [Google Scholar]
- Wang, B.; Han, S.; Ao, Y.B.; Liao, F.W. Evaluation and Factor Analysis for Urban Resilience: A Case Study of Chengdu–Chongqing Urban Agglomeration. Buildings 2022, 12, 962. [Google Scholar] [CrossRef]
- Ge, Y.; Dou, W.; Gu, Z.; Qian, X.; Wang, J.; Xu, W.; Shi, P.; Ming, X.; Zhou, X.; Chen, Y. Assessment of social vulnerability to natural hazards in the Yangtze River Delta, China. Stoch. Environ. Res. Risk Assess. 2013, 27, 1899–1908. [Google Scholar] [CrossRef]
- Wu, C.Y.; Wei, Y.H.D.; Huang, X.J.; Chen, B.W. Economic transition, spatial development and urban land use efficiency in the Yangtze River Delta, China. Habitat Int. 2017, 63, 67–78. [Google Scholar] [CrossRef]
- Yang, G.F.; Ge, Y.; Xue, H.; Yang, W.; Shi, Y.; Peng, C.H.; Du, Y.Y.; Fan, X.; Ren, Y.; Chang, J. Using ecosystem service bundles to detect trade-offs and synergies across urban-rural complexes. Landsc. Urban Plan. 2014, 136, 110–121. [Google Scholar] [CrossRef]
- Ding, R.; Xu, B.; Zhang, H. Can Urban Agglomeration Drive Regional Economic Growth?Empirical Analysis Based on Seven State-level Urban Agglomerations. Econ. Geogr. 2021, 41, 37–45. [Google Scholar]
- Li, H.W.; Xu, E.Q.; Zhang, H.Q. Examining the coupling relationship between urbanization and natural disasters: A case study of the Pearl River Delta, China. Int. J. Disaster Risk Reduct. 2021, 55, 102057. [Google Scholar] [CrossRef]
- Song, J.; Luo, M.; Zhang, Q. Risk Prediction of Future Flood Disaster in the Guangdong—Hong Kong—Macau Greater Bay Area. J. Catastrophol. 2022, 37, 197. [Google Scholar]
- Hui, E.C.M.; Li, X.; Chen, T.T.; Lang, W. Deciphering the spatial structure of China’s megacity region: A new bay area-The Guangdong-Hong Kong-Macao Greater Bay Area in the making. Cities 2020, 105, 102168. [Google Scholar] [CrossRef]
- Wu, H.; Fang, S.; Zhang, C.; Hu, S.; Nan, D.; Yang, Y. Exploring the impact of urban form on urban land use efficiency under low-carbon emission constraints: A case study in China’s Yellow River Basin. J. Environ. Manag. 2022, 311, 114866. [Google Scholar] [CrossRef]
- Meng, C.S.; Tang, Q.; Yang, Z.H.; Cheng, H.Y.; Li, Z.G.; Li, K.L. Collaborative control of air pollution in the Beijing–Tianjin–Hebei region. Environ. Technol. Innov. 2021, 23, 101557. [Google Scholar] [CrossRef]
- Liu, C.F.; Su, J.Y.; Zuo, X.J.; Wang, W. Assessment of regional vulnerability to seismic hazards in the Beijing-Tianjin-Hebei metropolitan area, China. Nat. Hazards 2015, 75, 831–848. [Google Scholar] [CrossRef]
- Qu, C.; Wang, J.; He, M. Research on Resource Allocation Optimization of Synergetic Development in Beijing-Tianjin-Hebei Region. Oper. Res. Manag. Sci. 2021, 30, 36–42. [Google Scholar]
- Yang, Z.S.; Yang, H.; Wang, H. Evaluating urban sustainability under different development pathways: A case study of the Beijing-Tianjin-Hebei region. Sustain. Cities Soc. 2020, 61, 102226. [Google Scholar] [CrossRef]
- Zhu, S.Y.; Li, D.Z.; Huang, G.Y.; Chhipi-Shrestha, G.; Nahiduzzaman, K.M.; Hewage, K.; Sadiq, R. Enhancing urban flood resilience: A holistic framework incorporating historic worst flood to Yangtze River Delta, China. Int. J. Disaster Risk Reduct. 2021, 61, 102355. [Google Scholar] [CrossRef]
- Ye, C.; Zhu, J.; Li, S.; Yang, S.; Chen, M. Assessment and analysis of regional economic collaborative development within an urban agglomeration: Yangtze River Delta as a case study. Habitat Int. 2018, 83, 20–29. [Google Scholar] [CrossRef]
- Wang, J.; Gong, Q.; Yu, Y.; Yuan, S.; Chen, J.; Huang, G. Evaluation of comprehensive disaster-bearing capacity of urban natural disasters in the Guangdong-Hong Kong-Macao Greater Bay Area. Geogr. Res. 2020, 39, 2189–2199. [Google Scholar]
- Li, L.; Chan, P.W.; Deng, T.; Yang, H.-L.; Luo, H.-Y.; Xia, D.; He, Y.-Q. Review of advances in urban climate study in the Guangdong-Hong Kong-Macau Greater Bay Area, China. Atmospheric Res. 2021, 261, 105759. [Google Scholar] [CrossRef]
- Guo, C.L.; Sim, T.; Ho, H.C. Impact of information seeking, disaster preparedness and typhoon emergency response on perceived community resilience in Hong Kong. Int. J. Disaster Risk Reduct. 2020, 50, 101744. [Google Scholar] [CrossRef]
- Ainuddin, S.; Routray, J.K. Community resilience framework for an earthquake prone area in Baluchistan. Int. J. Disaster Risk Reduct. 2012, 2, 25–36. [Google Scholar] [CrossRef]
- Zhang, X.W.; Song, J.; Peng, J.; Wu, J.S. Landslides-oriented urban disaster resilience assessment—A case study in ShenZhen, China. Sci. Total. Environ. 2019, 661, 95–106. [Google Scholar] [CrossRef] [PubMed]
- Kotzee, I.; Reyers, B. Piloting a social-ecological index for measuring flood resilience: A composite index approach. Ecol. Indic. 2016, 60, 45–53. [Google Scholar] [CrossRef]
- Johnstone, J.F.; Chapin, F.S.; Hollingsworth, T.N.; Mack, M.C.; Romanovsky, V.; Turetsky, M. Fire, climate change, and forest resilience in interior Alaska. Can. J. For. Res. 2010, 40, 1302–1312. [Google Scholar] [CrossRef]
- Zhao, R.D.; Fang, C.L.; Liu, J.; Zhang, L.F. The evaluation and obstacle analysis of urban resilience from the multidimensional perspective in Chinese cities. Sustain. Cities Soc. 2022, 86, 104160. [Google Scholar] [CrossRef]
- Zhou, R.; Yu, Y.; Wu, B.X.; Luo, X.R. Quantitative evaluation of urban resilience in underdeveloped regions: A study of cities along the Sichuan-Tibet Railway in China. Front. Environ. Sci. 2023, 11, 148. [Google Scholar]
- Cao, F.F.; Xu, X.F.; Zhang, C.L.; Kong, W.B. Evaluation of urban flood resilience and its Space-Time Evolution: A case study of Zhejiang Province, China. Ecol. Indic. 2023, 154, 110643. [Google Scholar] [CrossRef]
- Qasim, S.; Qasim, M.; Shrestha, R.P.; Khan, A.N.; Tune, K.; Ashraf, M. Community resilience to flood hazards in Khyber Pukhthunkhwa province of Pakistan. Int. J. Disaster Risk Reduct. 2016, 18, 100–106. [Google Scholar] [CrossRef]
- Wu, P.; Duan, Q.X.; Zhou, L.G.; Wu, Q.; Deveci, M. Spatial-temporal evaluation of urban resilience in the Yangtze River Delta from the perspective of the coupling coordination degree. Environ. Dev. Sustain. 2023, 1–23. [Google Scholar] [CrossRef] [PubMed]
- Liu, X.L.; Li, S.J.; Xu, X.; Luo, J.S. Integrated natural disasters urban resilience evaluation: The case of China. Nat. Hazards 2021, 107, 2105–2122. [Google Scholar] [CrossRef]
- Lin, Y.Z.; Peng, C.; Chen, P.; Zhang, M.J. Conflict or synergy? Analysis of economic-social- infrastructure-ecological resilience and their coupling coordination in the Yangtze River economic Belt, China. Ecol. Indic. 2022, 142, 109194. [Google Scholar] [CrossRef]


Disclaimer/Publisher’s Note: The statements, opinions and data contained in all publications are solely those of the individual author(s) and contributor(s) and not of MDPI and/or the editor(s). MDPI and/or the editor(s) disclaim responsibility for any injury to people or property resulting from any ideas, methods, instructions or products referred to in the content. |
© 2023 by the authors. Licensee MDPI, Basel, Switzerland. This article is an open access article distributed under the terms and conditions of the Creative Commons Attribution (CC BY) license (https://creativecommons.org/licenses/by/4.0/).