Article

Assessing the Impact of Spatiotemporal Evolution of Urbanization on Carbon Storage in the Mega-Urban Agglomeration Area: Case Study of Yangtze River Delta Urban Agglomeration, China

School of Landscape Architecture, Beijing Forestry University, 35 Qinghua East Road, Haidian District, Beijing 100083, China
*
Author to whom correspondence should be addressed.
Sustainability 2023, 15(19), 14548; https://doi.org/10.3390/su151914548
Submission received: 24 August 2023 / Revised: 20 September 2023 / Accepted: 25 September 2023 / Published: 7 October 2023

Abstract

:
A comprehensive understanding of the relationship between urbanization evolution and carbon storage is crucial for regional low-carbon development and the mitigation of global warming. In this study, we took a typical mega-urban agglomeration (Yangtze River Delta region) in China from 2000 to 2020 as an example, introduced an improved urbanization index to evaluate its urbanization level, and analyzed the impact of urbanization on carbon storage. The results show that in the past 20 years, the urbanization level of the Yangtze River Delta has increased by 3.25 times, during which, carbon storage has always shown a downward trend and decreased by 6.56 × 10⁷ t. Furthermore, there was a gradually increasing negative correlation between urbanization and carbon storage. Lastly, the spatial loss of carbon storage is as follows: urban–rural fringes > rural area > developed urban area. From the perspective of stage characteristics, urban development periods that focus on outward expansion suffer faster losses. The results point out that we should focus on urban–rural fringes and control the urbanization development model in order to achieve carbon storage protection in rapidly urbanizing areas. This study provides a unique perspective on how to coordinate the relationship between regional urbanization and carbon storage services and achieve sustainability, especially for mega-urban agglomeration regions.

1. Introduction

Excessive greenhouse gas emissions continue to exacerbate climate warming, which has become one of the biggest threats facing the world [1]. In order to deal with climate change, nearly 200 countries of the United Nations have concluded the Paris Agreement on COP26 (https://www.un.org/zh/, assessed on 20 August 2023), which aims to coordinate countries to take active measures to reduce greenhouse gas emissions and achieve the goal of controlling the global average temperature rise in this century. As the world’s largest energy consumer and CO2 emitter, China has actively made climate commitments and pledged to have carbon dioxide emissions peak before 2030 and achieve carbon neutrality before 2060 [2]. As one of the three major carbon pools, terrestrial ecosystems can absorb and accumulate carbon in the atmosphere, which was recognized as one of the most important measures to control the rise of carbon concentration in the atmosphere and curb global warming [3,4,5]. Terrestrial carbon storage plays a key role in providing ecosystem services and mitigating global world warming [6,7]. However, the land-use change caused by urbanization has a profound impact on the carbon cycle of the ecosystem, resulting in the loss of carbon storage [8,9] and aggravating climate warming.
Urbanization is a complex process involving the economy, society, population, regional space, and many other aspects [10]. It is an irresistible global trend [11]. By 2030, the urban land cover area may reach 186,000 square kilometers, an increase of more than 180% compared with 2000 [12]. Urbanization is often accompanied by scale expansion of built-up areas, economic development, and population growth, which is the main driving force of land cover and landscape pattern change and will lead to significant changes in ecosystems [13,14]. The land use change brought about by urban development will lead to the loss of carbon storage and the increase in carbon emissions [15]. It is estimated that global land use change has led to the loss of 145 Pg carbon reserves in the past 170 years [16]. Second only to fossil fuel combustion, it has become the second largest cause of the surge in atmospheric CO2 [17]. China is gradually becoming a hot spot of global urbanization [18]. Urban agglomeration is the main form in the process of urbanization in China, and it is increasingly becoming the new growth pole of China’s high-quality economic development [19,20]. In order to cope with climate change and promote the healthy development of urban agglomerations, it is very important to quantitatively assess the impact of urbanization on the carbon storage of terrestrial ecosystems.
Urbanization has a significant impact on the carbon storage of terrestrial ecosystems, but research in related fields was not carried out until around 2000 [21,22]. Until now, there has been a large number of studies on the relationship between urbanization, land use change, and carbon storage, such as Sleeter et al. [23] who explored the carbon dynamics of native terrestrial ecosystems in the United States from 1973 to 2010 and found that land-use and land-cover change (LUCC) is the key factor leading to ecosystem carbon dynamics. Wang et al. [24] discussed the relationship between urbanization level and carbon sequestration at the county scale in the Beijing–Tianjin–Hebei region in north China based on the InVEST model and found that they were negatively correlated and conformed to a power function. Lou et al. [25] used the method of nonlinear fitting to quantify the interaction between urbanization and various ecosystem services, including carbon storage, using 110 cities in the Yangtze River Economic Belt as the research object. Most studies simply analyze carbon storage as a part of ecosystem services and focus on the comprehensive impact of urbanization on ecosystem services [26,27], hardly drawing results and decision making in response to climate change. In addition, most of the studies so far are based on time-specific correlation studies [28,29,30]. Regional carbon storage is always changing dynamically, and the evolution of urbanization is also a complex development process with temporal and spatial differences. How does carbon storage change in regions with different levels of urbanization? And what are the phase characteristics of urbanization affecting carbon storage? The answers to these questions are still unclear. In order to provide decision makers with a scientific decision-making basis, it is necessary to conduct an in-depth exploration from the perspective of time and space, especially for urban agglomeration areas that are in a strategic position for future urbanization construction. As for the change in carbon storage, most of the previous studies focused on the size of carbon storage change [31,32], that is, the intensity of the change, but the differences in the total area of different types of regions are overlooked. The density of regional carbon stock changes is a topic of little attention. The probability of carbon loss in different regions can be fully revealed by further using the frequency ratio index (the percentage of the area where carbon stock changes occur in the area of the entire type of region).
The long-term monitoring of urbanization dynamics is an issue of great concern at present. Remote sensing data obtained good application effects because of their continuity and consistency in the description of urbanization level in large-scale areas. Night-time light remote sensing records are long-term and have a unique advantage in revealing the distribution of human activity and urban areas [33,34]. With 2012 as the cut-off, it includes both DMSP/OLS NTL data and NPP/VIIRS data types [35]. However, the radiation range recorded by DMSP/OLS data is limited, and the light scattering in the atmosphere will also produce errors, namely the saturation effect and flowering effect [36,37]. It limits the accuracy of DMSP/OLS data in urban characterization, especially for urban built-up areas. This feature has a significant impact on urban agglomerations with good urbanization foundations, such as the Yangtze River Delta (YRD). In order to reduce the error of DMSP/OLS NTL data, scholars have introduced NDVI and LST, which are closely related to urban layout and development level [38,39]. Based on previous studies, this paper uses a Temperature and Vegetation Adjusted NTL Urban Index (TVANUI) combining LST, NDVI, and NTL to achieve a more comprehensive and accurate effect in quantifying urbanization [40].
This study takes the Yangtze River Delta urban agglomeration as the research area. Firstly, it quantifies the regional urbanization model based on NTL and Moderate-resolution Imaging Spectroradiometer (MODIS) data and uses the carbon storage module of the InVEST model to estimate changes in regional ecosystem carbon storage over the period 2000–2020, so as to explore the impact of urbanization on carbon storage in Yangtze River Delta urban agglomeration, Specifically, the objectives of this study are to (1) present the evolution characteristics of Yangtze River Delta urban agglomeration urbanization and carbon storage over the past 20 years, (2) assess whether there is a correlation between carbon storage and urbanization, and (3) explore the influence law of urbanization on carbon storage from a multi-level and multi-stage perspective.

2. Materials and Methods
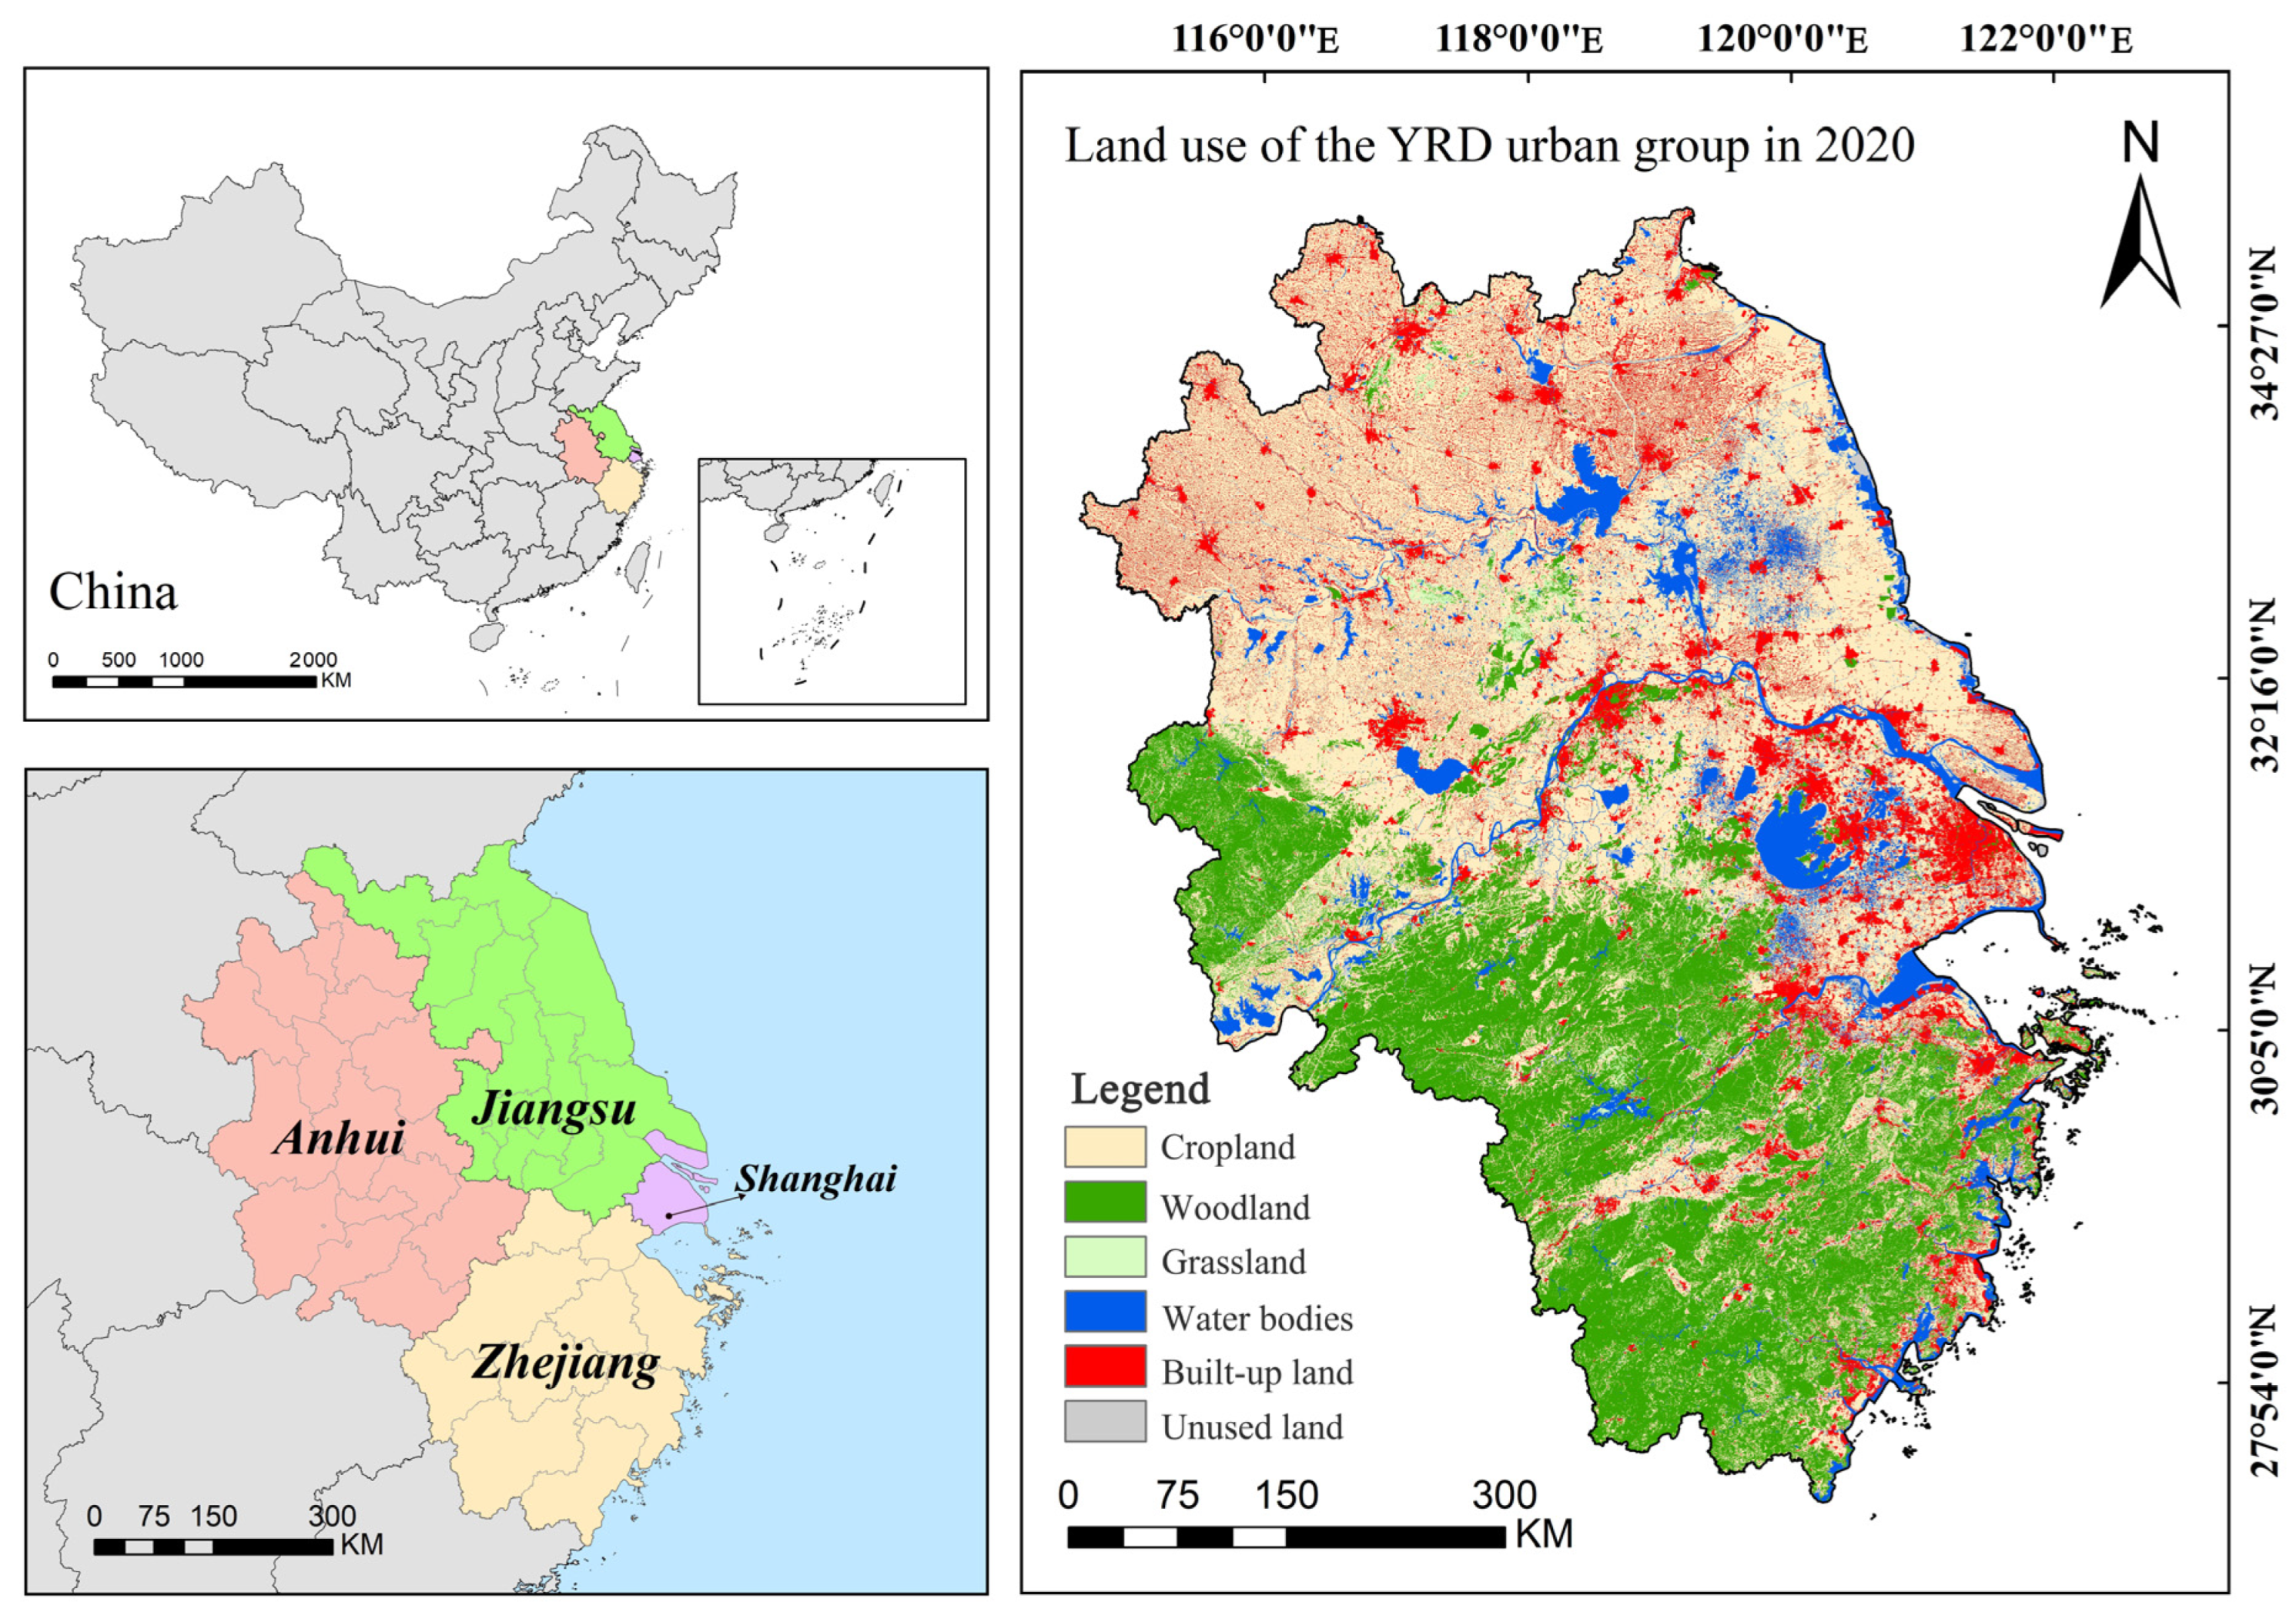
2.1. Study Area

The Yangtze River Delta urban agglomeration is located on the eastern coast of China, on the alluvial plain before the Yangtze River enters the sea (Figure 1). It belongs to the subtropical monsoon climate zone, with an average annual temperature of 14~17 °C and an annual precipitation of 900~1600 mm. The northeastern part of the YRD is dominated by plains with fertile soil; the west and south are mountainous and hilly. The vegetation type is mainly subtropical evergreen broad-leaved forest. The Yangtze River Delta urban agglomeration covers Jiangsu Province, Zhejiang Province, Anhui Province, and Shanghai, with a total of 41 regions and cities within the planning scope. From 2000 to 2020, the population of the YRD increased from 126 million to 235 million, accounting for approximately 24% of domestic GDP. The YRD urban agglomeration has become the urban agglomeration with the fastest urbanization process and the highest level of economic development in China.
Since 1982, the idea of establishing the Yangtze River Delta economic circle with Shanghai as the center was formally proposed. The Yangtze River Delta entered a development stage focusing on the development of Pudong and the revival of southern Jiangsu. Shanghai has always maintained its economic core position. Entering the 21st century, under the background of the integrated development of the Yangtze River Delta, Suzhou, Wuxi, Ningbo, and other surrounding cities formed a multi-core development pattern in which Shanghai is staggered [41]. Behind the rapid urbanization development, the regional ecological environment is facing more and more severe pressure, and the ecosystem service functions including carbon storage are severely affected. In response, the Chinese government released its ‹‹Yangtze River Delta Urban Agglomeration Development Plan (2016–2030)›› in 2016 [42], proposing sustainable development strategies such as coordinated management of climate issues and the protection of important ecological spaces.

2.2. Data Source and Processing

The land use data for 2000, 2010, and 2020 are based on the global land cover product Globeland30 (http://www.globallandcover.com/, assessed on 20 April 2023), with a resolution of 30 m × 30 m. The overall accuracy of this data is 80.30%, and the overall accuracy within China reaches 82.39% [43,44], which is divided into 10 first-class types. After reclassification, the Yangtze River Delta urban agglomeration land cover was classified into six types: cultivated land, forest land, grassland, water area, construction land, and unused land.
The construction of the Temperature and Vegetation Adjusted NTL Urban Index (TVANUI) involves three types of data, namely nighttime light (NTL) remote sensing data, normalized difference vegetation index (NDVI), and land surface temperature (LST) (Figure 2). NTL remote sensing data were obtained from the National Oceanic and Atmospheric Administration’s DMSP/OLS and NPP/VIIRS night-light image datasets (https://www.ngdc.noaa.gov/eog/index.html, assessed on 23 April 2023). Due to the difference in the parameters of the two data sensors and the lack of comparability of the data, the radiometric correction of NTL remote sensing data was performed using the research method of Li et al. [45]. The NDVI data was extracted from NASA’s MOD13A2 image set, which provides optimal pixel synthesis within 16 days at a spatial resolution of 1 km. The LST index was extracted from the MOD11A2 image set, which provides an 8-day average land surface temperature at 1 km spatial resolution [46].

2.3. Study Methodology

The research framework of this study is shown in Figure 3. Firstly, we collected the land use and satellite remote sensing data from 2000 to 2020, combined with the InVEST model, and obtained the temporal and spatial pattern of carbon storage and urbanization in the Yangtze River Delta. Secondly, taking the cell of 5 km × 5 km as the basic unit, the relationship between urbanization and carbon storage was analyzed. Then, on the scale of province and city, we studied the impact of urbanization on carbon storage at multiple levels and stages.

2.3.1. Construction of TVANUI

The nighttime light sensing data used in this paper span a long time and come from two types of data sets: DMSP/OLS data and NPP/VIIRS data. Due to the difference between the parameters of the two sensors, the data lack comparability. Therefore, the research method of Li et al. [45] was used to fit the NPP/VIIRS data of this year to form a continuous nighttime light sensing data set.
In order to reduce the problem of light data saturation and flowering effect of DMSP/OLS images in urban central areas [36,37], a method proposed by Zhang et al. [40] was used, that is, combining the ratio of LST to NDVI with DMSP/OLS NTL data to construct the temperature and vegetation adjusted NTL urban index (TVANUI). There are empirical results showing that TVANUI has higher accuracy and applicability in describing urbanization and mapping urban areas compared with other established urban indexes, and can effectively monitor urbanization dynamics on a regional scale. The formula is as follows:
T V A N U I = a r c t a n L S T _ n o r N D V I _ n o r π 2 × N T L _ n o r
Because the three indicators used for the calculation have different dimensions, the data need to be limited to the same range via standardization. Thus, the equation, respectively, represents the results of normalizing the LST, NDVI, and NTL values to 0 , 1 . The NDVI of the water area is often negative [38], treated as a null value here. It is important to note that to reduce the impact of seasonal variations on LST, the annual average LST data was created from all daytime LST images in the corresponding year in Equation (1). The LST data adopts the following normalization method:
L S T _ n o r = L S T L S T M I N L S T _ M A X L S T M I N

2.3.2. Classification of Urbanization

The calculated TVANUI value is used to describe the urbanization process of the Yangtze River Delta urban agglomeration from 2000 to 2020. It ranges from 0 to 1, with higher TVANUI values indicating a higher urbanization level. TVANUI values are also used for spatial classification of urbanization levels. Based on previous studies [47] and the Chinese threshold of the TVANUI Index [40], the area of the Yangtze River Delta urban agglomeration is classified into three types (rural area, developing urban area, and developed urban area) according to the dynamic level of TVANUI. The threshold is shown in Table 1.

2.3.3. Carbon Storage Assessment Based on the InVEST Model

In this paper, the InVEST model is used to analyze changes in carbon storage in the Yangtze River Delta urban agglomeration ecosystems. The model simulates the carbon storage of the ecosystem by the method of carbon pool substitution combined with land use data. The carbon storage of ecosystems can be divided into four basic carbon pools: below-ground biological carbon, above-ground biological carbon, soil carbon, and dead organic matter carbon [48]. The formula is
C s u m = 1 p D p a b o v e + D p b e l o w + D p s o i l + D p d e a d × A p
In the formula, C s u m indicates the total carbon storage of all land use types, D p _ a b o v e , D p _ b e l o w , D p _ s o i l , and D p _ d e a d denote the above-ground carbon density, the below-ground carbon density, soil organic carbon density, and dead organic matter carbon density for land cover type p, respectively. A p represents the corresponding area of land use type p. The value of carbon density is based on the previous research data in the Yangtze River Delta urban agglomeration [49], and the carbon densities of the six land use types in the study area are as follows in Table 2.

2.3.4. Correlation Analysis between Urbanization and Carbon Storage

Taking the cell of 5 km × 5 km as the basic unit, this paper calculates the urbanization index and carbon storage of 13,827 cells in the study area. Via the normality test, the significance of the results is less than 0.05, and the data does not obey the normal distribution. Therefore, we choose to use Spearman’s rank correlation test of SPSS software SPSS 26.0 to make a regression analysis on the correlation between carbon storage and urbanization index in all research cells.

2.3.5. Analyze the Characteristics of Carbon Storage Changes

The characteristics of carbon storage changes that this article focuses on include two aspects: the intensity of carbon storage change and the density of carbon storage change. Considering that the areas of the three types of urbanized areas are different, it is not enough to reflect the change characteristics only via the intensity of carbon storage loss. This paper also introduces frequency ratio to characterize the density of carbon storage loss. The frequency ratio is the ratio between the areas where carbon storage losses occur and all areas of that type and is calculated as follows:
F R k = S k l S k
Among them, S k l represents the area of carbon storage loss in urbanization zone k, and S k represents the total area of urbanization zone k. Urbanization zones include developed urban areas, developing urban areas, and rural areas. The frequency ratio represents the probability of carbon storage loss in the region.

3. Results

3.1. Spatiotemporal Evolution of Urbanization in the YRD

The average values of the Temperature and Vegetation Adjusted NTL Urban Index (TVANUI) of the Yangtze River Delta urban agglomeration in 2000, 2010, and 2020 were 0.043, 0.110, and 0.175 (Table 3), respectively. In 2020, the TVANUI value was 4.25 times that of 2000, indicating that the urbanization level of the study area has improved significantly in the past two decades. In the past 20 years, the average annual growth rate of TVANUI in developed urban areas was 0.77%, while that in developing urban areas reached 8.15%, indicating that the developing urban areas experienced a drastic urbanization development. From the perspective of spatial pattern (Figure 4), the urbanization level of the Yangtze River Delta region is generally high in the east and low in the west.
Figure 5 depicts the change distribution of TVANUI values in the Yangtze River Delta region from 2000 to 2020, which we divide into three types of urbanized regions. As can be seen from the figure, the initial urbanization level of the central urban areas in the core cities of the Yangtze River Delta, such as Shanghai, Nanjing, and Hangzhou, was good, but the change range in the past 20 years was very low. In the northern part of the study area, the initial TVANUI value was low, but the cities along the traffic line (Xuzhou, Bengbu, etc.) have significantly improved their urbanization level by relying on their transportation advantages. The southwest region is mainly mountainous, and the development of social and economic activities is limited by terrain. As a result, the urbanization process is slow here.

3.2. Patterns of Carbon Storage in the YRD

The overall pattern of carbon storage in the Yangtze River Delta is relatively stable, showing a pattern of “high in the southwest, low in the northeast” (Figure 6). The southwest is mainly mountainous forest, which is the most important land use type contributing to carbon storage. The low-level carbon storage areas are mainly distributed in the northeast plain, mainly in cultivated land and construction land, and the carbon storage value is maintained at a relatively low level under the influence of human social production activities. From 2000 to 2020, the Delta’s carbon stock declined. Between 2010 and 2020, carbon storage decreased significantly, with a total loss of 4.49 × 10⁷ t, which was 2.16 times that of 2000–2010. As shown in Table 4, among the three provinces and one municipality in the Yangtze River Delta, Jiangsu Province (2.45 × 10⁷ t) had the largest carbon loss in the past 20 years, followed by Zhejiang Province (2.27 × 10⁷ t), Anhui Province (1.67 × 10⁷ t), and Shanghai (1.68 × 10⁶ t).

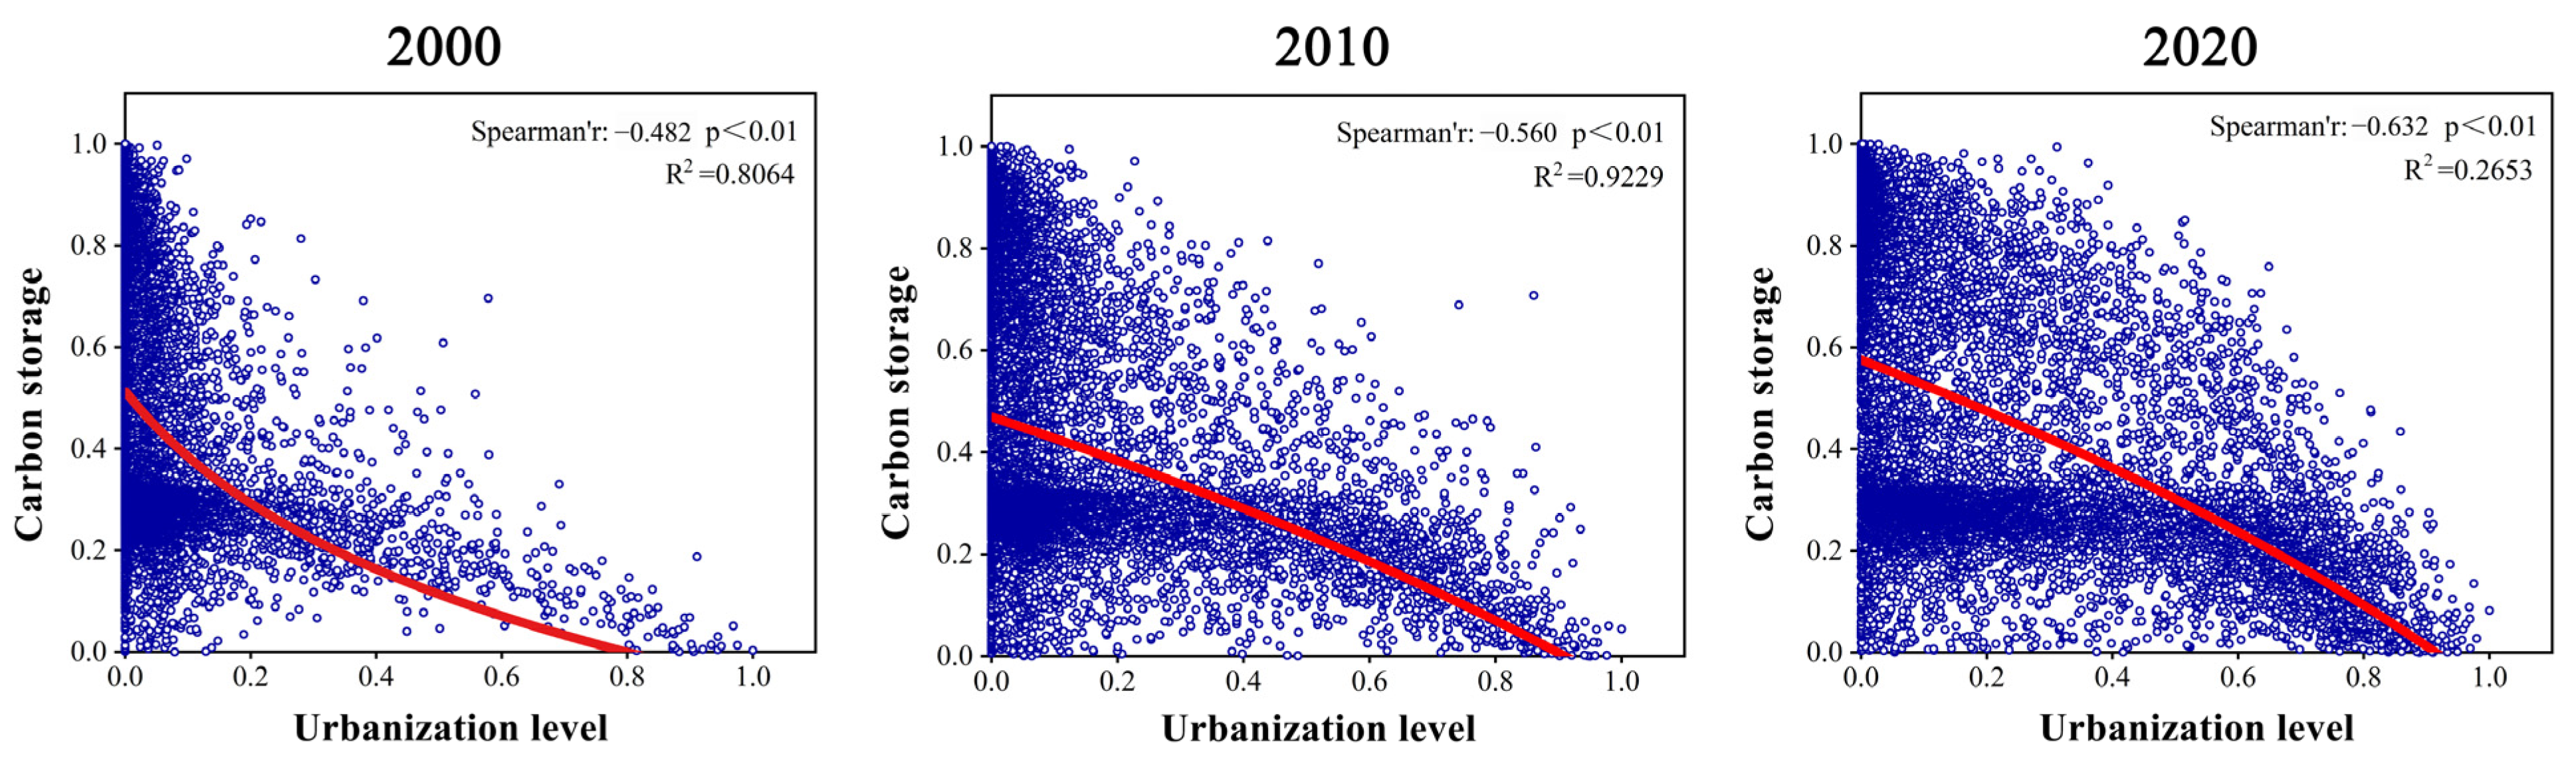
3.3. The Relationship between Urbanization and Carbon Storage

Based on the pixel size of 5 km × 5 km, the study area was divided into 13,827 cells. Figure 7 illustrates the negative correlation between carbon storage and the level of urbanization in the 13,827 cells via logarithmic function regression. R2 proves that regression is credible. This is similar to the conclusion reached by Wang et al. [25]. Spearman’s rank correlation test of SPSS 26 software and the two-tailed test were used to verify the significance of the correlation of the data in 2000, 2010, and 2020, and the statistical data were obtained in Table 5. It can be concluded that (1) during the last 20 years, there has always been a significant negative correlation between carbon storage and urbanization level in the study area (p < 0.01), the relationship between the two basically follows a logarithmic function via verification; and (2) in terms of time, the absolute value of the correlation coefficient between the two shows an upward trend. This indicates that the negative correlation between carbon storage and urbanization level in the Yangtze River Delta region is gradually strengthening.

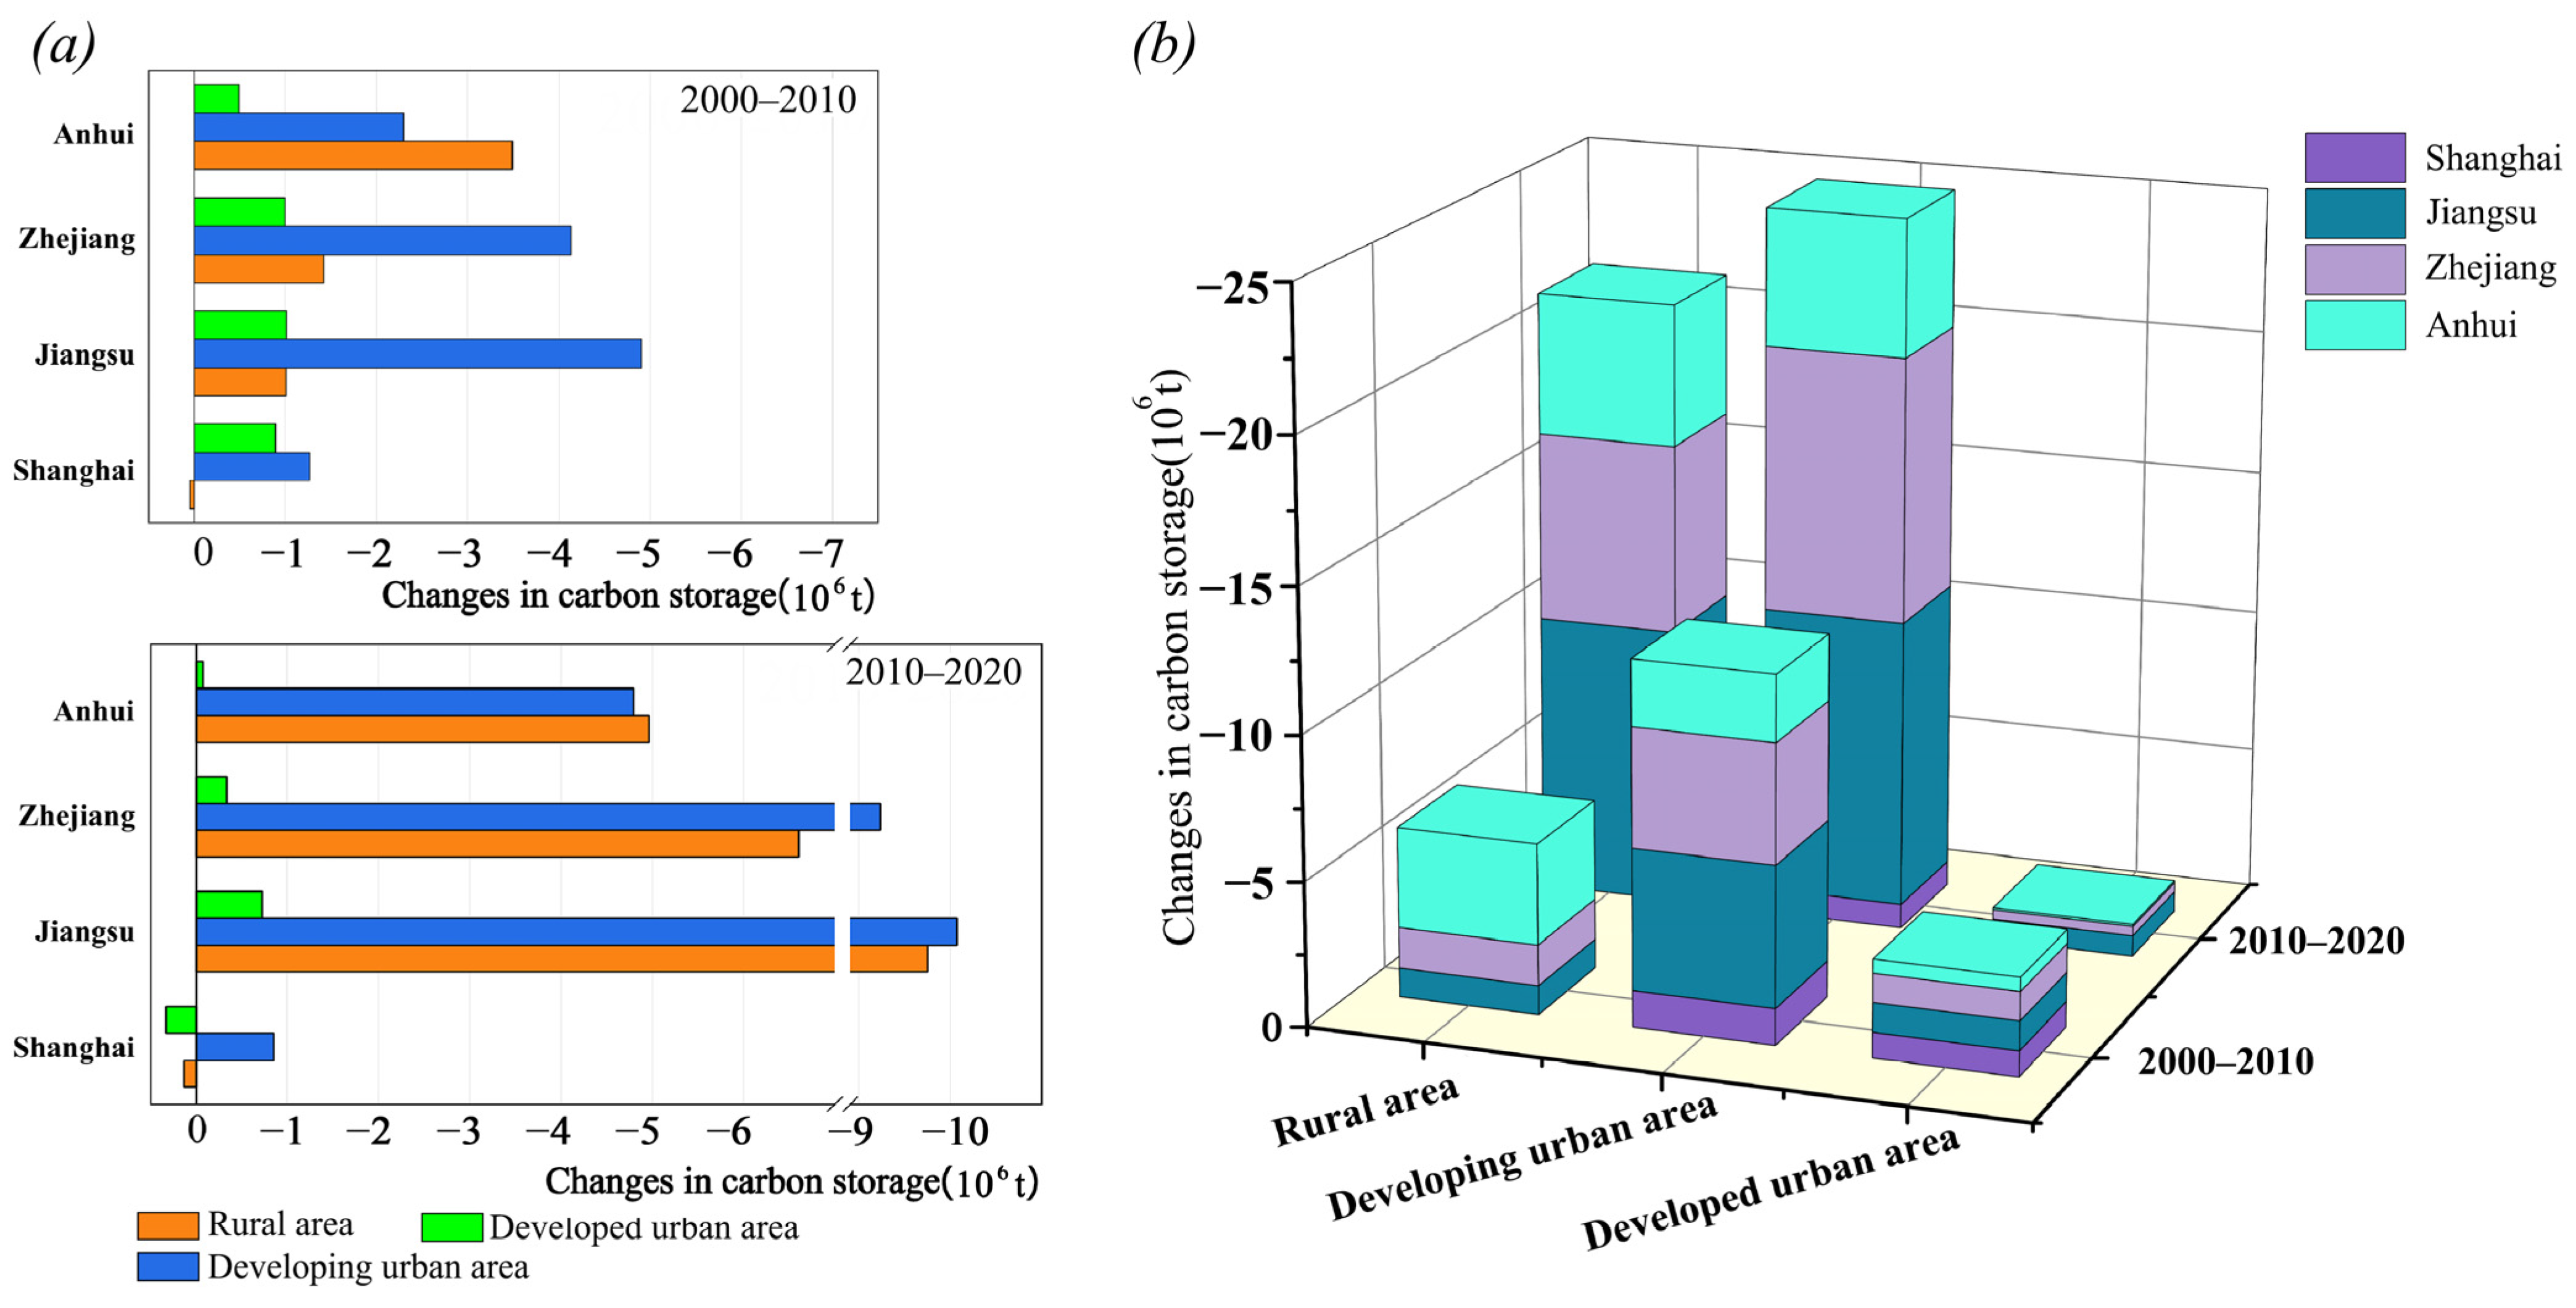
3.4. Impact of Spatiotemporal Evolution of Urbanization on Carbon Storage

3.4.1. Response of Carbon Storage Change Intensity to Urbanization

The amount of carbon storage change can characterize the intensity of carbon storage loss. In order to obtain the response law of carbon storage change intensity to urbanization, we not only discussed the urbanization process and corresponding carbon sequestration changes but also made a specific comparative study of the three types of regions by selecting suitable cities (Shanghai, Nanjing, and Hefei) (Figure 8). Firstly, Shanghai has a large proportion of developed urban areas, and the carbon loss in 2000–2010 was significantly more than that in 2010–2020. In 2010–2020, the outer ring green belt and wedge-shaped green space reached a certain scale and were gradually recognized. Secondly, the loss of carbon storage in developing urban areas presents an obvious circular diffusion type, and the loss of carbon storage in the next ten years is even greater. The developing urban areas of Nanjing are selected as a representative. Lastly, variations in carbon storage in rural areas are scattered. The rural area of Hefei is vast. From 2000 to 2010, the area where the northern satellite city is located experienced a relatively concentrated loss of carbon storage. During 2010–2020, carbon storage in some rural areas of Hefei City increased, which may be related to the tree planting and greening policy during these years.
In terms of spatial variation (Figure 9a), the carbon storage loss of the whole study area during the past 20 years was developing urban area > rural area > developed urban area, and the ratio of carbon storage loss was 9:6:1. From 2000 to 2020, the developing regions of Jiangsu Province, Zhejiang Province, and Shanghai had the largest carbon storage loss ratio, which was 1.5 × 10⁷ t, 1.34 × 10⁷ t, and 2.11 × 10⁶ t, respectively, accounted for 54.51%, 58.82%, and 84.84% of carbon storage loss, respectively. Anhui Province has different characteristics. The loss of carbon storage in rural areas exceeds that in developing and developed areas, reaching 52.48% of the total loss. This is because the urbanization level of Anhui province is low, so the unified threshold for all provinces and cities to divide the urbanization level overestimates the scope of rural areas in Anhui province. In terms of time variation, the carbon storage in the study area decreased more significantly in 2010~2020 than in 2000–2010. The same is true for developing and rural areas (Figure 9b). However, the developed areas of the provinces and cities show the opposite characteristics because the development and construction in cities tend to be saturated with time. Overall, the loss of carbon storage in 2010~2020 was 2.16 times that in 2000–2010.

3.4.2. Response of Carbon Storage Change Density to Urbanization

The densities of carbon storage changes in different urbanization types during 2000–2010, 2010–2020, and the total 20 years are shown in Figure 10. From the perspective of space, the frequency of carbon storage loss in developing areas reached 45.2% in 20 years, which was higher than that in developed urban areas (42.4%) and rural areas (12.4%). It shows that on the scale of urban agglomeration, the developing region has experienced the most intensive carbon storage loss, and the same pattern occurred in Shanghai, Jiangsu, and Anhui during the past 20 years.
From the time perspective, the peak frequency of carbon loss was observed in developed urban areas of the study area, and it shifted to developing urban areas in 2010–2020 (Figure 10), indicating that the area experiencing intensive carbon storage loss is expanding from the urban core to the urban fringe. It may be due to the shift of the center of gravity of urban construction. After the high-intensity urban construction in the urban core, the land reaches a state of near-saturation, and the focus of expansion has shifted to the urban fringe. It is worth noticing that the frequency of carbon storage loss in developed urban areas of Shanghai in 2010–2020 was significantly lower than that in 2000–2010. This is because Shanghai has a high level of urbanization base. As time goes on, the urban core area development tends to be saturated, and the range of land use changes is small, so the density of carbon loss in developed urban areas slowed down compared with that in 2000–2010.

4. Discussion

Compared with previous studies [50,51,52,53], this paper not only obtains the correlation between the urban–rural ladder and carbon storage at a specific time but also explores the impact of urbanization evolution on the intensity and density of carbon storage changes from a spatiotemporal perspective. In this section, we conduct an in-depth analysis of the research results, explore the reasons based on the development status of the Yangtze River Delta, and compare them with the results of other urban agglomerations in previous studies. The three key points that this article intends to discuss in depth are as follows: (1) obtain the spatiotemporal response characteristics of carbon storage changes to urbanization; (2) verify the superior effect of TVANUI in quantifying the level of urbanization; and (3) provide practical suggestions for the sustainable development of mega-urban agglomerations.

4.1. Spatial Response Characteristics of Carbon Storage Changes to Urbanization Process

The largest loss of carbon storage is in developing urban areas, followed by rural areas, which is much greater than the carbon loss in developed urban areas. Huge carbon losses occur in developing urban areas, which is consistent with scholars’ research on the Nanjing area [47]. Developing urban areas belong to the urban fringe zone geographically and have both urban and rural land use attributes. They are experiencing the process of rapid urban expansion. The urban fringe zone has experienced tremendous changes in land use and social and demographic characteristics. In particular, southern Jiangsu, Hangjiahu, Ningshao, and the surrounding areas of Shanghai are densely distributed areas of cities and towns in the Yangtze River Delta. Industrial parks in the suburbs of these cities and towns in the Yangtze River Delta have excessive land occupation, over-expropriation and under-use, and serious waste of land. At the same time, as the economic development and construction of urban central areas gradually become saturated, built-up areas expand to the suburbs, and industrial land and construction land occupy the original cultivated land and forest land, resulting in a sharp decline in carbon storage.
Therefore, we recommend that the Yangtze River Delta urban agglomeration implement regional policies based on classified management and control of three major types of areas (developed urban areas, developing urban areas, and rural areas), with the urban fringe areas as the focus. The urban–rural fringe zone is not only an active area for urban expansion but also an ecological barrier supporting the urban system. Policies should clarify the relative boundaries of urban land expansion, achieve smart growth in urban and rural areas, and advocate the principles of compactness and multi-functionality.

4.2. Phased Response Characteristics of Carbon Storage Changes to Urbanization Process

The urban development stage dominated by outward expansion has the greatest carbon loss intensity. The carbon loss during the period 2010–2020 was 2.14 times that of the period 2000–2010. This is the same conclusion as [54] on the three urban agglomerations of Beijing–Tianjin–Hebei, Pearl River Delta, and Yangtze River Delta, but contrary to the research conclusion of [55] in the Suzhou–Wuxi–Changzhou area. This may be due to the difference in research scale. Unlike a single city, urban agglomerations obtained at the scale is the overall development law at the regional scale. On the other hand, as an advantageous city with a very high level of urbanization, Suzhou, Wuxi, and Chang also have particularities in their development methods. As far as the Yangtze River Delta urban agglomeration is concerned, the differences in carbon storage change characteristics at different urbanization stages are related to changes in urban development models. Research on the Yangtze River Delta [56] has proven that with 2010 as the dividing point, the urbanization evolution of the Yangtze River Delta has experienced a transformation from the internal centralized construction-dominated model to the built-up area expansion model. Expansion patterns bring more dramatic land use changes, triggering carbon losses. In summary, whether the urban development model is compatible with the carbon storage pattern may be an important factor in causing carbon storage loss.
From the perspective of carbon loss density, the areas with the most intensive carbon losses have gradually shifted from developed urban areas to developing urban areas in the past two decades. From 2000 to 2010, 55.4% of the carbon loss areas were concentrated in developed urban areas, to 55.1% from 2010 to 2020, which was concentrated in developing urban areas. This may be due to the shift of the urban agglomeration construction center. In the initial years, the urban core area was in a state of low construction intensity supported by more social and economic resources [57]. After 2010, with the comprehensive development and construction of most urban core areas, the focus of development has generally shifted to urban fringe areas, and built-up areas have replaced suburban farmland and forestland, resulting in a sharp decline in carbon stocks.
Judging from historical trends, the negative impact of urbanization on carbon storage in the Yangtze River Delta region increases over time and is consistent with a logarithmic function. From the functional trend prediction, the same degree of urbanization may cause more severe carbon losses in the future. This further validates the correlation between urban development patterns and carbon storage loss.

4.3. TVANUI Index’s Advantage in Urbanization Evaluation

The study innovatively used the TVANUI to quantify the level of urbanization, which was only used in the field of urban area mapping before. Prior to this, a large number of studies often used the nighttime lighting index to quantify the level of urbanization [58,59,60]. Compared with the commonly used nighttime light data, TVANUI also integrates NDVI and LST, two indicators that can reflect urban structure and human activities. Therefore, it has a better description of the scale, shape, and structure of the city. Not only that, the TVANUI can also weaken the saturation effect and blooming effect of DMSP/OLS NTL data. That is, it can effectively identify the different urbanization levels in the core urban area precisely, and at the same time reduce the image recognition deviation caused by the scattering of light in the atmosphere in the suburbs and rural areas. In order to verify the advantages of the TVANUI in this study, three cities in the Yangtze River Delta were selected to conduct a comparative analysis between the two Indexes.
Figure 11 depicts the urbanization level of the four cities using NTL and TVANUI indices. The built-up area from the National Tibetan Plateau Data Center (http://data.tpdc.ac.cn (accessed on 2 May 2023)) is superimposed on nighttime light images. As shown in Figure 12, We also selected the urban and rural latitude transect from Hefei City to make an intuitive comparison between the two indexes. (The NTL index was normalized here). The results show that when NTL is adopted, the values of the core urban areas all reach a highly saturated level, and the NTL values of the peripheral areas of built-up areas are still high. This demonstrates the shortcomings of NTL data in describing urbanization. But when it comes to TVANUI, differences in urbanization level within built-up areas are identified. The urban form and scale identified by the images are closest to the actual built-up areas, which means that urban and non-urban areas are well distinguished. All the above results show that TVANUI does have advantages in measuring the level of urbanization. From the numerical fluctuations of the two indices in the Hefei city transect, the effectiveness of the TVANUI index in eliminating the saturation and blooming effects of the night light index can be further verified. This method can be extended to quantify urbanization in wider areas, especially for areas with high levels of urbanization. It is also of great significance for a more accurate understanding of the interaction between urbanization and ecosystems.

4.4. Suggestions for Low-Carbon Development of Mega-Urban Agglomeration Area

Urbanization alters the landscape and poses enormous challenges to ecosystems [61,62]. Via the analysis of pixel scale in this study, it is proved that there is a negative correlation between urbanization and carbon storage, and the correlation is gradually strengthened. It shows that future urban development may cause more and more serious impacts on the ecosystem, and the carbon storage in the Yangtze River Delta will suffer more losses. For this reason, it is necessary to provide ecological governance measures and urban development suggestions for urban agglomeration areas that are experiencing rapid urbanization. On the one hand, the urban development of the Yangtze River Delta is always at a high level, so it is difficult to maintain carbon reserves by limiting the scale and speed of urbanization. Decision makers should start by innovating the spatial management mode of urban agglomeration to improve the quality of urbanization. On the other hand, under the background of integrated and coordinated development, administrative barriers should be eliminated to ensure the implementation of ecological protection policy and realize the joint prevention and management of ecological environment.
The results of this study also suggest that the spatiotemporal differences of urbanization have different impacts on carbon storage, therefore differentiated governance measures are necessary. In developed urban areas, we should consider increasing green infrastructure such as urban forest parks to increase carbon storage. In view of the fact that the development model dominated by outward expansion has a more severe impact on carbon storage, developed urban areas such as Shanghai, Nanjing, and Hangzhou should improve land use efficiency to form an intensive and compact urban spatial pattern. The developing urban areas are the key areas that should be paid attention to in coordinating urbanization and carbon storage balance. In the urban fringe area, the government should control the area of new urban areas, development zones, and industrial parks to avoid extensive and unrestrained development. In addition, in the process of construction land expansion, it is suggested that the green resources with high ecological value such as woodland and wetlands in the suburbs should be properly retained as the green infrastructure of the new urban area. Rural areas cover a vast area and have obvious ecological advantages. Among them, Jiangsu province–northern Anhui province is dominated by large areas of cultivated land, which has high carbon storage value. The government should adhere to the basic farmland as the physical boundary of urban development, adopt a comprehensive approach such as conservation tillage and organic matter restoration to improve the carbon content of land and promote the construction and upgrading of high-grade farmland. For the large area of high carbon storage mountain woodland in western Zhejiang and southern Anhui, the national ecological red line policy should be strictly adhered to in order to protect the important ecological space. On the premise of not destroying the health of the ecosystem, we should promote the positive transformation of resource advantages into ecological and economic benefits. Maintaining the quality of ecological space and protecting cultivated land should be the focus of ecological governance in rural areas.

4.5. Limitations and Future Prospects

Due to limited data, this paper only focuses on the spatial and temporal dynamic impact of urbanization on carbon storage during 2000–2020. In the future, under the condition of sufficient data, the research cycle can be extended to draw more reliable conclusions. Second, the InVEST model assumes that the carbon density values of the four pools are constant, but the carbon density actually changes dynamically and is affected by many factors, such as nature and human activities [57]. To correct for this, carbon density can be obtained using field surveys to improve accuracy. In addition, this study selects the TVANUI China threshold derived from previous studies to classify areas into three types of urbanization levels. In fact, TVANUI’s division threshold may differ between regions. In the future, it will be necessary to correct the division threshold based on regional development levels.
Furthermore, due to the research focus and space limitations, this study did not explore the main drivers of carbon storage loss deeply, which is still an issue worthy of future research. Finally, due to the different external environments of the cities in the mega-urban agglomeration, when the expansion of the built-up area is the same, the resulting carbon loss is also different. The development of low-carbon-oriented urban agglomerations should advocate that cities adopt different urbanization models according to the external environment. How to classify cities and put forward differentiated development proposals is a direction to be explored.

5. Conclusions

The study introduces the TVANUI urban index and combines it with the InVEST model to explore the impact of multi-level and multi-stage urbanization on carbon storage. The main conclusions are as follows:
(1) From 2000 to 2020, rapid urbanization occurred in the Yangtze River Delta region, the TVANUI index increased by 3.3 times, and carbon storage decreased by 6.56 × 10⁷ t accordingly. The overall carbon storage pattern shows a pattern of “high in the southwest and low in the northeast”.
(2) There is a gradually increasing negative correlation between urbanization and carbon storage, and it was verified to be consistent with a logarithmic functional relationship.
(3) The impact of urbanization on the intensity of carbon storage changes is spatially and temporally heterogeneous. Spatially, carbon storage loss-developing urban areas/rural areas/developed urban areas = 9:6:1, developing urban areas (urban–rural fringe areas) have the largest carbon loss. Temporally, the loss of carbon reserves under the expansion-led development model is faster than that under the centralized development model. Research shows that more attention should be paid to urban development models while focusing on urban and rural fringe areas.
(4) From the perspective of carbon loss density, the areas with the most intensive carbon losses shifted from developed urban areas to developing urban areas from 2000 to 2020. It also provides information for predicting the future change trend of carbon storage in urban agglomerations.

Author Contributions

Conceptualization, H.L. (Hongye Li) and Z.L.; methodology, H.L. (Hongye Li); software, Y.H.; validation, Y.H., H.L. (Hao Li) and J.R.; resources, Z.L.; data curation, H.L. (Hao Li) and R.S.; writing—original draft preparation, H.L. (Hongye Li); writing—review and editing, H.L. (Hongye Li) and Z.L.; visualization, H.L. (Hongye Li); supervision, Z.L. and R.S.; project administration, Z.L.; funding acquisition, Z.L. All authors have read and agreed to the published version of the manuscript.

Funding

This research was funded by the National Science and Technology Major Project, grant number No. 2018ZX07101005.

Institutional Review Board Statement

Not applicable.

Informed Consent Statement

Not applicable.

Data Availability Statement

The data presented in this study are available upon request from the corresponding author.

Acknowledgments

We thank the editors and reviewers for the useful comments and suggestions which greatly helped in improving the manuscript.

Conflicts of Interest

The authors declare no conflict of interest.

References

  1. Touma, D.; Stevenson, S.; Lehner, F.; Coats, S. Human-driven greenhouse gas and aerosol emissions cause distinct regional impacts on extreme fire weather. Nat. Commun. 2021, 12, 212. [Google Scholar] [CrossRef] [PubMed]
  2. Sun, L.-L.; Cui, H.-J.; Ge, Q.-S. Will China achieve its 2060 carbon neutral commitment from the provincial perspective? Adv. Clim. Chang. Res. 2022, 13, 169–178. [Google Scholar] [CrossRef]
  3. Costanza, R.; de Groot, R.; Sutton, P.; van der Ploeg, S.; Anderson, S.J.; Kubiszewski, I.; Farber, S.; Turner, R.K. Changes in the global value of ecosystem services. Glob. Environ. Chang. 2014, 26, 152–158. [Google Scholar] [CrossRef]
  4. Houghton, R.A. Revised estimates of the annual net flux of carbon to the atmosphere from changes in land use and land management 1850–2000. Tellus B Chem. Phys. Meteorol. 2003, 55, 378–390. [Google Scholar] [CrossRef]
  5. Qiu, S.; Fang, M.; Yu, Q.; Niu, T.; Liu, H.; Wang, F.; Xu, C.; Ai, M.; Zhang, J. Study of spatialtemporal changes in Chinese forest eco-space and optimization strategies for enhancing carbon sequestration capacity through ecological spatial network theory. Sci Total Environ. 2023, 859, 160035. [Google Scholar] [CrossRef]
  6. Dybala, K.E.; Steger, K.; Walsh, R.G.; Smart, D.R.; Gardali, T.; Seavy, N.E.; Macinnis-Ng, C. Optimizing carbon storage and biodiversity co-benefits in reforested riparian zones. J. Appl. Ecol. 2018, 56, 343–353. [Google Scholar] [CrossRef]
  7. Molotoks, A.; Stehfest, E.; Doelman, J.; Albanito, F.; Fitton, N.; Dawson, T.P.; Smith, P. Global projections of future cropland expansion to 2050 and direct impacts on biodiversity and carbon storage. Glob. Chang. Biol. 2018, 24, 5895–5908. [Google Scholar] [CrossRef]
  8. Chuai, X.; Huang, X.; Lu, Q.; Zhang, M.; Zhao, R.; Lu, J. Spatiotemporal Changes of Built-Up Land Expansion and Carbon Emissions Caused by the Chinese Construction Industry. Environ. Sci. Technol. 2015, 49, 13021–13030. [Google Scholar] [CrossRef]
  9. Schulp, C.J.E.; Nabuurs, G.-J.; Verburg, P.H. Future carbon sequestration in Europe—Effects of land use change. Agric. Ecosyst. Environ. 2008, 127, 251–264. [Google Scholar] [CrossRef]
  10. Antrop, M. Landscape change and the urbanization process in Europe. Landsc. Urban Plan. 2004, 67, 9–26. [Google Scholar] [CrossRef]
  11. Wu, W.; Zhao, S.; Zhu, C.; Jiang, J. A comparative study of urban expansion in Beijing, Tianjin and Shijiazhuang over the past three decades. Landsc. Urban Plan. 2015, 134, 93–106. [Google Scholar] [CrossRef]
  12. Seto, K.C.; Guneralp, B.; Hutyra, L.R. Global forecasts of urban expansion to 2030 and direct impacts on biodiversity and carbon pools. Proc. Natl. Acad. Sci. USA 2012, 109, 16083–16088. [Google Scholar] [CrossRef]
  13. Li, Y.; Li, Y.; Zhou, Y.; Shi, Y.; Zhu, X. Investigation of a coupling model of coordination between urbanization and the environment. J. Environ. Manag. 2012, 98, 127–133. [Google Scholar] [CrossRef]
  14. Li, H.; Chen, H.; Wu, M.; Zhou, K.; Zhang, X.; Liu, Z. A Dynamic Evaluation Method of Urban Ecological Networks Combining Graphab and the FLUS Model. Land 2022, 11, 2297. [Google Scholar] [CrossRef]
  15. Zhang, M.; Huang, X.; Chuai, X.; Yang, H.; Lai, L.; Tan, J. Impact of land use type conversion on carbon storage in terrestrial ecosystems of China: A spatial-temporal perspective. Sci. Rep. 2015, 5, 10233. [Google Scholar] [CrossRef] [PubMed]
  16. Houghton, R.A.; Nassikas, A.A. Global and regional fluxes of carbon from land use and land cover change 1850–2015. Glob. Biogeochem. Cycles 2017, 31, 456–472. [Google Scholar] [CrossRef]
  17. Don, A.; Schumacher, J.; Freibauer, A. Impact of tropical land-use change on soil organic carbon stocks—A meta-analysis. Glob. Chang. Biol. 2011, 17, 1658–1670. [Google Scholar] [CrossRef]
  18. Ye, Y.; Bryan, B.A.; Zhang, J.E.; Connor, J.D.; Chen, L.; Qin, Z.; He, M. Changes in land-use and ecosystem services in the Guangzhou-Foshan Metropolitan Area, China from 1990 to 2010: Implications for sustainability under rapid urbanization. Ecol. Indic. 2018, 93, 930–941. [Google Scholar] [CrossRef]
  19. Li, W.; Zhou, W.; Han, L.; Qian, Y. Uneven urban-region sprawl of China’s megaregions and the spatial relevancy in a multi-scale approach. Ecol. Indic. 2019, 97, 194–203. [Google Scholar] [CrossRef]
  20. Yu, W.; Zhou, W. Spatial pattern of urban change in two Chinese megaregions: Contrasting responses to national policy and economic mode. Sci Total Environ. 2018, 634, 1362–1371. [Google Scholar] [CrossRef]
  21. Collins, J.P.; Kinzig, A.; Grimm, N.B.; Fagan, W.F.; Hope, D.; Wu, J.; Borer, E.T. A new urban ecology: Modeling human communities as integral parts of ecosystems poses special problems for the development and testing of ecological theory. Am. Sci. 2000, 88, 416–425. [Google Scholar] [CrossRef]
  22. Pickett, S.T.A.; Cadenasso, M.L.; Grove, J.M.; Nilon, C.H. Urban ecological systems: Linking terrestrial ecological, physical, and socioeconomic components of metropolitan areas. Annu. Rev. Ecol. Syst. 2001, 32, 127–157. [Google Scholar] [CrossRef]
  23. Sleeter, B.M.; Liu, J.; Daniel, C.; Rayfield, B.; Sherba, J.; Hawbaker, T.J.; Zhu, Z.; Selmants, P.C.; Loveland, T.R. Effects of contemporary land-use and land-cover change on the carbon balance of terrestrial ecosystems in the United States. Environ. Res. Lett. 2018, 13, 045006. [Google Scholar] [CrossRef]
  24. Wang, C.; Zhan, J.; Chu, X.; Liu, W.; Zhang, F. Variation in ecosystem services with rapid urbanization: A study of carbon sequestration in the Beijing–Tianjin–Hebei region, China. Phys. Chem. Earth Parts A/B/C 2019, 110, 195–202. [Google Scholar] [CrossRef]
  25. Luo, Q.; Zhou, J.; Zhang, Y.; Yu, B.; Zhu, Z. What is the spatiotemporal relationship between urbanization and ecosystem services? A case from 110 cities in the Yangtze River Economic Belt, China. J. Environ. Manag. 2022, 321, 115709. [Google Scholar] [CrossRef]
  26. Chen, W.; Chi, G. Urbanization and ecosystem services: The multi-scale spatial spillover effects and spatial variations. Land Use Policy 2022, 114, 105964. [Google Scholar] [CrossRef]
  27. Wan, L.; Ye, X.; Lee, J.; Lu, X.; Zheng, L.; Wu, K. Effects of urbanization on ecosystem service values in a mineral resource-based city. Habitat Int. 2015, 46, 54–63. [Google Scholar] [CrossRef]
  28. Haase, D.; Schwarz, N.; Strohbach, M.; Kroll, F.; Seppelt, R. Synergies, Trade-offs, and Losses of Ecosystem Services in Urban Regions: An Integrated Multiscale Framework Applied to the Leipzig-Halle Region, Germany. Ecol. Soc. 2012, 17, 22. [Google Scholar] [CrossRef]
  29. Tao, Y.; Li, F.; Liu, X.; Zhao, D.; Sun, X.; Xu, L. Variation in ecosystem services across an urbanization gradient: A study of terrestrial carbon stocks from Changzhou, China. Ecol. Model. 2015, 318, 210–216. [Google Scholar] [CrossRef]
  30. Wang, R.; Bai, Y.; Alatalo, J.M.; Guo, G.; Yang, Z.; Yang, Z.; Yang, W. Impacts of urbanization at city cluster scale on ecosystem services along an urban-rural gradient: A case study of Central Yunnan City Cluster, China. Environ. Sci. Pollut. Res. Int. 2022, 29, 88852–88865. [Google Scholar] [CrossRef]
  31. Yang, H.; Huang, J.; Liu, D. Linking climate change and socioeconomic development to urban land use simulation: Analysis of their concurrent effects on carbon storage. Appl. Geogr. 2020, 115, 102135. [Google Scholar] [CrossRef]
  32. Wang, C.; Li, T.; Guo, X.; Xia, L.; Lu, C.; Wang, C. Plus-InVEST Study of the Chengdu-Chongqing Urban Agglomeration’s Land-Use Change and Carbon Storage. Land 2022, 11, 1617. [Google Scholar] [CrossRef]
  33. Elvidge, C.; Baugh, K.; Hobson, V.; Kihn, E.; Kroehl, H.; Davis, E.; Cocero, D. Satellite inventory of human settlements using nocturnal radiation emissions: A contribution for the global toolchest. Glob. Chang. Biol. 1997, 3, 387–395. [Google Scholar] [CrossRef]
  34. Imhoff, M.L.; Lawrence, W.T.; Stutzer, D.C.; Elvidge, C. A technique for using composite DMSP/OLS “city lights” satellite data to map urban area. Remote Sens. Environ. 1997, 61, 361–370. [Google Scholar] [CrossRef]
  35. Miller, S.D.; Mills, S.P.; Elvidge, C.D.; Lindsey, D.T.; Lee, T.F.; Hawkins, J.D. Suomi satellite brings to light a unique frontier of nighttime environmental sensing capabilities. Proc. Natl. Acad. Sci. USA 2012, 109, 15706–15711. [Google Scholar] [CrossRef]
  36. Elvidge, C.D.; Cinzano, P.; Pettit, D.R.; Arvesen, J.; Sutton, P.; Small, C.; Nemani, R.; Longcore, T.; Rich, C.; Safran, J.; et al. The Nightsat mission concept. Int. J. Remote Sens. 2007, 28, 2645–2670. [Google Scholar] [CrossRef]
  37. Zhang, Q.; Schaaf, C.; Seto, K.C. The Vegetation Adjusted NTL Urban Index: A new approach to reduce saturation and increase variation in nighttime luminosity. Remote Sens. Environ. 2013, 129, 32–41. [Google Scholar] [CrossRef]
  38. Weng, Q.; Lu, D.; Schubring, J. Estimation of land surface temperature–vegetation abundance relationship for urban heat island studies. Remote Sens. Environ. 2004, 89, 467–483. [Google Scholar] [CrossRef]
  39. Zhuo, L.; Zheng, J.; Zhang, X.; Li, J.; Liu, L. An improved method of night-time light saturation reduction based on EVI. Int. J. Remote Sens. 2015, 36, 4114–4130. [Google Scholar] [CrossRef]
  40. Zhang, X.; Li, P. A temperature and vegetation adjusted NTL urban index for urban area mapping and analysis. ISPRS J. Photogramm. Remote Sens. 2018, 135, 93–111. [Google Scholar] [CrossRef]
  41. Tang, D.; Mao, M.; Shi, J.; Hua, W. The Spatio-Temporal Analysis of Urban-Rural Coordinated Development and Its Driving Forces in Yangtze River Delta. Land 2021, 10, 495. [Google Scholar] [CrossRef]
  42. DPYRDUA. Development Plan of Yangtze River Delta Urban Agglomeration (2016–2030). China’s State Council and the National Development and Reform Commission (NDRC). 2016. Available online: https://wenku.so.com/d/f97a08d068f4221945752b2dd2b3762a (accessed on 18 September 2023).
  43. Chen, J.; Chen, J.; Liao, A.; Cao, X.; Chen, L.; Chen, X.; He, C.; Han, G.; Peng, S.; Lu, M.; et al. Global land cover mapping at 30 m resolution: A POK-based operational approach. ISPRS J. Photogramm. Remote Sens. 2015, 103, 7–27. [Google Scholar] [CrossRef]
  44. Yang, Y.; Xiao, P.; Feng, X.; Li, H. Accuracy assessment of seven global land cover datasets over China. ISPRS J. Photogramm. Remote Sens. 2017, 125, 156–173. [Google Scholar] [CrossRef]
  45. Li, X.; Li, D.; Xu, H.; Wu, C. Intercalibration between DMSP/OLS and VIIRS night-time light images to evaluate city light dynamics of Syria’s major human settlement during Syrian Civil War. Int. J. Remote Sens. 2017, 38, 5934–5951. [Google Scholar] [CrossRef]
  46. Wan, Z. New refinements and validation of the MODIS Land-Surface Temperature/Emissivity products. Remote Sens. Environ. 2008, 112, 59–74. [Google Scholar] [CrossRef]
  47. Li, B.; Chen, D.; Wu, S.; Zhou, S.; Wang, T.; Chen, H. Spatiotemporal assessment of urbanization impacts on ecosystem services: Case study of Nanjing City, China. Ecol. Indic. 2016, 71, 416–427. [Google Scholar] [CrossRef]
  48. Angarita, H.; Guannel, G.; Perelman, A.; Arkema, K. InVEST User Guide. Available online: https://storage.googleapis.com/releases.naturalcapitalproject.org/invest-userguide/latest/en/index.html (accessed on 20 March 2023).
  49. Ding, Y.; Wang, l.; Gui, F.; Zhao, S. Ecosystem Carbon Storage in Hangzhou Bay Area Based on InVEST and PLUS Models. Environ. Sci. 2023, 44, 3343–3352. [Google Scholar] [CrossRef]
  50. Chen, D.; Deng, X.; Jin, G.; Samie, A.; Li, Z. Land-use-change induced dynamics of carbon stocks of the terrestrial ecosystem in Pakistan. Phys. Chem. Earth Parts A/B/C 2017, 101, 13–20. [Google Scholar] [CrossRef]
  51. Myeong, S.; Nowak, D.J.; Duggin, M.J. A temporal analysis of urban forest carbon storage using remote sensing. Remote Sens. Environ. 2006, 101, 277–282. [Google Scholar] [CrossRef]
  52. Hou, Y.; Müller, F.; Li, B.; Kroll, F. Urban-rural gradients of ecosystem services and the linkages with socioeconomics. Landsc. Online 2015, 39, 1–31. [Google Scholar] [CrossRef]
  53. Xu, Q.; Yang, R.; Dong, Y.-X.; Liu, Y.-X.; Qiu, L.-R. The influence of rapid urbanization and land use changes on terrestrial carbon sources/sinks in Guangzhou, China. Ecol. Indic. 2016, 70, 304–316. [Google Scholar] [CrossRef]
  54. Liu, X.; Wang, S.; Wu, P.; Feng, K.; Hubacek, K.; Li, X.; Sun, L. Impacts of urban expansion on terrestrial carbon storage in China. Environ. Sci. Technol. 2019, 53, 6834–6844. [Google Scholar] [CrossRef] [PubMed]
  55. Fu, Q.; Xu, L.; Zheng, H.; Chen, J. Spatiotemporal Dynamics of Carbon Storage in Response to Urbanization: A Case Study in the Su-Xi-Chang Region, China. Processes 2019, 7, 836. [Google Scholar] [CrossRef]
  56. Yu, M.; Guo, S.; Guan, Y.; Cai, D.; Zhang, C.; Fraedrich, K.; Liao, Z.; Zhang, X.; Tian, Z. Spatiotemporal Heterogeneity Analysis of Yangtze River Delta Urban Agglomeration: Evidence from Nighttime Light Data (2001–2019). Remote Sens. 2021, 13, 1235. [Google Scholar] [CrossRef]
  57. Li, C.; Zhao, J.; Thinh, N.; Xi, Y. Assessment of the Effects of Urban Expansion on Terrestrial Carbon Storage: A Case Study in Xuzhou City, China. Sustainability 2018, 10, 647. [Google Scholar] [CrossRef]
  58. Zhu, L.; Song, R.; Sun, S.-F.; Li, Y.; Hu, K. Land use/land cover change and its impact on ecosystem carbon storage in coastal areas of China from 1980 to 2050. Ecol. Indic. 2022, 142, 109178. [Google Scholar] [CrossRef]
  59. Zhang, Z.; Peng, J.; Xu, Z.; Wang, X.; Meersmans, J. Ecosystem services supply and demand response to urbanization: A case study of the Pearl River Delta, China. Ecosyst. Serv. 2021, 49, 101274. [Google Scholar] [CrossRef]
  60. Milesi, C.; Elvidge, C.D.; Nemani, R.R.; Running, S.W. Assessing the impact of urban land development on net primary productivity in the southeastern United States. Remote Sens. Environ. 2003, 86, 401–410. [Google Scholar] [CrossRef]
  61. Grimm, N.B.; Faeth, S.H.; Golubiewski, N.E.; Redman, C.L. Global Change and the Ecology of Cities. Science 2008, 319, 756–760. [Google Scholar] [CrossRef]
  62. Niu, L.; Zhang, Z.; Liang, Y.; Huang, Y. Assessing the Impact of Urbanization and Eco-Environmental Quality on Regional Carbon Storage: A Multiscale Spatio-Temporal Analysis Framework. Remote Sens. 2022, 14, 4007. [Google Scholar] [CrossRef]
Figure 1. Location and land use of the YRD urban agglomeration (2020).
Sustainability 15 14548 g001
Figure 2. Dataset for evaluating the level of urbanization.
Sustainability 15 14548 g002
Figure 3. Research framework.
Sustainability 15 14548 g003
Figure 4. TVANUI spatial distribution of the Yangtze River Delta urban agglomeration.
Sustainability 15 14548 g004
Figure 5. (a) TVANUI variation distribution of the YRD in 2000–2020. (b) Distribution map of areas with different urbanization levels.
Sustainability 15 14548 g005
Figure 6. Spatial distribution of carbon storage in the Yangtze River Delta urban agglomeration.
Sustainability 15 14548 g006
Figure 7. Regression analysis of carbon storage and urbanization level in each study cell.
Sustainability 15 14548 g007
Figure 8. Spatiotemporal distribution of carbon storage changes in areas with three urbanization levels. A1A2: Changes in carbon storage in developed urban area of Shanghai. B1B2: Changes in carbon storage in developing urban area of Nanjing. C1C2: Changes in carbon storage in rural area of Hefei.
Sustainability 15 14548 g008
Figure 9. Spatiotemporal variation characteristics of carbon storage in response to urbanization. (a) Spatial variation of carbon storage in response to urbanization. (b) Temporal variation of cabon storage in response to urbanization.
Sustainability 15 14548 g009
Figure 10. Response of carbon storage change density to urbanization in areas with different urbanization levels from 2000 to 2020.
Sustainability 15 14548 g010
Figure 11. The distributions of the DMSP/OLS NTL (a) and TVANUI (b) in three cities of YRD. (Black lines represent the extent of the built-up area).
Sustainability 15 14548 g011
Figure 12. Quantification of urbanization level in urban–rural latitude transect by TVANUI and NTL.
Sustainability 15 14548 g012
Table 1. Classification indicators for areas with different urbanization levels.
ConditionsUrbanization Levels
T V A N U I 2000 ≥ 0.397 and T V A N U I 2020 ≥ 0.397Developed urban area
T V A N U I 2000   < 0.397 and T V A N U I 2020   ≥ 0.397Developing urban area
T V A N U I 2000   < 0.397 and T V A N U I 2020   < 0.397Rural area
Table 2. Carbon density of different land use types in the Yangtze River Delta urban agglomeration.
Types of Land UseCarbon Density (t/hm2)
D p _ a b o v e D p _ b e l o w D p _ s o i l D p _ d e a d
Cultivated land18.912.585.52.4
Forest36.37.3125.83.4
Grassland17.420.8112.22.9
Water area0081.10
Artificial surface16.23.2730
Unused land24.34.974.62.2
Table 3. Urbanization level of provinces and cities in the YRD from 2000 to 2020.
YearShanghaiAnhuiJiangsuZhejiangYRD
20000.2590.0190.0650.0440.043
20100.4730.0520.1690.1090.110
20200.5110.1010.2450.1880.175
Table 4. Changes in carbon storage (106Tg C) in 2000–2020.
Area/Time200020102020 2000–20102010–20202000–2020
Shanghai84.3482.8282.66−1.51 −0.16 −1.68
Jiangsu1166.901160.491142.44−6.41 −18.05 −24.46
Zhejiang1567.661561.561544.95−6.10 −16.61 −22.71
Anhui1840.691834.011823.98−6.68 −10.04 −16.72
YRD4659.594638.884594.03−20.71 −44.86 −65.57
Table 5. Correlation between TVANUI index and carbon storage in 2000–2020.
Indicators200020102020
TVANUI and Carbon Storage−0.482 **−0.560 **−0.632 **
** indicates the correlation is significant at the level of 0.01 (two-tailed).
Disclaimer/Publisher’s Note: The statements, opinions and data contained in all publications are solely those of the individual author(s) and contributor(s) and not of MDPI and/or the editor(s). MDPI and/or the editor(s) disclaim responsibility for any injury to people or property resulting from any ideas, methods, instructions or products referred to in the content.

