Abstract
Leakage from a submarine oil pipeline would have a great impact on the environment and ecological balance. Accurate detection of pipeline defects can ensure safety in the transportation of oil resources. The traditional detection optimization algorithm may lead to the absence of effective features. An adaptive compressive sensing image data augmentation method that analyzes the pixel distribution of small defect features has been proposed to solve these issues. On the basis of Focal-EIoU, a new box loss of Focal-GIoU is proposed which is suitable for pipeline defect detection. Furthermore, the incorporation of bi-level routing attention diminishes the reliance of Yolov5 on specific inputs effectively, thereby enhancing the generalization ability of the detection model. Comparative experiments show that compared with the conventional Yolov5 model, this method improves mAP50 and mAP50:95 by 6.4% and 15.1%, respectively, with mAP50 reaching 91.5% and mAP50:95 reaching 52.9%.
1. Introduction
Pipelines serve as common devices for transporting industrial media. In various industrial sectors, pipeline transportation is extensively employed due to its cost-effectiveness and remarkable safety standards. Located underground or underwater, many oil and gas pipelines encounter challenges related to corrosion and maintenance difficulties [1,2].
Given their critical role as an energy source, ensuring the secure transportation of oil and gas is pivotal in ensuring the sustainable utilization of energy resources. Magnetic leakage detection technology for pipelines offers a non-contact approach for identifying liquid or gas leakage within the pipeline. This method boasts several advantages, including real-time detection, high sensitivity, wide detection range, safety, and reliability, making it the primary approach for pipeline defect detection [3,4].
Magnetic flux leakage internal inspection is an applied technology based on the principles of electromagnetics. The main target of pipeline magnetic leakage detection is to diagnose the health of pipelines efficiently and accurately. A crucial research direction involves the analysis of pipeline MFL (magnetic flux leakage) data to extract information regarding the size and location of defects. In their study, X. Wang et al. employed finite element simulation to quantitatively analyze individual defects in pipeline MFL data. They achieved this by extracting the peak value and time span of the defect MFL signal as notable features [5]. Furthermore, several studies have employed the restoration of the original excitation field to model the characteristics of the defects [6]. In fact, the conditions and safety requirements for pipeline transportation of petroleum and natural gas chemicals are very harsh.
In real industrial environments, there exists a vast amount of pipeline and defect data. It is evident that utilizing finite element simulation to analyze the extracted defect features can be highly inefficient. Therefore, in recent years, with the widespread application of machine learning algorithms in various industrial scenarios, the research focus of pipeline magnetic leakage detection has shifted from the design of detection hardware to the development of detection algorithms.
Machine learning can be divided into unsupervised learning and supervised learning according to the processing method of sample labels, and in supervised learning, it can be further divided into shallow learning and deep learning based on the number of neural network layers. Unsupervised learning determines the classification center or designs the classification hyperplane by calculating the Euclidean distance of the samples. Pacheco and H. Heidarzadeh used K-nearest neighbor classifiers and decision trees to classify sensor magnetic leakage data and achieved high accuracy in noisy environments [7,8]. The improvement of unsupervised learning can make features more prominent by adding optimization algorithms to the samples. Hou et al. proposed an unsupervised pipeline magnetic leakage detection method based on K-means clustering and adaptive particle swarm optimization algorithms that not only improves clustering accuracy but also ensures computational efficiency [9]. In addition, ref. [10] proposed a pipeline magnetic leakage detection optimization method based on principal component analysis and a genetic algorithm, which can automatically select the optimal number of samples and sensor positions to improve detection efficiency. In the research of unsupervised learning in pipeline magnetic leakage detection, simulation and modeling are mostly used as research methods. Due to the algorithmic characteristics of unsupervised learning, its performance is significantly reduced when faced with samples that have more singular values and outlier values.
The actual environment in which pipelines are located is very complex, which makes it difficult for the detection accuracy of unsupervised learning detection models to meet the usage requirements. In order to improve the robustness of the detection model, supervised learning has become the most concerned direction in pipeline magnetic leakage detection in recent years. For example, ref. [11] proposed a magnetic leakage detection method based on empirical mode decomposition and support vector machines, which extracts features by decomposing the short-time spectrum of signals and classifies features using support vector machines. In order to further improve the feature extraction capability of the detection model, research also focuses on the use and optimization of deep neural networks. For example, ref. [12] proposed a novel convolutional neural architecture (SE-CNN), which combines spectrum enhancement (SE) and convolutional neural network (CNN). The author of [13] proposed an improved method based on deep residual network with channel-wise thresholds (DRSN-CW) to improve the detection accuracy with GPLA-12 dataset. The optimization of deep learning algorithms mainly focuses on model structure improvement, such as [14] propose to add feature fusion and enhancement module, deformable convolution module and context pooling module. In this way, the feature extraction ability of neural network can be improved. The authors of [15] proposed a pipeline magnetic leakage detection optimization method based on deep reinforcement learning, which can independently learn optimization strategies and quickly converge to the optimal solution. The existing algorithm optimization ideas mainly focus on the model improvement of deep neural networks or adding more layers to the network, which will increase the parameters of the detection model and bring more manpower costs to the labeling of the dataset [16]. On the other hand, the signal-to-noise ratio of pipeline magnetic leakage images is relatively low, and most of the existing research ignores preprocessing of images, which is also an important reason that the performance improvement of detection models is restricted. Due to the expensive nature of acquiring MFL data in subsea oil and gas pipelines, there is a scarcity of available data samples. This presents significant challenges for data-driven detection algorithms. This paper specifically focuses on enhancing the accuracy of the detection model using small sample datasets and optimizing the detection performance. The specific work is as follows:
- A method based on adaptive compressed sensing is proposed for image data enhancement. This method can give adaptive image compression parameters according to different image data, reduce the redundancy of irrelevant information in the image, and retain key features of small targets. As an image preprocessing method, it improves the efficiency of image processing without affecting the number of model parameters.
- Based on the design principles of Focal-EIOU, a Focal-GIoU loss suitable for small target detection is proposed. This method can effectively suppress the weights of low-quality samples and improve the weights of high-quality samples. Compared with Focal-EIOU, GIoU loss can punish the detection model through penalty terms to achieve higher detection accuracy and avoid performance degradation caused by overlapping detection boxes. It is more suitable for pipeline magnetic leakage detection.
- Bi-level routing attention is applied to the detection layer of the Yolov5 target detection algorithm, which improves the feature extraction capability and feature map fusion capability of the detection algorithm. By comparing it with conventional attention mechanisms, it is shown that the proposed method improves the detection performance of pipeline magnetic leakage.
This paper summarizes the above-mentioned methods and presents a complex pipeline leak detection model that is efficient, highly accurate, and provides better detection performance for small targets.
2. Proposed Methods
- A.
- Detection model
A detection model suitable for detecting small defects in pipeline leakage is designed based on the backbone network of the Yolov5 model. In order to improve the efficiency of the model in image processing, the pipeline leakage detection image is adaptively compressed at the input end. The processed image is normalized in the form of three channels and resized to a resolution of 640 × 640, and then input into the Yolov5 model. After the model obtains the smallest feature map through multiple layers of convolution, bi-level routing attention is introduced to improve the sensitivity of the detection model to small features. Three different resolution feature maps are outputted through feature fusion to perform detection. Focal-GIoU loss is applied in the detection module to improve the convergence speed of the detection model and further improve the detection accuracy. The proposed detection model structure is shown in Figure 1.
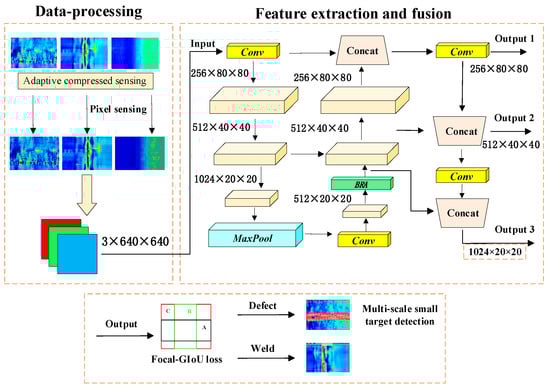
Figure 1.
Pipeline magnetic flux leakage small defect detection model.
- B.
- Image data enhancement
Image data enhancement can improve the feature differences and representation capability of samples and is a common data preprocessing method for detecting small samples. In addition, image data enhancement can reduce the sensitivity of the model to data by smoothing noise, and improve the generalization ability of the detection model, which is a unique regularization method for machine learning algorithms. In this section, a compressive sensing-based image data enhancement method is proposed according to the small defect characteristics of pipeline leakage images, which improves the image processing speed and detection accuracy of the detection model.
- (1)
- Magnetic flux leakage data visualization
Here, D is the data matrix, i and j are the sampling positions, and xi,j is the amplitude of the sampling signal.
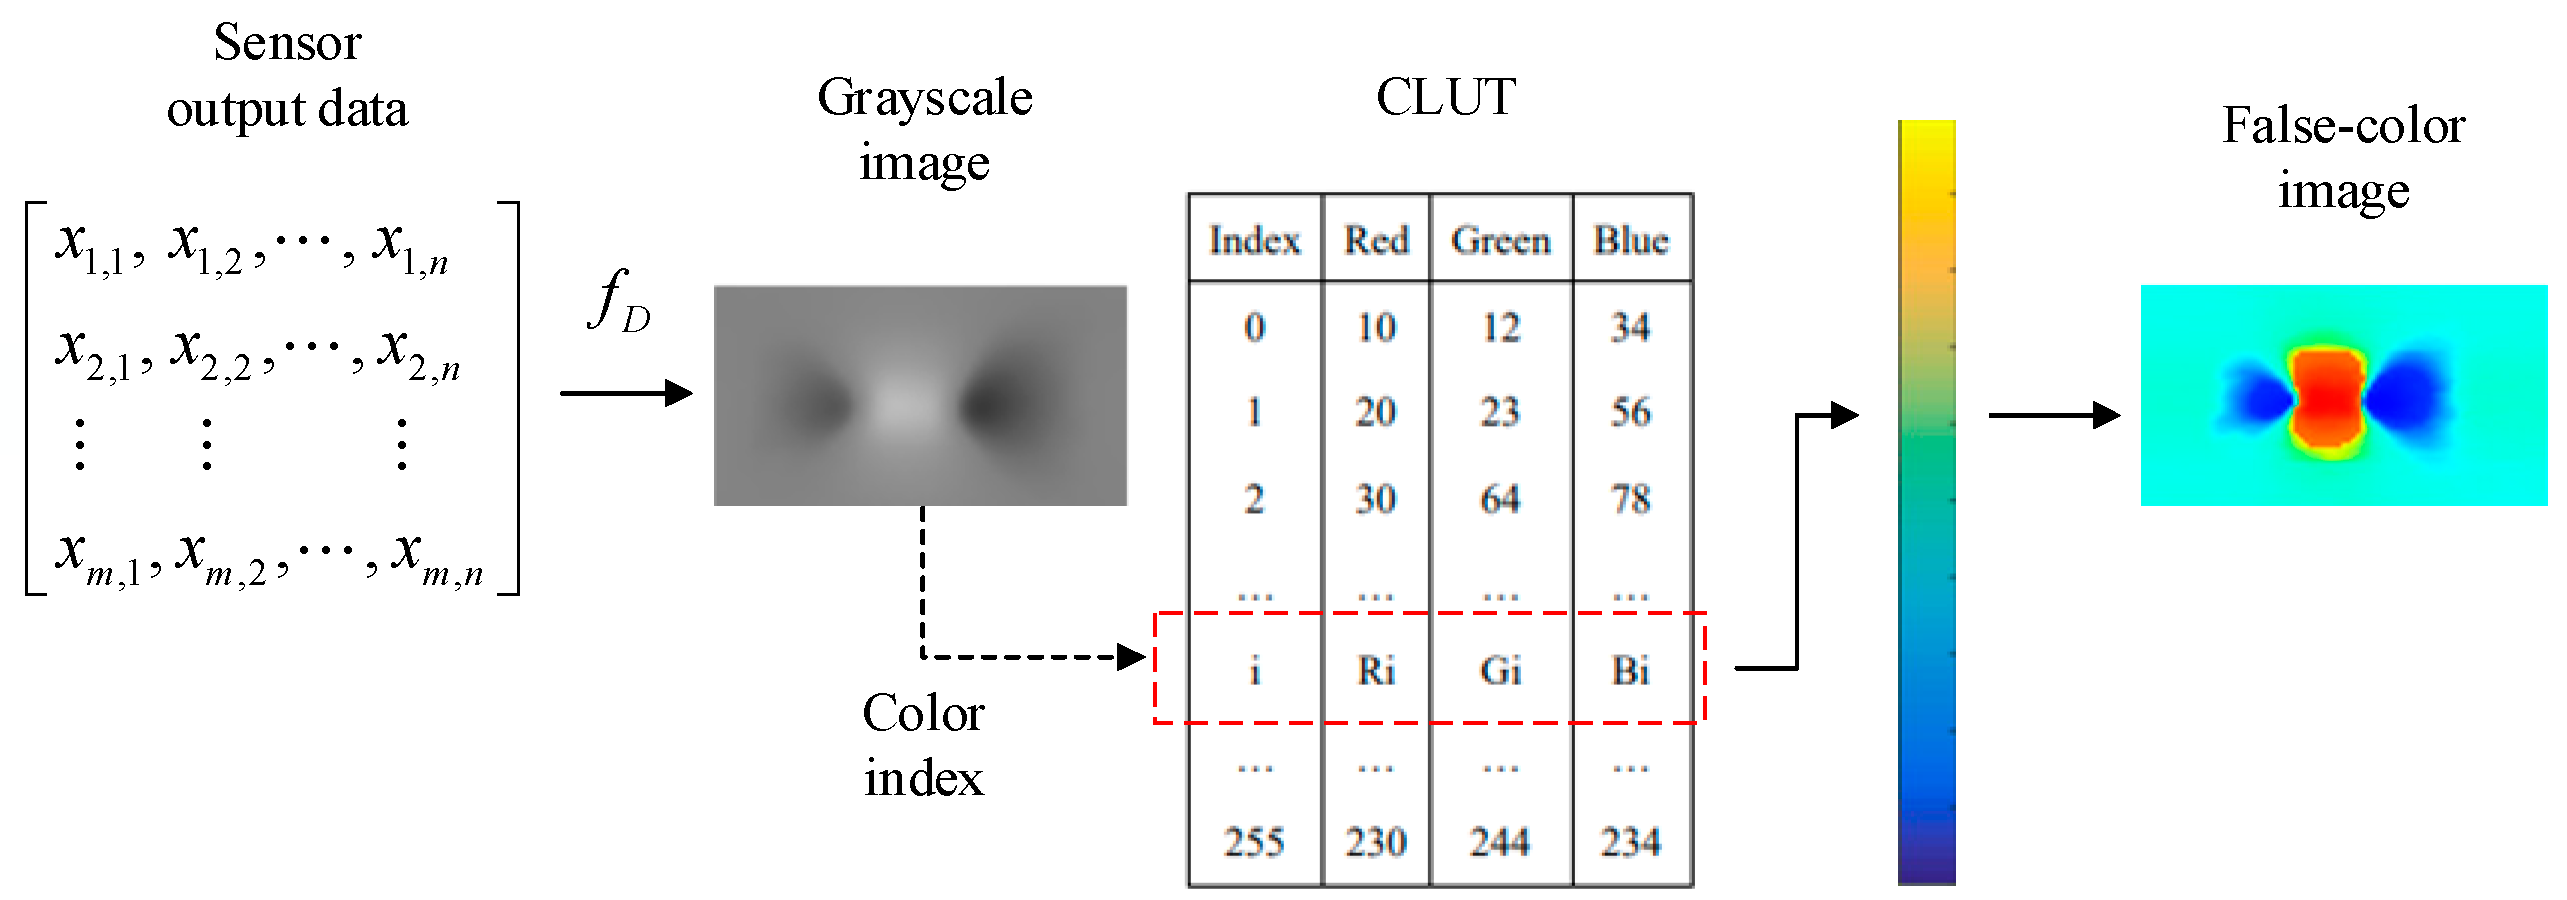
By mapping the axial data matrix of pipeline leakage flux into grayscale, the spatial distribution of the magnetic leakage signal can be visualized as a grayscale image. The pixel values in the grayscale image can be used as the index of the color lookup table (CLUT) to convert the image into a three-channel RGB false-color image [17]. The matrix transformed by grayscale mapping can be represented as
where is the grayscale mapping relationship, is the grayscale matrix. The pseudo-color mapping relationship can be expressed as Equation (3):
The visualization method for magnetic leakage detection data is shown in Figure 2:

Figure 2.
Pipeline magnetic leakage flux data visualization process.
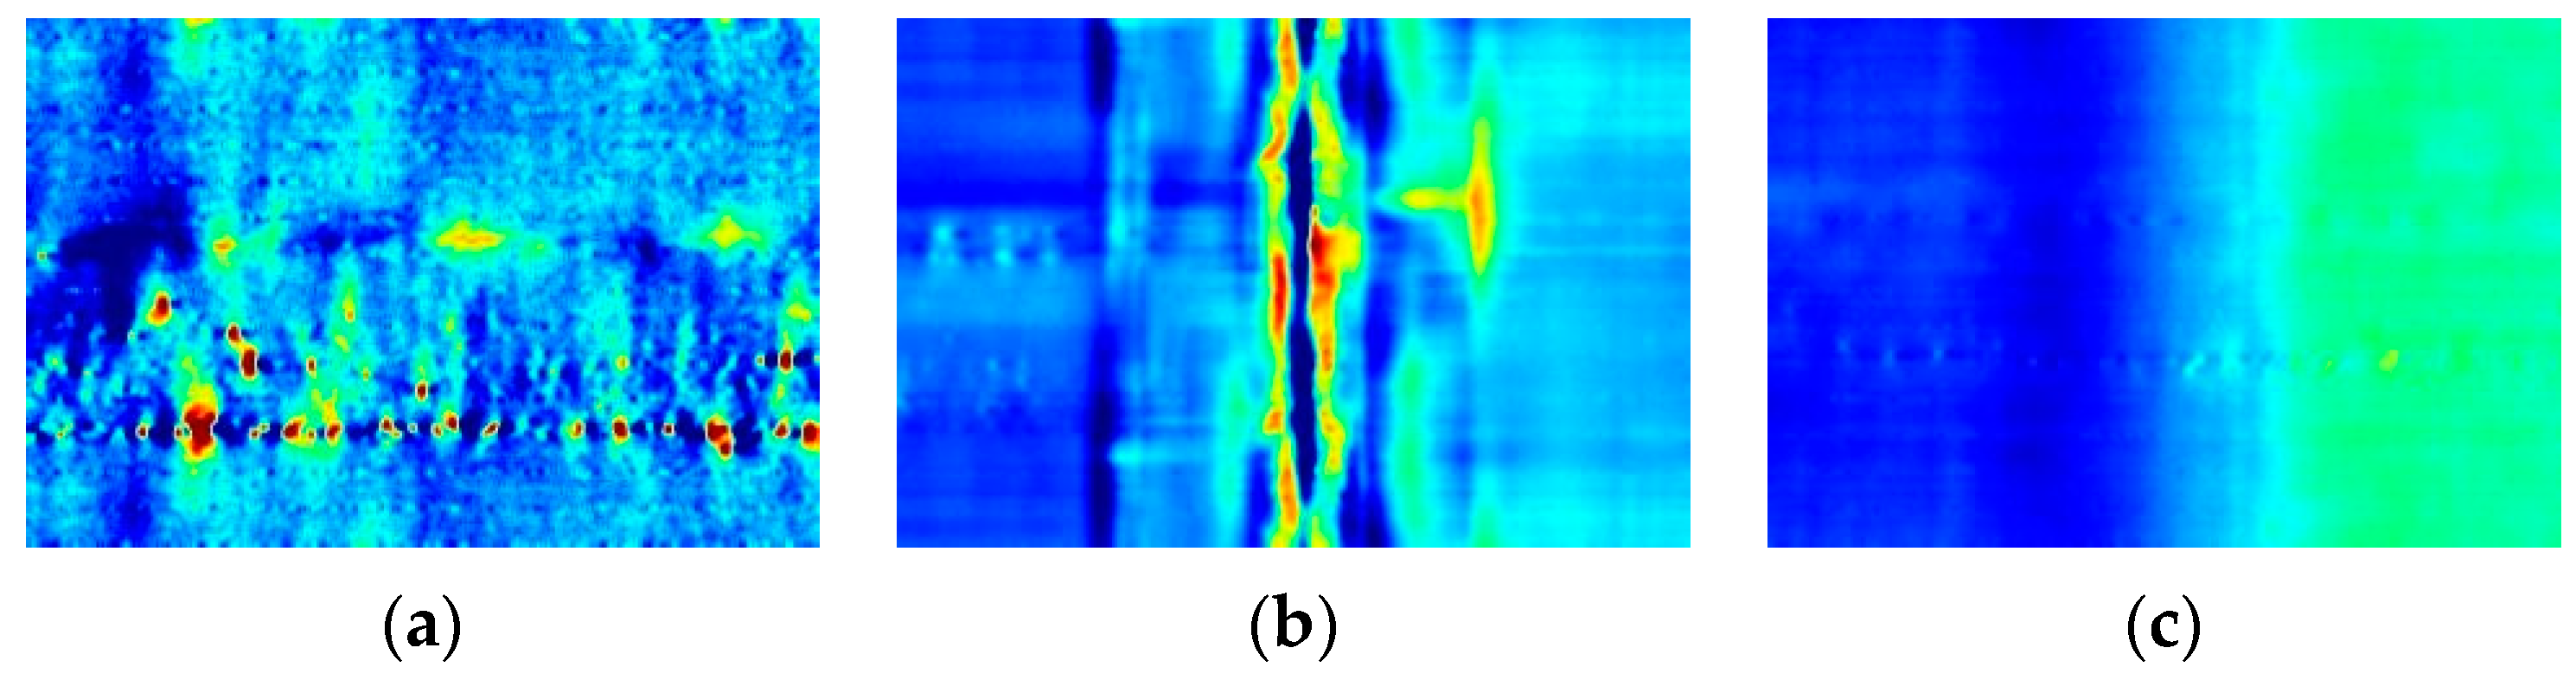
The visualized pipeline magnetic leakage image data is shown in Figure 3.
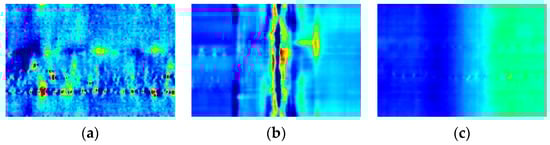
Figure 3.
Pipeline leak magnetic image data. Among them, (a) is a pipeline with small defects, (b) is a pipeline with welded joints, and (c) is a pipeline without defects.
- (2)
- Adaptive Compressive Sensing
Compressed sensing (CS) is a signal processing technique that achieves efficient compression by quickly and effectively acquiring sparse representations of signals. Compared to traditional signal compression methods, CS can capture the main features of a signal with a small number of random measurements during signal acquisition, greatly improving the efficiency of information collection; thus, CS has been used to improve the sampling performance of detectors [18,19]. In addition, CS uses sparse sampling combined with density detection algorithms to achieve higher data compression rates with minimal loss of signal information. In summary, compressed sensing transforms signal sampling into feature information sampling [20,21,22]. For a N-dimensional discrete signal , it can be represented in the form of Equation (4):
where is a set of standard orthogonal bases, . is called the sparse basis of the signal x, and the signal X is K-sparse when x has only K non-zero coefficients αk on it.
If compressed sensing reconstruction is applied to the signal X, the first step is to project the sparse coefficients αk onto an M × N-dimensional observation basis that is unrelated to , resulting in M observation values. This process can be expressed as Equation (5).
Solving the optimization problem in Equation (6) or Equation (7) yields the sparse domain coefficients, and the original signal can be reconstructed through inverse transform.
In this paper, Haar wavelets are applied to compressed sensing processing of pipeline leakage magnetic images.
Classification and position detection of small defects, as well as distinguishing defects and welds, are the basic requirements for pipeline defect detection. Therefore, images with small defects and welds contain more feature information. However, fixed global compression thresholds are often applied in image compressed sensing reconstruction, which may lead to the loss of some important feature information in the sparse sampling of the image. To address this issue, we propose an adaptive image compressed sensing method. As shown in Figure 2, small pipeline defects and welds appear as red in leakage magnetic images. Therefore, by determining the proportion of red pixels in the image, it is possible to determine if there is important feature information in the image. Based on this, the adaptive compressed sensing (ACS) method is designed as follows:
Step 1: Detect the pixel values of the three channels. If R > 200, G < 100, and B < 100, the pixel is determined to be red.
Step 2: Calculate the percentage of red pixels in the entire image.
Step 3: Perform classified compressed sensing on the image based on Formula (8).
Here, represents the percentage of red pixels in the image, and CR represents the compression ratio. We prepared a dataset of 530 images that were manually annotated, then calculated the percentage of red pixels in each image. For leakage magnetic images with small pipeline defects and welds, the percentage of red pixels ranged from a maximum of about 6.4 × 10⁻⁴ to a minimum of about 1.8 × 10⁻⁴, when only considering the top 75% of images ordered in terms of increasing percentage of red pixels.
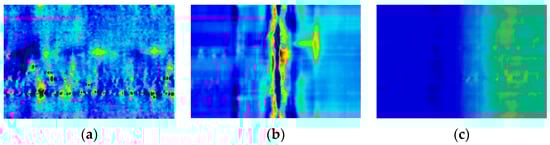
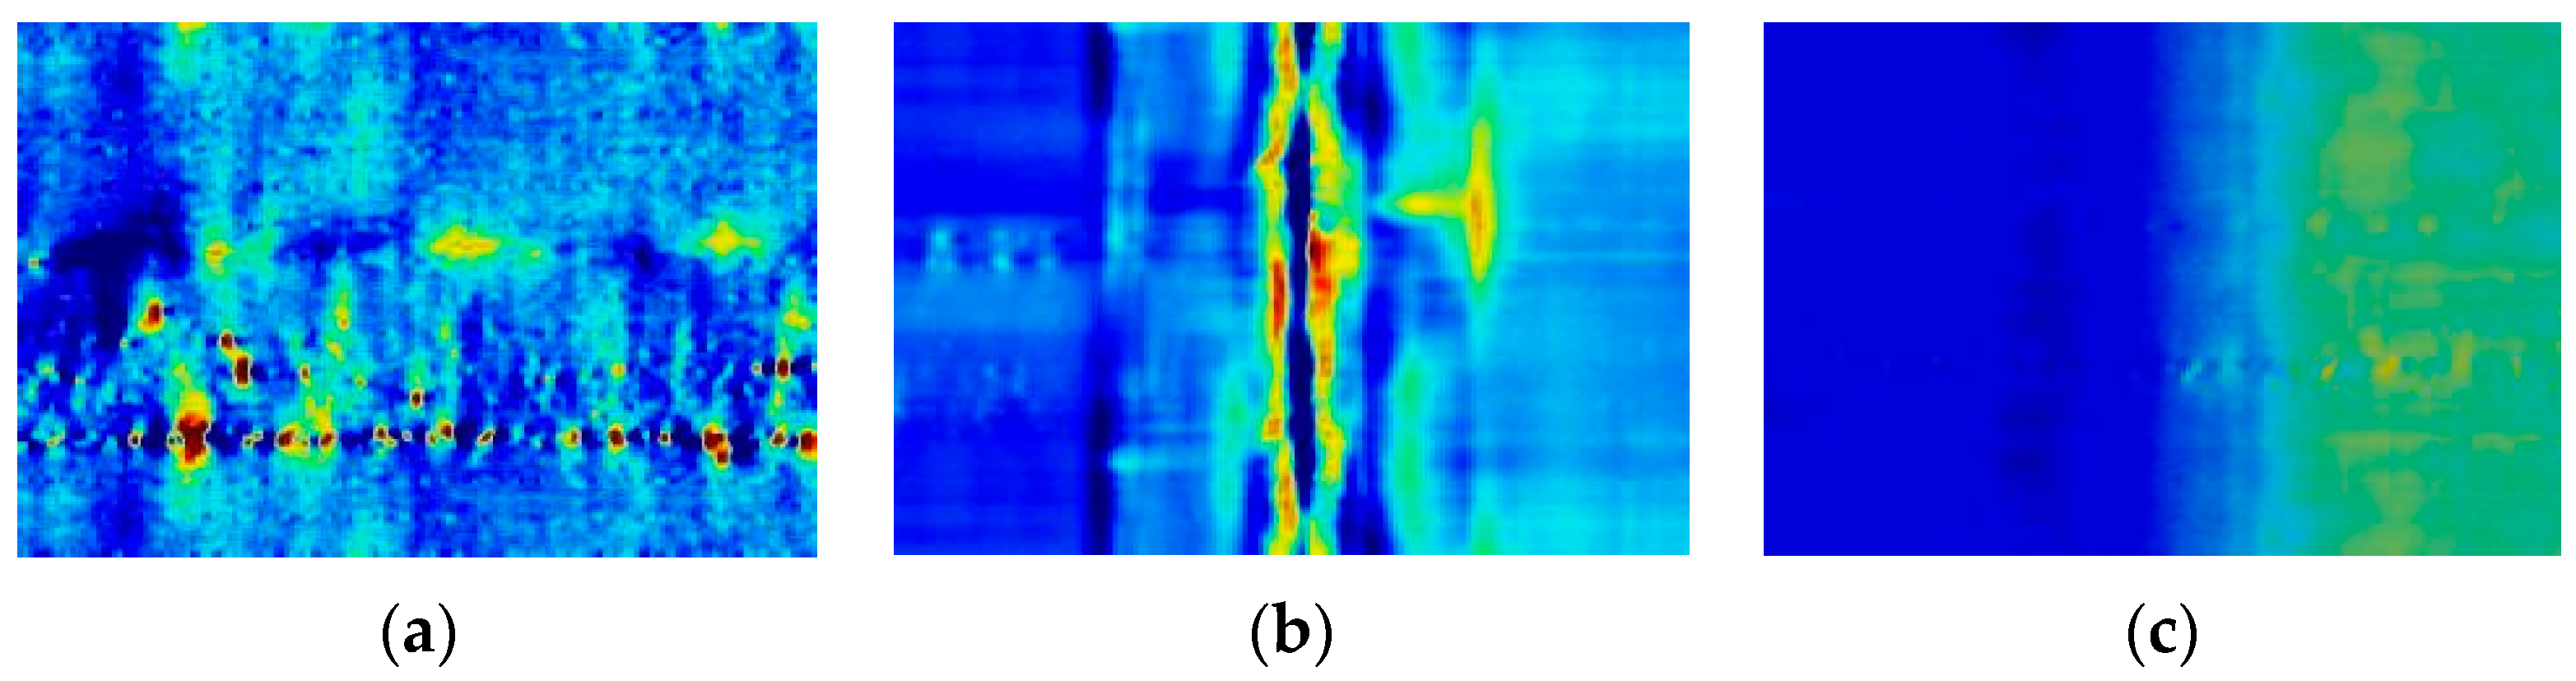
Figure 4.
Images after adaptive compressed sensing, where (a) represents a pipeline with small defects, (b) represents a pipeline with welds, and (c) represents a defect-free pipeline.
As an image data enhancement technique, this method can be easily integrated with model regularization methods. This approach helps address the issue of excessive model parameters that can arise from utilizing multiple model optimization methods simultaneously.
- C.
- Bounding box loss optimization
In object detection tasks, intersection over union (IoU) is an important metric for measuring the accuracy of object detection [23]. The detection algorithm can gradually improve the correlation between the predicted target position and the actual target position by reducing the IoU loss. However, in practical applications, there are far more low-quality image data samples than high-quality ones. Low-quality samples contribute most of the gradients, thereby limiting the regression of anchor boxes. In this chapter, based on the design of Focal-EIoU and the characteristics of the pipeline leakage magnetic dataset, a unique Focal-GIoU IoU optimization method is proposed.
- (1)
- Anchor Box Weight Balancing
To balance the contribution of high-quality and low-quality samples to the loss, the authors in reference [24] propose a method for directly optimizing the regression parameters of the loss. The IoU-based function can be represented as Equation (9):
Here, Bgt represents the actual ground-truth box, and B represents the predicted box by the algorithm. In order to combine the distance loss of anchor boxes and aspect ratio loss, reference [24] proposes a novel loss function called EIoU loss, which is defined as follows:
Furthermore, to enhance the weight of high-quality anchor boxes, a Focal L1 loss function is designed as follows:
Here, α and β are parameters. In order to make the EIoU loss pay more attention to high-quality samples, it can be used to replace x in the above equation. Finally, the proposed Focal-EIoU loss is as follows:
where γ is a parameter, which usually set to 0.5.
- (2)
- Focal-GIoU
Other commonly used variations of IoU include CIoU, DIoU, and GIoU. DIoU only considers the center point distance loss without taking into account the aspect ratio of the anchor box, while CIoU suffers from the problem that the length and width of the anchor box cannot be increased or decreased simultaneously [25]. GIoU uses a penalty term to encourage the network to select larger anchor boxes that intersect with the ground-truth box, which improves the detection performance. However, when two boxes have a containment relationship, GIoU degenerates into IoU loss and significantly slows down the convergence of the loss. In the pipeline leakage image dataset, the labeled boxes for defects are independent of each other, and connected defects are labeled as one sample. Therefore, the condition of containment is excluded, and GIoU can achieve better detection performance.
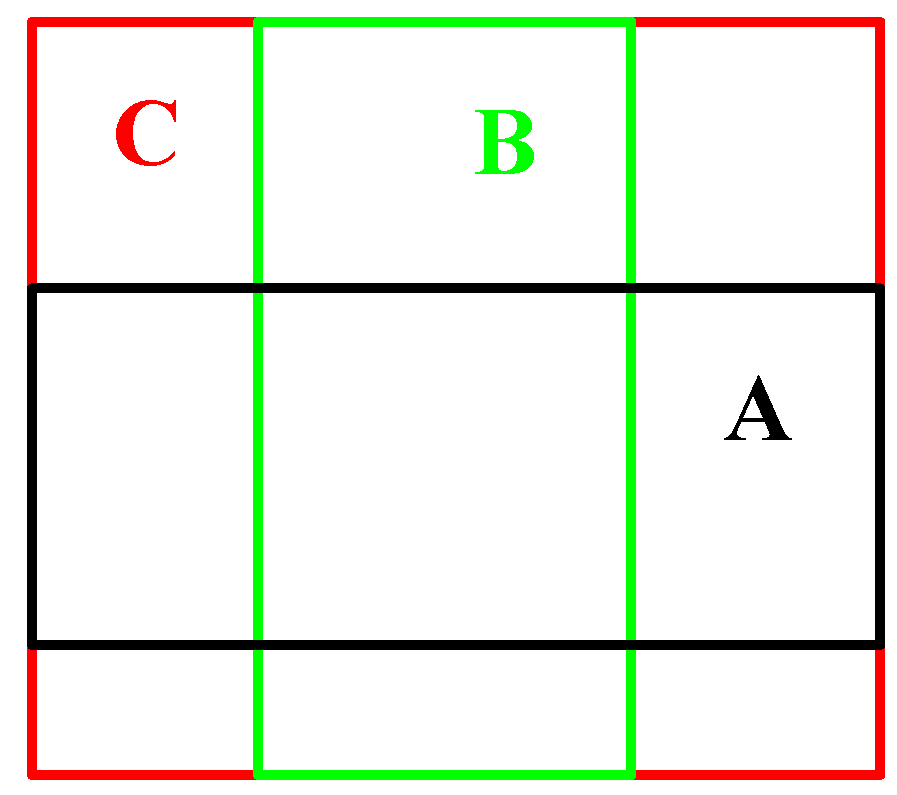
The idea of GIoU is to first find the minimum bounding box C that encloses any two boxes A and B. Then the ratio of the area of C\(A ∪ B) to the area of C is calculated, and the GIoU is obtained by subtracting this ratio from the IoU value of A and B, as shown in Figure 5:
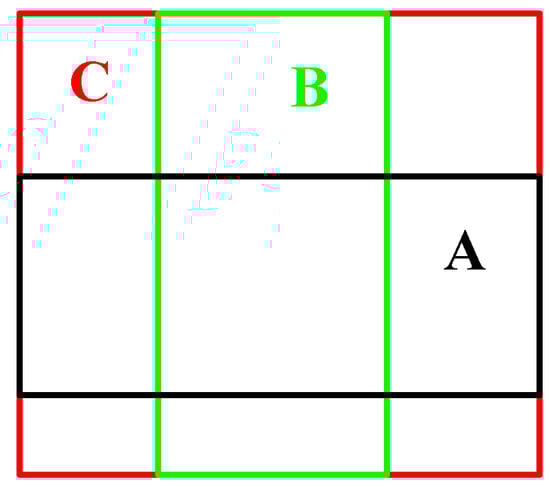
Figure 5.
Illustration of GIoU.
The GIoU loss is defined as shown in Equation (13):
Combining Focal L1 loss in Equation (12) and GIoU loss in Equation (13) the Focal-GIoU loss is defined as shown in Equation (14):
- D.
- Bi-Level Routing Attention
In this section, a new type of dynamic sparse attention mechanism, bi-level routing attention [26], will be introduced based on the Yolov5 detection algorithm. Compared with traditional attention mechanisms, this method reduces the number of parameters and memory occupancy and improves the efficiency and performance of image processing.
Bi-level routing attention (BRA) realizes flexible calculation allocation through dual-layer routing. The implementation method is as follows: for an input image , it is divided into S × S different regions. Each region contains feature vectors, that is, X is transformed into . Parameters Q, K, and V can be obtained through linear mapping, as shown in Equation (15):
Here, , , are the projection weights of query, key, and value. By constructing a directed graph to determine the regions affected by attention, the average of query and key values in each region is computed, and the region correlation matrix is given as shown in Equation (16):
By using the top k links of each region as routing indices, the routing index matrix can be obtained through the region correlation matrix, as shown in Equation (17):
Here, is the routing index matrix, and row i of contains the k region indexes with the greatest correlation before the i region. Fine-grained, token-to-token attention can be achieved using the route index matrix.
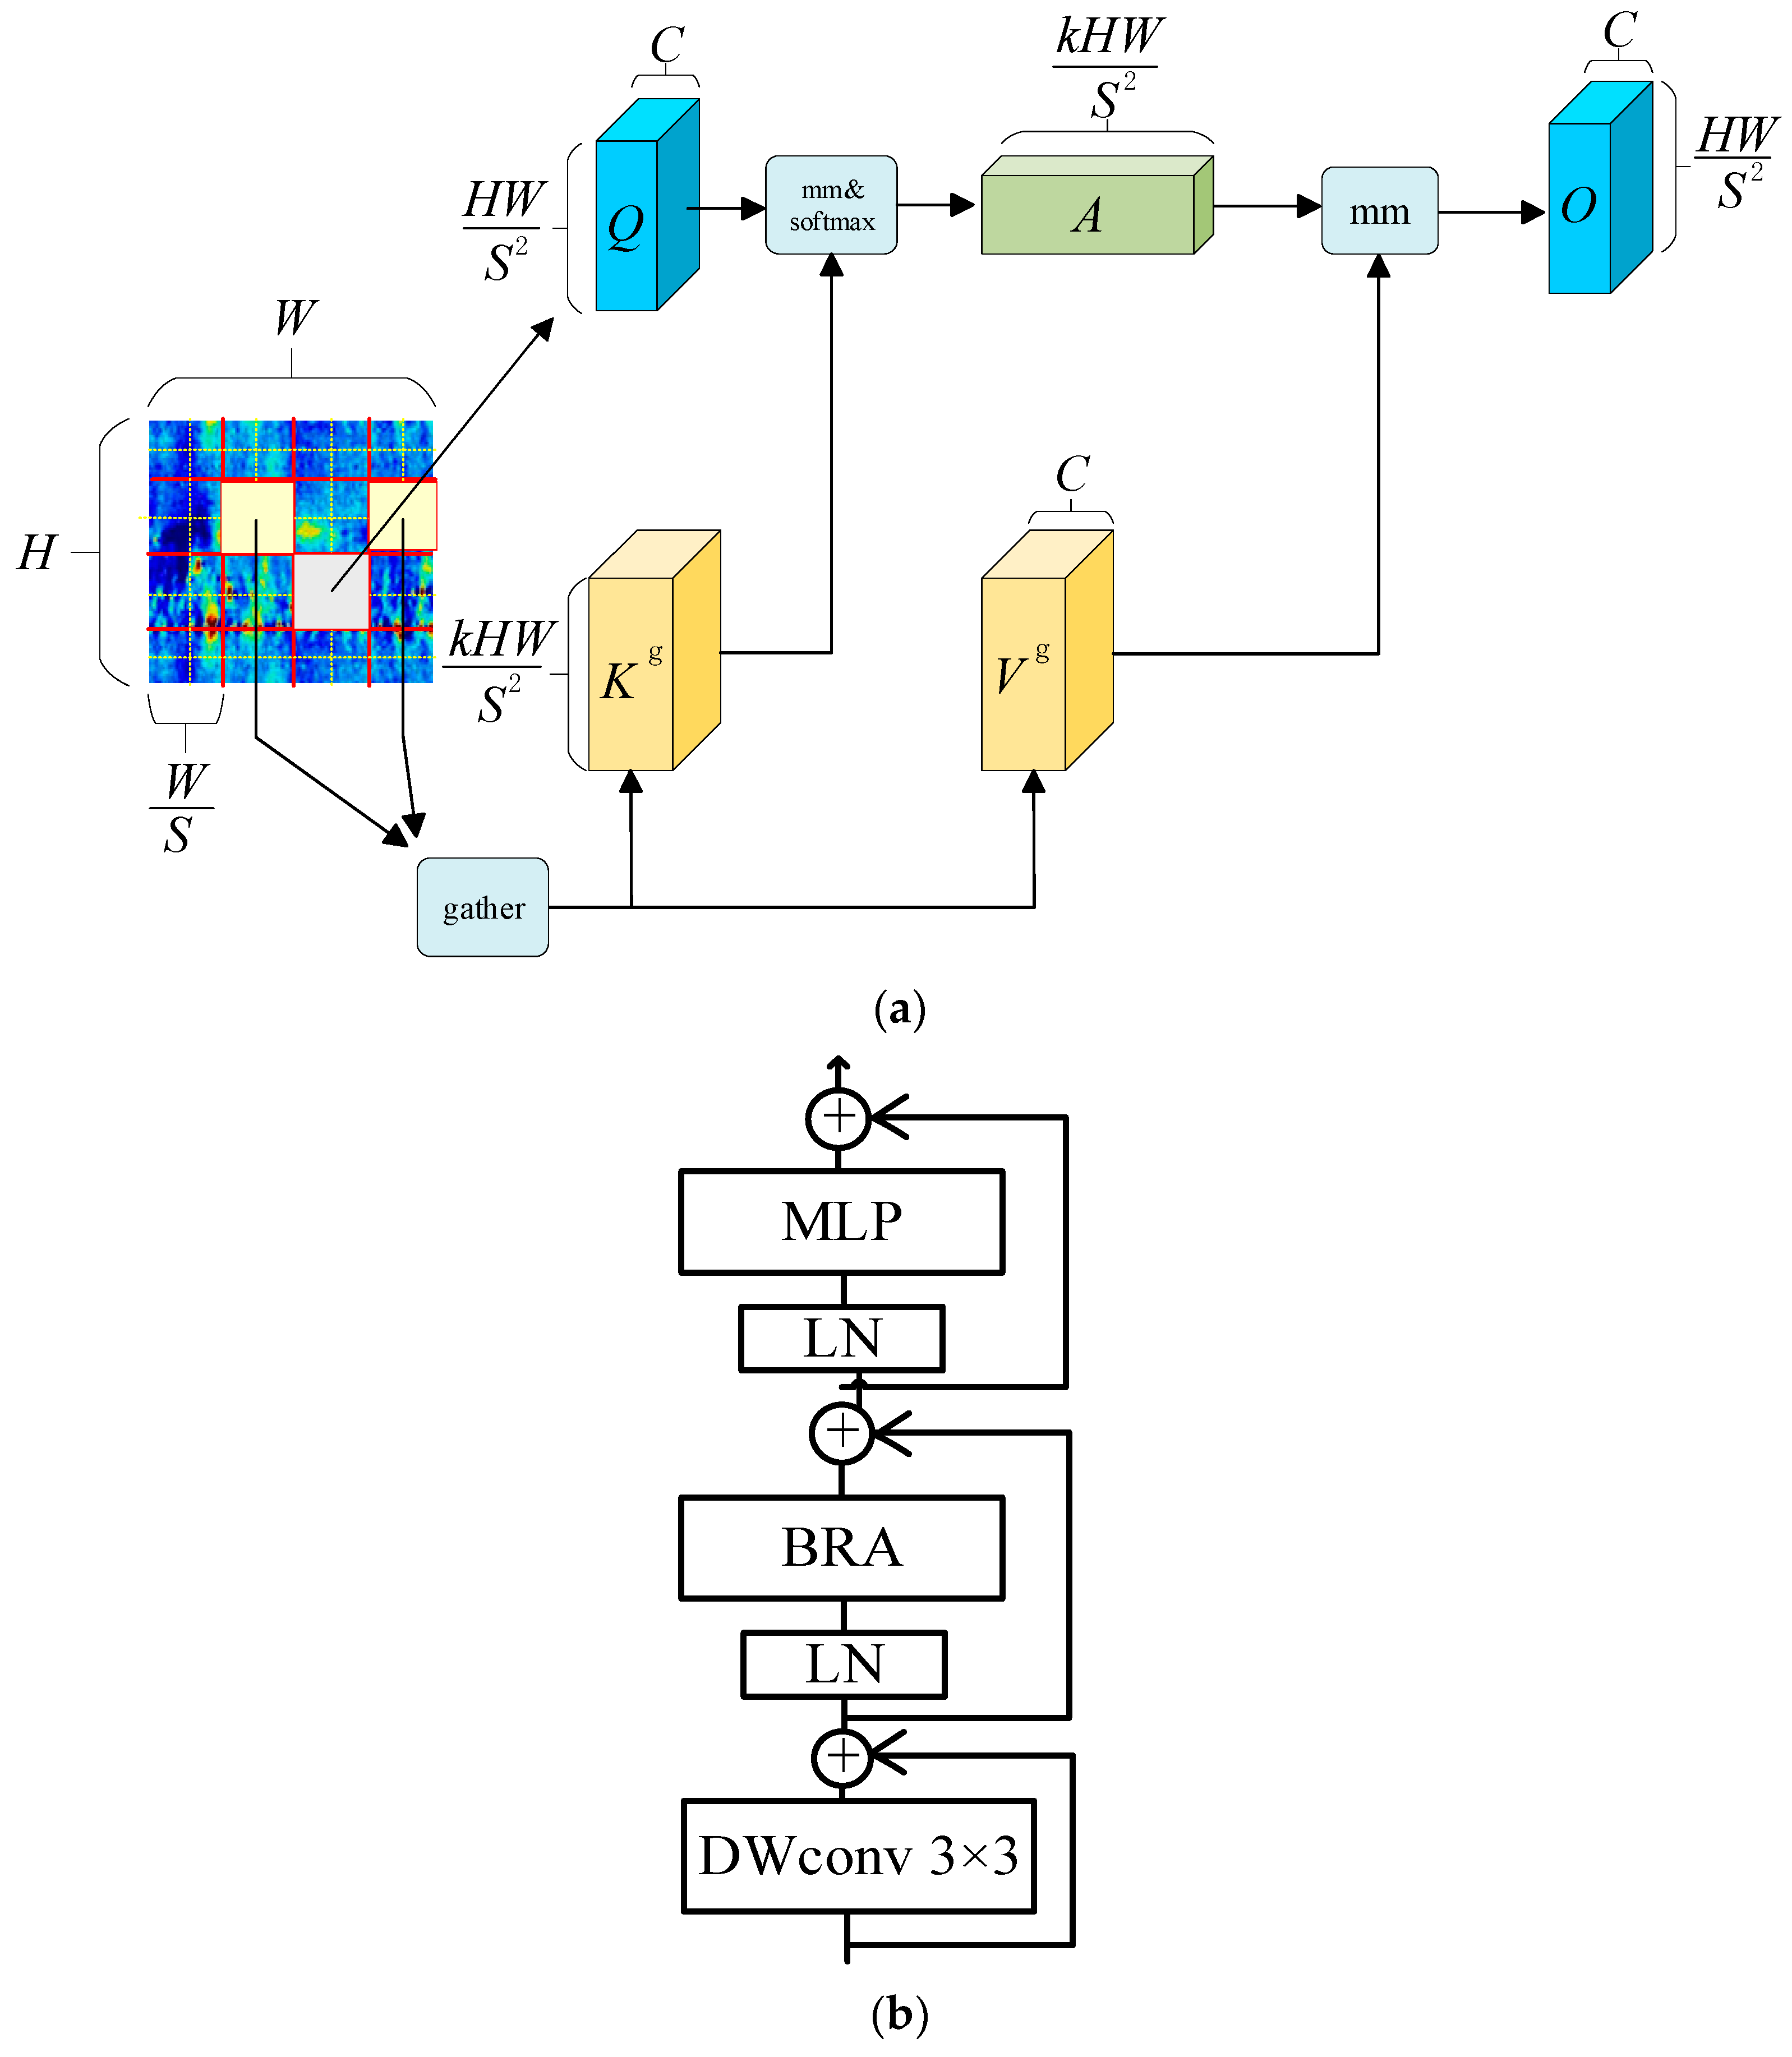
Here, and are the keys and values after tensor clustering, and LCE(V) is a function for locally enhancing context. The implementation process and BiFormer architecture of BRA are shown in Figure 6.

Figure 6.
BiFormer structure diagram, where (a) is a BRA schematic and (b) is a BiFormer architecture diagram.
The BRA module is essentially sparse sampling rather than down-sampling. This approach collects key-value pairs from the top-k correlated windows and uses sparsity operations to skip the computation of the least relevant regions, saving parameter and computation costs. Therefore, this method can preserve fine-grained details while reducing the computational cost, making it particularly friendly for small object detection.
3. Experimentation and Analysis
In this section, three sets of experiments were designed to verify the detection performance of the proposed method. Firstly, we conducted comparative experiments by applying the idea of focal loss to multiple IoUs. Secondly, we added various attention mechanisms to the feature fusion part of the detection module and tested the detection performance. Finally, we conducted ablation experiments to analyze the roles of the three proposed components and to verify the advantages of the proposed detection model. The performance evaluation indicators and their calculation methods are shown in Equations (19)–(22):
We divided the 530 image data into a training set of 480 images and a validation set of 50 images. The experiments in this paper were implemented based on the PyTorch framework and Python 3.8. The hardware environment was CPU i7-9500H and GPU RTX 2060 6G.
- A.
- IoU Loss Comparative Experiment
In order to validate the improvement of Focal-GIoU on detection algorithm performance, we took Yolov5 as the target detection algorithm, and combined CIoU, DIoU, and GIoU with Focal L1 loss, and appropriately added the alpha algorithm [27]. The hyperparameters of the experiments in this chapter were as follows: batch size = 8; learning rate = 0.005; momentum parameter = 0.9; weight decay parameter = 0.0001; epoch = 50; early stopping was designed for the model. The detection results were evaluated using mAP50 and mAP50:95 as performance indicators, as shown in Table 1:

Table 1.
Test results under different IoU loss conditions.
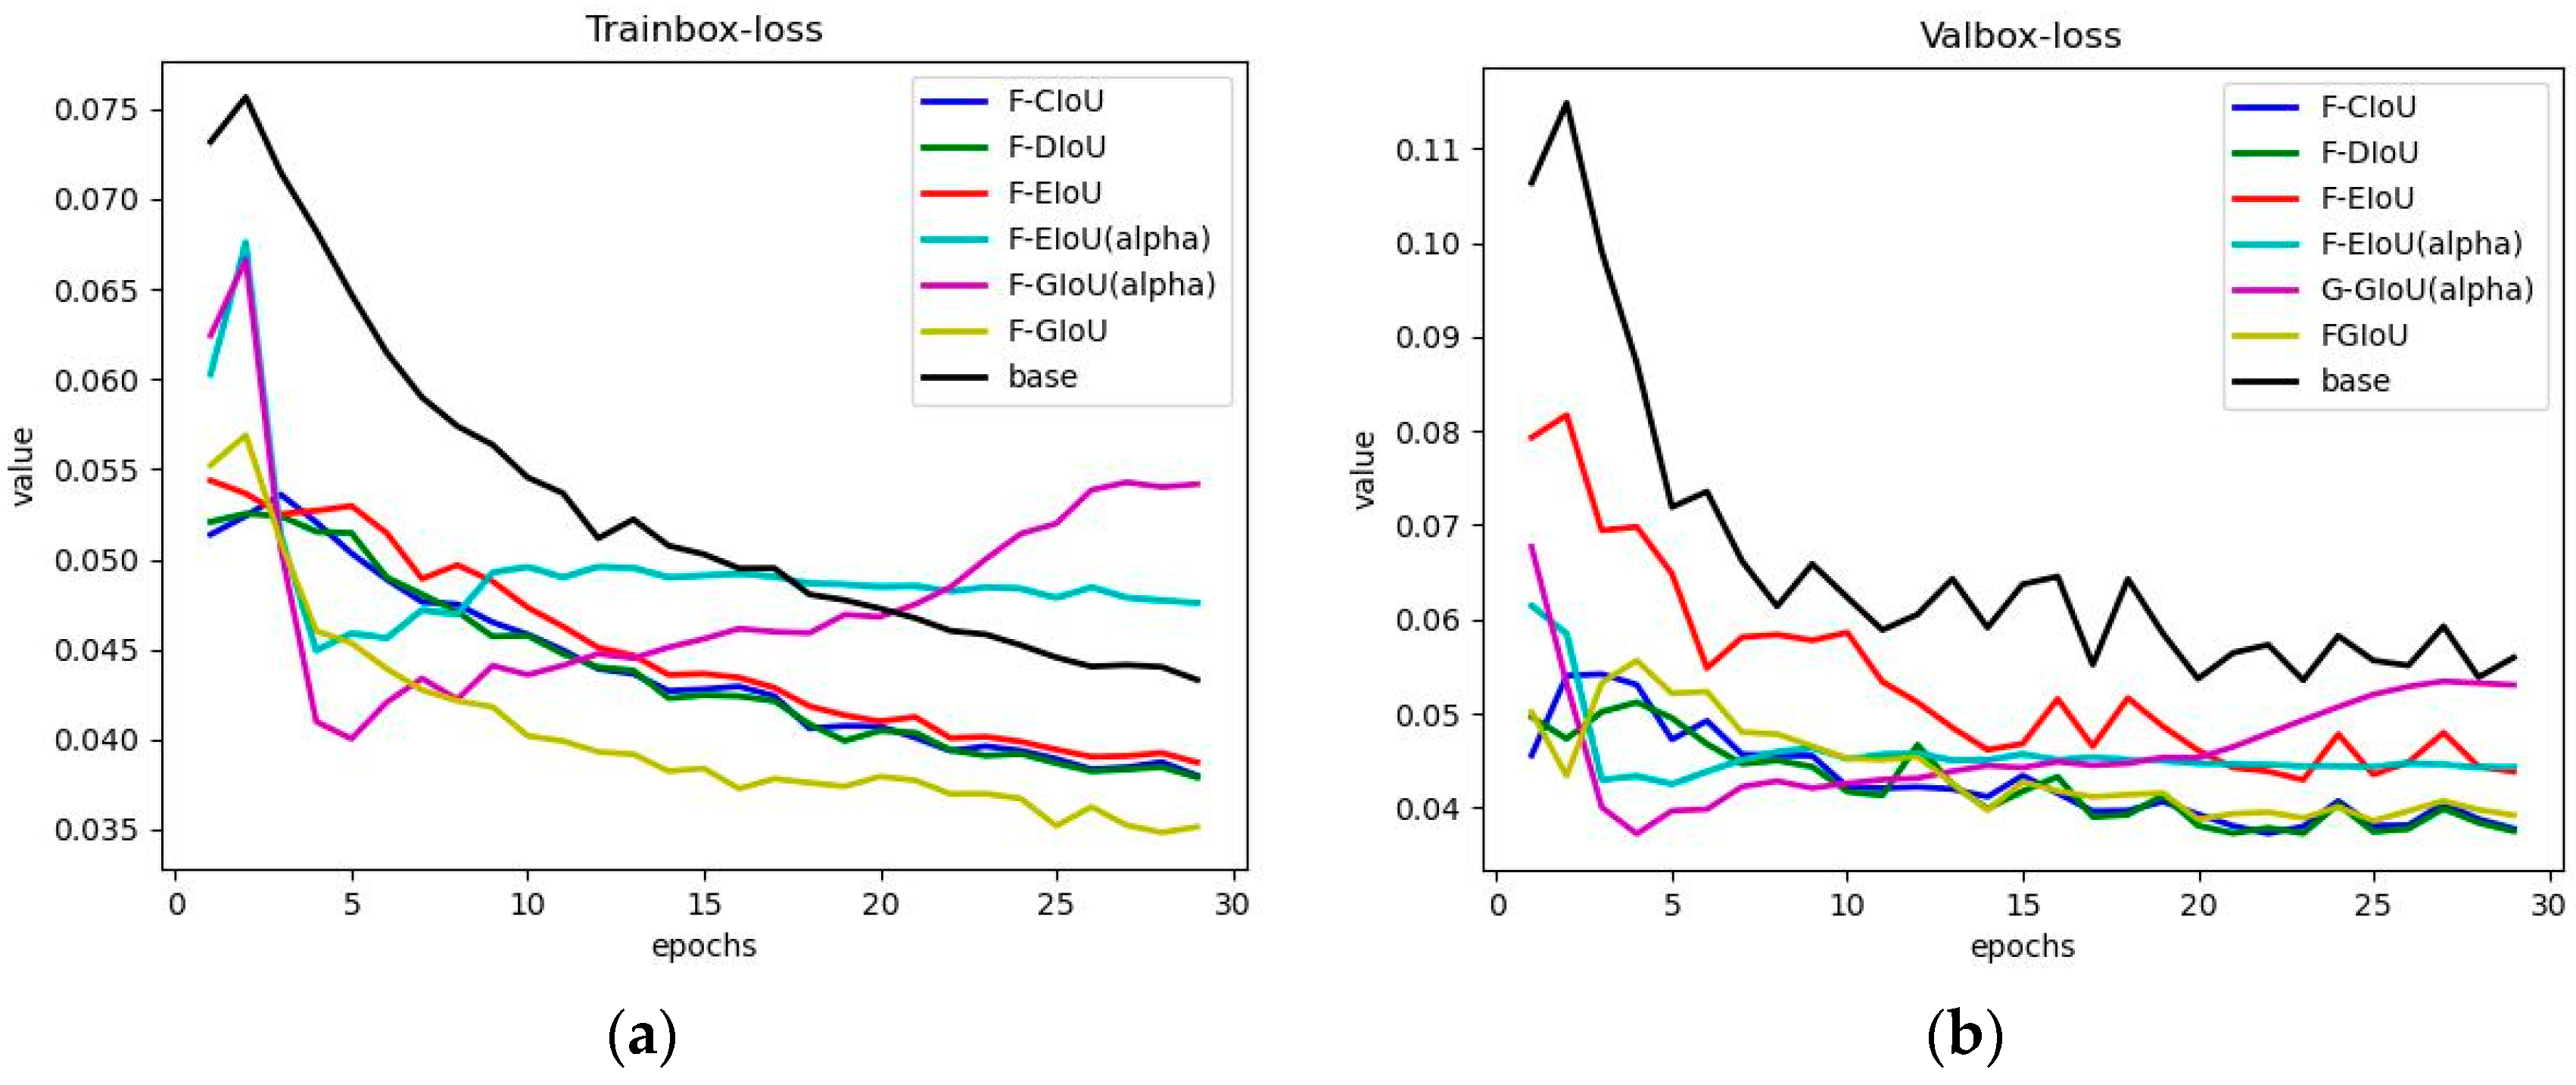
According to Table 1, in the detection task of the pipeline leakage magnetic dataset, Focal-GIoU has the highest mAP of 87.4% when the IoU threshold is 0.5, which is 0.7% higher than Focal-EIoU. Focal-GIoU has the highest mAP50:95, which is 2.1% higher than Focal-EIoU. Compared with the typical IoU loss, Focal-GIoU has increased the mAP50 and mAP50:95 by 7.2% and 3.8%, respectively. Focal-GIoU has the best optimization effect for the detection algorithm. In order to verify the improvement of detection model efficiency under different IoU loss optimization methods, the detection results of box loss under different IoU losses on the training set and validation set are shown in Figure 7, where (a) is the box loss of the training set, and (b) is the box loss of the validation set.
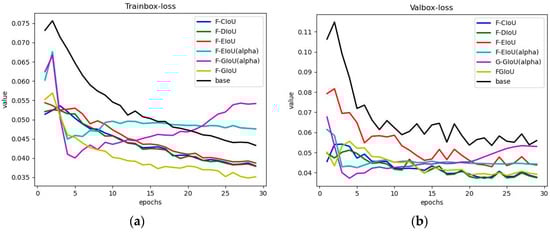
Figure 7.
Changes of box-loss in different IoU conditions. (a) is Trainbox-loss, (b) is Valbox-loss.
The convergence of the first 30 epochs of the validation box loss during training was captured in Figure 7. According to the figure, the addition of the Focal-loss module in the training process can improve the convergence speed of the detection model box loss. Among them, the proposed Focal-GIoU has the lowest box loss and the fastest convergence speed. In addition, after adding the alpha algorithm, the box loss of the detection model shows a trend of decreasing first and then increasing, and even the final loss value exceeds that of the basic Yolov5 model. This indicates that the model has some overfitting problems. Based on the validation set box loss, it can be seen that the curves of Focal-GIoU, Focal-CIoU, and Focal-DIoU are almost identical, which may be due to the small number of samples in the validation set, but this does not affect the training process of the model. Focal-GIoU can effectively improve the training efficiency of the model and accuracy of detection.
- B.
- Comparative experiment of attention mechanism
In order to verify the performance of BRA in the detection of small defects, the typical Attention mechanism and Attention LePE were compared under the same conditions. The experimental results are shown in Table 2, where the dataset partitioning and hyperparameters remain unchanged.
Table 2.
Comparative experimental results of different attention mechanisms.
According to Table 2, the model calculated a total of 26.1G floating-point data after adding the BRA, but it only took the shortest training time of 0.256h. This indicates that the detection model has better computational efficiency and scalability and can be applied to larger-scale and higher-resolution tasks. In addition, compared with Attention LePE, after using the BRA module, the mAP50 of the detection model increased by 0.8%, while the mAP50:95 decreased by 0.7%. In practical applications, mAP50 is a more important evaluation indicator than mAP50:95, and the fluctuation of mAP within 1% exists by chance. The improvement effect of Attention LePE and BRA on the accuracy of the detection model is almost the same. Compared with the basic Yolov5 model, the mAP50 of the proposed method is increased by 1.3%, and mAP50:95 increased by 8.7%. BRA can maximize the detection efficiency of the model while improving the detection accuracy.
- C.
- Ablation experiment
In order to verify the performance of the proposed model to the maximum extent, the hyperparameter is set to batch-size = 12 and the default epoch = 100. The comparison table of ablation experiments is shown in Table 3:
Table 3.
Comparison table of ablation experiments.
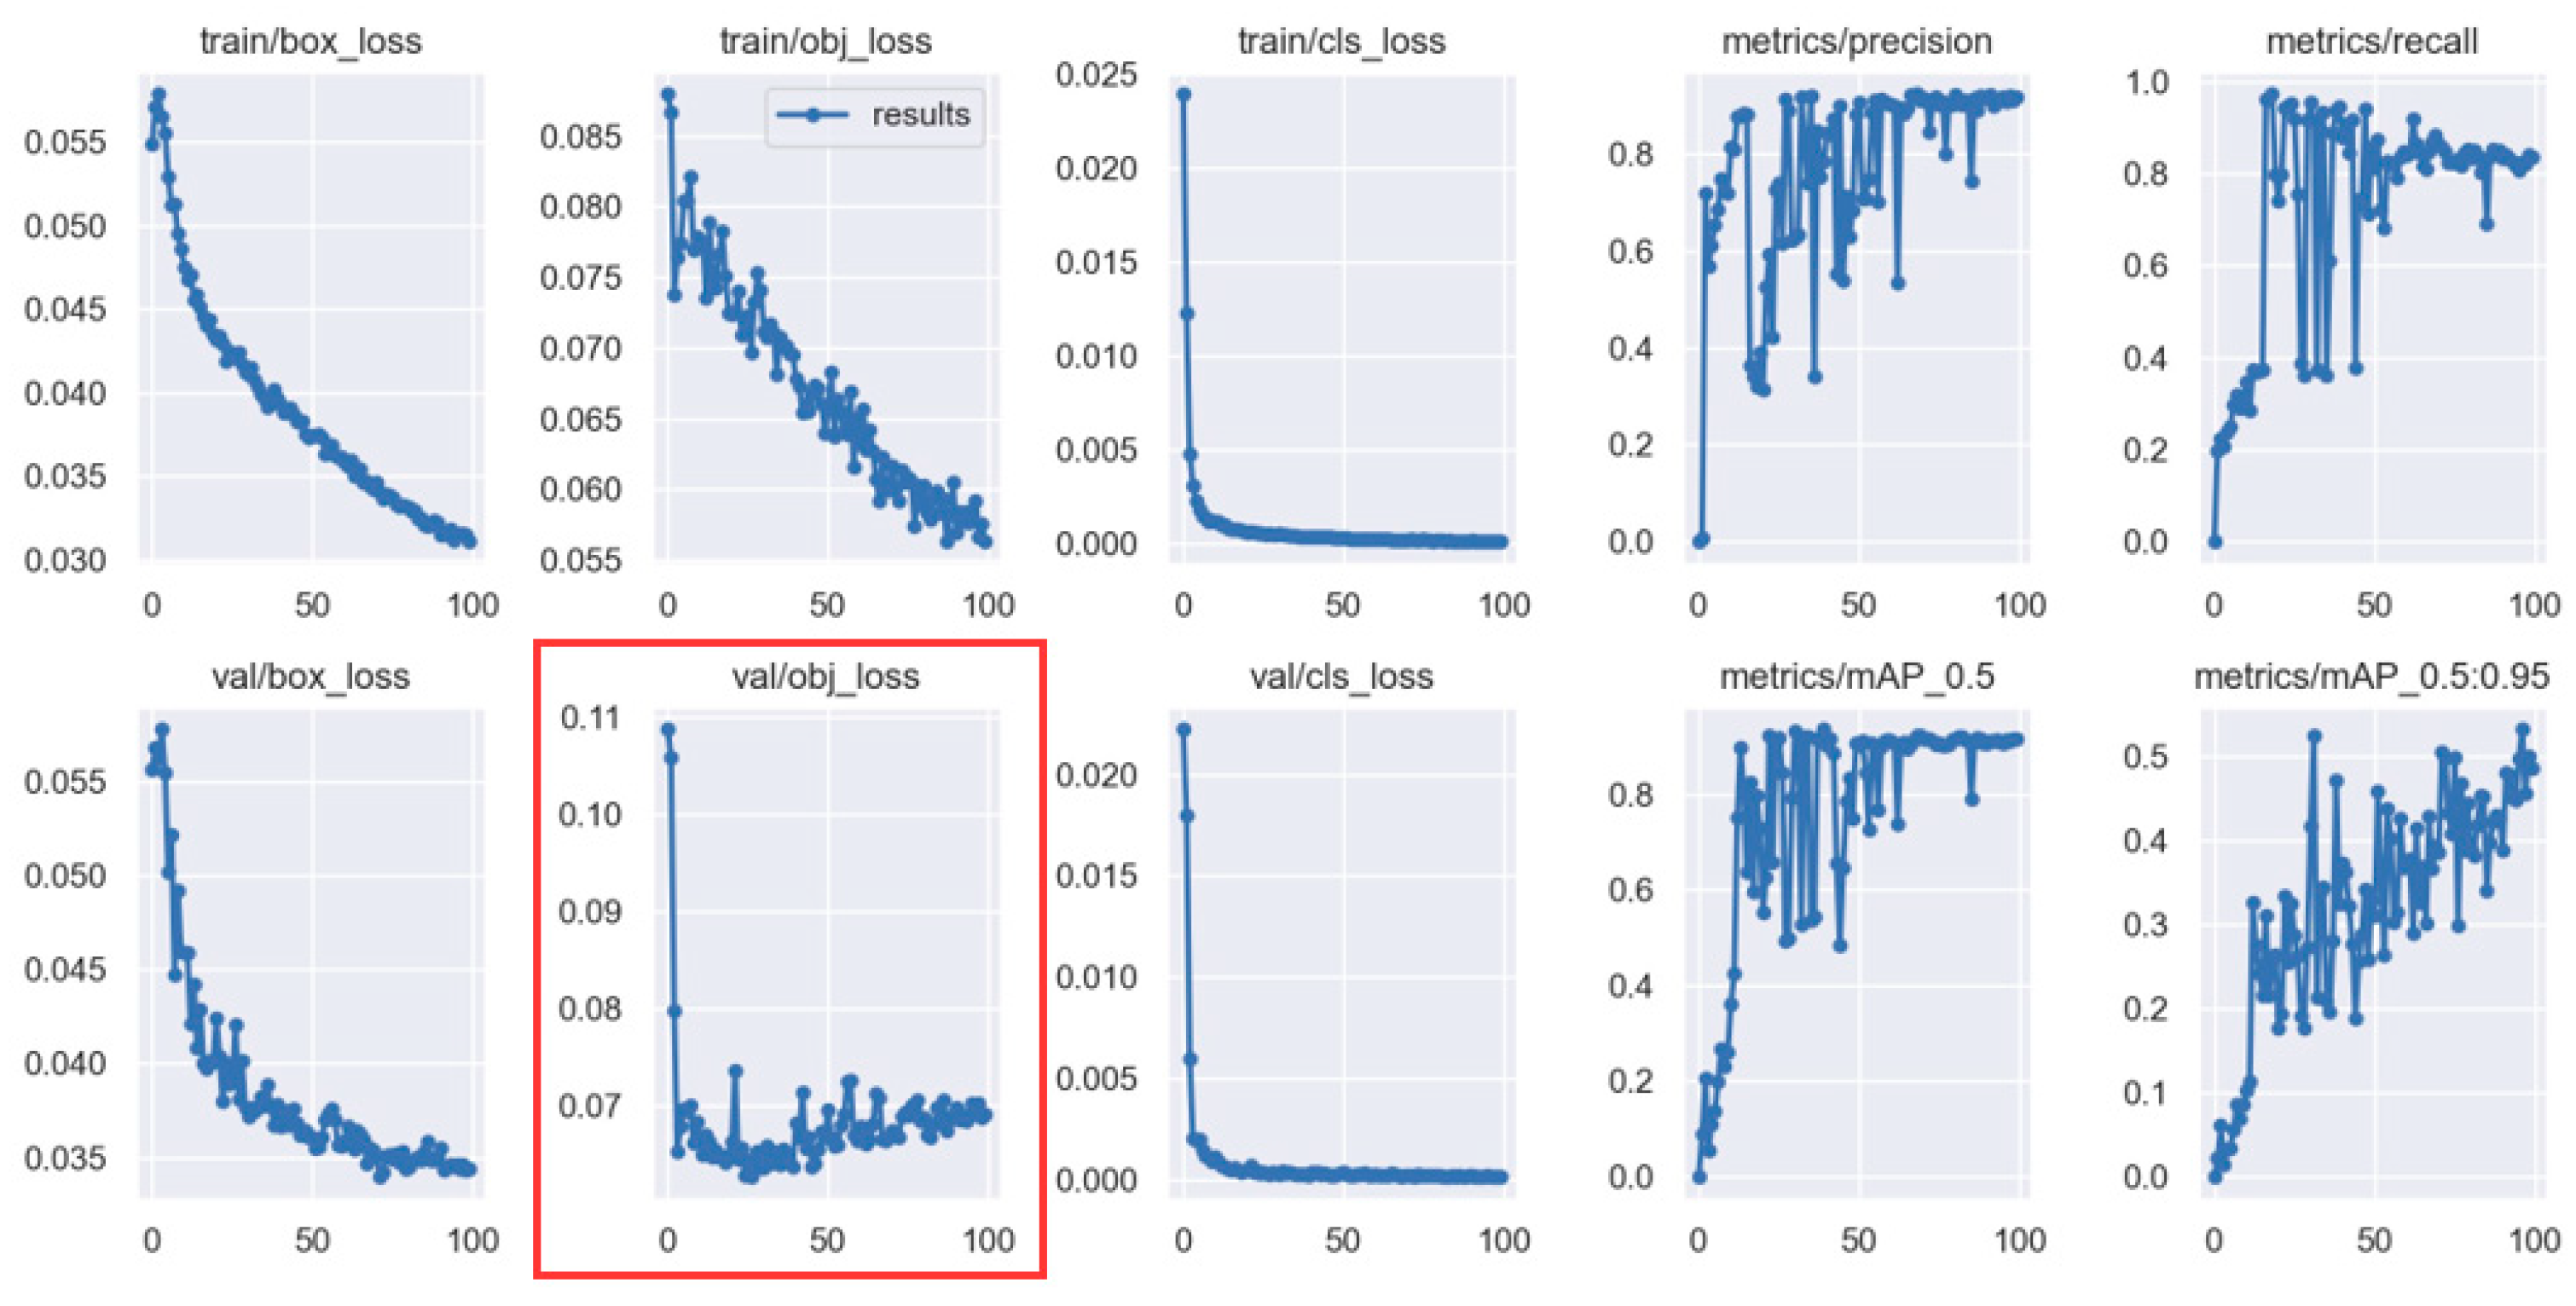
According to Table 3, after adding Focal-GIoU loss to the detection model, mAP50 increased by 1.6% and mAP50:95 decreased by 1.4%. When bi-level routing attention was added to the detection module of the model, compared with the basic Yolov5 model, mAP50 increased by 1.4%, and mAP50:95 significantly improved to 50.1%. On this basis, after adding the adaptive compressed sensing, the detection model achieved the highest mAP50 of 91.5% and mAP50:95 of 52.9%. Compared with the basic Yolov5 detection model, mAP50 and mAP50:95 increased by 6.4% and 15.1%, respectively. The proposed pipeline leakage magnetic small defect detection model can already meet the performance requirements of practical detection. Figure 8 shows the P-R curve and F1-score curve of the detection model in this paper, and Figure 9 shows selected detection results. The computation method of F1-score is shown in Equation (23):
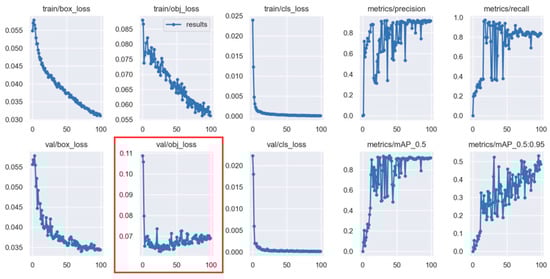
Figure 8.
Experimental results from the manuscript.
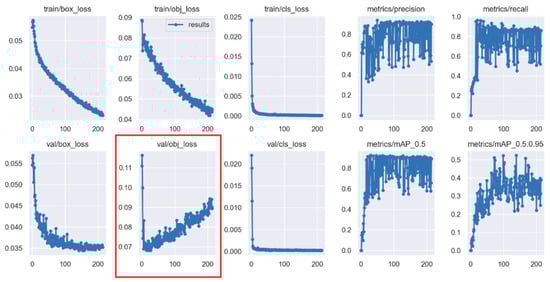
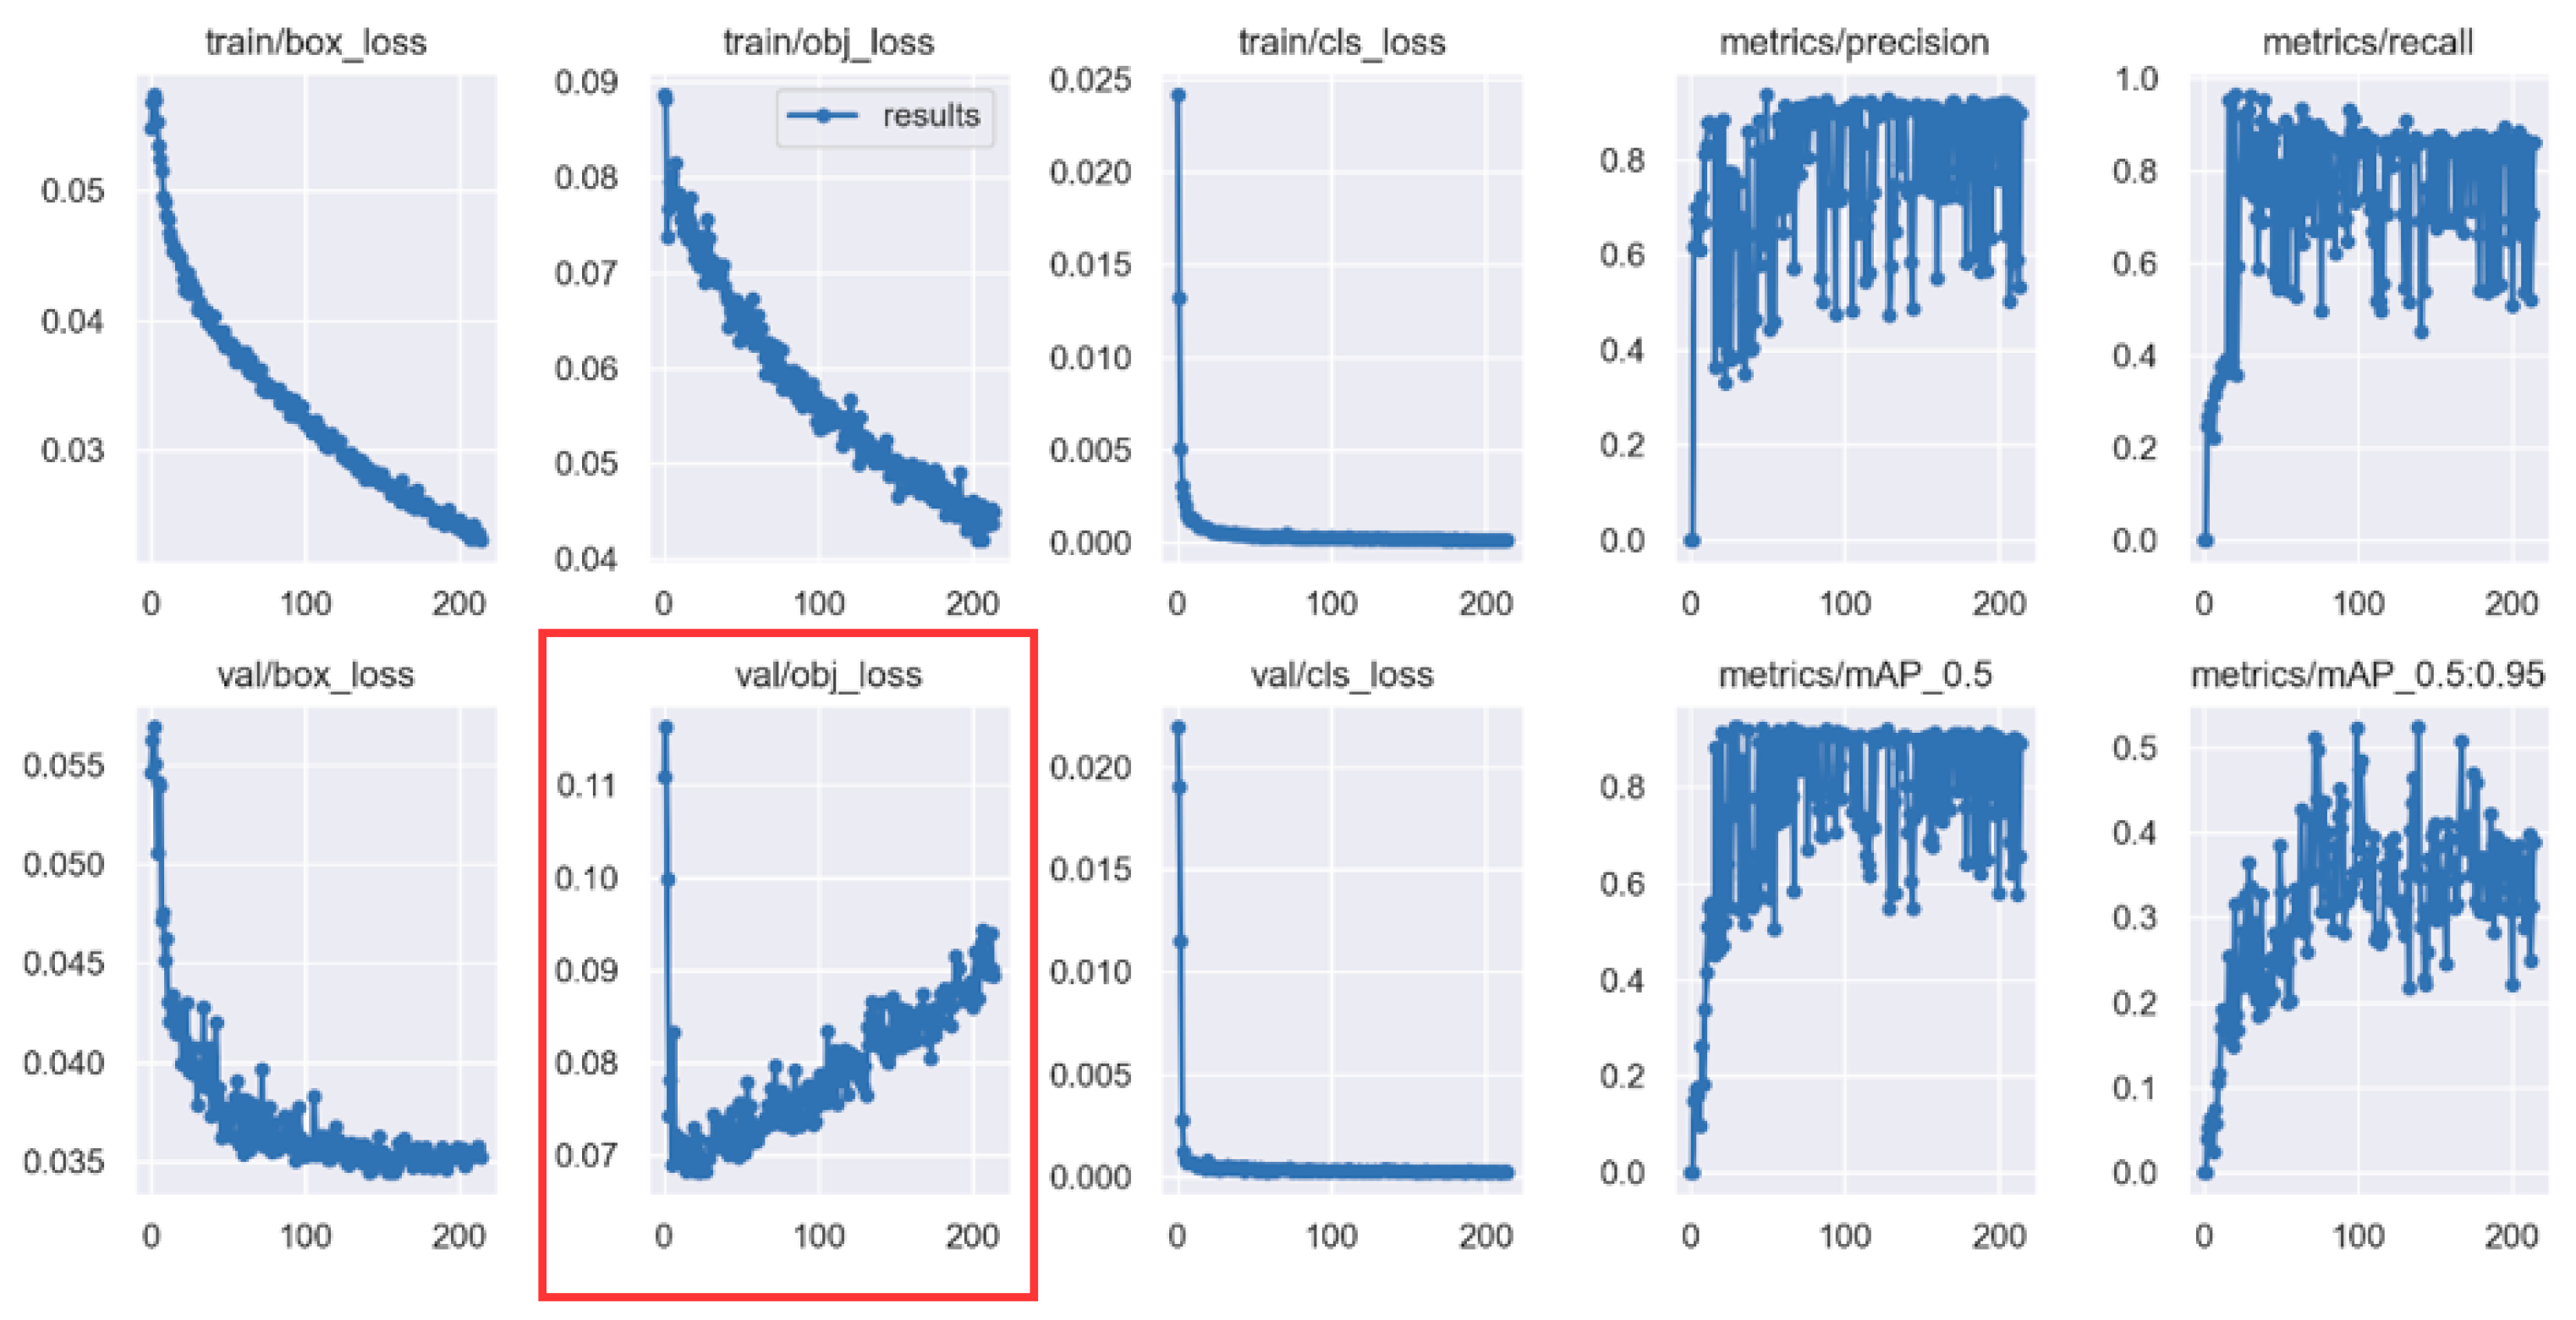
Figure 9.
Comparative experimental results.
To validate the presence of any overfitting in our trained detection model, we conducted comparative experiments using the original dataset. The comparative experiment is conducted with a set-up of 300 epochs and a batch size of 16. The experimental results of the proposed method are shown in Figure 8, and the comparative experimental results are shown in Figure 9.
From Figure 9, it can be observed that when training the network using the original images, the network was stopped early at epoch 224. The detection loss on the validation set showed an increasing trend, indicating that the model was overfitted to the dataset. In comparison, as shown in Figure 8, when adaptive compression perception was introduced, the detection loss on the validation set no longer exhibited an increasing trend and converged to around 0.07. This indicates that the proposed method is effective in addressing the overfitting issue in small sample datasets. It serves as a neural network regularization method suitable for defect detection in magnetic flux leakage (MFL) applications.
4. Conclusions
The safety of oil and gas pipeline transportation is a critical aspect of sustainable development. The problem of pipeline leakage detection has the challenges of low accuracy in detecting small targets and low efficiency in the image processing of detection models. This paper presents the following contributions to address these problems:
- Based on pipeline leakage image data, we proposed an adaptive compressive sensing image enhancement method based on pixel content. Through ablation experiments, we verified that this method can effectively improve the image processing efficiency and accuracy of the Yolov5 detection model. This method improved the mAP50 and mAP50:95 of the Yolov5 model by 6.4% and 15.1%, respectively, with mAP50 reaching 91.5% and mAP50:95 reaching 52.9%. This method meets the standards for industrial pipeline leakage detection.
- Based on the theoretical basis of Focal-EIoU, we proposed a Focal-GIoU detection model loss function design method suitable for pipeline leakage data and combined the ideas with DIoU, CIoU, and EIoU. Through comparative experiments, we verified that this method has the highest accuracy improvement in detecting small targets in pipeline leakage. In addition, using Focal-GIoU in training the model, it has the fastest convergence speed and improves detection efficiency while ensuring accuracy.
- We applied bi-level routing attention to the smallest feature map fusion module of the Yolov5 detection model to detect feature maps. Through comparisons with other typical attention mechanisms, this method has performance improvements almost identical to Attention LePE, but the detection model has the fastest pre-training speed after applying this method. Using this method can effectively improve the efficiency of model training.
As the main characteristic of pipeline leakage defects is red, the adaptive compressive sensing method proposed in this paper is based on the distribution of red pixels. For different image datasets, the distribution of important feature pixels can be analyzed through feature map pixel analysis, and then an appropriate threshold parameter can be set to give the corresponding optimal adaptive compressive sensing method.
Author Contributions
Conceptualization, S.Z.; Validation, J.L.; Investigation, S.Z.; Resources, J.L.; Data curation, J.L. and X.Z.; Writing—original draft, S.Z.; Writing—review & editing, J.L. All authors have read and agreed to the published version of the manuscript.
Funding
National Nature Foundation of China: U21A20481; National Nature Foundation of China: 61973071; Liaoning Revitalization Talents Program: XLYC2002046.
Institutional Review Board Statement
Not applicable.
Informed Consent Statement
Not applicable.
Data Availability Statement
Not applicable.
Conflicts of Interest
The authors declare no conflict of interest.
References
- Liu, J.H.; Zhao, Z.; Fu, M.R.; Zuo, F.Y.; Wang, L. Pipeline Weld Defect Detection Method Based on Active Small Sample Learning. Chin. J. Sci. Instrum. 2022, 43, 252–261. [Google Scholar]
- Liu, X.; Hu, C.; Peng, P.; Li, R.; Zhao, X.; Zheng, D. In-pipe Detection System Based on Magnetic Flux Leakage and Eddy Current Detection. In Proceedings of the 2020 International Conference on Sensing, Measurement & Data Analytics in the era of Artificial Intelligence (ICSMD), Xi’an, China, 15–17 October 2020; pp. 164–169. [Google Scholar] [CrossRef]
- Xu, T.; Geng, M.; Liang, C. Long Distance Large Diameter Heating Pipeline Leakage Detection Based on Acoustic Pressure Sensor. In Proceedings of the 2020 Chinese Automation Congress (CAC), Shanghai, China, 6–8 November 2020; pp. 2289–2294. [Google Scholar] [CrossRef]
- Liu, J.H.; Zhao, H.; Shen, X.K.; Lu, D.Y.; Tang, J.H. Self-supervised Defect Detection Method Based on Magnetic Leakage Internal Inspection. Chin. J. Sci. Instrum. 2020, 41, 180–187. [Google Scholar]
- Wang, X.; Zhou, F.; Liu, X. Research on Transient Numerical Simulation of Quantitative Identification Pattern of Pipeline Single Defect. In Proceedings of the 2021 IEEE International Conference on Artificial Intelligence and Computer Applications (ICAICA), Dalian, China, 28–30 June 2021; pp. 448–451. [Google Scholar]
- Hamache, M.S.; Mohellebi, H. Magnetic Flux Leakage Technique used to Pipeline Defect Detection with Finite Element Method. In Proceedings of the 2022 2nd International Conference on Advanced Electrical Engineering (ICAEE), Constantine, Algeria, 29–31 October 2022; pp. 1–4. [Google Scholar]
- Pacheco, M.; Liu, Y.; McHugh, P.E. k-NN and PCA applied to flux leakage detection in pipelines. IEEE Trans. Magn. 2016, 52, 1–8. [Google Scholar]
- Heidarzadeh, H.; Farhadi, S. Pipeline leakage detection based on decision tree algorithm. J. Pet. Sci. Eng. 2018, 161, 123–129. [Google Scholar]
- Hou, Y.; Li, Y.; Jia, Y. An unsupervised pipeline crack detection method based on optimal K-means clustering. Mech. Syst. Signal Process. 2022, 159, 108435. [Google Scholar]
- Kalaiselvi, M.; Arumugam, M.; Krishnamoorthy, R. Leak detection method of pipeline using PCA and genetic algorithm. Measurement 2019, 136, 184–191. [Google Scholar]
- Nguyen, L.; Li, J.; Zheng, Y.; Cao, L.; Zhang, Z. Leak detection in pipelines using support vector machine based on empirical mode decomposition. ISA Trans. 2018, 82, 282–289. [Google Scholar]
- Ning, F.L.; Cheng, Z.H.; Meng, D.; Duan, S.; Wei, J. Enhanced spectrum convolutional neural architecture: An intelligent leak detection method for gas pipeline. Process Saf. Environ. Prot. 2021, 146, 726–735. [Google Scholar] [CrossRef]
- Liao, H.; Zhu, W.; Zhang, B.; Zhang, X.; Sun, Y.; Wang, C.; Li, J. Application of Natural Gas Pipeline Leakage Detection Based on Improved DRSN-CW. In Proceedings of the 2021 IEEE International Conference on Emergency Science and Information Technology (ICESIT), Chongqing, China, 22–24 November 2021; pp. 514–518. [Google Scholar] [CrossRef]
- Tong, X.; Huang, Y.; Xiao, L.; Chen, X.; Shen, R. Surface Defect Detection Method Based on Improved Faster-RCNN. In Proceedings of the 2021 4th International Conference on Information Communication and Signal Processing (ICICSP), Shanghai, China, 24–26 September 2021; pp. 357–362. [Google Scholar] [CrossRef]
- Jin, J.; Qin, W.; Liu, X.; Zhang, C. Deep reinforcement learning for pipeline leakage detection optimization. Measurement 2019, 137, 734–745. [Google Scholar]
- Choudhary, K.; Raj, S.; Sharma, D.; Sharma, V.; Kumar, N. Comparison of different machine learning techniques for pipeline leakage detection. Neural Comput. Appl. 2021, 3, 3059–3077. [Google Scholar]
- Zhang, S.; Qu, N.; Zheng, T.; Hu, C. Series Arc Fault Detection Based on Wavelet Compression Reconstruction Data Enhancement and Deep Residual Network. IEEE Trans. Instrum. Meas. 2022, 71, 1–9. [Google Scholar] [CrossRef]
- Najafabadi, H.E.; Leung, H.; Guo, J.; Hu, T.; Chang, G.; Gao, W. Structure-Aware Compressive Sensing for Magnetic Flux Leakage Detectors: Theory and Experimental Validation. IEEE Trans. Instrum. Meas. 2021, 70, 1–12. [Google Scholar] [CrossRef]
- Lanyong, Z.; Guanghui, C.; Sheng, L.; Papavassiliou, C. Online compression perception method and its application in magnetic flux leakage detection. J. Instrum. Meters 2017, 38, 7–9. [Google Scholar]
- Geng, J.; Yu, Z.; Li, C. Synthetic Aperture Radar Increment Imaging Based on Compressed Sensing. IEEE Geosci. Remote Sens. Lett. 2022, 19, 1–5. [Google Scholar]
- Lin, C.-H.; Tang, P.-W. Inverse Problem Transform: Solving Hyperspectral Inpainting Via Deterministic Compressed Sensing. In Proceedings of the 2021 11th Workshop on Hyperspectral Imaging and Signal Processing: Evolution in Remote Sensing (WHISPERS), Amsterdam, The Netherlands, 24–26 March 2021; pp. 1–5. [Google Scholar]
- Li, L.; Liu, P.; Wu, J.; Wang, L.; He, G. Spatiotemporal Remote-Sensing Image Fusion With Patch-Group Compressed Sensing. IEEE Access 2020, 8, 209199–209211. [Google Scholar] [CrossRef]
- Cui, M.; Duan, Y.; Pan, C.; Wang, J. Optimization for Anchor-Free Object Detection via Scale-Independent GIoU Loss. IEEE Geosci. Remote Sens. Lett. 2023, 20, 1–5. [Google Scholar] [CrossRef]
- Zhang, Y.; Ren, W.; Zhang, Z. Focal and Efficient IOU Loss for Accurate Bounding Box Regression. arXiv 2022, arXiv:2101.08158v2. [Google Scholar] [CrossRef]
- Bochkovskiy, A.; Wang, Y.; Liao, M. YOLOv4: Optimal Speed and Accuracy of Object Detection. arXiv 2020, arXiv:2004.1934v1. [Google Scholar]
- Zhu, L.; Wang, X.; Ke, Z. BiFormer: Vision Transformer with Bi-Level Routing Attention. arXiv 2023, arXiv:2303.08810v1. [Google Scholar]
- Silver, D.; Huang, A.; Maddison, C.J.; Guez, A.; Sifre, L.; Van Den Driessche, G.; Schrittwieser, J.; Antonoglou, I.; Panneershelvam, V.; Lanctot, M.; et al. Mastering the game of Go with deep neural networks and tree search. Nature 2016, 529, 484–489. [Google Scholar] [CrossRef]
- Vaswani, A.; Shazeer, N.; Parmar, N.; Uszkoreit, J.; Jones, L.; Gomez, A.N.; Kaiser, L.; Polosukhin, I. Attention is all you need. arXiv 2017, arXiv:1706.0376. [Google Scholar]
- Dong, X.; Bao, J.; Chen, D.; Zhang, W.; Yu, N.; Yuan, L.; Chen, D.; Guo, B. CSWin Transformer: A General Vision Transformer Backbone with Cross-Shaped Windows. arXiv 2022, arXiv:2107.00652. [Google Scholar]

Disclaimer/Publisher’s Note: The statements, opinions and data contained in all publications are solely those of the individual author(s) and contributor(s) and not of MDPI and/or the editor(s). MDPI and/or the editor(s) disclaim responsibility for any injury to people or property resulting from any ideas, methods, instructions or products referred to in the content. |
© 2023 by the authors. Licensee MDPI, Basel, Switzerland. This article is an open access article distributed under the terms and conditions of the Creative Commons Attribution (CC BY) license (https://creativecommons.org/licenses/by/4.0/).