1. Introduction
According to International Energy Agency (IEA) statistics, transportation is one of the main sources of global carbon emissions, accounting for 26% in 2020. Pure EVs exhibit lower carbon emissions per unit mileage, approximately 70 g per kilometer, which is only 39.77% of the average carbon emission level of fuel vehicles. Consequently, the active development of the EV industry in many countries holds immense importance worldwide toward efforts to reduce carbon emissions. Research data from Canalys reveal that the global sales volume of EVs, including both pure electric and plug-in hybrid cars, reached 6.5 million units in 2021. These vehicles witnessed an average market penetration rate of 9%, with Germany, the United States, and the United Kingdom achieving rates of 26%, 8.3%, and 11.6%, respectively. Remarkably, Norway surpassed them all with a staggering 64.5% market penetration. As a result, the EV industry is emerging as the primary direction of the global transportation sector for a reduction in carbon emissions.
In 2020, China’s carbon emissions in the transportation sector totaled about 1.1 billion tons, accounting for up to 10% of China’s CO2 emission structure by sector, which was expected to increase by 50% of the current level in 2025. To support the development of the EV industry, the Chinese government has implemented various industrial support policies, including subsidies, tax exemptions, preferential licensing, etc., and issued The New Energy Vehicles Industry Development Plan (2021–2035) in 2020, which set the goal of achieving EV sales at 20% of total vehicle sales by 2025. Sales of EVs in China soared to 3.521 million units in 2021, up 157.6% year-on-year from 2020. This momentum carried into the first half of 2022, with sales of 2.6 million EVs, a 120% year-on-year growth rate. Toward this phenomenon, some people are optimistic, anticipating the forthcoming surge in EV sales. However, some are cautious that the current surge in sales is merely a temporary trend, and the support policy should be continued. There is still confusion around the above issues, despite the government’s decision to continue to implement an exemption policy for EV purchase tax in 2023 at the Executive Meeting of The State Council, held on 29 July 2022. To ensure the achievement of the target for EV sales (20%) in 2025, the need to continue to implement support policy is becoming a focal point of concern.
2. Literature Review
The EV industry has garnered significant academic attention since its inception, especially toward the issue of industrial support policies and their effects, which is one of the research hotspots. At present, scholars categorize policy tools for the EV industry into two primary groups: monetary policies and non-monetary policies. Wei Shuyan and Guo Suilei discussed the impact of marketization, socialization, and internal policy tools on EV industrial development [
1]. Li Suxiu et al. provided a comprehensive analysis of the evolution and trends in EV industrial policies and established a correlation analysis framework between the performance of the EV market and industrial policies [
2].
Monetary policy instruments, such as R&D subsidies, acquisition subsidies, tax deductions, etc., are crucial for supporting the EV industry. Through an analysis of the EV industry’s progress in Norway, Figenbaum observed that monetary policy support proved effective in mitigating the high-cost challenges associated with EVs. Furthermore, it significantly impacted consumers’ decisions when purchasing EVs [
3]. Gass and others found, compared with CO
2 tax relief and fuel tax relief, the impact of purchase subsidies was the greatest in Australia [
4]. Conversely, Aasness’ research yielded different conclusions. They found that preferential tax policies had a stronger influence on promoting the purchase of EVs in Norway [
5]. According to Cao Xia et al., increasing the government’s R&D funding for EV enterprises has a positive impact on their ability to innovate and scale up. This, in turn, helps to encourage consumer purchases [
6]. In a study by Zheng Xiaoxue et al., a Stackelberg game model was employed to analyze the influence of government subsidies on both manufacturers and consumers [
7]. Peng Pin and He Xitu discovered that long-term government subsidies did not necessarily improve the core competitiveness of EV enterprises. Conversely, appropriate penalties could stimulate industrial development [
8].
Non-monetary policy tools primarily encompass travel restrictions, purchase limitations, complimentary parking, and government procurement, among others [
9,
10,
11]. Ajanovic and Haas contended that granting EVs access to bus lanes could effectively promote their usage [
12]. Langbroek et al. found that implementing free parking was also a more cost-effective and efficient approach [
13]. Ma Shaochao and Fan Ying quantitatively evaluated the long- and short-term policy effectiveness of four industrial policies: purchase subsidies, tax breaks, vehicle restrictions, and purchase restrictions [
14]. Based on the literature [
14], Li Xiaomin et al. increased government procurement as a type of policy tool and employed a time series co-integration model to assess the impact of policy [
15]. Li Guodong utilized the Logit demand model to examine the promotional impact of financial subsidies and free special licenses on EVs, revealing that the combination of these two policies yielded the most favorable results [
16]. Li Wenxiang proposed considering the implementation of a road-traffic carbon-trading mechanism as an alternative to financial subsidies [
17].
The impact of the subsidy policy on the purchase decision-making preferences of EV consumers is another research hotspot [
18,
19,
20]. Despite the similarity in subsidies between the United States and China, American consumers demonstrate a considerably lower inclination to pay for EVs compared to Chinese consumers [
21]. Kenan Degirmenci found that the environmental performance of EVs was a stronger determinant than were price value and range confidence [
22]. Xiang Zhang et al. revealed the mechanism of how perceptions and motivation impacted consumers’ EV purchase intentions [
23]. Fanchao Liao et al. pointed out that the successful market penetration of EVs relied more on their business models [
24]. Wenjian Jia et al. examined consumer preference heterogeneity and found that a monetary incentive was the most effective in increasing the plug-in EV market share in USA [
25]. Zikai Zhang et al. identified convenience, cost considerations, and environmental benefits as factors influencing the purchasing decisions of EV consumers among Macao residents [
26].
In addressing the prediction of EV market penetration, prevailing methods encompass multivariate regression [
27], the BP neural network [
28], the diffusion model [
29], simulation analysis [
30], combinatorial predictions [
31], and other approaches. However, these methods often necessitate a substantial volume of samples to ensure prediction accuracy. Given that the EV industry is relatively nascent, historical data is limited. The grey prediction model offers distinct advantages in handling small sample sizes and uncertainties, and is widely used to study predictions for the EV market. Ling-Ling Pei et al. proposed a nonlinear grey Bernoulli prediction model based on the quarterly fluctuation characteristics of EV sales in China [
32]. Ling-Yang He et al. introduced an optimized grey buffer operator, which had significantly enhanced the adaptability of the grey model to EV sales data [
33]. In another study, Song Ding et al. presented a novel adaptive optimization grey model for predicting EV sales and inventory [
34]. Furthermore, Liu Lianyi et al. developed an optimized discrete grey power model to forecast the sales of EVs [
35], while Zhou Huimin et al. proposed a novel time-varying grey Bernoulli model [
36] and Zeng Bo et al. established a flexible variable-structure grey prediction model [
37]. Furthermore, Hua Ling incorporated the grey prediction model and buffer operator to predict energy consumption in China. Their studies yielded encouraging prediction results [
38,
39]. Overall, existing research primarily focuses on enhancing prediction methods, with the sales volume of EVs being the primary object of study. Research that examines the market penetration rate as a prediction target is comparatively limited.
The development of EVs in China is not only extensively supported by government industrial policies, but also influenced by significant changes in external environmental factors. Since the second half of 2021, China’s EV sales have experienced significant growth, in addition to governmental policy support, which is closely related to the sharp rise in international oil prices. Taking the market penetration rate of EVs as the prediction object, we intend to use a buffer operator to treat the sales data in advance, which can eliminate the disturbances caused by external shocks. Based on the data sequence generated with the buffer operator, the GM (1,1) model is utilized to predict the market penetration rate of EVs in China. The forecast results will be applied to evaluate the possibility of achieving the goals outlined in the development plan of the EV industry during the 14th Five-Year Plan period.
3. Grey Buffer Operator and EV Market Penetration Rate Prediction Model
3.1. Grey Buffer Operator
The predicted subject, when confronted with external factors that cause disturbances, will result in the distortion of systemic behavioral data. The grey buffer operator is designed to eliminate the disruptions caused by these disturbances and faithfully reflect the fluctuation patterns of the predicted subject, thereby enhancing the resulting prediction accuracy.
Definitions: Let X denote the original data series and D represent the buffer operator. In the case where X corresponds to ascending, decaying, or oscillating sequences:
(1) If the buffer sequence XD retards the growth rate (or decay rate) of the original sequence X, or diminishes its amplitude, then the buffer operator D is referred to as a weakening operator.
(2) In the event that the buffer sequence XD accelerates the growth rate (or decay rate) of the original sequence X, or amplifies its amplitude, then the buffer operator D is denoted as a strengthening operator.
The supportive policies and the disruptive impact of international oil price fluctuations have accelerated the pace of development for EVs during the “13th Five-Year Plan” period. In order to accurately depict the developmental trend of the EV industry, it is necessary to employ a buffer technique to weaken the growth trend within the raw data. We employed an average weakening buffer operator for data preprocessing, with the specific methodology outlined as follows.
Let X denote the original data sequence encompassing external disruptive perturbations. X = {x(1), x(2), …, x(n)}.
Let XD = (x(1)d, x(2)d, …, x(n)d),
Among, , k = 1, 2, …, n.
Term D is referred to as the average weakening buffer operator (AWBO), while XD represents a first-order buffer sequence that eliminates external disruptive perturbations.
It is important to acknowledge that buffer operators exist in various computational forms, including the weighted average weakening buffer operator, the geometric average weakening buffer operator, and the average enhanced buffer operator. In this paper, the average weakening buffer operator (AWBO) is used to buffer the original data of Chinese automobile sales.
In the event that the interference caused by external disruptive perturbations is substantial, and the first-order buffer process does not completely eliminate the influence, it is possible to further carry out buffering on the basis of XD. If D1 and D2 are both buffer operators, then the term D1D2 is referred to as a second-order buffer operator, and XD1D2 = {x(1)d1d2, x(2)d1d2,…, x(n)d1d2} is designated as a second-order buffer sequence. Following this pattern, third-order buffer sequences and even higher orders can be derived.
3.2. EV Market Penetration Rate Prediction Model
The grey GM (1,1) model is employed to forecast the market penetration rate of EVs in China. The GM (1, 1) model has no special requirements for data sequences in modeling, which is especially suitable for solving the uncertainties of “small samples” and “poor information” [
40]. To account for the dynamic nature of China’s EV sales data, the data sequence is initially processed using a grey buffer operator before employing the GM (1,1) model for prediction. The overall procedure is as follows:
(1) Obtain the original sequence data, x(0) = {x(0)(1), x(0)(2), …, x(0)(n)}.
(2) Generate the buffer sequence data. Select the appropriate buffer operator D to treat the original data sequence x(0), and obtain the first-order buffer sequence x(0)D = {x(0)(1)d, x(0)(2)d, …, x(0)(n)d}. Also note that x′(0) = x(0)D = {x′(0)(1), x′(0)(2), …, x′(0)(n)}, in which x′(0)(k) = x(0)(k)d, k = 1, 2…, n.
(3) Obtain first-order cumulative sequence. Perform a cumulative generation process on buffer generation sequence x(0)D to obtain a cumulative generation sequence x′(1), x′(1) = {x′(1)(1), x′(1)(2), …, x′(1)(n)}, of which
(4) Obtain the mean generation of the consecutive neighbors sequence. Process x′
(1) to obtain z
(1) :
(5) Parameter solution. Note â = [a, b]T as a parameter column,
Note: , .
Then, the minimum squares estimation parameter column of the GM (1,1) model x′(0)(k) + az(1)(k) = b is satisfied: â = (BT B)−1BTY.
(6) Determine the time response function. Call
the whitening equation of the GM (1, 1) model x′
(0)(k) +az
(1)(k) = b, and obtain the time response function:
(7) Obtain the time response sequence. Based on step 6, the time response sequence of the GM (1, 1) model x′
(0)(k) + az
(1)(k) = b is obtained:
(8) Inversely accumulate and restore to obtain the simulation prediction value:
(9) Check for errors.
4. Prediction and Analysis of the Market Penetration Rate of China’s EVs
4.1. Data Selection
The purpose of this paper is to predict the market penetration rate of EVs in China. The market penetration rate of EVs is shown in the following formula:
In 2015, the Ministry of Finance issued
The Notice on the Financial Support Policy for the Promotion and Application of New Energy Vehicles for the Period 2016–2020. Starting in 2016, the subsidy support policy for the EV industry has been extended from pilot areas to the whole country. Meanwhile, an exemption from the purchase tax of EVs was implemented on 1 September 2014 and has continued to date. Under the double stimulus of fiscal subsidies and preferential tax policies, China’s EV industry has entered the fast lane of development. Considering that China’s nationwide financial support policy for the EV industry was implemented starting in 2016, the available dataset only covers the six years from 2016 to 2021 (see
Table 1). The sample size fits the characteristics of the grey GM (1,1) model, which is well-suited for analyzing data series with limited samples and incomplete information. Therefore, the study applies the grey GM (1,1) model to forecast China’s EV market penetration rate from 2022 to 2025.
4.2. Data Preprocessing
To forecast the market penetration rate of EVs, GM (1,1) modeling can be performed directly, using the data provided in column 5 of
Table 1. Nevertheless, the market penetration rate of EVs is influenced not only by EVs, but also by fuel vehicles. Due to the differing effects of national automobile industry policies on these two vehicle types, we aimed to enhance prediction accuracy by applying distinct treatment methods to both EV and fuel vehicle sales data. Subsequently, separate forecasts of EV and fuel vehicle sales are generated, and the future market penetration rate of EVs is ultimately calculated using Formula (1).
As shown in
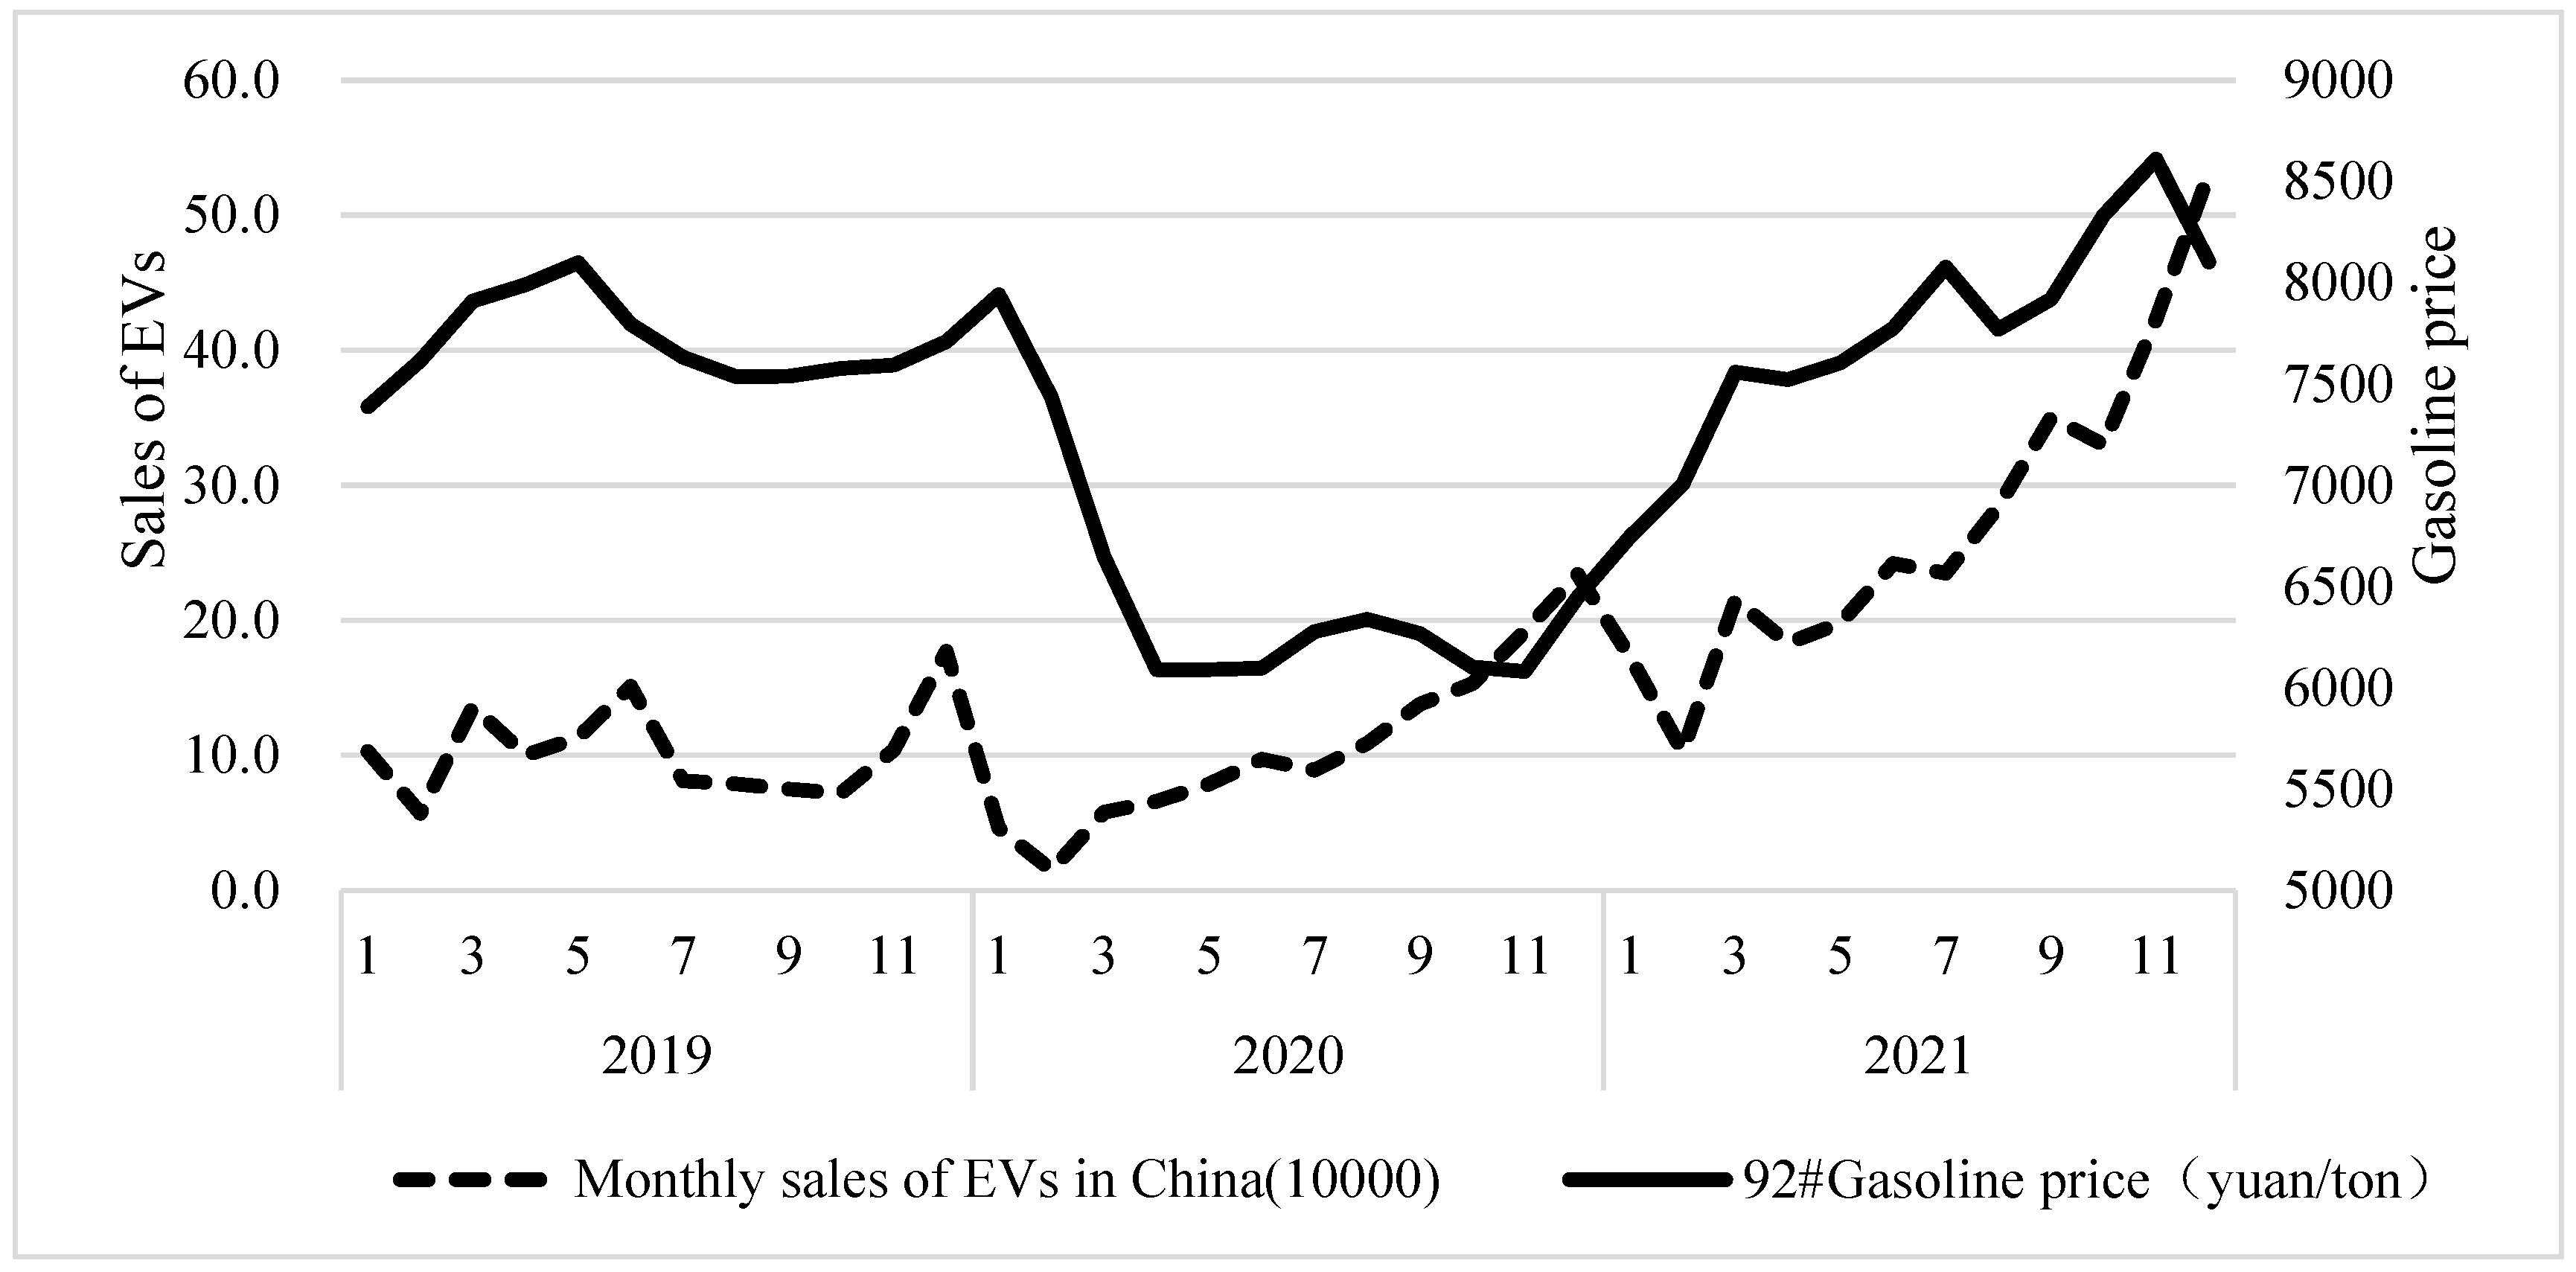
Table 1, The sales of EVs in China exhibited rapid growth from 2016 to 2021, with a notable surge in 2021 to 3.521 million units, marking a 2.58-fold increase compared to the sales in 2020. This remarkable growth can be attributed to both China’s EV support policy and the sustained rise in international oil prices, which has been observed since the latter half of 2020. Upon comparing the monthly EV sales and the oil price trends between 2019 and 2021 (see
Figure 1), a significant correlation can be observed. Particularly, since the latter part of 2020, the sales of EVs have witnessed a substantial upswing, corresponding to the surge in oil prices. Directly employing the GM (1,1) model to forecast EV sales is clearly not viable and would result in significant prediction deviations. To eliminate the disruptive influence of fluctuating international oil prices on EV sales, we initially applied a buffer operator for preprocessing the original data series. Additionally, to quantify the impact of the EV industry policy, we applied a buffer operator once more to the first-order buffer sequence data, generating the second-order buffer sequence data, so as to lessen the disruptive effect of policy factors within the first-order buffer data series.
The growth of emerging industries is often hindered by factors such as immature technology and high production costs, leading to a lack of competitiveness in their products and, as a result, hindered market entry. In response, governments commonly implement supportive policies to enhance the technological capabilities and market competitiveness of emerging industries, eventually pushing industries to transition from policy-driven to market-driven development. Regarding the current state of the EV industry in China, there are two contrasting perspectives. One perspective suggests that the recent surge in sales can predominantly be attributed to the internationally rising oil price. This perspective asserts that the Chinese EV industry remains insufficiently mature and still requires supportive policies for further development. Conversely, the second perspective contends that the EV industry has already reached a stage of self-sustaining growth, capable of surviving without support policies and of achieving self-development. In light of these differing views, we consider two scenarios when predicting the sales of EVs in China: Scenario I assumes that the state will continue implementing subsidy policies, such as purchase subsidies and purchase tax relief, from 2022 to 2025. Scenario II assumes that the state will discontinue subsidizing the EV industry during the same period. For Scenario I, a GM (1, 1) model was established for the first-order buffer sequence data obtained above. For Scenario II, if the country stops its subsidy policy for the EV industry in 2022–2025, this would mean that the previous support policy shock disturbance of the system will no longer exist, so the second-order buffer sequence data for GM (1, 1) modeling is considered to reflect the disappearance of the impact disturbance effect caused by the original subsidy policy.
China’s fuel vehicle sales have been declining since 2018. Although EVs will have a certain negative impact on the sales of traditional fuel vehicles, the industry agrees that it will not be so serious in the short term. The decline in fuel vehicle sales can mostly be attributed to external macro-environmental factors, such as the economic downturn resulting from the COVID-19 pandemic and the continuous increase in oil price. Therefore, it is recommended to utilize a buffer operator to carry out first-order buffer processing of the original data series of fuel vehicle sales, weaken the impact disturbance caused by sudden changes in external environmental factors, and then establish the GM (1, 1) model to predict fuel vehicle sales from 2022 to 2025.
4.3. China’s EV Market Penetration Rate Forecast
4.3.1. China’s EV Sales Forecast
According to
Table 1, the sales data sequence of China’s EVs from 2016 to 2021 is X = {50.70, 77.70, 125.60, 120.60, 136.70, 352.10}.
Using the AWBO D to obtain the first-order buffer data sequence under Scenario I, XD = {143.90, 162.50, 183.80, 203.10, 244.40, 352.10}.
Using AWBO D again to obtain XD2 = XDD = {x(1)d2, x(2)d2, …, x(n)d2}, in which , k = 1, 2, …n.
The second-order buffer data sequence under Scenario II can be obtained as follows: XD2 = {215.00, 229.20, 245.90, 266.50, 298.30, 352.10}.
According to the first-order and second-order buffer data sequences, the GM (1, 1) model is constructed and obtains: a1 = −0.21, b1 = 99.15, a2 = −0.11, b2 = 184.72.
Therefore, the time response sequence in different scenarios is as follows:
Scenario I: ,
Scenario II: .
These can be inversely accumulated and separately restored to obtain the corresponding simulation forecast results for each year from 2017 to 2021, as shown in
Table 2.
According to the calculation results of
Table 2, if no data preprocessing is conducted, and the original data sequence is directly used for GM (1, 1) prediction, the average relative error is as high as 27.48%. Obviously, the simulation prediction effect is not promising. After buffering the original data sequence, the external impact of external environmental changes and industrial support policies are both weakened, and then a GM (1, 1) prediction model is built based on the buffer data sequence. Under the conditions of Scenarios I and II, the average relative errors of fitting are only 7.73% and 2.49%, respectively, which are significantly better than those obtained from direct modeling with raw data. Therefore, the GM (1, 1) method, based on a buffer operator, is used to predict the sales of EVs in China under Scenarios I and II. The results are shown in
Table 3.
In Scenario I, which assumes the continuation of subsidy policies for the EV industry, China’s EV sales are projected to reach 7.48 million in 2025, representing a 2.13-fold increase compared to 2021. However, if the government discontinues the implementation of these support policies (Scenario II), the sales growth rate is expected to decelerate, resulting in a sales volume of 5.31 million by 2025, which is 1.51 times higher than the sales volume in 2021.
4.3.2. China’s Fuel Vehicle Sales Forecast
According to
Table 1, the data series of China’s fuel vehicle sales from 2016 to 2021 is as follows: X = {2752.10, 2817.20, 2682.40, 2456.30, 2407.10, 2275.40}. To weaken the disruptive effects of external macro-environmental changes, including the COVID-19 epidemic and the persistent increase in oil price, the study incorporates the AWBO to derive a first-order buffer data sequence, as follows:
XD = {2565.10, 2527.70, 2455.30, 2379.60, 2341.30, 2275.40}.
Building a GM (1, 1) model based on the first-order buffer data sequence, we obtain: a = 0.03, b = 2620.36.
The time response sequences obtained are as follows:
After inverse accumulating and restoring, the simulation prediction results of China’s fuel vehicle sales from 2017 to 2021 are obtained, as shown in
Table 4.
Based on the calculation results in
Table 4, the prediction using the buffer data sequence yields an average relative error of only 0.27%. This simulation prediction effect outperforms the traditional GM (1, 1) model, which directly relies on the original data. Hence, the buffer data sequence is used for GM (1, 1) modeling to forecast future fuel vehicle sales in China, as depicted in
Table 5. Between 2022 and 2025, China’s fuel vehicle sales will continue to decline slowly, and are expected to fall to 20.50 million in 2025.
4.3.3. China’s EV Market Penetration Rate Forecast
According to Formula (1) for calculating the market penetration rate of EVs, combining the simulated forecast data of EV sales and fuel vehicle sales in
Table 2 and
Table 4, we can test the simulation effect of China’s EV market penetration rate. The results are shown in
Table 6.
In Scenario I, which involves the continuation of the support policy for the EV industry, the original sales data sequences of EVs and fuel vehicles are both buffered. The prediction of the market penetration rate for EVs results in an average relative error of 6.98%. In Scenario II, the subsidy policy is discontinued, and the first-buffered EV sales data sequence is buffered once again to eliminate the disturbance caused by the industrial policy. Based on the second-order buffered data sequence, the GM (1,1) model is applied to forecast the future sales of EVs in China, while the fuel vehicle forecast remains consistent with Scenario I. The results show that the average relative error in Scenario II is 2.14%. Both simulation predictions in these scenarios indicate favorable outcomes. According to the forecasted sales figures of EVs and fuel vehicles, as shown in
Table 3 and
Table 5, the market penetration rate of EVs in China from 2022 to 2025 can be calculated as presented in
Table 7.
4.4. Result Analysis
In 2020, the State Council issued The New Energy Vehicles Industry Development Plan (2021–2035), which outlined a clear objective for China’s EV industry: to achieve a 20% market penetration rate by 2025. Based on the forecast results presented in
Table 7, it is projected that, under EV support policies like fiscal subsidies and tax relief from 2022 to 2025, the goal could be surpassed ahead of schedule in 2024, with a projected market penetration rate of 22.45% in that year, which would further increase to 26.75% by 2025. Additionally, even in Scenario II, in which the EV support policies are discontinued after 2022, the target of a 20% market penetration rate can still be achieved by 2025, with an estimated rate of 20.58%.
In recent years, the implementation of promotion policies, such as financial subsidies and tax relief, has significantly bolstered the sales of EVs in China. This has been accompanied by a growing consumer understanding and acceptance of the advantages offered by EVs. Concurrently, China’s EV industry has made notable strides in core technological innovation, resulting in a continuous decline in production costs for batteries and other key components. Furthermore, there have been remarkable improvements in key technical indicators, such as a substantial increase in endurance mileage and a clear reduction in power consumption per 100 km. According to relevant data, the average range of China’s A-class pure EVs has expanded, from 300.4 km in 2017 to 467.9 km in 2021, while power consumption per 100 km has decreased, from 15.7 KWh in 2017 to 12.5 KWh in 2021. In addition, the variety of EVs available for purchase has expanded, offering consumers a wider range of choices. According to statistics, there were 289 types of EVs on sale in China in 2021, of which 70 were newly launched in that year, basically covering all models. With these joint forces of super position, China’s EV industry is on the track of rapid development.
According to Jeffrey Moore’s theory on Crossing the Chasm [
41], high-tech products must traverse a transitional phase before gaining acceptance in the mainstream market. That is, when the market penetration rate of products reaches 16%, new technologies and products will be rapidly popularized to the mass market. Based on the forecast results presented in
Table 7, China’s EV market penetration rate is projected to surpass the critical 16% threshold in 2023. Specifically, it is expected to reach 18.66% or 16.49%, under Scenario I or Scenario II, respectively, and is about to enter the stage of rapid development in the mass market. This means that China’s EV industry has a certain degree of independent development capability and can withstand market fluctuations without support policies, and it can exceed the 20% predetermined target by 2025 on schedule.
5. Conclusions and Policy Implications
5.1. Research Conclusions
Firstly, we introduced an innovative approach by integrating the buffer operator with the traditional GM (1,1) model to forecast the market penetration rate of EVs in China. To weaken the effects of volatile international oil prices and industrial support policies on EV sales, a dual-buffering technique was applied for the EV sales data. The predictions were made under two scenarios, namely Scenario I and Scenario II, which consider whether to continue to implement industrial support policies. Additionally, a first-order buffering technique is applied to the sales data of fuel vehicles to reduce the impact of oil price fluctuations and the COVID-19 epidemic. The results demonstrate that buffering the original data sequence and subsequently utilizing the GM (1,1) model for prediction significantly improves accuracy compared to direct modeling of the raw data. Therefore, this method is deemed more suitable for forecasting EV sales in China.
Secondly, based on the forecasted sales of EVs and fuel vehicles, the predictions for the EV market penetration rate in the years 2022–2025 indicate that the EV industry in China possesses a self-development capacity. Even in the absence of industrial support policies, the target of reaching a market penetration rate of 20% by 2025 can still be attained. However, if the support policies for the EV industry are sustained, a market penetration rate of 22.45% is projected in 2024, allowing for the achievement of the target one year ahead of schedule. Therefore, the government can make corresponding industrial policies based on this forecast result.
5.2. Policy Implications
Considering the pivotal role played by financial subsidies and tax relief in promoting the growth of China’s EV market consumption, a sudden and complete suspension of these support policies would likely result in a significant market downturn, undermining the healthy development of the EV industry. Simultaneously, the transportation sector is under immense pressure to reduce carbon emissions in order to achieve China’s dual-carbon goal. In line with this objective, the Roadmap for Energy Conservation and New Energy Vehicles Technology 2.0, published in October 2020, sets the target for the automobile industry to reach the peak of its carbon emission by 2028, which would render it two years ahead of the nation’s overall carbon emissions in 2030. To ensure the timely achievement of this goal and prevent significant market fluctuations, we present the following policy recommendations:
Firstly, the current financial support policy for EVs can be continued for a period of time under this premise, with an appropriate reduction in intensity, thus ensuring a smooth transition for the EV market. The decision of the State Council to maintain the exemption of purchase tax on EVs in 2023, while discontinuing purchase subsidies for newly licensed EVs, is primarily aimed at mitigating the potential market impact resulting from subsidy reductions.
Secondly, support policies for the EV industry should be adjusted from monetary support to non-monetary support. With the continuous expansion of the scale of China’s EV industry and the maturity of the related technology, the price of EVs will continue to decrease, which can make up for the economic burden on consumers caused by the withdrawal of monetary policies, such as subsidies and tax cuts, to a certain extent. In the future, the support policy for the EV industry should mainly take the form of non-monetary policy tools regarding the right to the road, such as purchase and travel restrictions. Simultaneously, it is crucial to intensify investment in infrastructure such as charging stations [
42], to bolster the research and innovation of battery technology and optimize the performance of Evs [
43], which can alleviate consumers’ anxieties surrounding charging.


