Article

Phosphorus Sorption by Purple Soils in Relation to Their Properties: Investigation, Characterization, and Explanation

1
State Key Laboratory of Hydraulics and Mountain River Engineering, College of Water Resource & Hydropower, Sichuan University, Chengdu 610065, China
2
School of Biological Sciences, University of Western Australia, 35 Stirling Highway, Crawley, WA 6009, Australia
3
Key Laboratory of Mountain Surface Processes and Ecological Regulation, Institute of Mountain Hazards and Environment, Chinese Academy of Sciences & Ministry of Water Conservancy, Chengdu 610041, China
*
Authors to whom correspondence should be addressed.
Sustainability 2023, 15(19), 14609; https://doi.org/10.3390/su151914609
Submission received: 25 July 2023 / Revised: 19 September 2023 / Accepted: 27 September 2023 / Published: 9 October 2023

Abstract

:
Improved soil phosphorus (P) management can be achieved through an understanding of regional soil–P interactions and their relation to soil properties. To this end, soil samples from different use types (paddy soils, dry farmland soils, forest soils, and urban green land soils) were collected from 10 sites across the west to the east of Sichuan Basin, China. These samples were analyzed to determine their P sorption properties and physical and chemical compositions. P sorption was described using a modified Freundlich equation. The results demonstrated a gradient in P sorption within the basin, characterized by higher values in urban areas and a west-to-east decrease trend, along with the null-point values of soil sorption–desorption equilibrium. This variation was linked to the extensive use of P fertilizer, which altered soil particle surface conditions and significantly reduced both the quantity and rate of subsequent fertilizer sorption. Furthermore, P sorption was found to be correlated with the soil clay fraction, amorphous aluminum oxides, and soil organic matter contents. Urban expansion and accelerated erosion of productive agricultural land increase mean soil particle size and may decrease soil P holding and retention capacity. As preliminary deterioration in soil properties was found, conservative soil management is needed to address the potential threats of soil degradation in the central Sichuan Basin.

Graphical Abstract

1. Introduction

Over the past few decades, human activities have been the drivers of ecosystem transformations through the conversion of natural landscapes into agricultural and urbanized lands, causing significant evolutions in soil physical and chemical properties [1,2,3]. The behavior of phosphorus (P) is affected by its reactions with soil, including sorption reactions that determine its movement towards plant roots and removal from soil by leaching [4]. Measuring the amount of P sorbed and summarizing the sorption curves facilitates the interpretation of the sorption properties, and these values can be used to predict the fertilizer requirements [5].
Phosphate reacts with specific sites on the surface of variable charge particles through a process known as “specific adsorption”. This reaction is reversible and influenced by the electric potential of the reacting surfaces. Adsorption can be plotted against concentration to demonstrate the incomplete nature of the reaction. A subsequent slower reaction likely occurs due to solid-state diffusion into the particles. The entire process is referred to as “sorption”. The Langmuir equation, widely used in describing soil P sorption behavior [6,7,8], allows for the calculation of a maximum sorption [7,9]. However, the fitted value for the maximum is usually exceeded by the data; this occurs because the equation does not describe observed sorption by soil very closely. The equation also faces issues in describing ion sorption in soils because it assumes a uniform surface and no alteration of surface properties except for site occupancy [5]. Yet, soil surfaces are typically non-uniform, and reactions introduce negative charges, reducing further reactions. In experiments studying sorption kinetics, solution concentration decreases over time as sorption increases, resulting in varying shapes of sorption over time and concentration over time plots depending on the degree of sorption, which are traditionally characterized using the Elovich equation or combinations of first-order rate equations [10,11,12]. However, recent research has demonstrated that these diverse shapes can be effectively described by a single simplified equation.
In the realm of modeling external variables like time, phosphate concentration, temperature, and pH, simple equations provide accurate representations, playing a vital role in comprehending the underlying processes and facilitating cross-soil comparisons. A fundamental component of this modeling approach involves employing the Freundlich equation to elucidate concentration effects. Despite its lack of a mechanistic foundation, it arises as a result of soil heterogeneity [13,14]. The Freundlich equation offers improved sorption description by postulating heterogeneous surfaces with a logarithmic distribution of binding constants. When considering reactions with soils, heterogeneity is more effectively characterized through the assumption of a normal distribution, permitting the depiction of cation and anion reactions at the negative and positive ends of the distribution, respectively. Notably, for minimal sorption quantities, such as with selenite, the Freundlich equation proves inadequate due to the fractional power’s increase with rising sorption [15]. Conversely, for phosphate, typically measured at relatively high sorption levels, the Freundlich equation serves as a suitable approximation.
Purple soils in southwest China are highly fertile. Especially in the Sichuan Basin, 70% of the arable land is on purple sandstone and shale, easily weathered and generally coarse in texture. They developed on Mesozoic (Triassic, Jurassic, and Cretaceous) and Tertiary sedimentary rocks and are classified as entisols in the USDA Soil Taxonomy [16,17]. The region is densely populated and has a long history of agriculture; it produces 10% of the country’s food and livestock feed on 7% of China’s arable land [16]. Many researchers have been focusing on P sorption and leaching processes in the Sichuan Basin and the associated factors that influence P transport and transformation processes [18,19,20,21]. Soil P loss exceeding 1.0 kg ha−1 has been recorded during heavy and storm rain events [22,23,24]. Prior reaction with P adds a negative charge to the reacting surfaces and this decreases the P buffering capacity; prior reaction with P fertilizer also slows the diffusive movement of phosphate into the adsorbing particles.
The phenomena of P sorption and leaching in purple soils remain elusive in experimental observations and model interpretations. Without a comprehensive understanding of these effects, there is a risk of the over-application of P fertilizer, potentially leading to water pollution. Thus, the present study aimed to (1) characterize the P sorption by purple soils in relation to their properties and (2) assess the relationship between sorption parameters and soil P status, soil use types, and soil degradation trends.

2. Materials and Methods

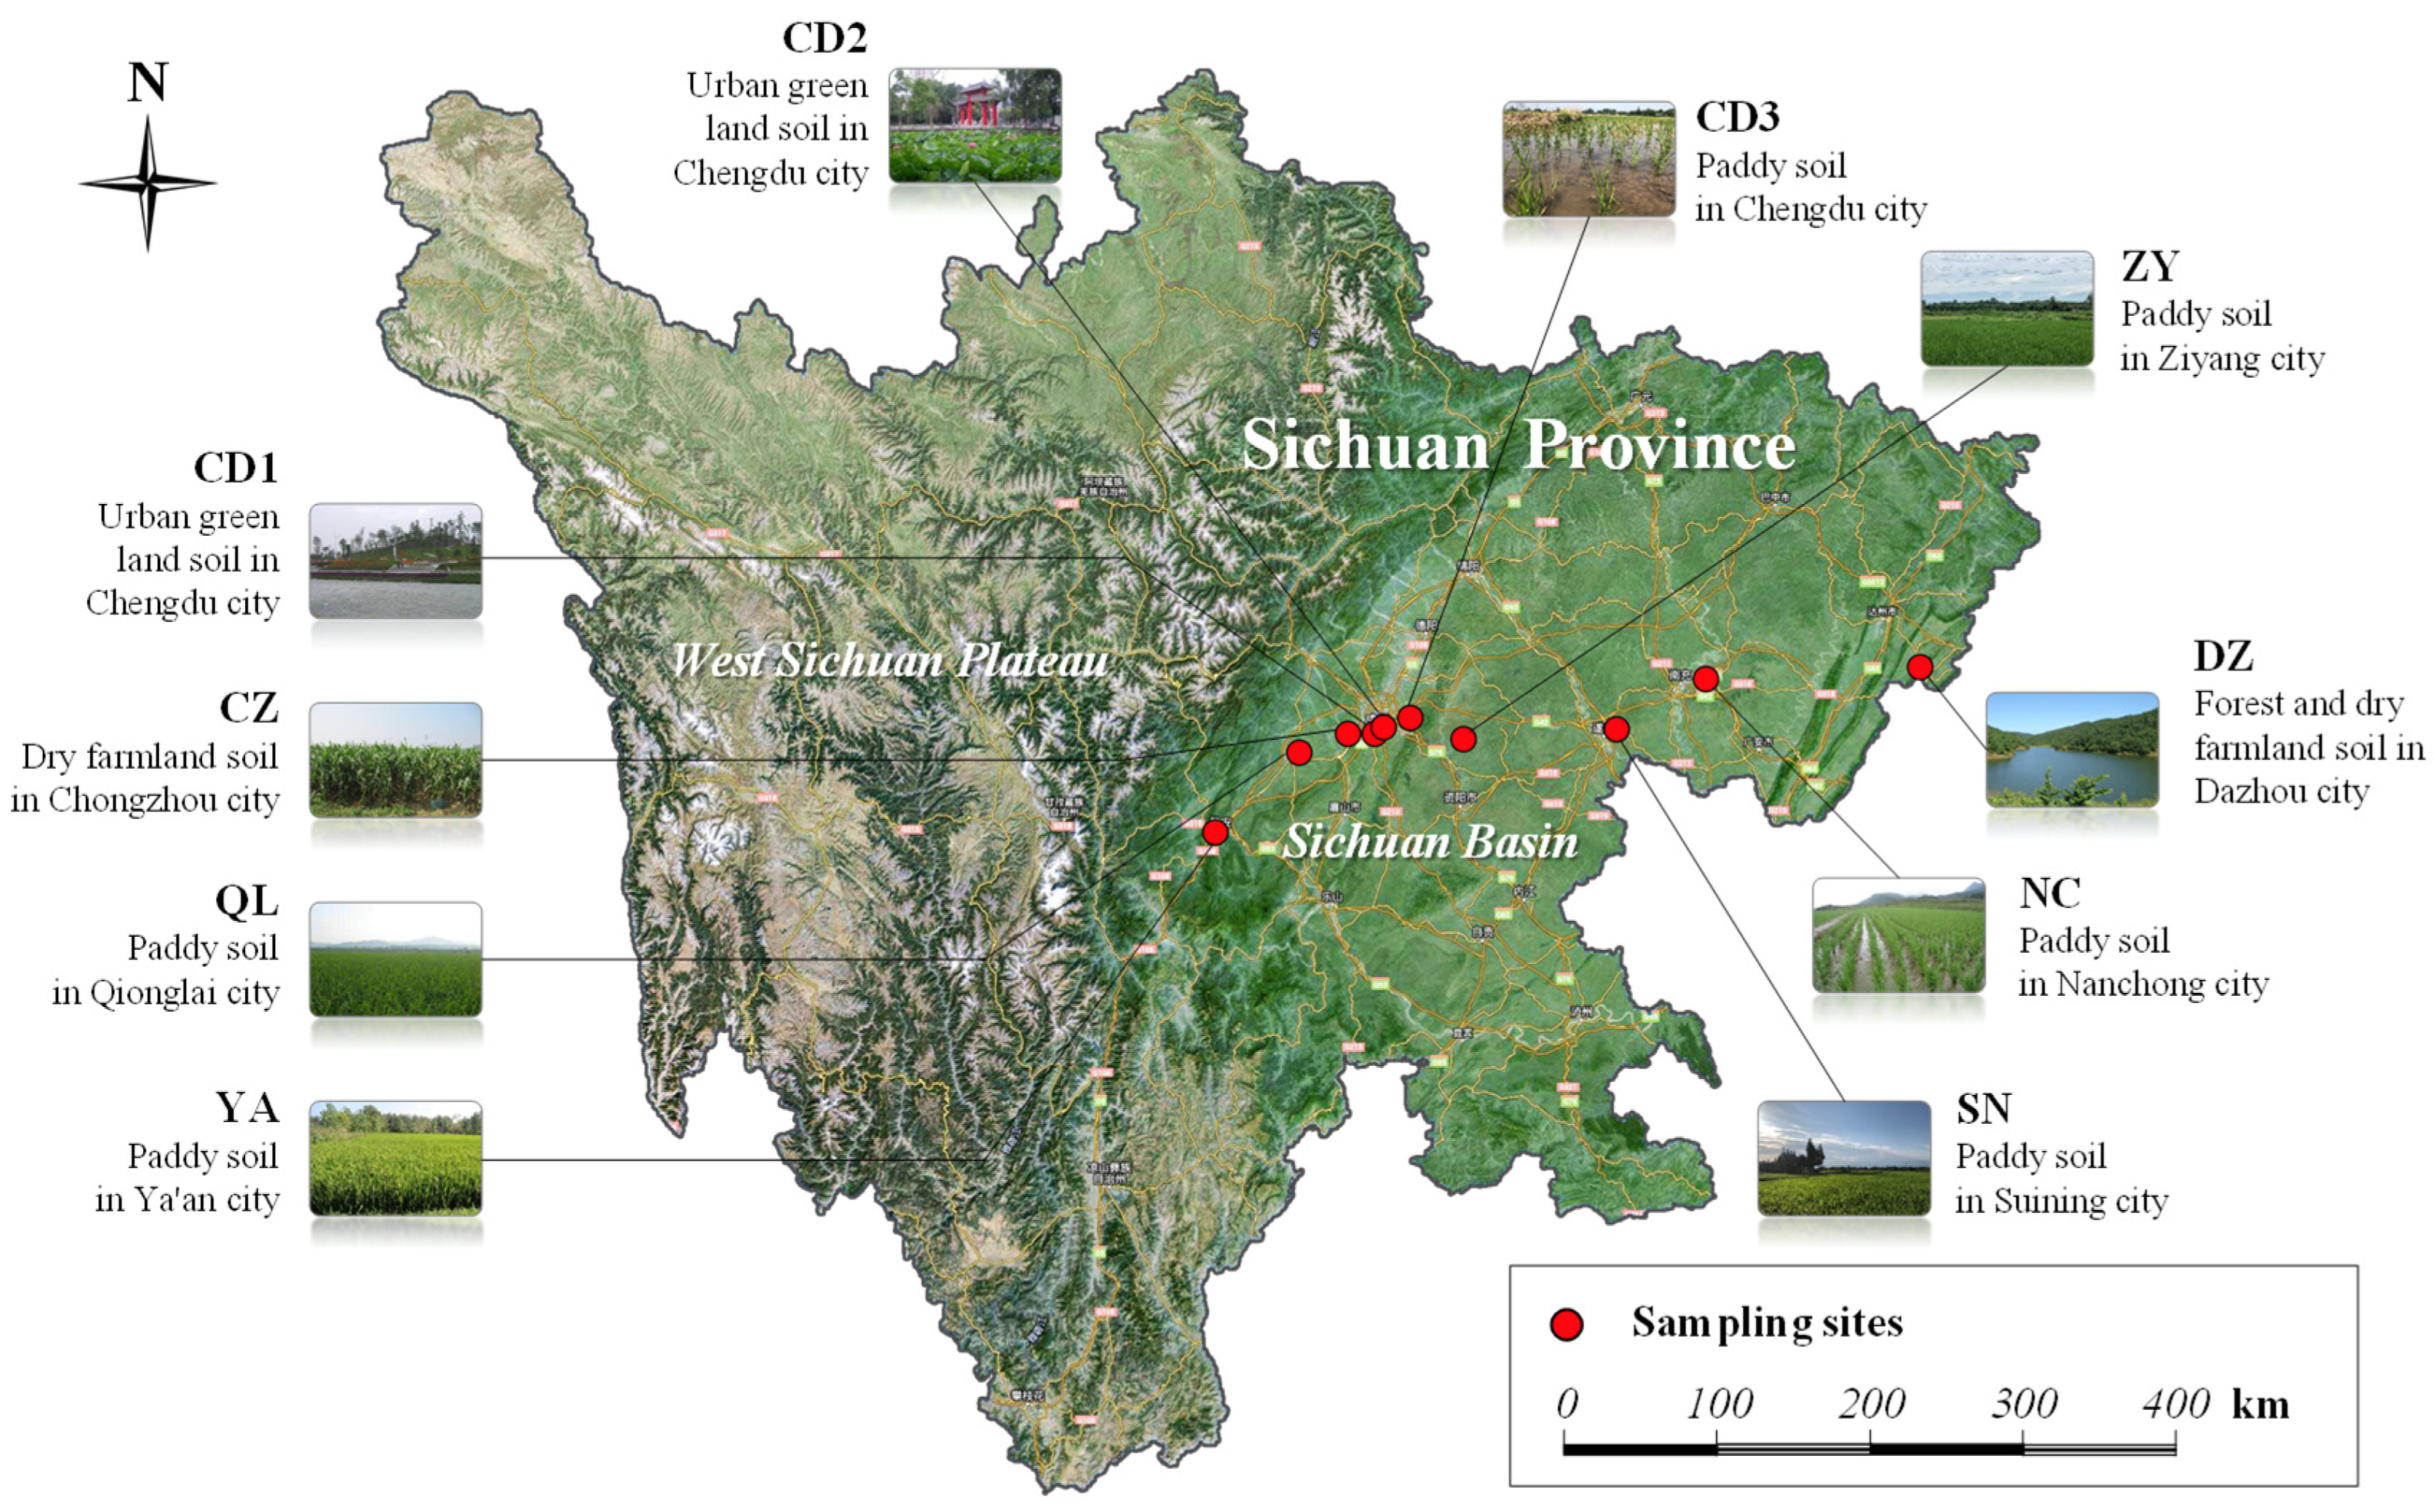
2.1. Soil Sampling and Treatment

The sampling sites were distributed in a significant agricultural belt with a latitude range of 29°58′ N–30°52′ N and a longitude range of 102°59′ E–107°37′ E within the Sichuan Basin in Sichuan Province. The sites were oriented west-to-east through the hilly region of west and central Sichuan, the Chengdu Plain, and the parallel ridge and valley area of east Sichuan, China. The study area has a subtropical monsoon climate, characterized by year-round warm and humid weather, high cloud cover, few sunny days, an annual average temperature of 16–18 °C, a daytime temperature of ≥10 °C for 240–280 consecutive days a year, a small diurnal temperature range and large annual temperature range, warm winters and hot summers, and a frost-free period of 230–340 days. The annual precipitation is 900–1200 mm, with 90% occurring from May to October. Soils of the study area consist of highly fertile, purple-brown forest soils, which rapidly adsorb and lose nutrients but are highly prone to erosion. Non-calcareous alluvial soils and paddy soils are widely distributed in the study area. These soils are the most crucial soil class groups for agriculture owing to their high fertility and are mainly formed from fertile black soils eroded from the peripheral areas of Tibet. Soil samples were collected from the cities of Ya’an (YA), Qionglai (QL), Chongzhou (CZ), Chengdu (CD), Ziyang (ZY), Suining (SN), Nanchong (NC), and Dazhou (DZ) (Figure 1). The coordinates of the sites are listed in the Supplementary material (Table S1).
Based on the investigation report for the General Plan of Land Use of Sichuan Province from the Sichuan Provincial People’s Government [25], sampling sites were chosen to represent the local agricultural or natural soil conditions, including paddy soils, dry farmland soils, forest soils, and grassland soils. Although the limited sampling sites in this study could not cover the entire Sichuan Basin, variations in the interaction pattern between P and soil due to changes in the physical and chemical properties of the soil can be detected at large scales.

2.2. Physical and Chemical Analysis of Sampled Soils

Surface soils within a depth of 20 cm were collected with a stainless soil auger and sealed in separate sampling bags. The samples were air-dried for 21 days, and then ground by a ceramic mortar and pestle, sieved through 2 mm sieves, and stored in sample bags before testing. The collected soil samples were tested for grain size composition, total phosphorus (TP), total nitrogen (TN), amorphous iron oxides (Fe[amo]), amorphous aluminum oxides (Al[amo]), soil organic matter (SOM), and pH. Grain size distribution was determined using a Mastersizer 3000 laser diffraction particle size analyzer (Malvern Panalytical, UK), and the soil texture was determined according to the soil taxonomy of USDA [26]. Five grams of the sieved sample was mixed with 25 mL of deionized water, shaken at 160 times min−1 using a reciprocating, constant-temperature water-bath shaker (SHA-B, Yoke Instrument, Shanghai, China), and set aside for 30 min. The pH of the supernatant was measured using a pHS-3C pH meter (INASE Scientific Instrument Co., Ltd., Shanghai, China). Soil TP was measured following the perchloric acid digestion procedure with minor revision [27,28]. For each sample, 0.2 g of the ground and sieved soil sample was placed in a digestion tube and 3 mL of 70% HClO4 was added. The tube was placed in an aluminum digestion block and the sample digested at 200 °C for 75 min; a funnel was placed atop the tube throughout the digestion to ensure refluxing of HClO4. Following digestion, the digest was allowed to cool and then diluted with distilled water to 50 mL. The tube was stoppered, inverted several times to mix the contents, and allowed to stand overnight; the residue was removed from the extract by centrifugation at 5000 rpm for 15 min, thereby permitting P analysis. The digestion procedure was also used to determine the soil TN [29]. The P and N contents of the digested soils were measured via colorimetry using a Proxima continuous flow analyzer (AMS Alliance, Frepillon, France). For Fe[amo] and Al[amo], extraction was performed using an oxalic acid–ammonium oxalate buffer solution [30], and the Fe[amo] and Al[amo] concentrations were measured by inductively coupled plasma–optical emission spectrometry using the 720-ES ICP-OES system (Agilent Technologies, Inc., Santa Clara, CA, USA). The SOM content was measured using the Walkley–Black method [31].

2.3. Sorption Experiments for Sampled Soils

For each soil, there were two sets of measurements of phosphate sorption; in one, sorption was measured after 24 h for a range of initial concentrations, and in the other, sorption was measured after different periods at one initial concentration. The protocol was adapted from Barrow and Debnath [32]. For both sets, 2 g of the ground and sieved soil sample were weighed, dispersed in 0.01 M KCl solution, and made up to a volume of 30 mL with appropriate volumes of KH2PO4. For the first set, the concentrations were 5, 10, 20, 30, 40, 60, and 80 mg·L−1. For the second set, an initial concentration of 40 mg·L−1 was used for most soils, but 60 mg·L−1 was used for soil YA because of its higher sorption; the periods of mixing were 0.25, 0.5, 1, 2, 5, 10, 24, 32, and 48 h. The pH of each solution was adjusted to 7 using a 0.01 M HCl solution and 0.01 M NaOH solution, and one drop of 0.1% chloroform solution was added to eliminate the influence of microbial activity on the experiments. After the soil suspension had been shaken with a reciprocating shaker at an amplitude of 6 cm and a frequency of 150 oscillations per minute at 25 ± 1 °C for 24 h, centrifugation was performed at 5000 rpm for 15 min. The resultant liquid was passed through a 0.45 μm membrane filter and analyzed with a Proxima continuous flow analyzer to measure the P concentration in the supernatant. Three replicate samples were tested for each soil type, and the average value was used as the final measurement result of the amount of P sorbed. Consequently, we considered that measurements after 24 h of sorption were adequate to characterize differences between soils.

2.4. Model Characterization

In order to describe the effect of solution concentration and time on sorption, the measured data were described by a modified Freundlich equation, including the effect of time [33], which is a 4-parameter model, as shown by Equation (1).
S = a c b 1 t b 2 q t b 2
The variables of Equation (1) are not independent, as the sorption was calculated from the observed solution concentration. Equation (2) was used to predict values for any pair of values for the initial concentration and the solution concentration simultaneously at a given soil/solution ratio.
S = c i c R s s
where S (mg·kg−1) is the amount of P adsorbed by the soil at the solution concentration c (mg·L−1) and at time t (h); q is formally equal to the P that could be desorbed if the solution concentration could be maintained at zero; ci (mg·L−1) is the initial concentration, and Rss is the solution/soil ratio (Rss = 15 in this study). The parameter a reflects both the binding strength of P at the sorption sites and the number of sorption sites.
In the present study, the effects of concentration were measured after one period of reaction, and the effects of the period of reaction were measured at one initial concentration. There were therefore insufficient data to fully explore the concentration–time surface. We therefore used a simplified equation in which the same index term (b2) was used for both time components of the equation. This may be explained as follows. The “null-point” (the concentration at which neither sorption nor desorption occurs) is given when S = 0 and a c b 1 t b 2 = q t b 2 . When the equation is specified in this way, the null-point does not change with time. This form of the equation is appropriate for soils in which phosphate has had a long time to react; further changes are slow.
Parameter b1 describes the curvature of plots of sorption versus solution concentration. Its main determinant is the heterogeneity of the reacting surfaces [33]. The parameter b2 describes the curvature of plots of sorption versus time. It is an important determinant of phosphate effectiveness.
The BASIC program [34] was used to fit the equations. For any given value of the parameters, the program finds the solution to the simultaneous equations by a series of extrapolations. A subroutine based on the simplex algorithm then adjusts the values of the parameters to find the values that minimize the sums of squares for the deviations between the observed values and the predicted values.
When fitting data with Equation (1), the coefficients are correlated—that is, variation in one can be partly compensated by variation in another. We decided to use an equation with the value of b1 common to all soils because this gave us more consistent values of the other parameters. We tried different values of this parameter and chose the value (0.30) that gave the smallest residual sums of squares. We preferred this simplification even though it caused a significant increase in the residual sums of squares (Table 1). A detailed comparison of the fitting results between common and separate values of b1 is listed in the Supplementary material (Table S2).

3. Results

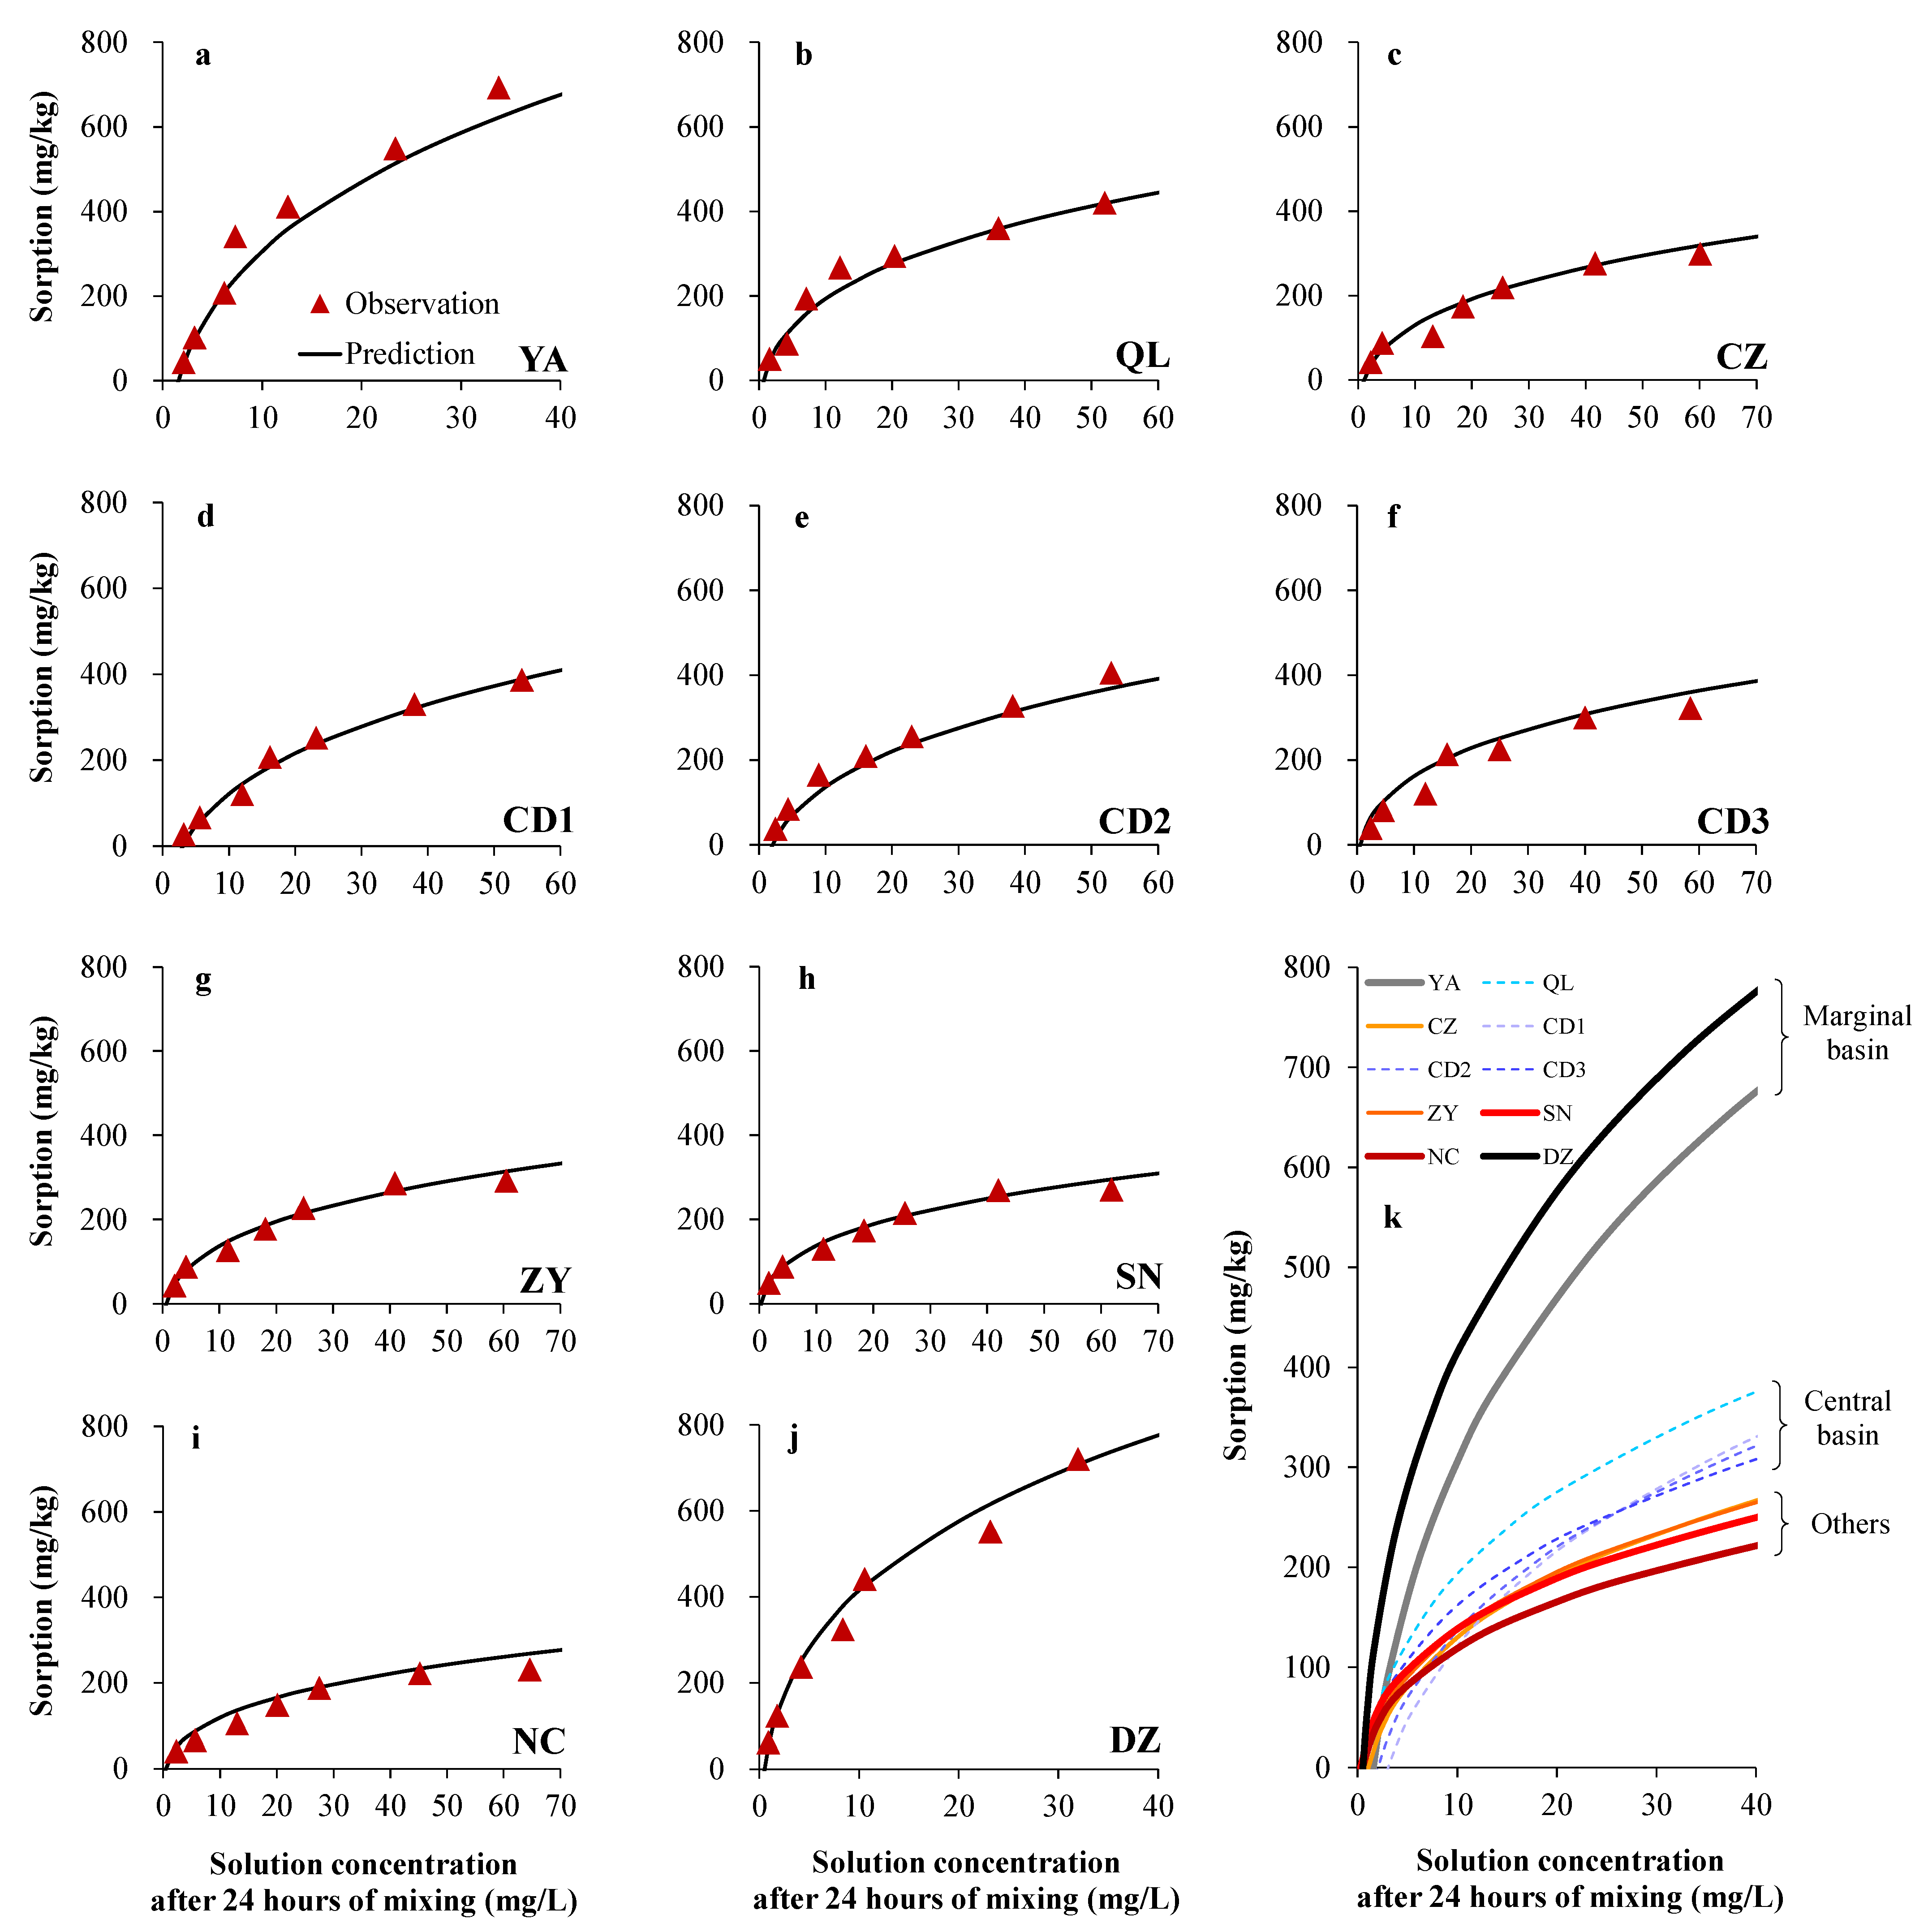
3.1. Phosphorus Sorption Properties

The sorption behavior of P was assessed using the modified Freundlich equation, affirming the effectiveness of this equation in describing the sorption characteristics of the sampled soils. Individual sorption curves, as depicted in Figure 2a–j, exhibited variations across different locations. Figure 2k provides a comparative analysis of these curves, revealing that soils YA and DZ demonstrated the highest phosphate sorption capacities, as indicated by the solid lines. The Supplementary material (Table S3) contains the corresponding values for the a parameter. In contrast, soils around Chengdu City (QL, CD1, CD2, CD3), represented by the blue dashed lines, displayed lower phosphate sorption capacities. Soils from other sites in the central and eastern regions, represented by the orange and red lines, exhibited the lowest phosphate sorption capacities.

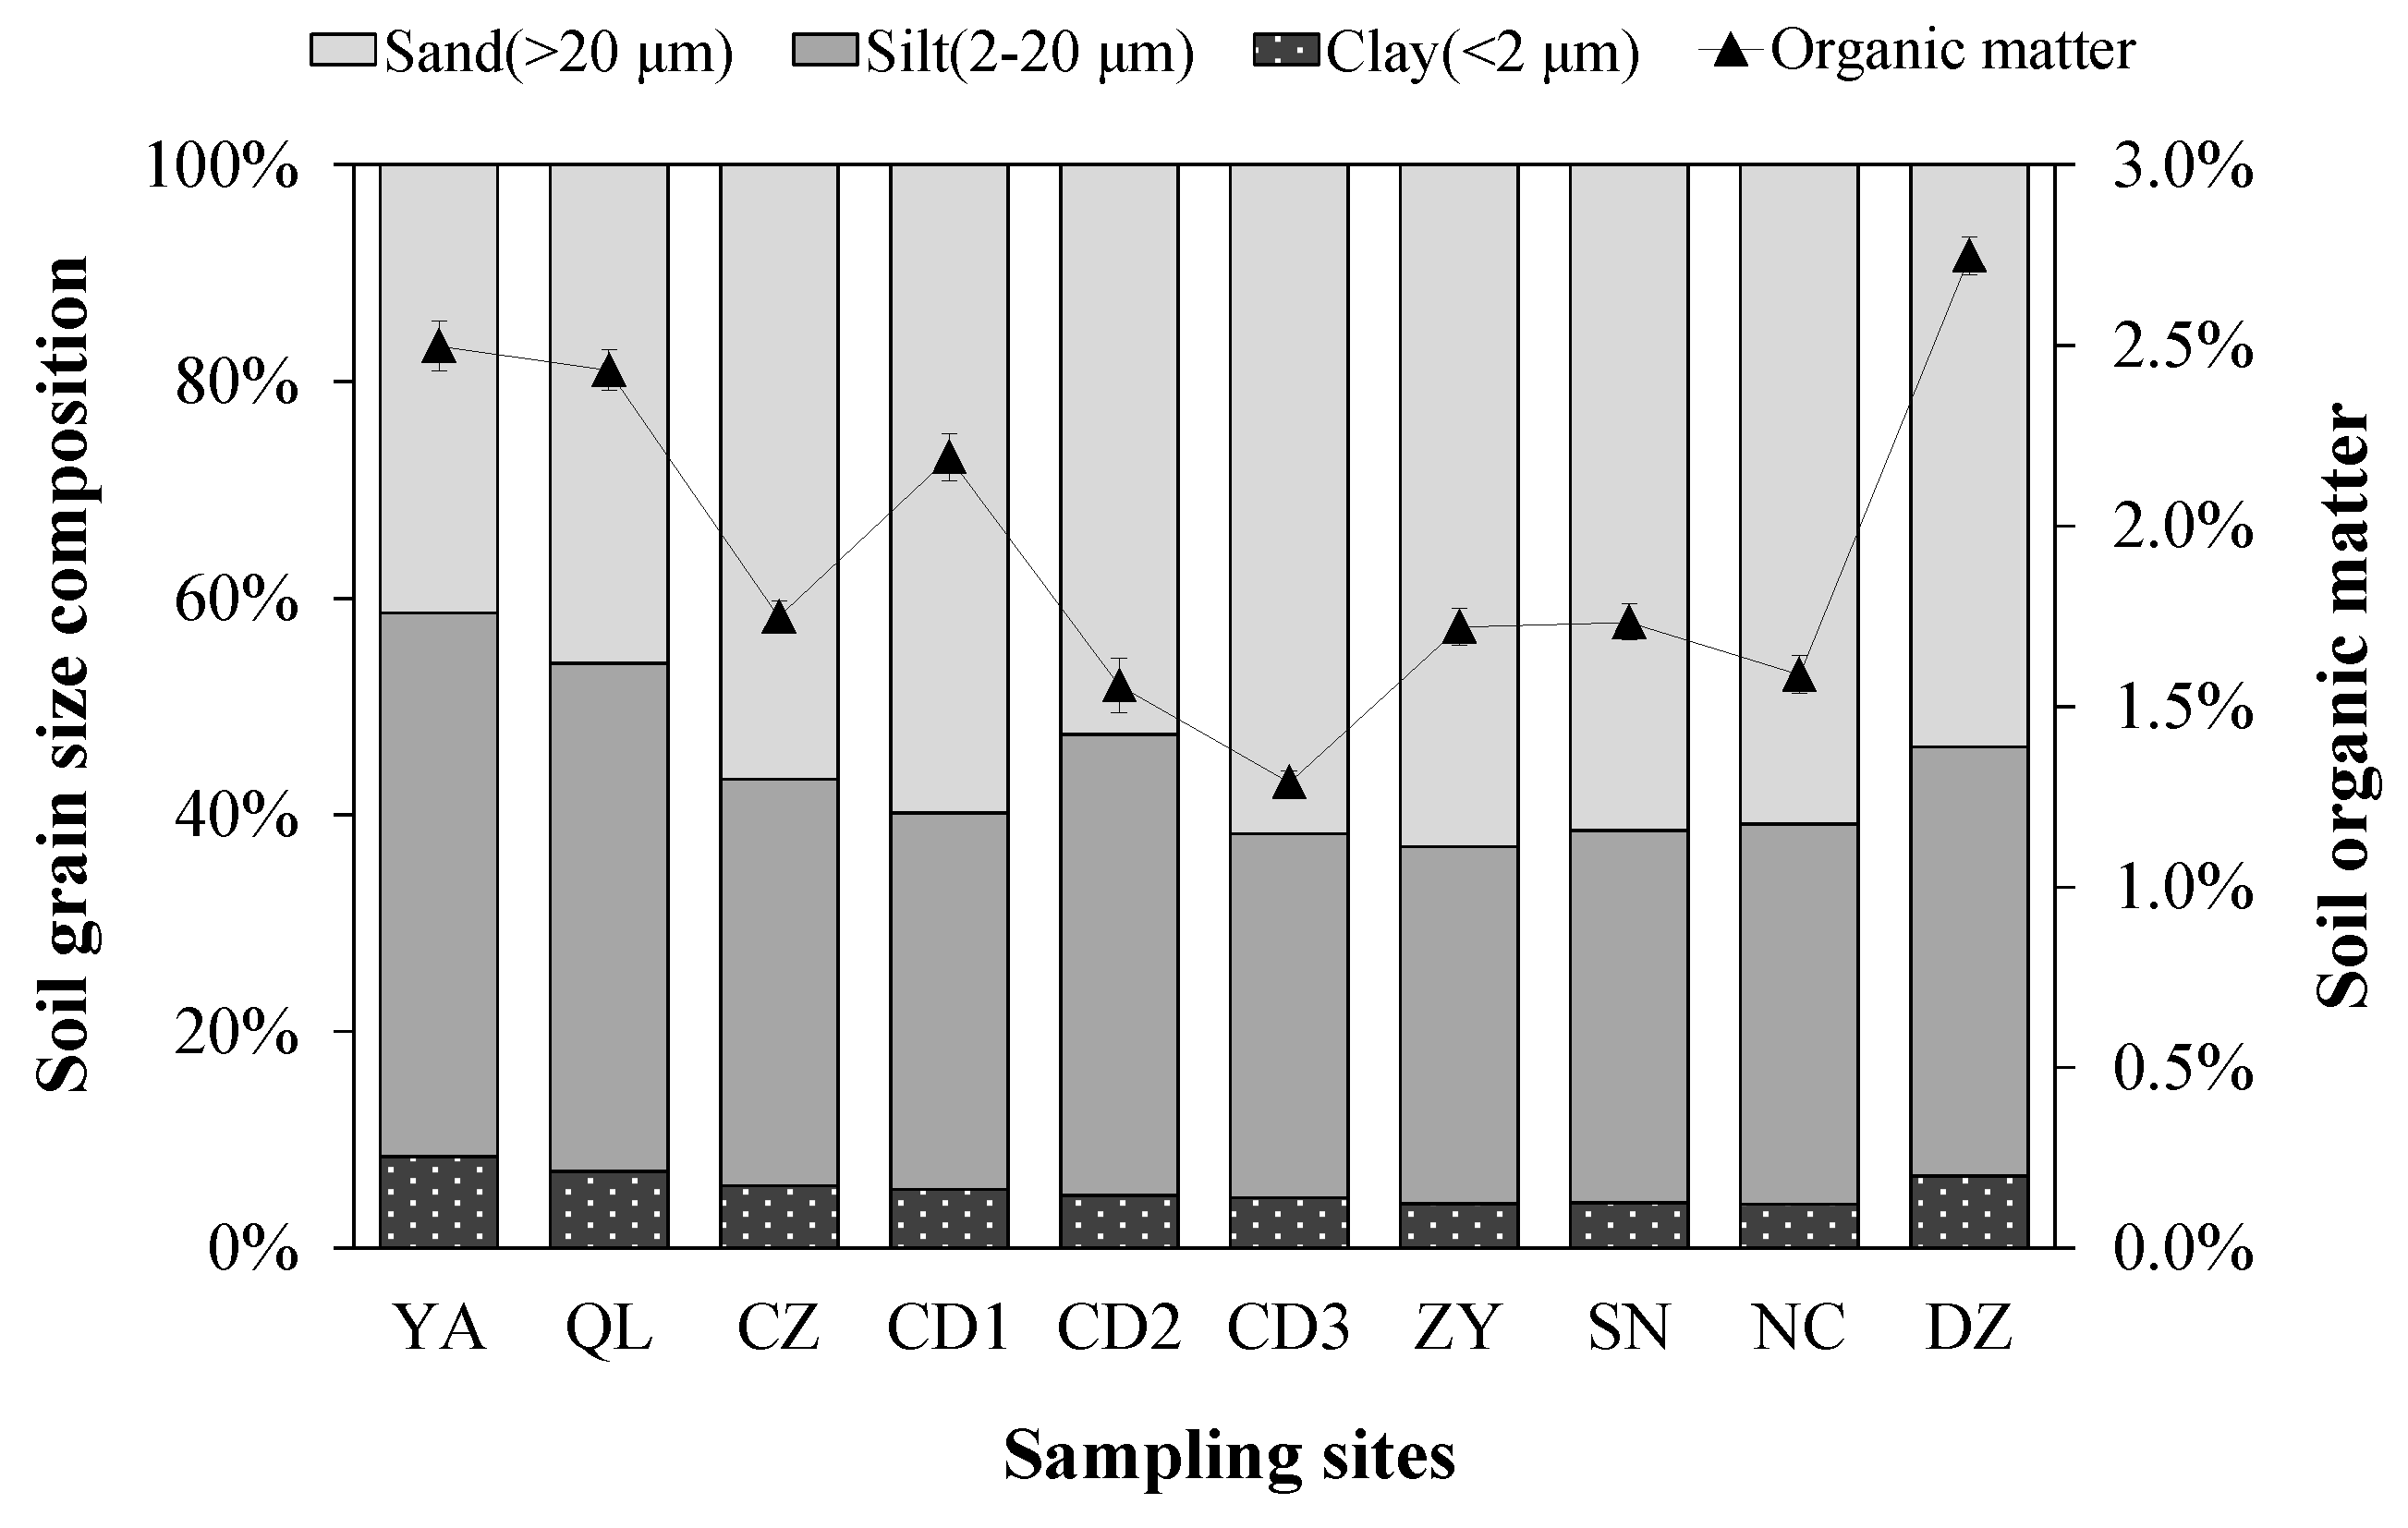
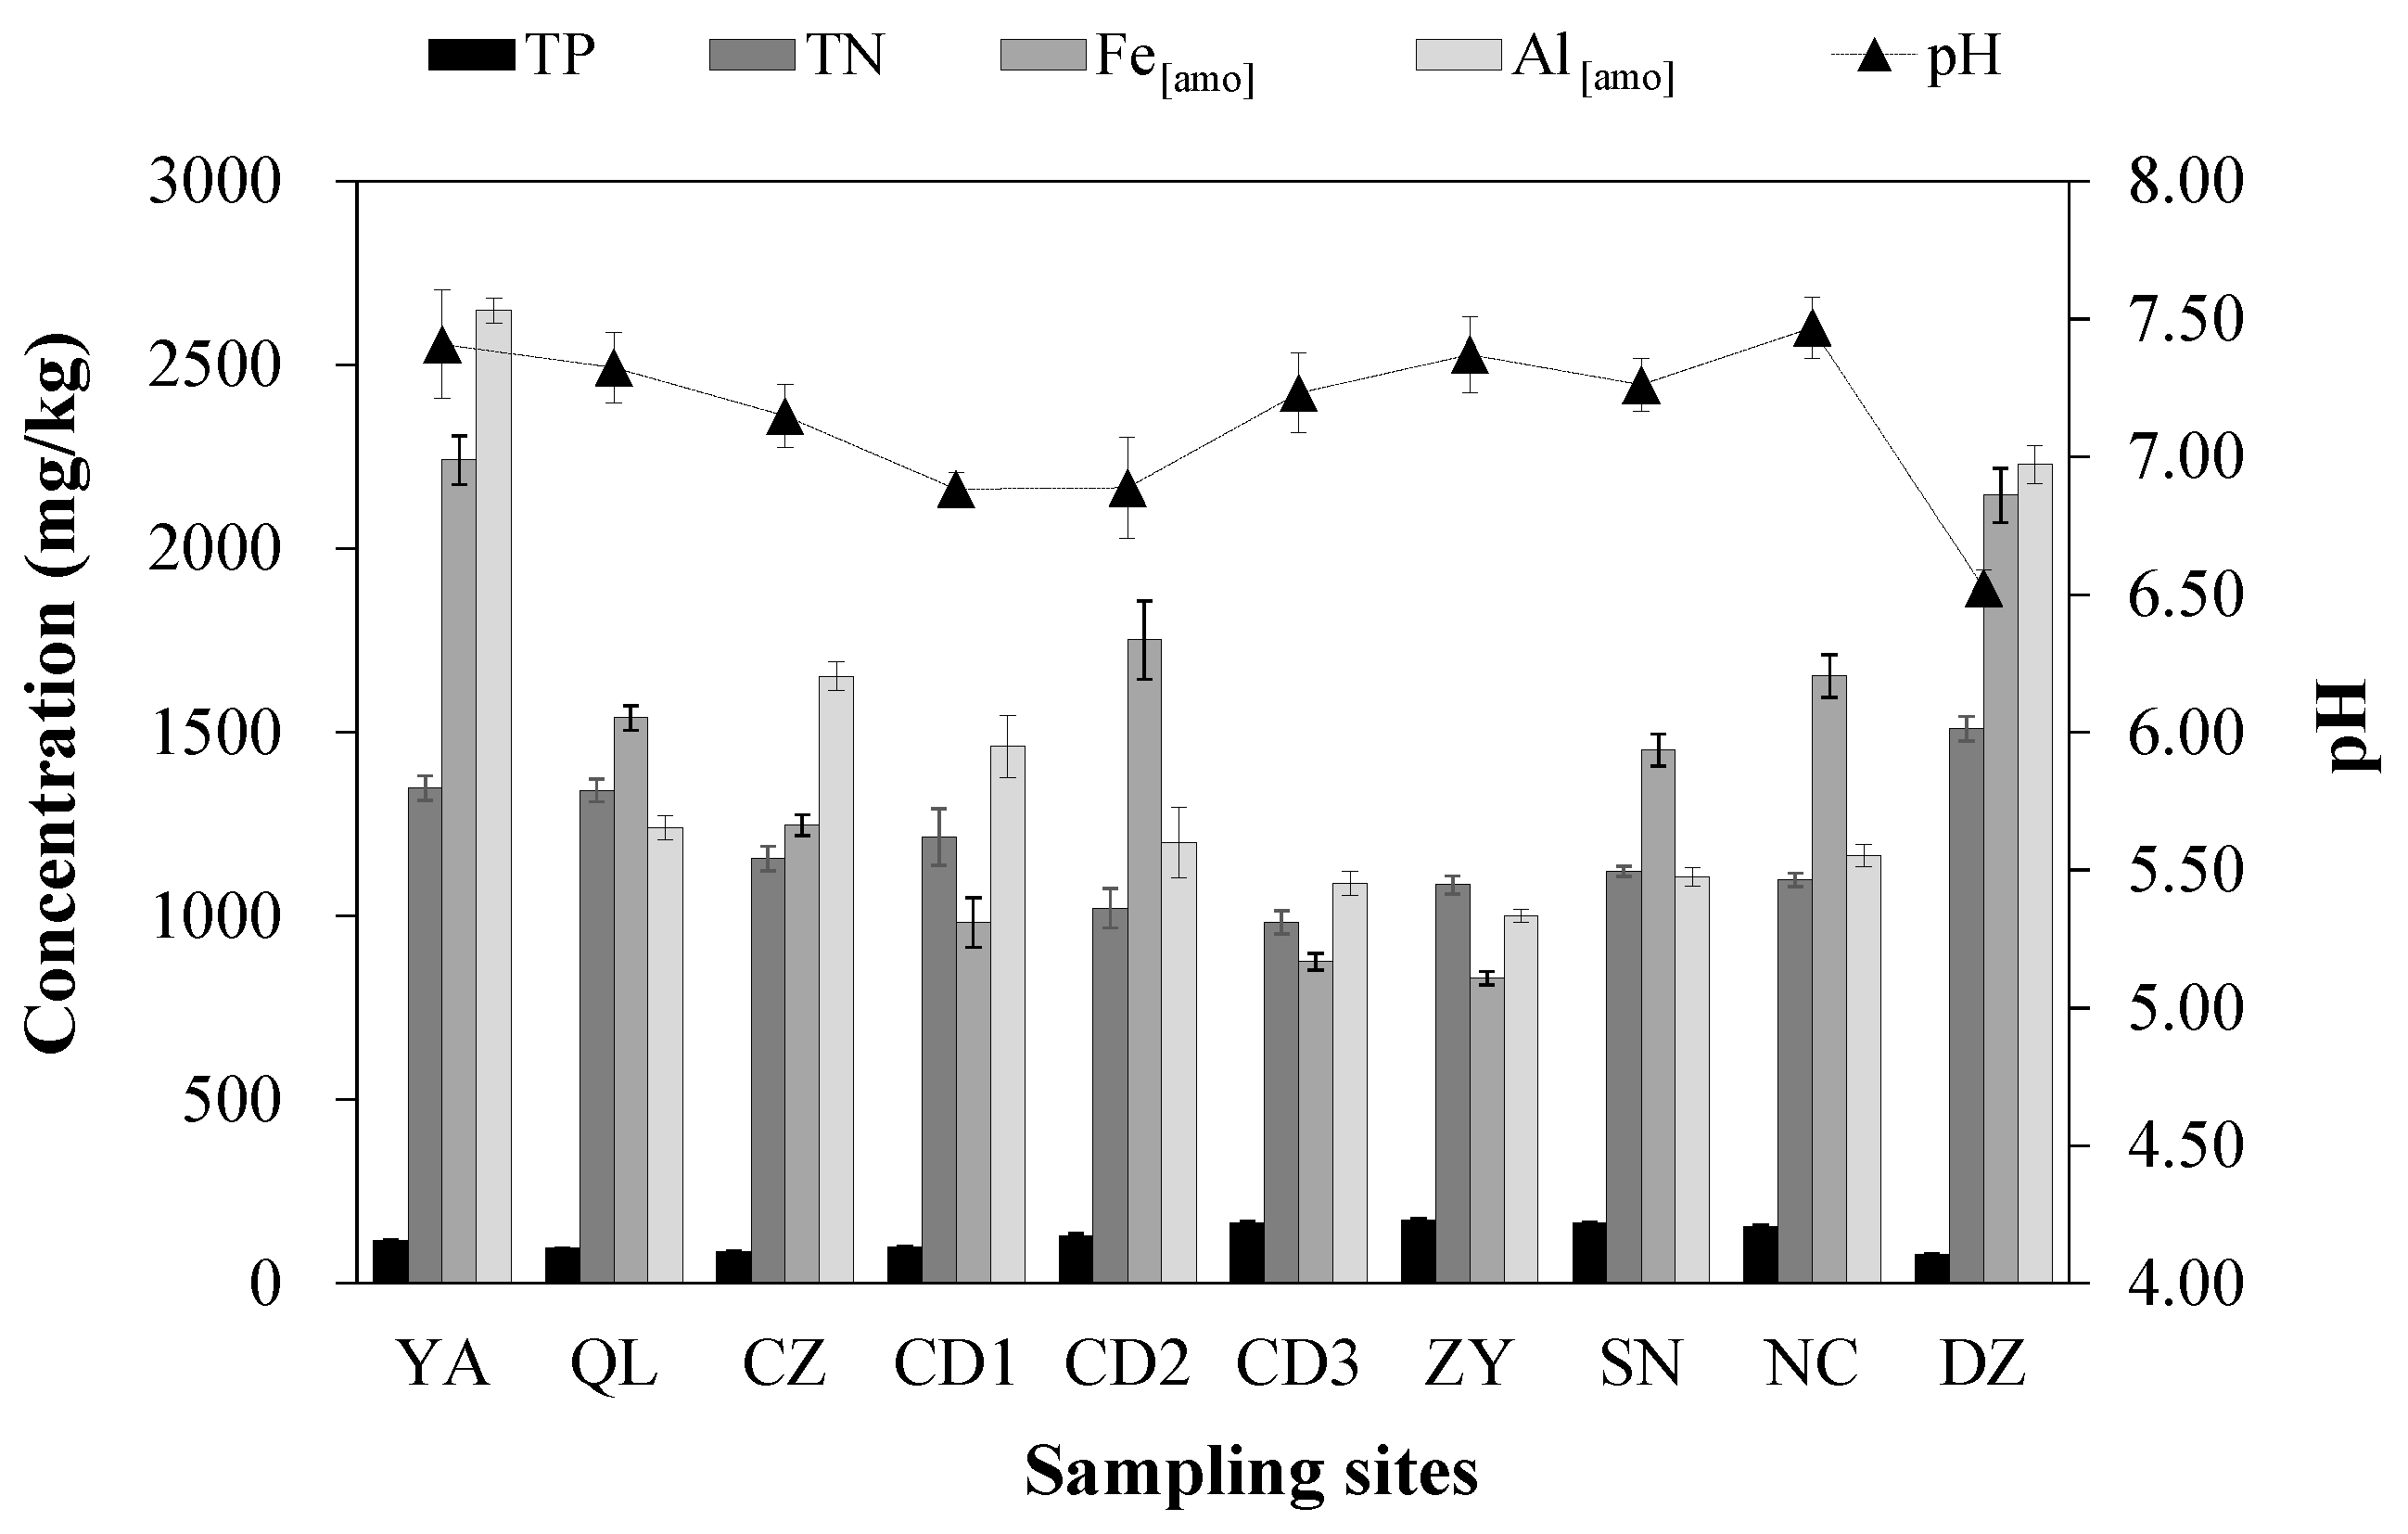
3.2. Soil Physical and Chemical Properties

Within the transect of the study area, the physical and chemical properties of the soil are derived from their basic lithological features: the purple soil, which inherits many of the characteristics from its parent materials, has a coarse texture, low SOM content, and is prone to erosion [35]. The transect across the Sichuan Basin (Figure 3) showed that soil organic matter had a generally U-shaped distribution, with high values at the edges and lower values in the middle. The clay-plus-silt had a similar distribution though somewhat less marked. Consequently, the sand content was distributed oppositely, with the highest values towards the center of the transect. Several soil properties also showed a general U-shaped distribution with the highest values at the edge (Figure 4). In the case of soil aluminum, the values for the soils at the edge of the distribution were more than twice as high as for some of the soils in the center of the distribution.

4. Discussion

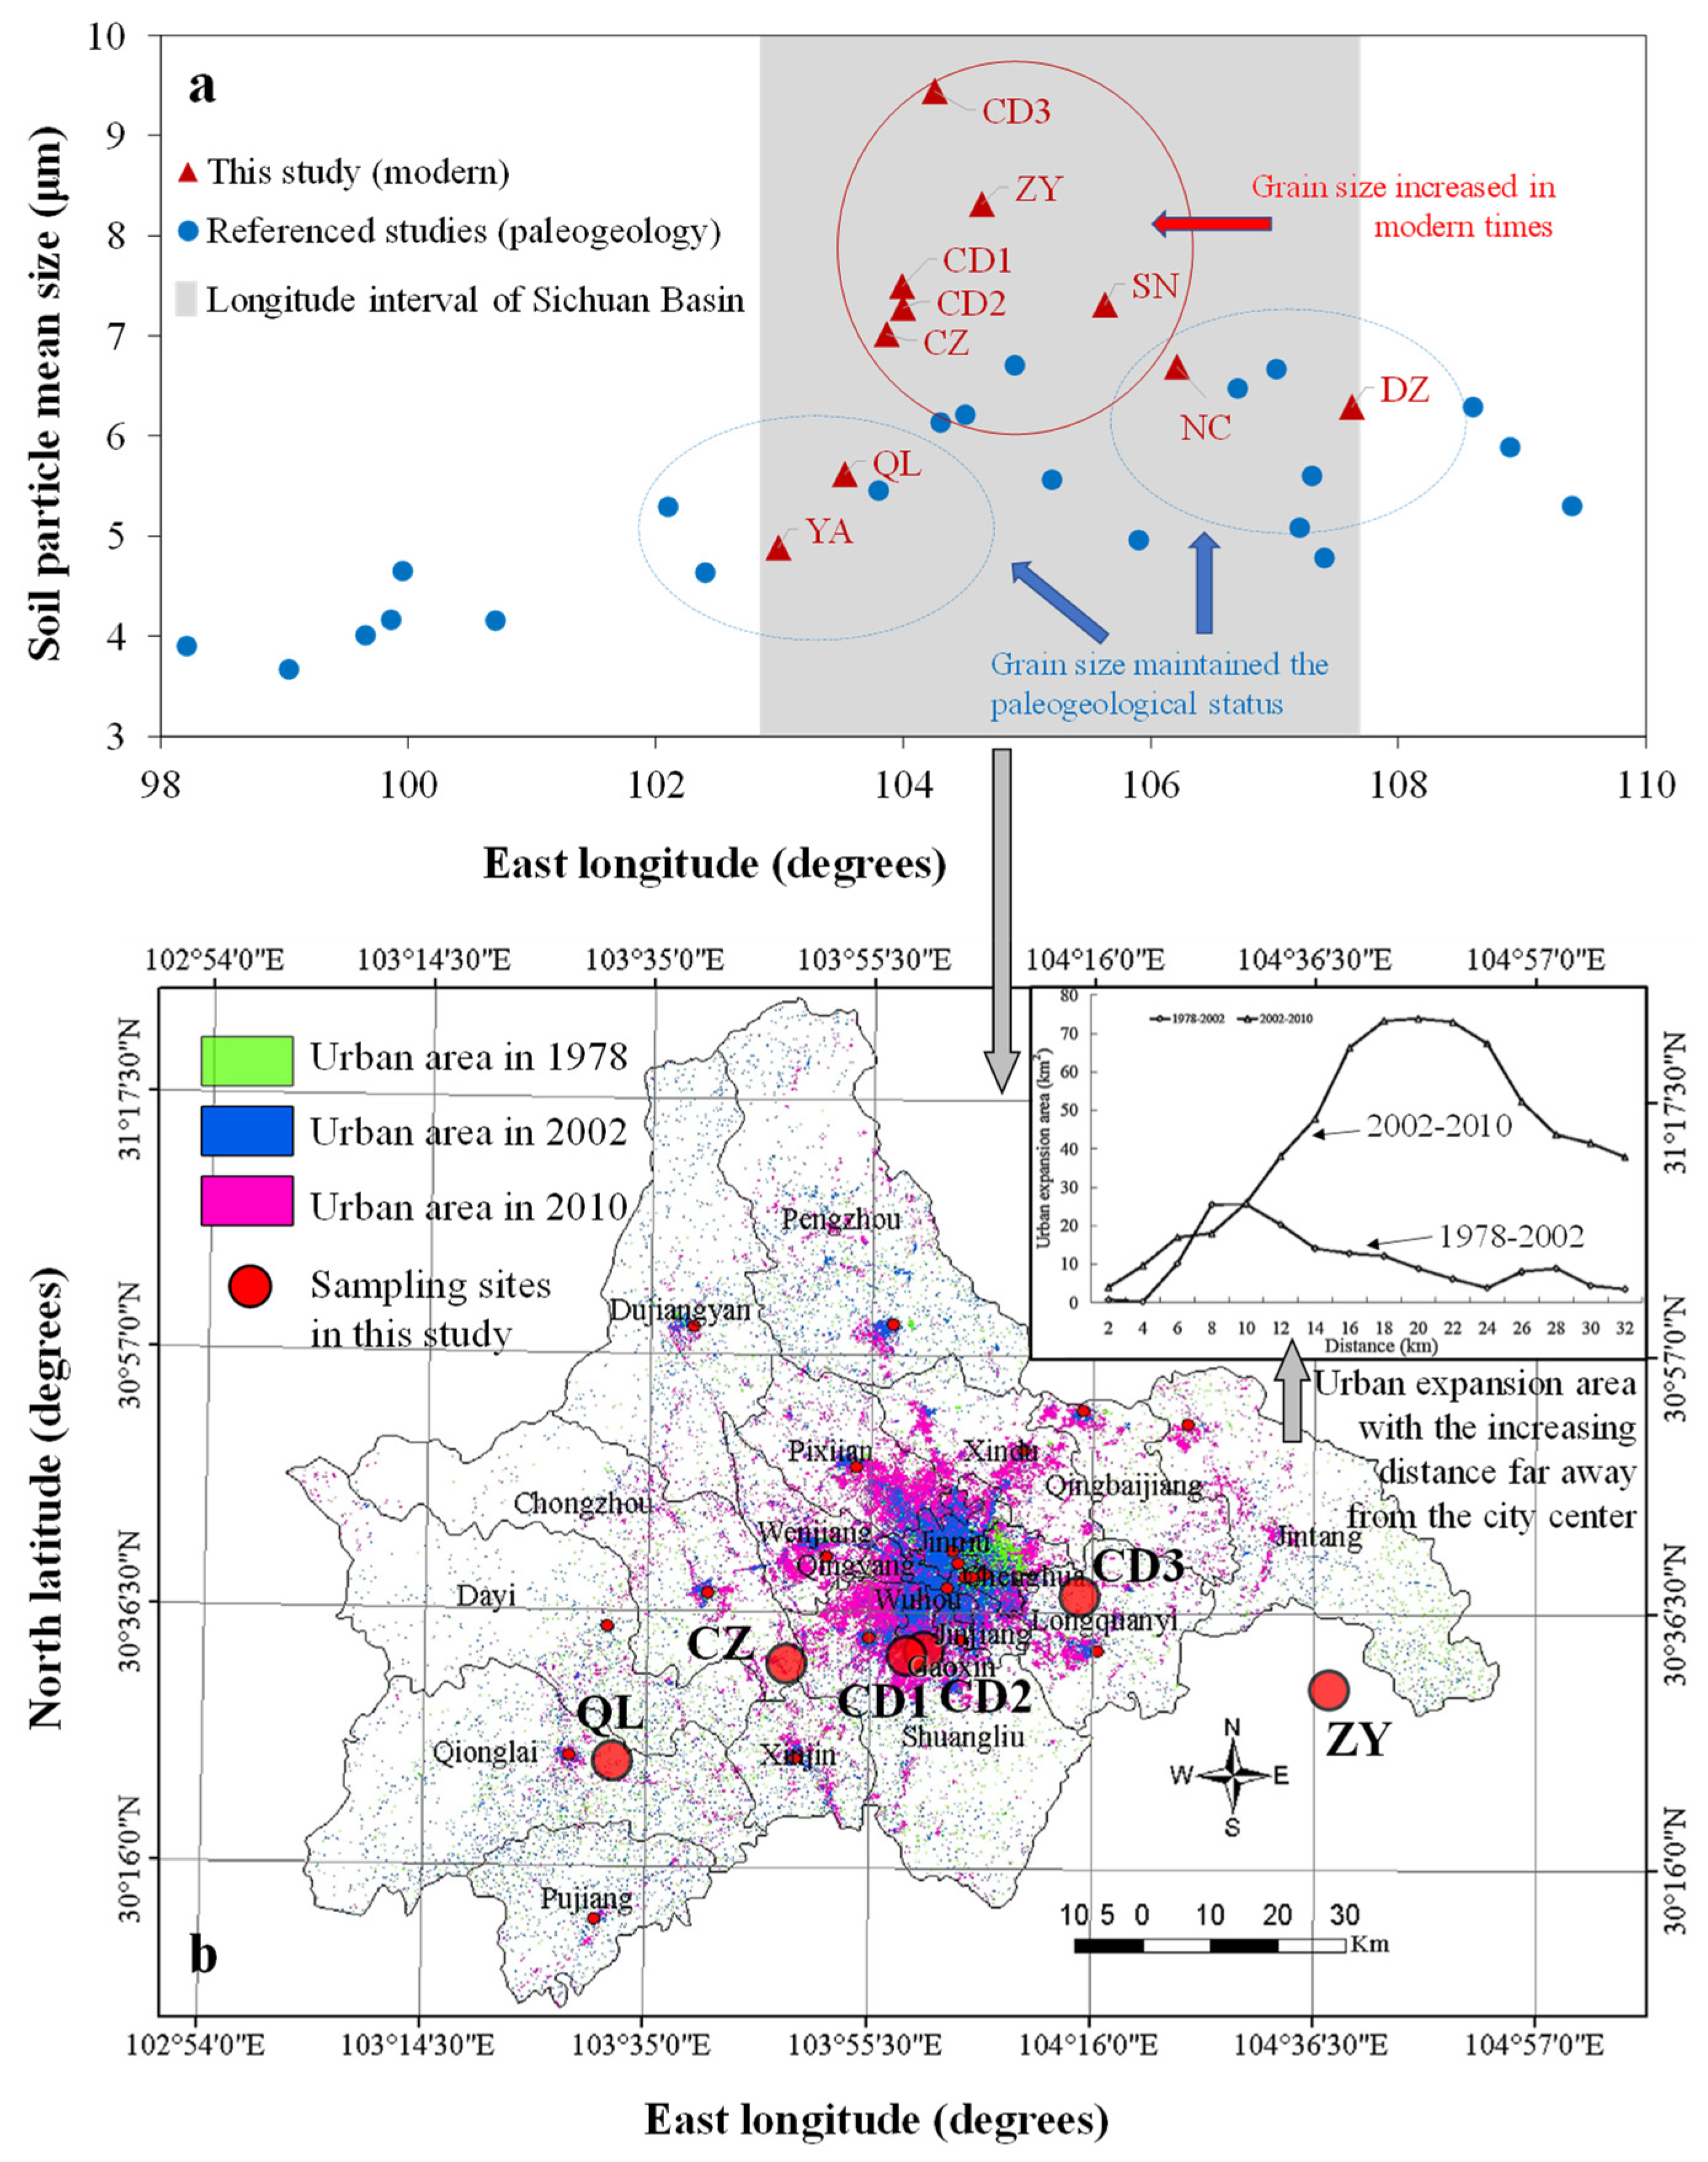
4.1. Historical Perspectives of Soil Particle Property Variation

Examining the historical variation in soil particle properties reveals significant changes in fine particles and their impact on soil phosphate sorption capacity. Soil fine particles play an important role in P retention, and the increase in the sorption on soil particles with decreasing grain size has been previously observed [36,37,38], and it is explained by the higher specific surface area-to-volume ratio and an increase in the concentration of soil surface functional groups [39]. Low contents of soil fine particles in central parts of the study area were found (Figure 3) and were accompanied by a decline in P sorption capacity in this study. According to field visits and related literature [40], farmers tended to meet the P demand of their crops by increasing fertilizer application to improve soil fertility. However, it caused an increase in TP in soils around Chengdu City (CD2, CD3, ZY, SN), accompanied by a large amount of P loss, which disrupted the balance of P circulation in the ambient environment [40,41]. This phenomenon has also been confirmed in the research of Li et al. [42].
Phosphate sorption decreases with increasing phosphate application, indicating that soil properties and land use both play a role. Rapid physical weathering of purple rocks and associated pedogenesis, sedimentation, and urbanization have affected erosion-related soil losses [20,35,43] and formed the current pattern of soil textural distribution within the study area. The loss of fine soil particles, especially in Chengdu City and its surrounding areas (CZ, CD1, CD2, CD3, ZY), is particularly significant in modern times. In previous investigations of historical conditions in the study area (Figure 5), it was found that the mean grain size gradually increased from west to east [44,45,46]. The mean grain size of soils at the west and east of the study area (YA, QL, NC, DZ) maintained their paleogeological state. However, with the soil disturbance in modern times, the soil mean grain size in the central basin has increased significantly (especially for CD3 and ZY), indicating that modern human activities could contribute to fine soil particle loss.
This case study served as an illustrative example of the intricate interplay between urban expansion and soil degradation within the region. The examination of Chengdu City’s historical expansion history [42,47] revealed profound repercussions on both natural and agricultural ecosystems. This analysis elucidated that the rate, process, and spatial distribution of urban area expansion closely aligned with the observed variations in soil properties, as illustrated in Figure 5. Despite the area’s extensive history of agricultural cultivation spanning approximately 4500 years, recent investigations of anthroposols development highlighted a noteworthy shift in soil mean size, a phenomenon primarily manifested within the past four decades. Importantly, it was essential to recognize that this change was intrinsically linked to the ongoing urban expansion within the region. Of significant concern was the substantial impact of modern agricultural practices within Sichuan Province, which had engendered a marked acceleration in the erosion of productive agricultural land [48]. The analysis of the rapid transformations in land-use patterns highlighted an elevated susceptibility to soil and water losses, particularly in densely populated central and eastern regions, including peri-urban areas [47]. The conspicuous prevalence of a high sand content, as evidenced by the CD1, CD2, and CD3 samples, provided support for these findings. Particularly noteworthy were the locales of CD1 and CD2, which were situated within urbanized green land areas characterized by a dearth of vegetation cover. This environmental context caused the erosion of clay during the ongoing modern urbanization processes in the Chengdu Plain [49,50,51].

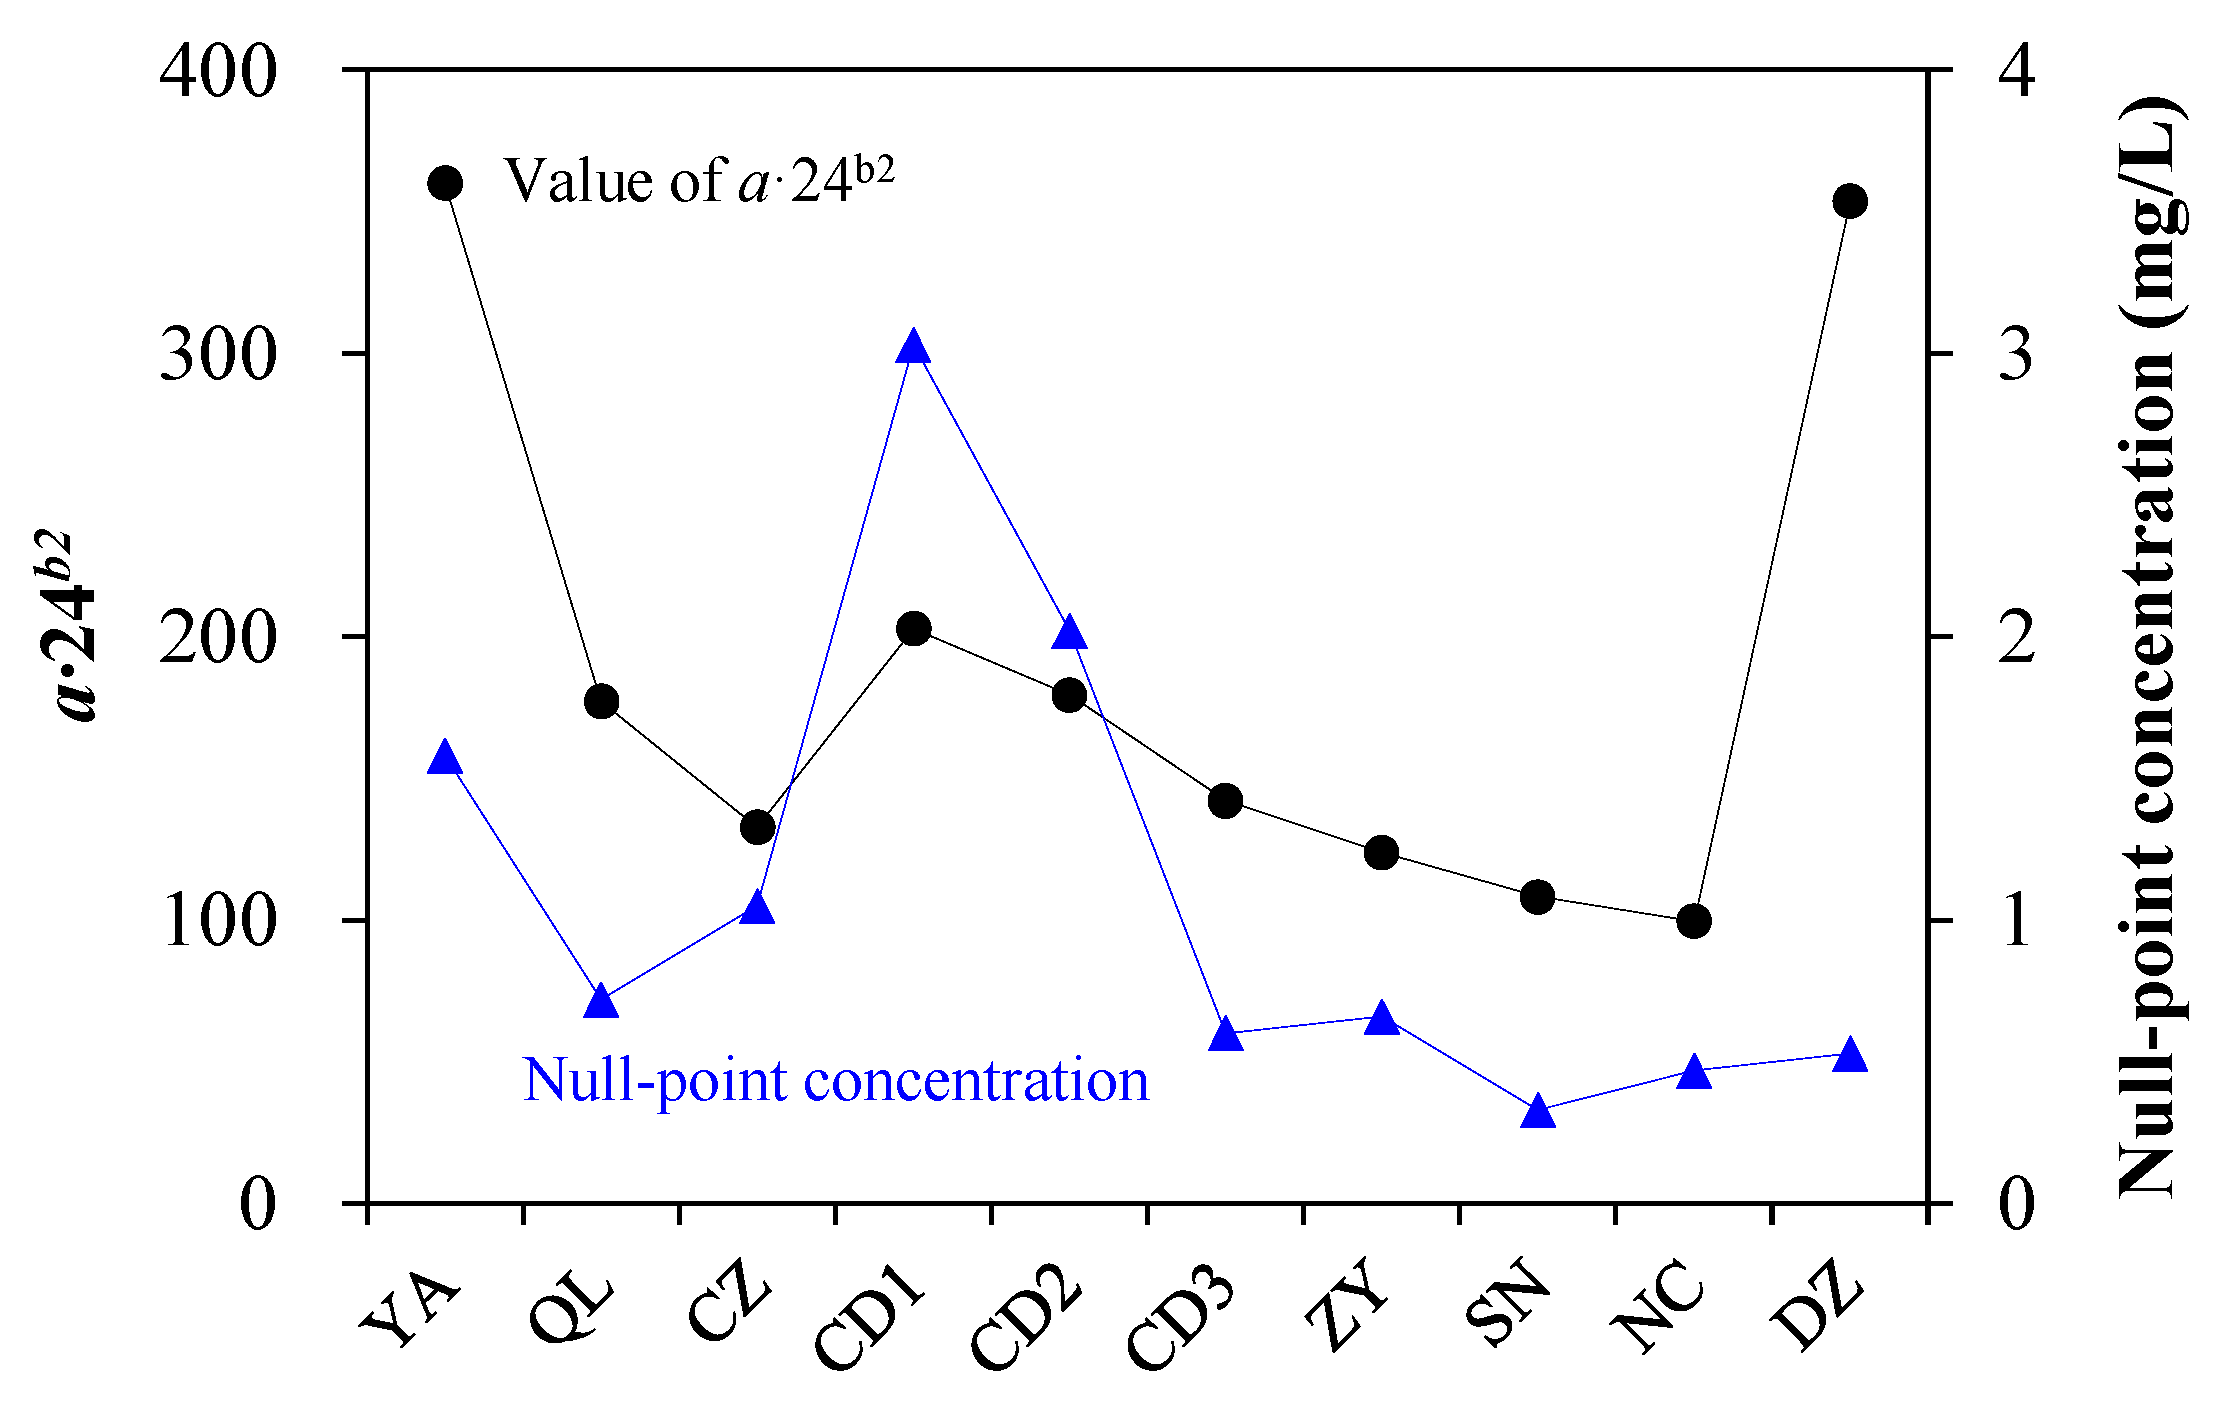
4.2. Interpretation for the Sorption Parameters

In contrast to YA and DZ, lower values in P sorption capacity were observed in CD1 and CD2 soils. The focus of this analysis is on the concept of null-point values, which represent the concentration at which neither sorption nor desorption occurs, providing additional insights into soil characteristics. The results suggested that the soils in the central basin (QL, CD1, CD2, and CD3) have received large applications of P fertilizer for decades or have been exposed to P pollution during urbanization [22,23]. Figure 6 shows high null-point values for CD1 and CD2, indicating heavy use of P fertilizer and probable loss in drainage. The samples were measured in dilute sodium chloride solution, which would lead to lower null-point values than if they had been measured at a lower ionic strength (such as would occur at field capacity). It is quite feasible that water leaching through the soils would have a high phosphate content. Such soil conditions are considered to be a harbinger of soil degradation from the perspective of soil ecology [52,53]. Overloaded foreign P induces an initial reaction with soil, which significantly decreases both the amount and the rate of sorption of subsequent fertilizers. Freshly adsorbed P is more difficult to displace with anions due to sorption site occupation.
To compare the curves, the values of a were investigated using a common value of b1. However, since most of the data were for sorption after 24 h, a · 24 b 2 is a better value. Figure 6 shows that the highest values were observed for the outlier sites (YA and DZ), with generally lower values within the basin proper. Additionally, Figure 6 reveals that the null-point values were high for CD1 and CD2. These samples were taken from urban green spaces and suggest a heavy input of phosphate. Apart from these exceptions, there was a general downward trend from west to east. The values for the parameter b2 ranged from 0.265 to 0.420, which were much higher than explained by the diffusion mechanism [33]. Mutual abrasion of the particles is considered to have caused these higher values, leading to much higher rates of reaction than would be observed in the field.
Consider a plot of sorption against concentration raised to the power (Figure 7a). Such plots will be linear. If the null-point is similar, the plot tends to be steeper and its interpolation will cut the vertical axis at a lower point. The value of the desorption term (q) in the model was correlated with a value at 24 h. So q would then increase as the a value increased, indicating that the soil surface properties largely decided the P sorption–desorption abilities, and the value indicated the height of the sorption curve [34]. The data appeared to fall into two groups, with the outlier group consisting of the two soils (YA and DZ) collected from the margin with much higher sorption. As the soil samples mostly came from areas fertilized with phosphate, prolonged contact between phosphate and soil could result in the penetration of the adsorbed molecules into the particles, thereby increasing the negative charge, making it more difficult to displace with other anions.
Bivariate analysis was used to analyze the correlation between the model parameters and the properties of the samples (Table 2). The a value at 24 h had significant positive correlations with soil clay, Al[amo], TN, and SOM contents. An especially highly significant positive correlation (p = 0.018) was found between the a value and the clay content. The Al[amo] content was significantly positively correlated with the q value (p = 0.017) (Figure 7b), this could be attributed to the fact that Al[amo] in soil particles mainly consists of amorphous inorganic polymers with huge surface areas and many ion binding sites [54,55], and the amorphous aluminum oxides could be a predictor of soil P affinity. These correlations indicated that the fine fractions exerted considerable effects on P sorption within the few soil samples used in this study. However, correlation cannot prove causation because these correlations may not be significant in a wide range. As the a value reflects the amount of reacting surfaces present in a given sample of soil and their affinity for P [33,55], the applicability of this interpretation to purple soil requires more evidence.
We expressed concerns because the data from this study indicate the loss of fine particles, incorporating SOM and Al[amo] reduction, which potentially causes future soil deterioration. Heavy use of P fertilizer and subsequent changes in soil particle surface condition will eventually affect P sorption. Furthermore, urban expansion has caused severe soil pollution in agricultural areas, aggravated soil and water losses, and caused a continuous rise in soil intrusions [35,40], resulting in the occupation of sorption sites in soil by substantial amounts of foreign substances [56,57,58]. It is worth noting that P-containing detergent is widely used as the major constituent of synthetic detergents and has become the most common pollutant in the soil. As an accumulation, the surface properties of the soil may vary significantly, consequently reducing the soil ionic strength and sorption amount for beneficial nutrients [59]. These foreign substances affect the balance of soil and P interaction, affecting agricultural productivity and posing potential ecological and health risks.

5. Conclusions

This study examined P sorption and the physical–chemical properties of purple soils in the Sichuan Basin, encompassing paddy, dry farmland, forest, and urban green land soils. A modified Freundlich model was employed to analyze the sorption data, revealing decreasing sorption capacity from west to east, with high levels at the basin margins and in the central urban area. High P fertilizer use and changes in soil particle surface conditions in urban green land soils significantly affected P sorption. Reduced fine soil particles, soil organic matter, and aluminum content, possibly due to hydraulic erosion during recent rapid development, correlated with diminished soil P retention. These findings highlight preliminary soil property deterioration, emphasizing the need for specialized soil management protocols to address potential degradation threats.

Supplementary Materials

The following supporting information can be downloaded at: https://www.mdpi.com/article/10.3390/su151914609/s1. Supplementary material of the manuscript “Phosphorus sorption by purple soils in relation to their properties: investigation, characterization, and explanation” contains: Table S1. Sampling site locations and soil types; Table S2. Sorption parameters obtained from fitting under b1 varied condition; Table S3. Sorption parameters obtained from Equation (1).

Author Contributions

Conceptualization, B.T.; Methodology, B.T. and N.J.B.; Formal Analysis, B.T. and N.J.B.; Data Curation, B.T. and N.J.B.; Writing—Original Draft, B.T.; Writing—Review and Editing, N.J.B.; Visualization, B.T.; Validation, L.L.; Investigation, L.L. and P.Z.; Resources, P.Z. and W.Z.; Funding acquisition, P.Z. and W.Z.; Supervision, W.Z.; Project administration, W.Z. All authors have read and agreed to the published version of the manuscript.

Funding

This study was funded by the Natural Science Foundation of Sichuan Province (2022NSFSC1654, 2022NSFSC0086).

Institutional Review Board Statement

Not applicable.

Informed Consent Statement

Not applicable.

Data Availability Statement

The datasets used and/or analyzed during the current study are available from the corresponding author on reasonable request.

Conflicts of Interest

The authors declare no conflict of interest.

References

  1. Celik, I. Land-use effects on organic matter and physical properties of soil in a southern Mediterranean highland of Turkey. Soil Till. Res. 2005, 83, 270–277. [Google Scholar] [CrossRef]
  2. Lizaga, I.; Quijano, L.; Gaspar, L.; Concepcion Ramos, M.; Navas, A. Linking land use changes to variation in soil properties in a Mediterranean mountain agroecosystem. Catena 2019, 172, 516–527. [Google Scholar] [CrossRef]
  3. Tilman, D.; Lehman, C. Human-caused environmental change: Impacts on plant diversity and evolution. Proc. Natl. Acad. Sci. USA 2001, 98, 5433–5440. [Google Scholar] [CrossRef] [PubMed]
  4. Hinsinger, P. Bioavailability of soil inorganic P in the rhizosphere as affected by root-induced chemical changes: A review. Plant Soil 2001, 237, 173–195. [Google Scholar] [CrossRef]
  5. Barrow, N.J. The description of sorption curves. Eur. J. Soil Sci. 2008, 59, 900–910. [Google Scholar] [CrossRef]
  6. Mehadi, A.A.; Taylor, R.W.; Shuford, J.W. Prediction of Fertilizer Phosphate Requirement Using the Langmuir Adsorption Maximum. Plant Soil 1990, 122, 267–270. [Google Scholar] [CrossRef]
  7. Olsen, S.; Watanabe, F. A Method to Determine Phosphorus Adoption Maximum in Soils as Measured by the Langmuir Isotherm. Soil Sci. Soc. Am. J. 1957, 21, 144–149. [Google Scholar] [CrossRef]
  8. Yli-Halla, M.; Hartikainen, H.; Vaatainen, P. Depletion of soil phosphorus as assessed by several indices of phosphorus supplying power. Eur. J. Soil Sci. 2002, 53, 431–438. [Google Scholar] [CrossRef]
  9. Wang, Y.T.; Halloran, I.O.; Zhang, T.Q.; Hu, Q.C.; Tan, C.S. Langmuir Equation Modifications to Describe Phosphorus Sorption in Soils of Ontario, Canada. Soil Sci. 2014, 179, 536–546. [Google Scholar] [CrossRef]
  10. Abdu, N. Formulation of a first-order kinetic model and release of added phosphorus in a savanna Soil. Arch. Agron. Soil Sci. 2013, 59, 71–81. [Google Scholar] [CrossRef]
  11. Barrachina, A.C.; Carbonell, F.B.; Beneyto, J.M. Kinetics of arsenite sorption and desorption in Spanish soils. Commun. Soil Sci. Plan. 1996, 27, 3101–3117. [Google Scholar] [CrossRef]
  12. Chien, S.H.; Clayton, W.R. Application of Elovich Equation to the Kinetics of Phosphate Release and Sorption in Soils. Soil Sci. Soc. Am. J. 1980, 44, 265–268. [Google Scholar] [CrossRef]
  13. Halsey, G.D. The role of surface heterogeneity in adsorption. Adv. Catal. 1952, 4, 259–269. [Google Scholar] [CrossRef]
  14. Sposito, G. Derivation of the Freundlich equation for ion-exchange reactions in soils. Soil Sci. Soc. Am. J. 1980, 44, 652–654. [Google Scholar] [CrossRef]
  15. Barrow, N.J.; Cartes, P.; Mora, M.L. Modifications to the Freundlich equation to describe anion sorption over a large range and to describe competition between pairs of ions. Eur. J. Soil Sci. 2005, 56, 601–606. [Google Scholar] [CrossRef]
  16. Xiao, Y.; Tang, J.; Wang, M.; Zhai, L.; Zhang, X. Impacts of soil properties on phosphorus adsorption and fractions in purple soils. J. Mt. Sci. 2017, 14, 2420–2431. [Google Scholar] [CrossRef]
  17. Zheng, J.; He, X.; Walling, D.; Zhang, X.; Flanagan, D.; Qi, Y. Assessing soil erosion rates on manually-tilled hillslopes in the Sichuan Hilly Basin using 137Cs and 210Pbex measurements. Pedosphere 2007, 17, 273–283. [Google Scholar] [CrossRef]
  18. Luo, Z.; Zhu, B.; Tang, J.; Wang, T. Phosphorus retention capacity of agricultural headwater ditch sediments under alkaline condition in purple soils area, China. Ecol. Eng. 2009, 35, 57–64. [Google Scholar] [CrossRef]
  19. Zhang, J.H.; Lobb, D.A.; Li, Y.; Liu, G.C. Assessment of tillage translocation and tillage erosion by hoeing on the steep land in hilly areas of Sichuan, China. Soil Till. Res. 2004, 75, 99–107. [Google Scholar] [CrossRef]
  20. Zhu, B.; Wang, T.; You, X.; Gao, M. Nutrient release from weathering of purplish rocks in the Sichuan Basin, China. Pedosphere 2008, 18, 257–264. [Google Scholar] [CrossRef]
  21. Zhu, B.; Wang, Z.; Zhang, X. Phosphorus fractions and release potential of ditch sediments from different land uses in a small catchment of the upper Yangtze River. J. Soil Sediment. 2012, 12, 278–290. [Google Scholar] [CrossRef]
  22. Gao, Y.; Zhu, B.; Wang, T.; Wang, Y. Seasonal change of non-point source pollution-induced bioavailable phosphorus loss: A case study of Southwestern China. J. Hydrol. 2012, 420, 373–379. [Google Scholar] [CrossRef]
  23. Yang, X.; Shen, X.; Zhu, B. Characteristics of diffuse pollution of nitrogen and phosphorous from a small town in the hilly area of the central Sichuan Basin, China. J. Mt. Sci. 2016, 13, 292–301. [Google Scholar] [CrossRef]
  24. Zhu, B.; Wang, T.; Kuang, F.; Luo, Z.; Tang, J.; Xu, T. Measurements of Nitrate Leaching from a Hillslope Cropland in the Central Sichuan Basin, China. Soil Sci. Soc. Am. J. 2009, 73, 1419–1426. [Google Scholar] [CrossRef]
  25. Sichuan Provincial People’s Government. General Plan of Land Use of Sichuan Province for 2006–2020; Sichuan Provincial People’s Government: Chengdu, China, 2009. (In Chinese)
  26. USDA. Soil Taxonomy: A Basic System of Soil Classification for Making and Interpreting Soil Surveys. In USDA-NRCS Agriculture Handbook No. 436; U.S. Government Printing Office: Washington, DC, USA, 1988; Volume 114. [Google Scholar] [CrossRef]
  27. Eslamian, F.; Qi, Z.; Tate, M.J.; Romaniuk, N. Lime application to reduce phosphorus release in different textured intact and small repacked soil columns. J. Soil Sediments 2020, 20, 2053–2066. [Google Scholar] [CrossRef]
  28. Sommers, L.E.; Nelson, D.W. Determination of total phosphorus in soils: A rapid perchloric acid digestion procedure. Soil Sci. Soc. Am. J. 1972, 36, 902–904. [Google Scholar] [CrossRef]
  29. Wang, Y.; Zhang, X.; Huang, C. Spatial variability of soil total nitrogen and soil total phosphorus under different land uses in a small watershed on the Loess Plateau, China. Geoderma 2009, 150, 141–149. [Google Scholar] [CrossRef]
  30. He, Y.; Gu, F.; Xu, C.; Chen, J. Influence of iron/aluminum oxides and aggregates on plant available water with different amendments in red soils. J. Soil Water Conserv. 2019, 74, 145–159. [Google Scholar] [CrossRef]
  31. Mikhailova, E.A.; Noble, R.; Post, C.J. Comparison of soil organic carbon recovery by Walkley-Black and dry combustion methods in the Russian Chernozein. Commun. Soil Sci. Plan. 2003, 34, 1853–1860. [Google Scholar] [CrossRef]
  32. Barrow, N.J.; Debnath, A. Effect of phosphate status on the sorption and desorption properties of some soils of northern India. Plant Soil 2014, 378, 383–395. [Google Scholar] [CrossRef]
  33. Barrow, N.J. Describing and explaining the reaction of soils with phosphate using existing observations. Eur. J. Soil Sci. 2020, 72, 234–242. [Google Scholar] [CrossRef]
  34. Barrow, N.J. A mechanistic model for describing the sorption and desorption of phosphate by Soil. Eur. J. Soil Sci. 2015, 66, 9–18. [Google Scholar] [CrossRef]
  35. Zhong, S.; Han, Z.; Duo, J.; Ci, E.; Ni, J.; Xie, D.; Wei, C. Relationships between the lithology of purple rocks and the pedogenesis of purple soils in the Sichuan Basin, China. Sci. Rep. 2019, 9, 13272. [Google Scholar] [CrossRef] [PubMed]
  36. Cui, Y.; Xiao, R.; Xie, Y.; Zhang, M. Phosphorus fraction and phosphate sorption-release characteristics of the wetland sediments in the Yellow River Delta. Phys. Chem. Earth 2018, 103, 19–27. [Google Scholar] [CrossRef]
  37. Meng, J.; Yao, Q.; Yu, Z. Particulate phosphorus speciation and phosphate adsorption characteristics associated with sediment grain size. Ecol. Eng. 2014, 70, 140–145. [Google Scholar] [CrossRef]
  38. Wang, S.; Jin, X.; Bu, Q.; Zhou, X.; Wu, F. Effects of particle size, organic matter and ionic strength on the phosphate sorption in different trophic lake sediments. J. Hazard. Mater. 2006, 128, 95–105. [Google Scholar] [CrossRef]
  39. Santamarina, J.C.; Klein, K.A.; Wang, Y.H.; Prencke, E. Specific surface: Determination and relevance. Can. Geotech. J. 2002, 39, 233–241. [Google Scholar] [CrossRef]
  40. Li, S.; Gong, Q.; Yang, S. Analysis of the Agricultural Economy and Agricultural Pollution Using the Decoupling Index in Chengdu, China. Int. J. Env. Res. Pub. Health 2019, 16, 4233. [Google Scholar] [CrossRef]
  41. Huang, J.; Xu, C.; Ridoutt, B.G.; Wang, X.; Ren, P. Nitrogen and phosphorus losses and eutrophication potential associated with fertilizer application to cropland in China. J. Clean. Prod. 2017, 159, 171–179. [Google Scholar] [CrossRef]
  42. Li, T.; Zheng, W.; Zhang, S.; Jia, Y.; Li, Y.; Xu, X. Spatial variations in soil phosphorus along a gradient of central city-suburb-exurban satellite. Catena 2018, 170, 150–158. [Google Scholar] [CrossRef]
  43. Du, J.; Luo, Y.; Zhang, W.; Xu, C.; Wei, C. Major element geochemistry of purple soils/rocks in the red Sichuan Basin, China: Implications of their diagenesis and pedogenesis. Environ. Earth Sci. 2013, 69, 1831–1844. [Google Scholar] [CrossRef]
  44. Fang, X.M.; Li, J.J.; Van der Voo, R. Rock magnetic and grain size evidence for intensified Asian atmospheric circulation since 800,000 years BP Related to Tibetan uplift. Earth Planet. Sci. Lett. 1999, 165, 129–144. [Google Scholar] [CrossRef]
  45. Liu, D. Loess and the Environment; China Ocean Press: Beijing, China, 1985. [Google Scholar]
  46. Yang, S.; Fang, X.; Shi, Z.; Lehmkuhl, F.; Song, C.; Han, Y.; Han, W. Timing and provenance of loess in the Sichuan Basin, southwestern China. Palaeogeogr. Palaeoclimatol. Palaeoecol. 2010, 292, 144–154. [Google Scholar] [CrossRef]
  47. Peng, W.; Wang, G.; Zhou, J.; Zhao, J.; Yang, C. Studies on the temporal and spatial variations of urban expansion in Chengdu, western China, from 1978 to 2010. Sustain. Cities Soc. 2015, 17, 141–150. [Google Scholar] [CrossRef]
  48. Nearing, M.A.; Xie, Y.; Liu, B.; Ye, Y. Natural and anthropogenic rates of soil erosion. Int. Soil Water Conserv. Res. 2017, 5, 77–84. [Google Scholar] [CrossRef]
  49. Li, Q.; Li, A.; Yu, X.; Dai, T.; Peng, Y.; Yuan, D.; Zhao, B.; Tao, Q.; Wang, C.; Li, B.; et al. Soil acidification of the soil profile across Chengdu Plain of China from the 1980s to 2010s. Sci. Total Environ. 2020, 698, 134320. [Google Scholar] [CrossRef]
  50. Liu, X.; Li, T.; Zhang, S.; Jia, Y.; Li, Y.; Xu, X. The role of land use, construction and road on terrestrial carbon stocks in a newly urbanized area of western Chengdu, China. Landscape Urban. Plan. 2016, 147, 88–95. [Google Scholar] [CrossRef]
  51. Luo, Y.; Li, Q.; Wang, C.; Li, B.; Stomph, T.; Yang, J.; Tao, Q.; Yuan, S.; Tang, X.; Ge, J.; et al. Negative effects of urbanization on agricultural soil easily oxidizable organic carbon down the profile of the Chengdu Plain, China. Land. Degrad. Dev. 2020, 31, 404–416. [Google Scholar] [CrossRef]
  52. Han, W.; Li, Y.; Yin, H. The Influence of Mechanical Composition and Mineral Composition of Calcareous Soil on Slope Farmland on Phosphorus Fixation. Appl. Sci. 2021, 11, 3731. [Google Scholar] [CrossRef]
  53. Troitino, F.; Gil-Sotres, F.; Leiros, M.C.; Trasar-Cepeda, C.; Seoane, S. Effect of land use on some soil properties related to the risk of loss of soil phosphorus. Land Degrad. Dev. 2008, 19, 21–35. [Google Scholar] [CrossRef]
  54. Bai, J.; Ye, X.; Jia, J.; Zhang, G.; Zhao, Q.; Cui, B.; Liu, X. Phosphorus sorption-desorption and effects of temperature, pH and salinity on phosphorus sorption in marsh soils from coastal wetlands with different flooding conditions. Chemosphere 2017, 188, 677–688. [Google Scholar] [CrossRef]
  55. Sun, T.; Deng, L.; Fei, K.; Zhang, L.; Fan, X. Characteristics of phosphorus adsorption and desorption in erosive weathered granite area and effects of soil properties. Environ. Sci. Pollut. Res. 2020, 27, 28780–28793. [Google Scholar] [CrossRef] [PubMed]
  56. Rojas, R.; Morillo, J.; Usero, J.; Delgado-Moreno, L.; Gan, J. Enhancing soil sorption capacity of an agricultural soil by addition of three different organic wastes. Sci. Total Environ. 2013, 458, 614–623. [Google Scholar] [CrossRef] [PubMed]
  57. Vareda, J.P.; Valente, A.J.M.; Duraes, L. Assessment of heavy metal pollution from anthropogenic activities and remediation strategies: A review. J. Environ. Manag. 2019, 246, 101–118. [Google Scholar] [CrossRef]
  58. Wang, Y.; Li, L.; Zou, X.; Shu, R.; Ding, L.; Yao, K.; Lv, W.; Liu, G. Impact of Humin on Soil Adsorption and Remediation of Cd(II), Pb(II), and Cu(II). Soil Sediment. Contam. 2016, 25, 700–715. [Google Scholar] [CrossRef]
  59. Rao, P.; He, M. Adsorption of anionic and nonionic surfactant mixtures from synthetic detergents on soils. Chemosphere 2006, 63, 1214–1221. [Google Scholar] [CrossRef]
Figure 1. Geographic distribution diagram of sampling sites.
Sustainability 15 14609 g001
Figure 2. Sorption of P fitted by the modified Freundlich equation, showing the variation in sorption across the basin. Parts (aj), show individual plots; part (k) compares the sites.
Sustainability 15 14609 g002
Figure 3. Grain size composition (clay, silt, and sand) and soil organic matter content of soil samples from the transect in the west–east direction (left to right).
Sustainability 15 14609 g003
Figure 4. Chemical properties of soil samples from the transect in the west–east direction (left to right). The TP and TN refer to soil total phosphorus and total nitrogen, and the Fe[amo] and Al[amo] refer to amorphous iron oxides and amorphous aluminum oxides of the soil.
Sustainability 15 14609 g004
Figure 5. Comparing the historical process of the variation in soil mean size and urban expansion in the study area. (a) Spatial variation of soil mean size with data compiled from referenced studies [44,45,46] and this study. (b) Spatial relationship between the sampling sites of this study and urban expansion; the base map and data were reprinted/adapted with permission from Ref. [47]. Copyright year: 2023, copyright owner’s name: Wenfu Peng, Guangjie Wang, Jieming Zhou, Jingfeng Zhao, Cunjian Yang.
Sustainability 15 14609 g005
Figure 6. Variation of properties across the transect. The left vertical axis represents the a value at 24 h, which is an index of the slope of the sorption curves in Figure 2a–j. The right vertical axis shows values of the null-point concentration; at this point, neither sorption nor desorption occurs, S = 0 and acb1tb2 = qtb2. Thus, the null-point is equal to (q/a)1/b1.
Sustainability 15 14609 g006
Figure 7. Comparing the causal correlation between soil sorption parameters. (a) Correlation between the q term and the a value at 24 h. (b) Correlation between the q term and soil amorphous aluminum oxide content.
Sustainability 15 14609 g007
Table 1. Comparing the analysis of variance results of 3-parameter and 4-parameter fitting.
Residual Sum of SquaresDegree of FreedomMean SquareVR
3-parameter398.63001303.3219
4-parameter325.12001202.70932.7100
Improvement73.5100107.3510
Table 2. Correlation between model parameters and soil properties.
Parametersa·24b2b2q
Clay0.820 **0.0430.656 *
Silt0.644 *0.0870.526
Sand−0.693 *−0.080−0.564
Mean grain size−0.595−0.353−0.390
pH−0.4630.390−0.458
Al[amo]0.910 **−0.0300.726 *
Fe[amo]0.708 *0.1360.439
TN0.792 **0.2720.466
TP−0.5790.098−0.524
SOM0.813 **0.2210.569
Correlation is significant at the ** 0.01 or * 0.05 level (two-tailed test).
Disclaimer/Publisher’s Note: The statements, opinions and data contained in all publications are solely those of the individual author(s) and contributor(s) and not of MDPI and/or the editor(s). MDPI and/or the editor(s) disclaim responsibility for any injury to people or property resulting from any ideas, methods, instructions or products referred to in the content.

