1. Introduction
1.1. The Energy Transition in the European Union
The European Union (EU) countries have embarked on an extensive policy and regulatory update in order to accelerate the development of renewable energy as part of the broad package of measures aimed at limiting the effects of climate change. The pending and already implemented measures include revamped taxation mechanisms and carbon trading schemes, changes in trading regimes directed at carbon-intensive imports, tax reliefs, and targeted assistance to companies involved in the key industries participating in the transition towards renewables. The most ambitious project within the strategy is “Fit for 55”, which aims to implement several regulatory changes precipitating a decline in the EU’s carbon footprint. The capital markets and industry have followed the directions set by regulators and implemented internal mechanisms and incentive schemes designed to benefit from the ongoing transition and secure leadership positions within the overhauled industrial landscape [
1].
The regulatory pressure and market shifts have already delivered some commendable results. Fueled by plentiful capital inflows, lax monetary policy, and targeted financial assistance, the industries tied to the transformation have experienced dynamic growth over the last decade [
2]. Investments in renewable energy generation have become higher than in oil and gas extraction, and conventional energy generation is being gradually phased out in EU countries [
3].
At the same time, some projections of greenhouse gas emissions deem the current pace of renewable energy growth insufficient to meet the targets [
4] set in the policy guidelines. Therefore, an in-depth understanding of the factors that may be responsible for slowing down the renewables’ growth is necessary to fine-tune the enacted policies and, if necessary, reshape them relying on market incentives rather than on regulatory pressure. In our opinion, striking the right balance between the weights of market-based mechanisms and centralized industrial policies based on the allocation of public financing may be a critical factor in shaping the trajectory of further development of the renewable energy sector.
One of the prevailing views among policymakers maintains that the renewable energy industry is primarily held back by insufficient capital inflows. The capital intensity of the industry [
5] makes attaining the necessary economies of scale difficult. Since natural monopolies have historically dominated the energy industry, new entries are challenging, and transformations of the incumbents in the direction of renewable energy generation are lengthy and rigid. Across many mature markets, the energy industry is also unionized, which may further hinder the strategic pivots of the incumbents [
6].
1.2. The Goal of the Study
The present study is structured around two principal axes. First, we compare and contrast the current financial standing of renewable energy companies and their fossil-fuel-based peers, with the aim of establishing the current context in which the sector is operating and deploying new generating capacity. We also try to quantitatively assess whether the existing regulatory framework has been successful at creating an environment favorable to renewable energy companies and their needs in terms of long-term financing. Secondly, we focus on what, in our opinion, may constitute one of the challenges to the growth of the industry: price regulation coupled with caps on the upside movement of prices in the event of shocks. The findings reported in the paper contribute to the empirical literature on the determinants of the development of the renewable energy industry and on the mechanisms of the energy market and the industrial organization of the energy sector. The findings may be of interest to regulatory bodies, which are looking for ways to shape the mechanisms underlying the energy market and accelerate the ongoing transformation of the European Union’s economy in the direction of sustainable energy procurement.
Our comparative analysis of conventional and renewable energy companies in the European Union demonstrates that the problem of capital availability has mainly been solved. The findings of statistical analysis demonstrate that renewable energy companies already enjoy better access to capital and a lower cost of capital than their conventional energy generation peers. Both intermediated financing and direct capital market financing appear to greatly favor renewable companies over their conventional competitors. In the face of the growing regulatory pressure directed at accelerating the energy transformation, market discipline has forced financial institutions to adopt policies aimed at reducing exposure to carbon-intensive industries and increasing the share of renewables and other sustainable sectors in their credit portfolios.
The result of improved access to capital has been a sharp increase in the level of investment by renewable energy generation companies. Expensive greenhouse emission permits on the European market have also rendered renewable energy much more competitive by penalizing the inefficient asset base of fossil-fuel-based companies.
Overall, it appears that the critical market shift has already happened, and renewable energy is going to keep growing in the foreseeable future. At the same time, policymakers keep using direct intervention [
6] instead of relying on market mechanisms, which may significantly slow down the development of the industry. Tax reliefs and subsidies remain the preferred tool for incentivizing the development of the industry and adjacent sectors. At the same time, the potential profitability and internally generated cash flows of renewable energy companies appear to be hindered by the contemplated and enacted revenue caps. Lifting the caps or abandoning the mechanism altogether, along with a systemic liberalization of the regulatory standards in the domain of permit procedures, could spur industry performance [
7]. More importantly, industry development would be primarily driven by market mechanisms. This would reduce the risks of distortions in the pricing mechanisms, alter consumer incentives by rewarding the optimization of energy use [
8], and possibly reduce the widespread outcry over the vast amounts of public investments, which are being directed to the development of the industry at to the expense of other sectors.
Our econometric findings derived from panel regression modeling on a sample of energy-generating companies based in European Union countries demonstrate that the financials of the renewable energy industry remain much more sensitive to the fluctuations in energy prices than those of conventional energy companies. We show that higher energy prices are not only strongly and positively associated with the level of profitability of renewable energy companies but also with their financing needs, with the newly incurred debt substituting for the weakened internally generated cash flow. Abandoning the instruments of price regulation and revenue caps and shifting the industry towards reliance on stabler energy procurement contracts could not only ameliorate the financial standing of those companies but also provide the necessary financial resources for organic growth and deleveraging. These shifts could also reduce the pressure on public finances.
This paper contributes to a broad strand of empirical literature analyzing the determinants of renewable energy generation development. By presenting a comparative analysis of renewable and conventional electricity-generating companies across the European Union, we delineate the factors that could slow down the growth of the renewable energy industry and, as a result, the transition of the European Union towards climate sustainability goals. The remainder of the paper is organized as follows: First, we present the literature review. Subsequently, we describe the research methodology and the dataset used for econometric analysis. The concluding section presents the empirical findings and policy discussion.
2. Literature Review
All the major decision-making and legislative bodies of the European Union appear to support a fast transition towards sustainable energy generation. This policy pivot requires institutions to navigate two major types of hurdles: sociopolitical and economic.
2.1. The Economic Challenges to the Development of Renewable Energy
Several specific features of the renewable energy industry shape the dynamics of the transition towards a higher share of renewables in the energy mix of EU countries. To start with, installing renewable energy generation capacity requires significant investment outlays, which can be financed either from the internally generated cash flows of energy companies or from public investment [
9]. The “chicken-and-egg” problem stems from the insufficiency of cash flows of the developing renewable energy industry comprised of many newly created entities to finance the necessary investment expenditures. A bigger problem resides in the instability of renewable energy sources [
10], which necessitates a redesign of the grid in order to ensure the storage or frictionless reallocation of energy depending on intermittent demand and supply fluctuations [
11]. The infrastructure necessary for connecting renewable energy generating capacity into the integrated energy management system requires substantial financing. In particular, the biggest challenge appears to reside in the capacity to store redundant energy in order to cover a possible subsequent surge in electricity consumption [
12].
Despite a reduction in the average expenditure involved in installing an additional unit of renewable energy generating capacity and in average production costs [
13], the above factors cause renewable energy to be at a disadvantage vis-à-vis that generated by fossil-fuel-based companies. The comparison speaks in favor of renewable energy if the hidden costs associated with increased emissions of greenhouses are included in the calculations of the unit price of electricity [
14]. Since burning fossil fuels is proven to cause significant negative externalities, remedial regulatory action is necessary in order to incorporate the hidden costs imposed on third parties into the market pricing mechanisms.
The European Union has done an outstanding job in developing carbon pricing mechanisms. The EU emissions trading system is the biggest functioning market for permits to emit greenhouse gases. It appears to work very well in incentivizing the market participants to change their energy mix and energy consumption patterns [
15]. The spikes in the prices of greenhouse gas emission permits have been shown to carry macroeconomic implications for some of the EU countries and sometimes even threaten the competitiveness of some of the legacy industries [
16]. The architecture of the market has allowed renewable energy companies to become more competitive not only by altering the pricing mechanism but also by imposing financial penalties on inefficient assets associated with increased greenhouse gas emissions. The financial markets have reacted accordingly by substantially increasing the risk premium associated with polluting assets and reducing that attached to sustainable assets [
17]. As a result, renewable energy companies have enjoyed improved access to external financing through all financing vehicles.
While the reliance on the mechanism of carbon pricing to alleviate the problem of negative externalities is wholly warranted, other instruments prevalent in the energy industry may be distorting the pricing mechanisms and, as a result, the incentives of the consumers, instead of boosting the growth of the industry. The European Union spends vast amounts of money in the form of subsidies to prop up the stability of energy prices for consumers in the face of possible price shocks [
18]. While subsidies undoubtedly allow sheltering the most vulnerable consumers from the effects of price hikes, they also reduce the efficiency of the pricing mechanism. As market prices are not allowed to fully and instantaneously incorporate fundamental demand- and supply-side factors, consumers may be reluctant to slash consumption, optimize consumption patterns, and invest in prosumer infrastructure; producers, in turn, may be slower in switching to cleaner generation technologies [
19]. These negative incentives may be particularly detrimental to the long-term transformation of legacy industries. High energy prices represent an indirect penalty on operational activities involving excessive spending of energy, particularly that derived from non-sustainable carbon-intensive sources. Reinforcing the existing inefficiencies may result in a slowdown of the reallocation of capital from the sectors most likely to be the losers in the current transformation toward sustainable energy.
The financial situation of renewable energy companies is also complicated by the rising costs and the tightening monetary policy [
20] accompanying the inflation upsurge across the EU countries. While renewable companies have enjoyed improved access to debt and equity financing through various financing vehicles, the constantly growing investment demand has caused those companies to accumulate significant amounts of interest-bearing debt. As a result, when the central banks across European countries started increasing interest rates, renewable energy companies experienced a significant increase in the cost of debt servicing. The relatively meager return on invested capital observed in the industry throughout the last decade has had to compete with the increasing cost of capital, resulting in a growing number of new investment projects in the industry being shelved for the lack of projected profitability. The rising costs embedded in the increasing levels of inflation [
21] observed across the majority of European countries have also been detrimental to the bottom lines of renewable energy companies. Starting from the COVID-19 pandemic, the energy sector experienced the same problems as the rest of the real economy: the rising costs of logistics and raw materials [
22]. The industry is particularly reliant on the supply of industrial metals. The resulting upsurge in the cost of installing new infrastructure and procuring new equipment, coupled with the limited ability to pass the costs along to the consumer, has created a significant challenge for industry executives and pushed them to seek external assistance.
2.2. The Sociopolitical Aspects of the Transition toward Renewable Energy
The observed extensive reliance on energy subsidies has important sociopolitical underpinnings [
23]. Regulators, executives, and legislators react to the public outcry accompanying the fluctuation in prices in response to the ongoing energy transition. As the unfolding transformation is likely to result in serious infrastructural bottlenecks [
24] and siphon substantial amounts of capital from other sectors of the economy, it is likely to contribute to price instability as well as technical problems with the grid and the stability of supply. The prevailing viewpoint among decision-makers is that cushioning any possible price fluctuations is the only way to ensure a smooth transformation without substantial public backlash. The handling of the problem of risk management is thus shifted to the energy-generating companies. The troublesome part of implementing a risk management strategy in such settings resides in the need to secure the company against the downside movements of prices. Long-term energy procurement contracts [
25] could partially solve the problem by providing renewable energy companies with relatively stable cash flows and an opportunity to invest those predictable cash flows into developing operational activities. The problem is that renewable energy companies may have to rely on spot markets [
26] to apportion their energy. The latter could be an advantage if companies were allowed to benefit from the upward movement of energy prices. However, the mechanisms of price regulation are likely to smooth such fluctuations. The financing shortfalls could be compensated for with financial assistance from dedicated financing vehicles. However, similar to subsidies [
27], this mechanism carries a number of risks associated with the allocation of allotted financial resources. In particular, it is not always clear which criteria should be used when allocating capital or granting procurement contracts, which may result in winnowing and favoritism [
28].
As the transition towards sustainable industry is pursued across the majority of developed countries, it is likely to absorb enormous amounts of capital, which would have otherwise been available to other industries. The possible resulting crowding-out effect [
29] may precipitate a backlash against further growth in the use of renewables. The latter may precipitate a regulatory response aimed at curbing the development of the industry.
The relative flexibility of renewables makes them more likely to be shut off in the event of excess supply. This happened multiple times across European countries when supply significantly outstripped demand, and the resulting surplus had to be eliminated by limiting the generating capacity of renewables since fossil-fuel-generating facilities cannot be flexibly turned on and off and are used to accommodate intermittent renewable generation [
30]. The integrated market has been equipped with tools to address this problem. However, it is likely to persist as long as there is no low-cost, extensively implemented solution for the temporary storage of surplus energy.
The final and possibly one of the most difficult challenges hindering the development of renewable energy generation relates to the difficulty of obtaining necessary permits, stakeholders’ consent, and regulatory approvals during the deployment phase [
31]. The bureaucratic procedures involved in the process of installing new generating capacities are incredibly lengthy and burdened with multiple steps, where every approval makes the project’s continuation a contingency. Estimates suggest that eliminating bureaucratic barriers, particularly those related to land procurement, building permits, and integration of newly installed capacity into the energy system, could significantly accelerate the growth of the industry [
32].
3. Database and Research Design
The present study relies on a firm-year dataset encompassing sampled listed energy companies domiciled across European Union countries. The sample consists of renewable energy companies and conventional energy companies. Notably, the former group does not distinguish between renewables from different sources, such as wind, solar, geothermal, etc., while the latter does not distinguish between companies reliant on different types of fossil fuels to generate electricity. We aggregate renewable energy companies into a single cluster and study their broad statistical properties. We did not exclude companies that conduct trading business alongside energy generation since many of the oldest electrical utilities, including the state-owned ones, have a diversified line of operating activities. The panel dataset is unbalanced and geographically heterogeneous, with companies from bigger economies prevailing in the sample composition. Overall, we studied 100 companies, all publicly traded. The country breakdown of the sample is presented in
Appendix A. For the analyzed companies, we collected yearly financial data from the Refinitiv Eikon database. All nominal variables subject to empirical analysis have been scaled and winsorized at a 1% level to eliminate outliers. The period of analysis spans from 2009 to 2022, with the raw dataset comprised of 1023 firm-year observations. The definitions of variables used in the analysis are presented in
Table 1. The descriptive statistics can be found in
Table 2. The data on the fluctuations in electricity prices across the studied European Union countries have been collected from the dataset of the European Commission.
The empirical part of the paper is structured as follows: At stage one, we compare the financials of renewable and fossil-fuel-based energy companies. The comparison is performed across three principal dimensions: profitability, investment, and capital structure. The comparative analysis allows us to understand the current development context of the specific subindustries in the energy sector. We want to investigate whether renewable energy companies have sufficient internally generated and external resources to meet their investment demand and to contrast the aggregate level of investment in the industry depending on the energy generation type. To that end, we rely primarily on univariate statistical tests to compare the subsamples of companies with different asset structures. The goal of this stage is also to ascertain by the indirect means of observing the dynamics of energy companies’ financials whether the existing policies aimed at boosting the development of the renewable energy sector are succeeding at channeling financial resources towards industry growth. Since the principal goal of the majority of enacted policies is to facilitate access of renewable energy companies to financial resources in order to further improve the technology and lower the unit costs, the primary key performance indicators of such policies are measures of those companies’ access to external financing.
At stage two of empirical analysis, we investigate the relationship between energy companies’ operating performance and the dynamics of energy prices. The goal is to check how sensitive the companies’ financials are to the market parameters, which are subject to regulatory tinkering. We also want to contrast these sensitivity indicators across the types of energy generation. We postulate that renewable energy companies may be more exposed to energy price fluctuations because of the existing procurement policies, higher exposure to spot markets, and possibly because of the caps, which may limit the possible operational benefits of upside movements in prices. In contrast, conventional energy companies may be more insulated from market movements because of legacy mechanisms of energy procurement, from which they may benefit by smoothing their contemporaneous operational performance. At this stage of analysis, we utilize multivariate panel regression models, in which the explained variables are different measures of the operating performance of the sampled companies, including EBIT margin, return on assets (ROA), and operating cash flows. The baseline regression model specification is as follows:
where
is a vector of control variables measuring firm size, asset tangibility, asset turnover, and the level of cash reserves.
represents a vector of regression coefficients at binary variables encoding year and country fixed effects. The primary explanatory variable is energy price, which may supposedly be associated with the firms’ contemporaneous operating performance. The interaction terms comprised of a binary variable encoding renewable energy companies and a continuous variable measuring the fluctuations in energy prices should allow us to check the differences in the sensitivity of operating performance to price swings across the two subsamples of energy companies with different generation types. The models include year and country control variables.
If the energy price turns out to be correlated with firms’ operating performance, then it should also be associated with their financing needs and the patterns of procurement of external financing under fluctuations of operating performance. If energy prices go down, one may reasonably expect the cash flows of a company to decline. Assuming that the company maintains a stable level of investment demand, the resulting gap in internally generated resources can be plugged with either previously accumulated financial resources or with external funding. To verify this conjecture, we model the relationship between energy price fluctuations and energy companies’ demand for external financing, with the balancing figure being the change in net cash reserves. Using panel regression modeling, we quantify the associative link between energy prices and the relative sizes of stock and debt issuances year-on-year. The size of net equity and debt issuances are scaled by the value of total assets. The baseline multivariate regression model has the following specification:
The definitions of variables in the equation can be found in
Table 1. We run a regression of the same specification for the net change in cash over a given year scaled by total assets. We study not only the magnitude of the necessary external capital procurement but also the frequency and the relative likelihood thereof. To that end, we binary-code the instances of net debt and net equity issuances by a given company during a given year. The resulting binary variables are subject to multivariate logistic regression modeling. The explained variable is the occurrence of external capital procurement. The list of explanatory variables is the same as in Equation (2). We postulate that the sampled companies, which find themselves in need of funding to close the liquidity gap, are likely to not only issue debt and equity in larger tranches, but they may also be more likely to issue external financing with higher relative frequency compared to their peers experiencing stabler cash flows and less vulnerable to market fluctuations.
This stage of analysis should help us elucidate how energy companies compensate for intermittent fluctuations in the internally generated cash flows, which may be caused, among other things, by the fluctuations in energy prices. Companies that are more subject to market fluctuations, and as a result, may experience an elevated level of cash flow volatility, may be more reliant on external financing. Together with the results on the availability of external financing and the specificity of the capital structure of energy companies reliant on different types of energy generation, this should help us better understand the operating challenges faced by the industry in terms of cash flow planning.
At the final stage of analysis, we check how the operating performance of the sampled companies evolves over time. This is done to better understand the prospects of the studied companies in terms of their future chances of becoming sufficiently profitable to finance their investment needs and compensate for any intermittent fluctuations in operating cash flows. If the performance of renewable energy companies is found to be improving over time, this could presage a potentially faster deployment of additional energy generating capacity and, as a result, faster transition towards sustainable integrated energy systems. We are also interested to know whether the performance of conventional energy companies is deteriorating or remaining stable, as they are likely to actively participate in the ongoing transition.
4. Principal Findings
Table 3 presents the results of univariate tests of differences in the financials of renewable (subsample 2) and conventional (subsample 1) energy companies. The following differences stand out:
Renewable energy companies exhibit significantly higher levels of investment demand than their conventional peers. The average level of capital expenditures scaled by contemporaneous total assets is 0.093 in the renewable energy subsample versus 0.0574 for conventional energy companies (sig.: 1%). In line with the expectations of the ongoing energy transition, renewable energy companies are driving the industry’s investment demand.
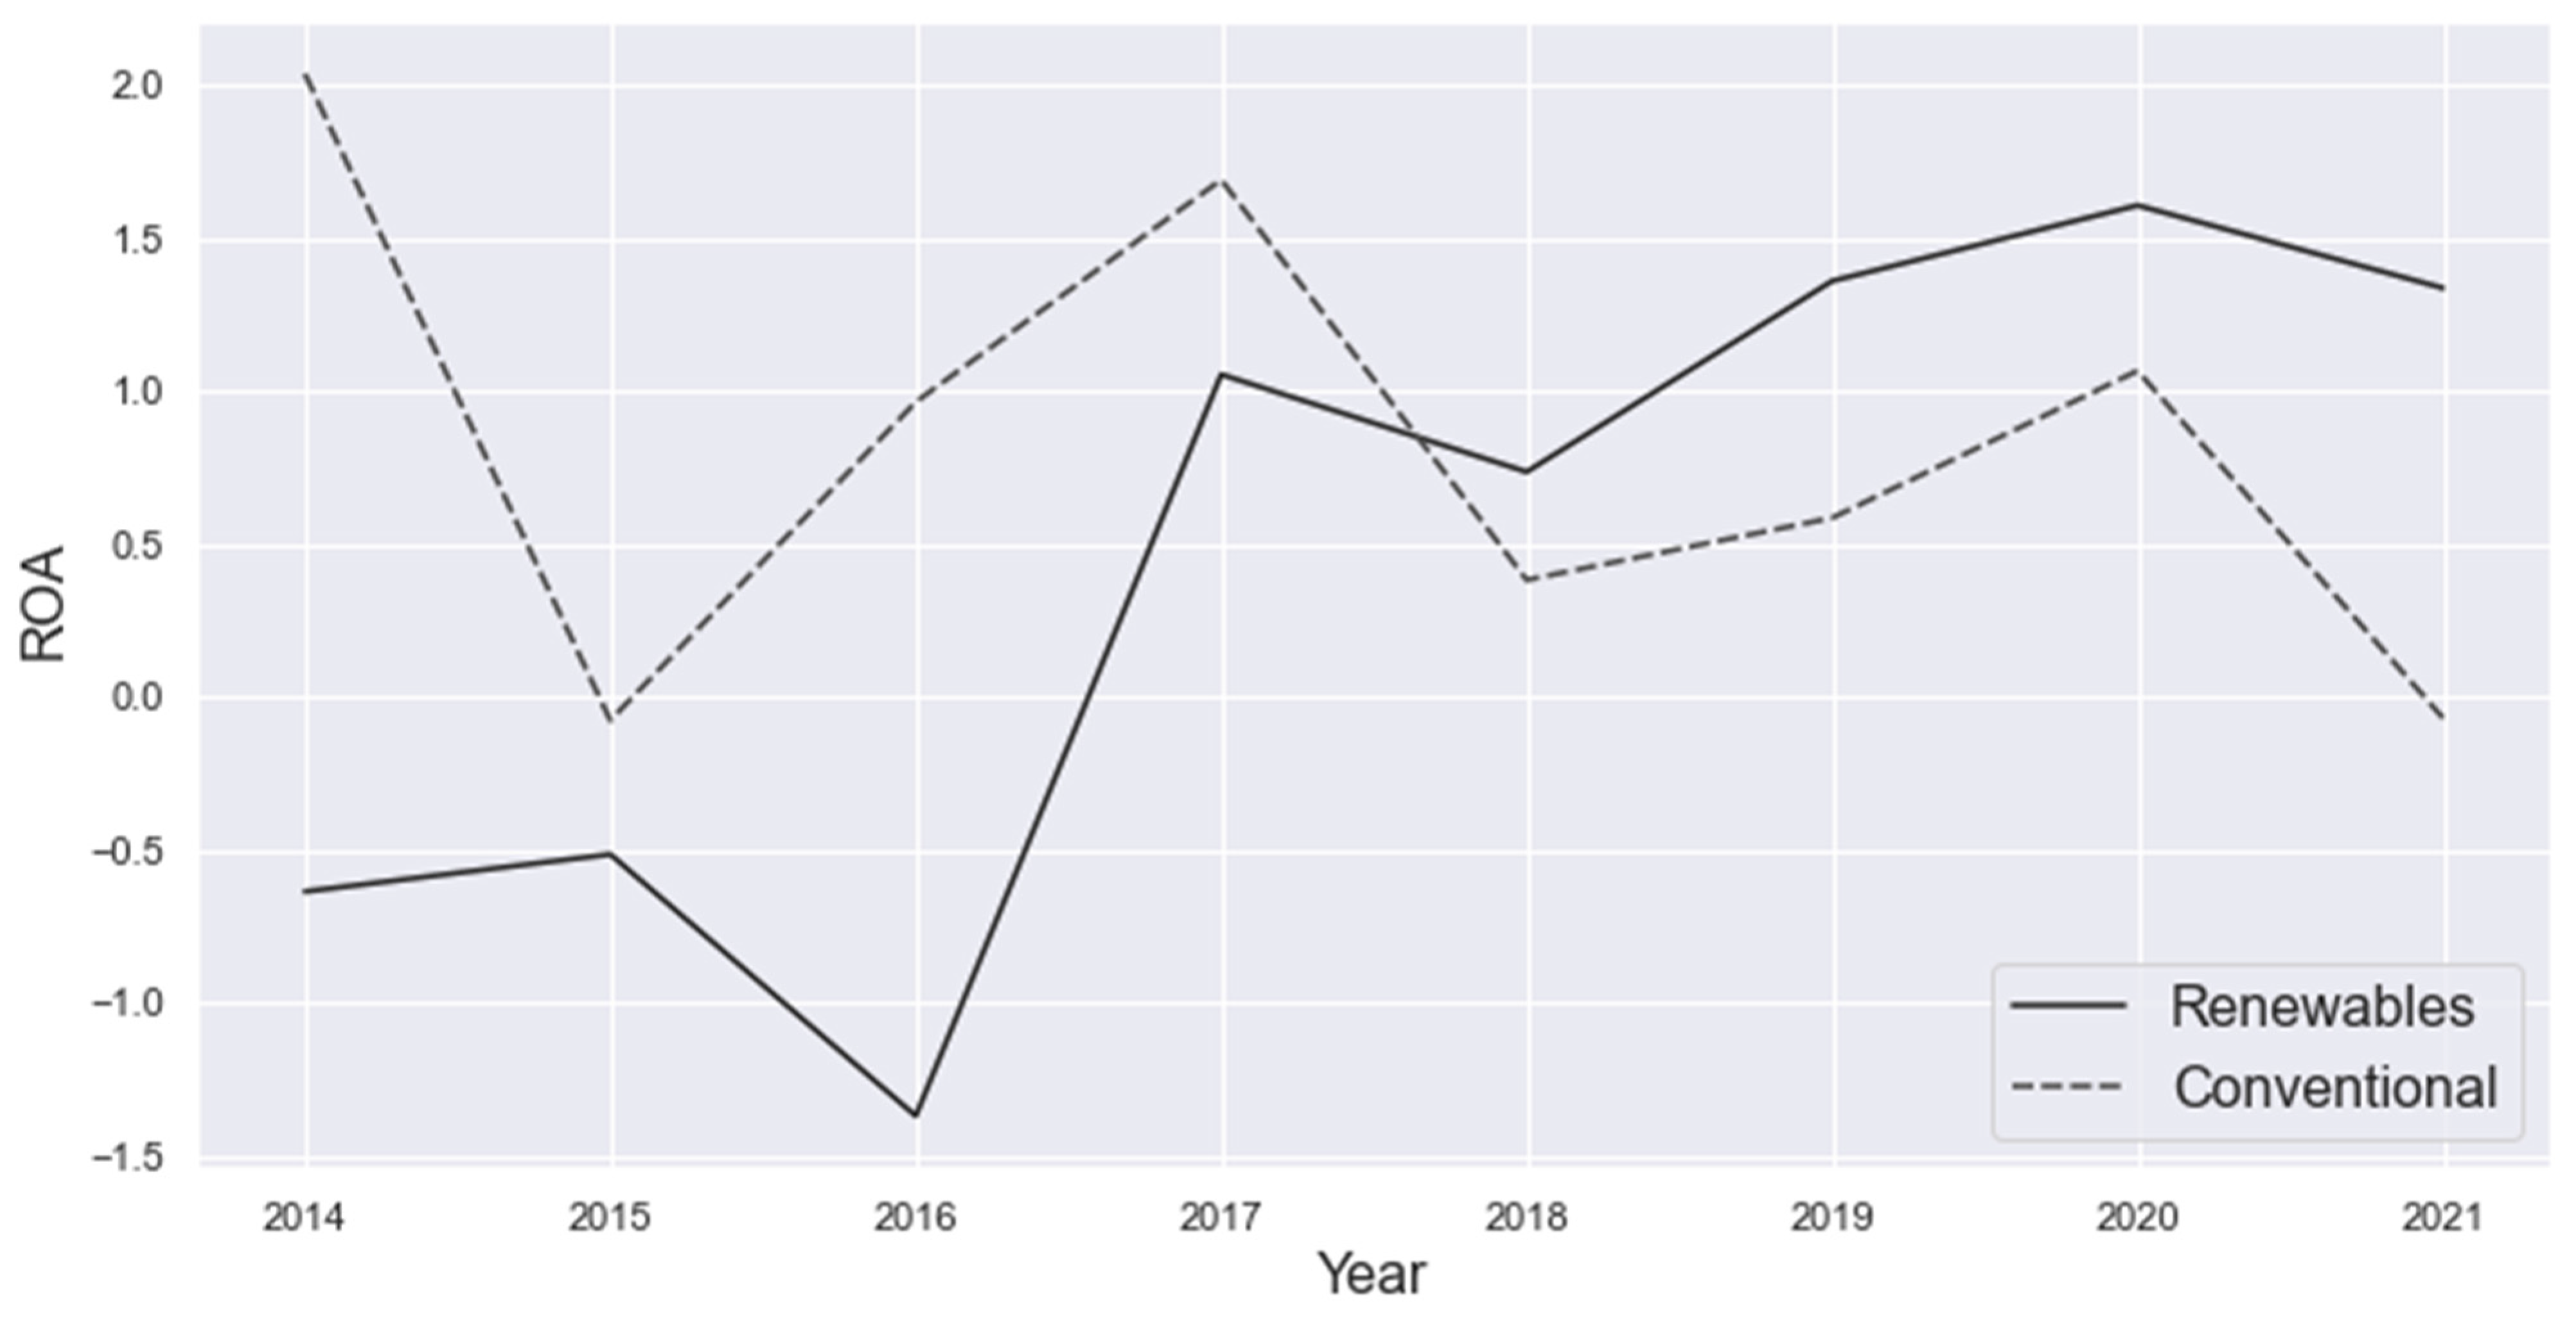
Figure 1 demonstrates that the return on assets of renewable energy companies has been steadily improving over the last decade and thus catching up with the performance indicators of conventional energy companies. In 2018, the average return on assets generated by the sampled renewable energy companies exceeded the average among conventional energy companies. The improvement in the renewable energy companies’ performance is attributable to a juxtaposition of market dynamics, whereby fossil fuels experienced a substantial increase in average prices, and concerted public assistance to the sector through various financing vehicles and mechanisms.
Importantly, renewable energy companies appear to be much more reliant on external financing than their peers. The average debt ratio of renewable energy companies is 0.387 versus 0.241 among conventional energy companies (sig.: 1%). Renewable energy companies are also evidenced to tap significantly more external debt and equity. The average size of debt issuances by renewable energy companies stands at 0.049 (in relationship to total assets). The readily available external financing appears to be one of the principal engines of the accelerated growth in renewable energy generating capacity. The cost of procuring external financing is also significantly lower among renewable energy companies. The average cost of equity is about 1.53 percentage points lower than among conventional energy companies. The weighted average cost of capital is significantly lower among renewable energy companies (
Figure 2).
Overall, univariate analysis suggests that renewable energy companies have unimpeded access to external financing necessary for their growth and investment. However, the access to external funding favored by the transformation of financing priorities in the banking sector and on public capital markets may eventually become a burden for cash-strapped renewable energy companies, particularly under conditions of monetary tightening, whereby the management of substantial accumulated debts may become unsustainable. At the same time, it is clear that regulatory action aimed at promoting the unimpeded flow of capital to the renewable energy industry and adjacent sectors has been successful if assessed based on the inflows of cheap financing to the industry.
Despite the readily available external financing, renewable energy companies appear to remain financially constrained. The measurement of the cash flow sensitivity of investment, which is accepted as a proxy for the degree of binding financing constraints [
33], suggests (
Figure 3) that the investment demand of renewable energy companies is more dependent on internally generated operating cash flows than that of conventional energy companies. This may be because of the significant investment demand in the industry, which contributes to an elevated rate of reinvestment of internally generated cash flows. At the same time, it may possibly signify that renewable energy companies are still in need of more external financing to fuel further growth.
Table 4 presents the results of multivariate panel regression modeling of the nexus between the sampled firms’ operating performance and the fluctuations in energy prices. First of all, the results suggest that within a multivariate setting, there are no statistically significant differences in operating performance indicators between the subsamples of renewable and conventional energy companies (the coefficient of the Renewable variable is statistically insignificant). Secondly, two measures of operating performance—EBIT margin and operating cash flows—exhibit a statistically significant (sig.: 10%) associative link with energy prices interacting with the binary variable encoding renewable energy companies. These coefficients may suggest that within a subsample of renewable energy companies, operating performance exhibits a positive link with the movements of energy prices, which may signify a relatively stronger dependence of operating performance on market fluctuations than in the case of conventional energy companies. This may be due to the fact that renewable energy companies are more exposed to the dynamics of the spot market. The higher exposure to fluctuations in energy prices could play a positive role in fostering industry growth. However, for that reason, the prices of energy should not be tampered with and instead be allowed to fluctuate in line with the changes in demand and supply. At present, the price mechanism is regulated in a way to mitigate the exposure of consumers to short-term spikes in energy prices caused by external shocks. While this may be beneficial from the standpoint of protecting industrial clients and limiting public outcry, it may deprive the industry of the benefits of upside price movements. While the trade-off between these two policy priorities is challenging to figure out, the architecture of the market could benefit from a solution based on market incentives and price signals.
Table 5 presents the results of multivariate econometric modeling of the interrelation between energy prices and the demand of energy companies for external financing. We find a statistically significant relationship between the dynamics of energy prices and debt and equity issuances by energy companies. More importantly, the difference in the size of stock issuances observed between renewable and conventional energy companies is not observable within multivariate settings. There is, however, a statistically significant difference in the relative size of debt issuances (coeff: 0.09; sig.: 1%). The energy prices are evidenced to exhibit a statistically significant associative link with the relative size of debt issuances across the studied sample of energy companies. The relationship is negative and statistically significant within the subsample of renewable energy companies as evidenced by the coefficient of the interaction term Renewable × Energy price (coeff.: −0.551; sig.: 5%). The demand for debt financing on the part of renewable energy companies appears to be increasing as energy prices decline and vice versa. This may signify that renewable energy companies are attempting to close the resulting gap in cash flows by procuring debt. This result appears to be further corroborated by the observed lack of any significant relationship between energy prices and the changes in the cash reserves of energy companies. The cash reserves, when plentiful, may serve as a buffer against the fluctuations in operating cash flows. However, within the environment of low interest rates and readily available external financing, debt may be used to cushion the fluctuations in operating performance. The models in
Table 5 also demonstrate that the demand for external capital may be gradually diminishing as firms mature, as evidenced by the coefficients of the Time since incorporation variable.
The results of binary logit regressions reported in
Table 6 support our prior findings with regard to the relationship between energy prices and the demand for external capital on the part of renewable energy companies. To start with, we demonstrate that renewable energy companies are significantly more likely to issue debt (coeff.: 2.01; sig.: 5%) than their conventional energy peers. At the same time, this subsample exhibits a negative associative link between the selected energy prices and the likelihood of debt issuances (coeff.: −15.62; sig.: 1%), which means that tapping external debt may be more likely in the event of lower energy prices. The opposite appears to be true for equity issuances (coeff.: 18.17; sig.: 5%), which, in the case of renewable energy companies, appear to be more likely under higher energy prices. The latter may be due to the fact that higher prices may be positively associated with the stock price of the issuing companies. Therefore, issuing equity may be more financially viable under such circumstances. In the case of lower energy prices, debt appears to be the primary source of necessary external financing.
Overall, we demonstrate that renewable energy companies appear to be more reliant on external financing, with characteristic patterns of the procurement thereof under different market conditions. The declining energy prices may be associated with inferior operating performance, forcing the companies to resort to incurring debt. At the same time, higher prices appear to favor equity issuances, which may be necessary for further financing of investments under a favorable market conjuncture. Whether such patterns have a positive or negative impact on the dynamics of the growth of the entire industry remains unclear. However, reducing the industry’s reliance on external capital or at least supplementing its organic cash flows by fostering market mechanisms may inject additional resources for future growth.
The final stage of our analysis attempts to establish whether the performance of renewable energy companies is improving over time. The results of multivariate modeling of the proxies for operating performance are presented in
Table 7. Only the EBITDA and EBIT margins demonstrate a statistically observable pattern over time since the companies’ incorporation. There appears to be a negative statistically significant associative link (coeff.: −0.003; sig.: 1%) between the time since the firms’ incorporation and the EBIT margins. The opposite appears to be true in the subsample of renewable energy companies, where we observe a positive statistically significant link between time since incorporation and the margins. This may suggest that the performance of sampled renewable energy companies is improving over time. The results should be interpreted with caution since the time frame of the analysis is too short to draw any definite conclusions.
5. Conclusions
The present study attempts to fulfill two tasks. The first one is to conduct a comparative analysis of the financial standing of renewable and conventional energy companies in the European Union. The second one is to analyze the associative link between the fluctuations in energy prices and the renewable energy companies’ financials and external financing needs. The study demonstrates that renewable energy companies have experienced a steady improvement in their operating performance over the last decade. The current return on assets generated by renewable energy companies is significantly higher than that of conventional energy generation. At present, the sector enjoys unimpeded access to relatively cheap external capital, which in turn may be fueling the investment in new energy-generating capacity. Univariate cross-sectional statistical tests demonstrate that renewable energy companies have a lower average cost of equity (4.76% vs. 6.29% for renewable and conventional energy companies, respectively). The margins of the renewable energy businesses have also been steadily improving.
At the same time, renewable energy companies appear to remain more financially constrained than their conventional energy peers, which may be due to the steadily increasing investment demand, for which the available financing resources may be insufficient. Regression modeling demonstrates that the cash flow sensitivity of investments is significantly higher among renewable energy companies than among their conventional energy peers. Therefore, additional regulatory measures may be necessary to foster the growth of the industry and allow it to accumulate greater financial resources, including boosting the internally generated operational cash flows. We show that the performance of renewable energy companies is positively and significantly associated with the fluctuations in energy prices. The sensitivity of operational KPIs (key performance indicators) to the fluctuations in energy prices is much higher in the subsample of renewable energy companies, suggesting that they may be more exposed to the price fluctuations possibly due to their greater dependence on the spot market dynamics. The price declines appear to be associated with an increased need to procure external financing. Capital procurement appears to be following specific patterns: under lower energy prices, firms appear to be more likely to issue additional debt, while under higher prices, they exhibit a higher likelihood of issuing equity.
We posit that an additional impulse to the development of the industry may come from relaxing the regulation around the pricing mechanisms, which may allow the companies to benefit from the upside movements of prices. Fostering the market mechanisms may provide the companies with additional resources for organic development and investment. Deregulation of the permit procedures may also play an important role in spurring industry growth and speeding up the transition of the European Union towards sustainable energy generation. Further studies are necessary in order to establish the most efficient structure of energy procurement contracts and the architecture of energy markets conducive to the more dynamic growth in renewables. It remains unclear whether energy procurement through spot markets or through long-term contracts is better for spurring industry growth and providing energy companies with resources for investment. Further studies will focus on the impact of changes to the regulatory permit systems across the EU countries on the growth dynamics of the renewable energy industry.


