Article

New Approaches to Project Risk Assessment Utilizing the Monte Carlo Method

1
Faculty of Mining, Ecology, Process Control and Geotechnologies, Technical University of Kosice, Letna 9, 042 00 Kosice, Slovakia
2
Faculty of Aeronautics, Technical University of Kosice, Rampova 7, 041 21 Kosice, Slovakia
*
Author to whom correspondence should be addressed.
Sustainability 2023, 15(2), 1006; https://doi.org/10.3390/su15021006
Submission received: 5 December 2022 / Revised: 30 December 2022 / Accepted: 2 January 2023 / Published: 5 January 2023

Abstract

:
An environment of turbulence in the market in recent years and increasing inflation, mainly as a result of the post-COVID period and the ongoing military operation in Ukraine, represents a significant financial risk factor for many companies, which has a negative impact on managerial decisions. A lot of enterprises are forced to look for ways to effectively assess the riskiness of the projects that they would like to implement in the future. The aim of the article is to present a new approach for companies with which to assess the riskiness of projects. The basis of this is the use of the new Crystal Ball software tool and the effective application of the Monte Carlo method. The article deals with the current issues of investment and financial planning, which are the basic pillars for effective management decisions with the goal of sustainability. The article has verified a methodology that allows companies to make effective investment decisions based on assessing the level of risk. For practical application, the Monte Carlo method was chosen, as it uses sensitivity analysis and simulations, which were evaluated for two types of projects. Both simulations were primarily carried out based on a deterministic approach through traditional mathematical models. Subsequently, stochastic modeling was performed using the Crystal Ball software tool. As a result of the sensitivity analysis, two tornado graphs were created, which display risk factors according to the degree of their influence on the criterion value. The output of this article is the presentation of these new approaches for financial decision-making within companies.

1. Introduction

Creating the conditions for correct investment decisions is a key factor leading to the sustainability of businesses in the future. A systemic approach focused on the sustainability of businesses in the field of financial and investment planning can create a comprehensive view of the issue of effective managerial decision-making.
Currently, several authors are interested in and draw relationships between financialization and technological innovations, as well as analyzing the behavior of nonfinancial enterprises in financing from both a macro and micro perspective [1,2,3].
Risk is generally perceived as the uncertainty of future development, the uncertainty of whether the projects that the company invests in will be profitable or will make a loss. The success or, on the contrary, the failure of business projects can significantly affect the economic result of the company and, in the worst case, even the very existence of the company [4,5,6]. For this reason, companies should pay attention to the assessment of the risks of individual business projects before their implementation. Currently, risk management is very neglected in practice, but globalization forces our entrepreneurs to apply new methods of risk management to their businesses in order to be competitive [7,8]. Risk analysis is usually understood as a process of defining threats, the probability of their occurrence, and the impact on assets, i.e., determining risks and their severity [9,10,11]. Other authors [12,13,14,15] describe risk analysis as part of five basic phases of risk management: the determination of project risk factors, the determination of the significance of risk factors, the determination of project risk, the assessment of project risk and the adoption of measures to reduce it, and the preparation of a corrective action plan.
We currently know several risk management methods for each business activity or strategy. In general, we distinguish between deterministic and stochastic (probabilistic) approaches to risk measurement. Deterministic approaches assume that a certain value of one variable is assigned a certain value of the second variable. In stochastic approaches, it is assumed that a certain value of one variable corresponds with certain probabilities of different values of the other variable. Stochastic approaches incorporate variability into the risk measurement model itself by specifying a probability distribution for the random variables. In particular, the following types of probability models can be used to measure risk: models based on an expert determination of subjective probability distributions, analytical models, and simulation models [4,8,9,16].
For new business plans, the greater part of the required probability distributions of risk factors must be determined by subjective estimation based on expert evaluation. It is usually easier to determine them in the form of a discrete probability distribution for three decision variants: pessimistic, most probable, and optimistic. In the second type of probabilistic model, an analytical approach is used using standard theoretical probability distributions for the continuous and discrete variables. The result of the solution is the determination of the consequences of risk variants in the sense of determining the probability distribution of the values of the evaluation criteria for individual risk variants. The third type of probabilistic model—simulation models–is used when the problem is too complex for the use of the previous methods. The main phases of simulation studies are the definition of the problem, the creation of a simulation model, the specification of input variable parameters and their mutual relations, and the simulation and design of new experiments. Currently, the use of simulation models is associated with the application of Monte Carlo computer simulations [4].
Large portfolios of financial assets or commodities with high variability, which can significantly affect the financial stability of the company, will require more sophisticated techniques, including statistical analyses based on the value at risk and cash flow at risk models. VaR models make it possible to estimate the value of the risk in the portfolio as a maximum loss in the event that the portfolio had to be held for a fixed period with a predetermined level of significance—usually with a probability of 95% or 99% based on past experience [17].
The categorization of individual methods for risk analysis is presented in Table 1.
The basis of risk management is a certain systematic procedure for working with risk and uncertainty aimed at increasing the quality of project preparation and evaluation. The first three phases of risk management include determining the risk factors, determining their significance, and determining project risk [21,22,23]. These three phases are collectively referred to as project risk analysis. The next two phases are referred to as the project’s own risk management [10,24,25]:
  • The 1st stage of risk management is the determination of risk factors. The content of this phase is the determination of risk factors as quantities whose possible future development could affect the economic results, the criteria of the economic efficiency of the project (profit, return on capital, and net present value), and its financial stability;
  • The 2nd stage of risk management is the determination of project risk. The importance of the risk factors can basically be determined in two ways, namely expertly or by using sensitivity analysis;
  • The 3rd phase determines the risk of investment projects. Project risk can be determined numerically or indirectly. In numerical form, the risk is determined using statistical characteristics (dispersion, standard deviation, coefficient of variation), which serve as a measure of risk in financial management. Project risk is indirectly determined using certain managerial characteristics, which, in their summary, provide information on a greater or lesser degree of risk.
Hertz and Thomas [26] prescribe the content of risk analysis, which includes the analysis of input variables (resulting in the determination of the risk factors and their distribution functions), Monte Carlo simulation (generation of risk situations), and the evaluation of outputs based on the obtained probability distributions. Berkowitz [27] divides the risk analysis into two basic parts: the identification of risk factors and their impact on the value of the portfolio and a model that connects the risk factors with the observed output quantity.
Savvides [28] presents a risk analysis model, which consists of a sequence of seven basic steps, ensuring the processing of a certain number of inputs (random variables, i.e., risk factors, deterministic variables, and parameters) for the calculation of the outputs (selected criteria for evaluating business projects).
Several authors [29,30,31] discuss the procedure for determining the significance of risk factors in two ways, namely, the expert assessment of risk factors or sensitivity analysis.
The expert assessment of the significance of risk consists of a professional evaluation by managers who have the necessary knowledge and experience in the areas where the individual risk factors fall. The significance of the risk is assessed from two points of view. The first is the probability of the occurrence of the risk factor, and the second is the intensity of the negative impact that the occurrence of the risk factor has on the results of the project [32].
The purpose of the sensitivity analysis is to determine the sensitivity of the project’s economic criterion, such as its net present value, profit, and profitability of invested funds, depending on the factors that influence this criterion. So, it means determining how certain changes in these factors, for example, changes in the volume of production, or utilization of production capacity, reflect changes in the selling prices of products, the prices of the basic raw materials, the materials and energy, the investment costs, the interest and tax rates, the exchange rates, the project lifetime, and the discount rates that affect the chosen economic criterion of the project [18,33]. For those factors in which certain changes, e.g., a deviation in the size of 10% from the most probable value, cause only a small change in this criterion, we then can consider them to have little importance because the sensitivity of the chosen criterion to changes in these factors is small.
On the contrary, those factors in which the same change causes significant changes in the chosen criterion will certainly be significant for us. The given criterion is highly sensitive to changes in these factors. However, in the case of risk factors with smaller impacts on the project’s profit, it is necessary to remember that the percentage changes in profit refer to an increase in these factors by a specified percentage. However, if possible, changes in some risk factors with a small impact on profit can be significantly greater (e.g., in the case of energy prices); it is also necessary to consider such a factor as a significant risk factor. Therefore, not only the results of the sensitivity analysis but also the possible range of these factors are essential to define unimportant risk factors that can be neglected and work only with their most probable estimates [34].
The main goal of these methods is to allow those managers who are responsible for risk management to have more transparent access to information about threats and to ensure integrated risk management throughout the enterprise at the level of strategic management. In the current conditions of business uncertainty, simple deterministic models are not sufficient; we need to focus more on the use of probabilistic methods for measuring risk, which provide greater possibilities in terms of information security of decision-making processes.
In our opinion, these methods most accurately determine the extent of risks and allow investors to more easily decide on which investment project to invest in, as well as help them decide on reducing or transferring risk to another entity.
The basic shortcoming of the traditional methods for evaluating investment projects is a single-scenario approach based on an optimistic assumption of the development of the business environment. An increase in the quality of investment decision-making, in terms of respect for risk and uncertainty, can be brought about by probabilistic approaches, a significant representative of which is the Monte Carlo simulation [35].
This tool requires the identification of risk factors affecting investment projects and, thus, their evaluation criteria. The result of the application of Monte Carlo simulation is the distribution of the probability of these quantities and, subsequently, an easier decision for the investor to accept or reject investment projects based on valuable information about the size of the project’s risk obtained by this method [19,36].
The Monte Carlo method originated in the 20th century. Even so, this method is currently considered one of the most advanced methods today. The wide application of this method results from its simple modification to current conditions and the usability of modern software tools. For this very reason, this method has become a multidisciplinary method used in various scientific branches, such as the field of physics and electrical engineering [37,38,39,40], chemistry [41,42], safety assessment [43], industry [44,45], the public sector [46], economics [36,47,48,49], and many other fields. Practice has shown that the use of the Monte Carlo method leads to a significant reduction in variance but, above all, to a reduction in computing time [50,51].
The goal of our contribution is to apply Crystal Ball software tools and Monte Carlo simulation in the evaluation of investment projects, which creates prerequisites for expanding the applied use of simulation software tools in risk management in practice. The article is aimed at solving the issue of financing the investment activities of companies in order to decide on a more effective project. The modeling process was based on the evaluation of the economic efficiency of the investment and a decision about which of the two projects is more advantageous and less risky in terms of future sustainability.
The secondary goal was to integrate the use of new classical and modern economic-statistical methods, which are an effective tools for the sustainability of businesses [1,3,52]. The application verification was based on the methodology presented by us in our published article [19]. The methodology shows two approaches to eliminating risk in enterprises in Slovakia. The first approach represents the modeling of financial risks using the principles of financial mathematics in order to optimize them. The second approach is stochastic modeling, which is based on the use of simulations.
The purpose of the article is to present new approaches to assessing the riskiness of projects and investment decisions. At the same time, the aim of the article is to verify, using a practical example, the methodology created by us aimed at achieving the sustainability of businesses in the territory of the Slovak Republic. The problem is primarily that businesses in the territory of the Slovak Republic use traditional and outdated methods that do not take risks and the factor of time into account in decision-making processes and in the processes of assessing projects and investments. The purpose of this contribution is to provide guidance for these companies on how to integrate new modern approaches into decision-making processes. The article applies the methodology of assessing project and investment decisions to the environment of a real company with the aim of introducing new software tools to companies that will facilitate the decision-making processes of the company’s management and, thus, make the decision-making about the future investments of these companies more efficient.
Despite the wide applicability of the Monte Carlo method in published studies, there is no guide for the simple integration of this method into decision-making processes in companies. A methodology was therefore created for the conditions of companies in the territory of the Slovak Republic, which provides simple instructions for companies on how to integrate new approaches in the form of the Monte Carlo method into their internal processes.
The use of the Monte Carlo method through the software environment creates space for companies to implement simulations that integrate risk assessment, especially when taking time into account. The businesses will obtain a realistic idea of the future development of their investments. The main advantage of the methodology is the fact that the introduction of such an approach for companies in the conditions of the Slovak Republic does not represent high initial investments and will contribute to their sustainability.

2. Materials and Methods

The article deals with the issue of investment decision-making in enterprises in the territory of the Slovak Republic. The basic principle of the article is the verification of the methodology that was presented in the authors’ previous publications [19]. The methodology is aimed at solving the investment decisions of the company when implementing modern software tools. Several companies operating in the territory of the Slovak Republic were chosen to verify the methodology. To fulfil the objective of the presented article, the article presents the outputs obtained from the methodology verification process within the company, which acts as a partner company ensuring security in transport sector companies, such as airports and transport companies. We will not name the company due to GDPR. Among other things, the analyzed company provides a number of products for companies in the transport sector that are essential as part of a security solution. The list of products is shown in Figure 1.
The analyzed company was forced to make a decision in 2022 to modernize their technological procedures in production manufacturing. The company considered purchasing two types of lines:
  • A project: the purchase of a new sheet metal ringer SIHR 6/3, 2050 × 6 mm. The amount of this investment is EUR 47,422.08;
  • B project: the purchase of a new welding machine, amounting to EUR 88,000.
For research purposes, the lifetime of both devices was 12 years in the company’s accounting records. The introduction of full automation brings with it an increase in production in direct proportion to the requested quantity, a reduction in labor costs, and a reduction in nondelivery. However, an increase in the variable costs associated with energy consumption is also expected.
It is focused on the use of the Monte Carlo method applied through the Crystal Ball software tool in the MS Excel environment. The sequence of steps is shown in Figure 2. As the algorithm of the methodology shows, the first step is to develop mathematical apparatus, which was processed in the MS Excel environment. The mathematical apparatus represents the modeling of deterministic variables that do not take into account changes in time. The basic monitored value was the profit.
The following relations have been used in the calculation:
  • Depreciation: The company primarily uses linear depreciation, and this has also been modeled for the purpose of verifying the methodology, while the value of such depreciation is expressed by the following relationship:
    D e p r e c i a t i o n = Asset   entry   price Period   of   depriciation  
  • The value of operating costs has been calculated according to the following relationship:
    O p e r a t i n g   c o s t =   ( DC + IC + D + OC )
    where
    DC Direct cost;
    IC Indirect cost;
    D Depreciations;
    OC Other costs.
  • Revenues are calculated using the following relationship:
    R = i = 0 n ( P + S )
    where
    R Revenue;
    P Price;
    S Sale (quantity of sales).
  • The financial risk assessment model also took into account the tax burden in the form of income tax calculation. According to § 15 letter (b) of the Income Tax Act, the corporate income tax rate in Slovakia is 21% and is calculated from the tax base after the deduction of the tax loss [53]. The tax base is calculated according to this relationship:
    T a x b a s e =   e a r l y t a x b a s e p a r t o f non - taxable   tax   base ,
  • Profit after tax is calculated according to the relationship:
    E A T = E B T i n c o m e t a x f o r o r d i n a r y a c t i v i t y i n c o m e t a x f o r e x t r a o r d i n a r y a c t i v i t y ,
    where
    EAT earnings after taxes;
    EBT earnings before taxes.
In order to perform the necessary analyses, defining the basic parameters of the Monte Carlo simulation was required. The criterion value that has been assessed is profit before tax (EBT). Fixed costs, variable costs, sales price, and production are considered to be risk values (given that risk mapping has shown that they are the riskiest financial risks).

3. Results

3.1. Risk Mapping

As part of the risk mapping, a risk factor assessment matrix has been created. The matrix is based on an expert risk assessment. The essence of the expert assessment of a risk’s significance when using risk assessment matrices is that this significance is assessed by two aspects. First of all, the probability of the occurrence of the risk was defined, and then the intensity of the negative impact that the occurrence of the risk had on the company was assessed.
The significance of the risk was assessed on the basis of a higher probability of occurrence and the higher intensity of the negative impact of this risk on the company. The output is a semiquantitative assessment of the significance of the company’s risks based on the risk assessment matrix or its graphic display. The resulting risk assessment matrix is shown in Figure 3.
The risk matrix interprets a graphical representation of the probability of occurrence of a risk and its intensity. The significance of the impact of the risk is shown by a color scale: red, orange, and green. The risks that are the highest for the company are marked in red. On the contrary, the least risks are those marked in green. The yellow color indicates the risks with a medium level of riskiness. From the risk matrix, it can be stated that red risks are unacceptable for the company, and the company must immediately minimize them. The orange risks are temporarily acceptable risks, which require the clean implementation of measures within the company. The green risks are acceptable risks and do not require immediate action. It is clear from the elaborated risk matrix that financial risks are considered the riskiest for the company. For this reason, a profit was set for the criterion value in the simulations.

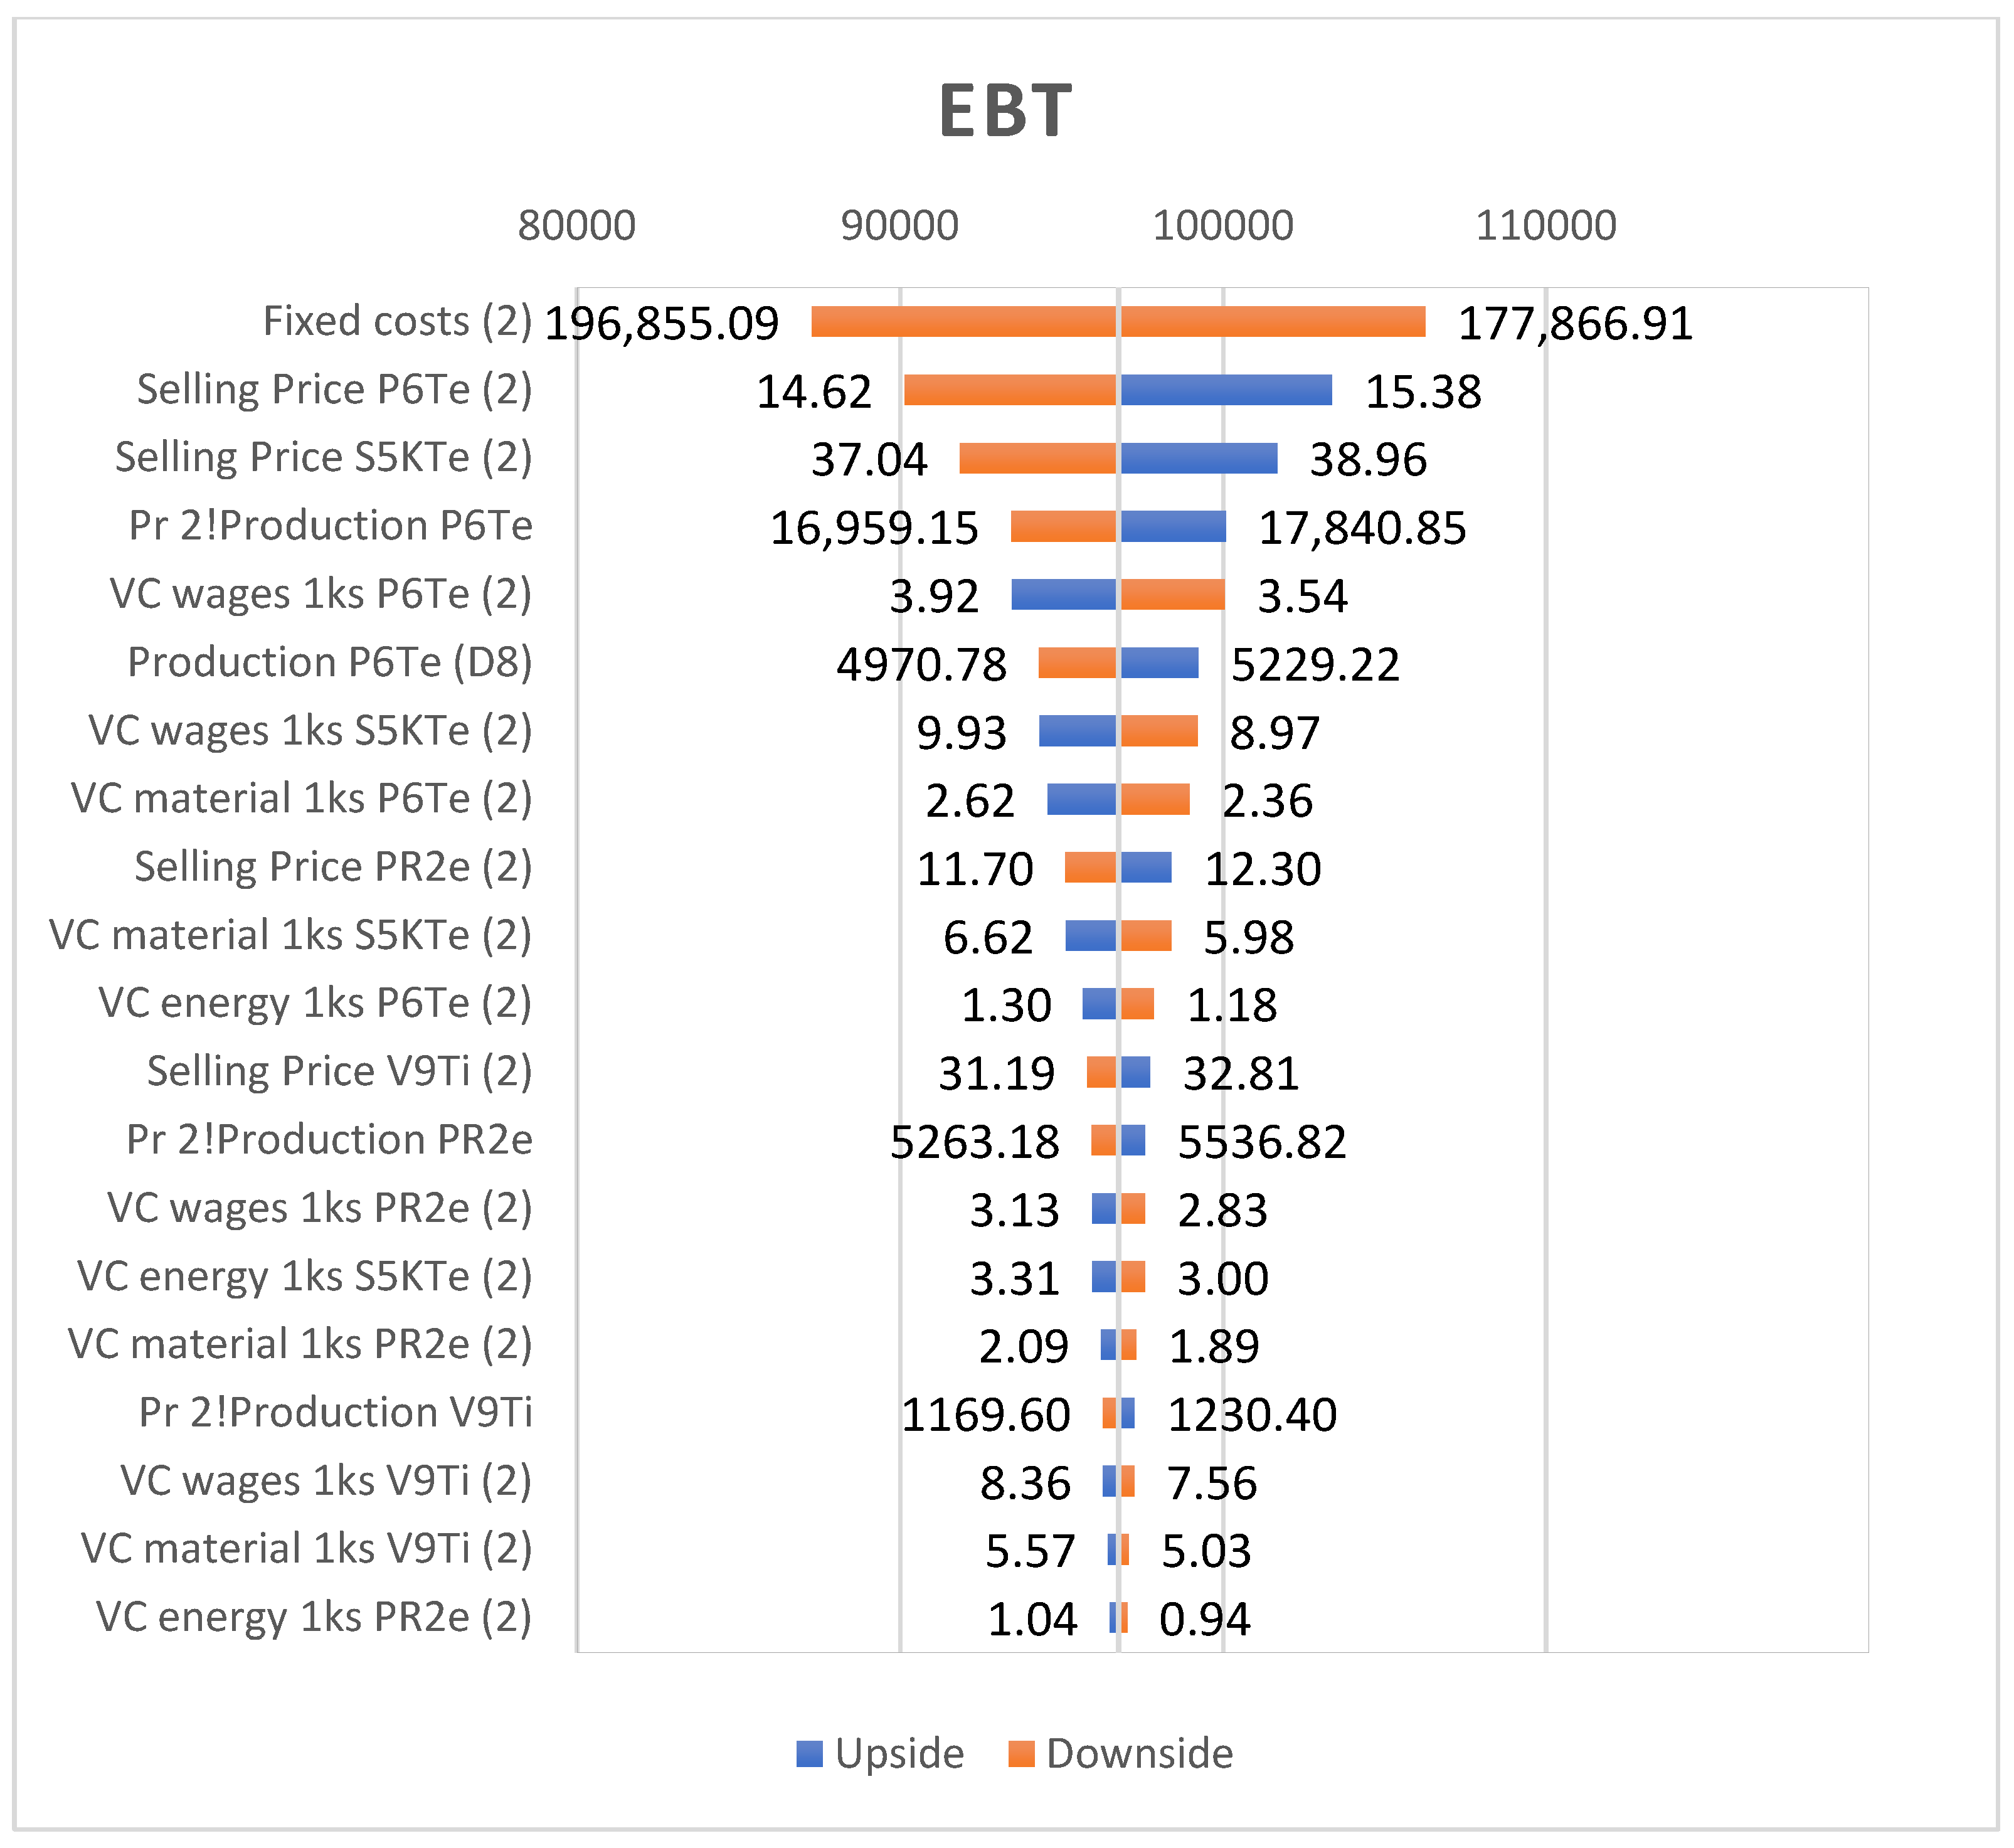
3.2. Sensitivity Analysis in the Simulation Model

The software tool Crystal ball, which was used for the Monte Carlo simulation, enables a sensitivity analysis to be performed through a tornado plot and a spider plot. The goal of this analysis was to get a basic idea of the impact of individual risk factors on the criterion value: profit and cash flow, and thus also a kind of control, whether the impact makes sense and whether there is, by chance, an error in the model. The principle of this analysis is that the resulting values of the criterion value are calculated based on the selection of the values from the predefined intervals of the possible values of the risk factors.
The output of the analysis is a tornado graph, which displays the individual risk factors in descending order according to the degree of their influence on the criterion value. The degree of influence is calculated according to the resulting values that the criterion variable achieves in the values of the considered risk factor intervals. For the needs of the sensitivity analysis in the simulation environment, the quantiles of 10% and 90% were chosen. Even in this case, the influence of only one risk factor is always considered without taking into account the simultaneous influence of other risk factors. The tornado graphs for both monitored projects—the A project and the B project—are shown in Figure 4 and Figure 5.
As can be seen from both graphs, the main risk factors are the fixed costs and the selling price of the P6Te product. The figures show that the 10% quantile of the risk factor in the form of the fixed costs in project A has a value of EUR 59,614.91, and in the B project, EUR 177,866.91. Subsequently, the 90% quantile reaches a value of EUR 65,979.09 and a value of EUR 196,855.09 in the B project for the fixed costs in the A project. It follows from the above that the range of values of the criterion value is the highest between the 10% and 90% quantile of the considered fixed costs. This means that if the fixed costs of the A project are only 10%, the value of the profit will be EUR 34,585.09. This can interpret the other values from the tornado charts of both projects in the same way.
The spider chart is also part of this analysis. The principle of this graph is practically identical to that of the tornado graph, with the difference that the resulting values of the criterion value are monitored not only in the interval values of the risk factors, but also between them. The spider charts of both projects are shown in Figure 6 and Figure 7.
The spider chart shows the degree of influence of the risk factors using the slope of the lines. The advantage of this graph compared to the tornado graph is that it can also capture the possible nonlinear influence of the risk factor in the observed quantile interface precisely because the recalculation of the criterion value is carried out at several points from the interval of the possible values of the risk factor and not just from two. Additionally, in this case, the results of both charts confirmed the results obtained from the tornado charts.

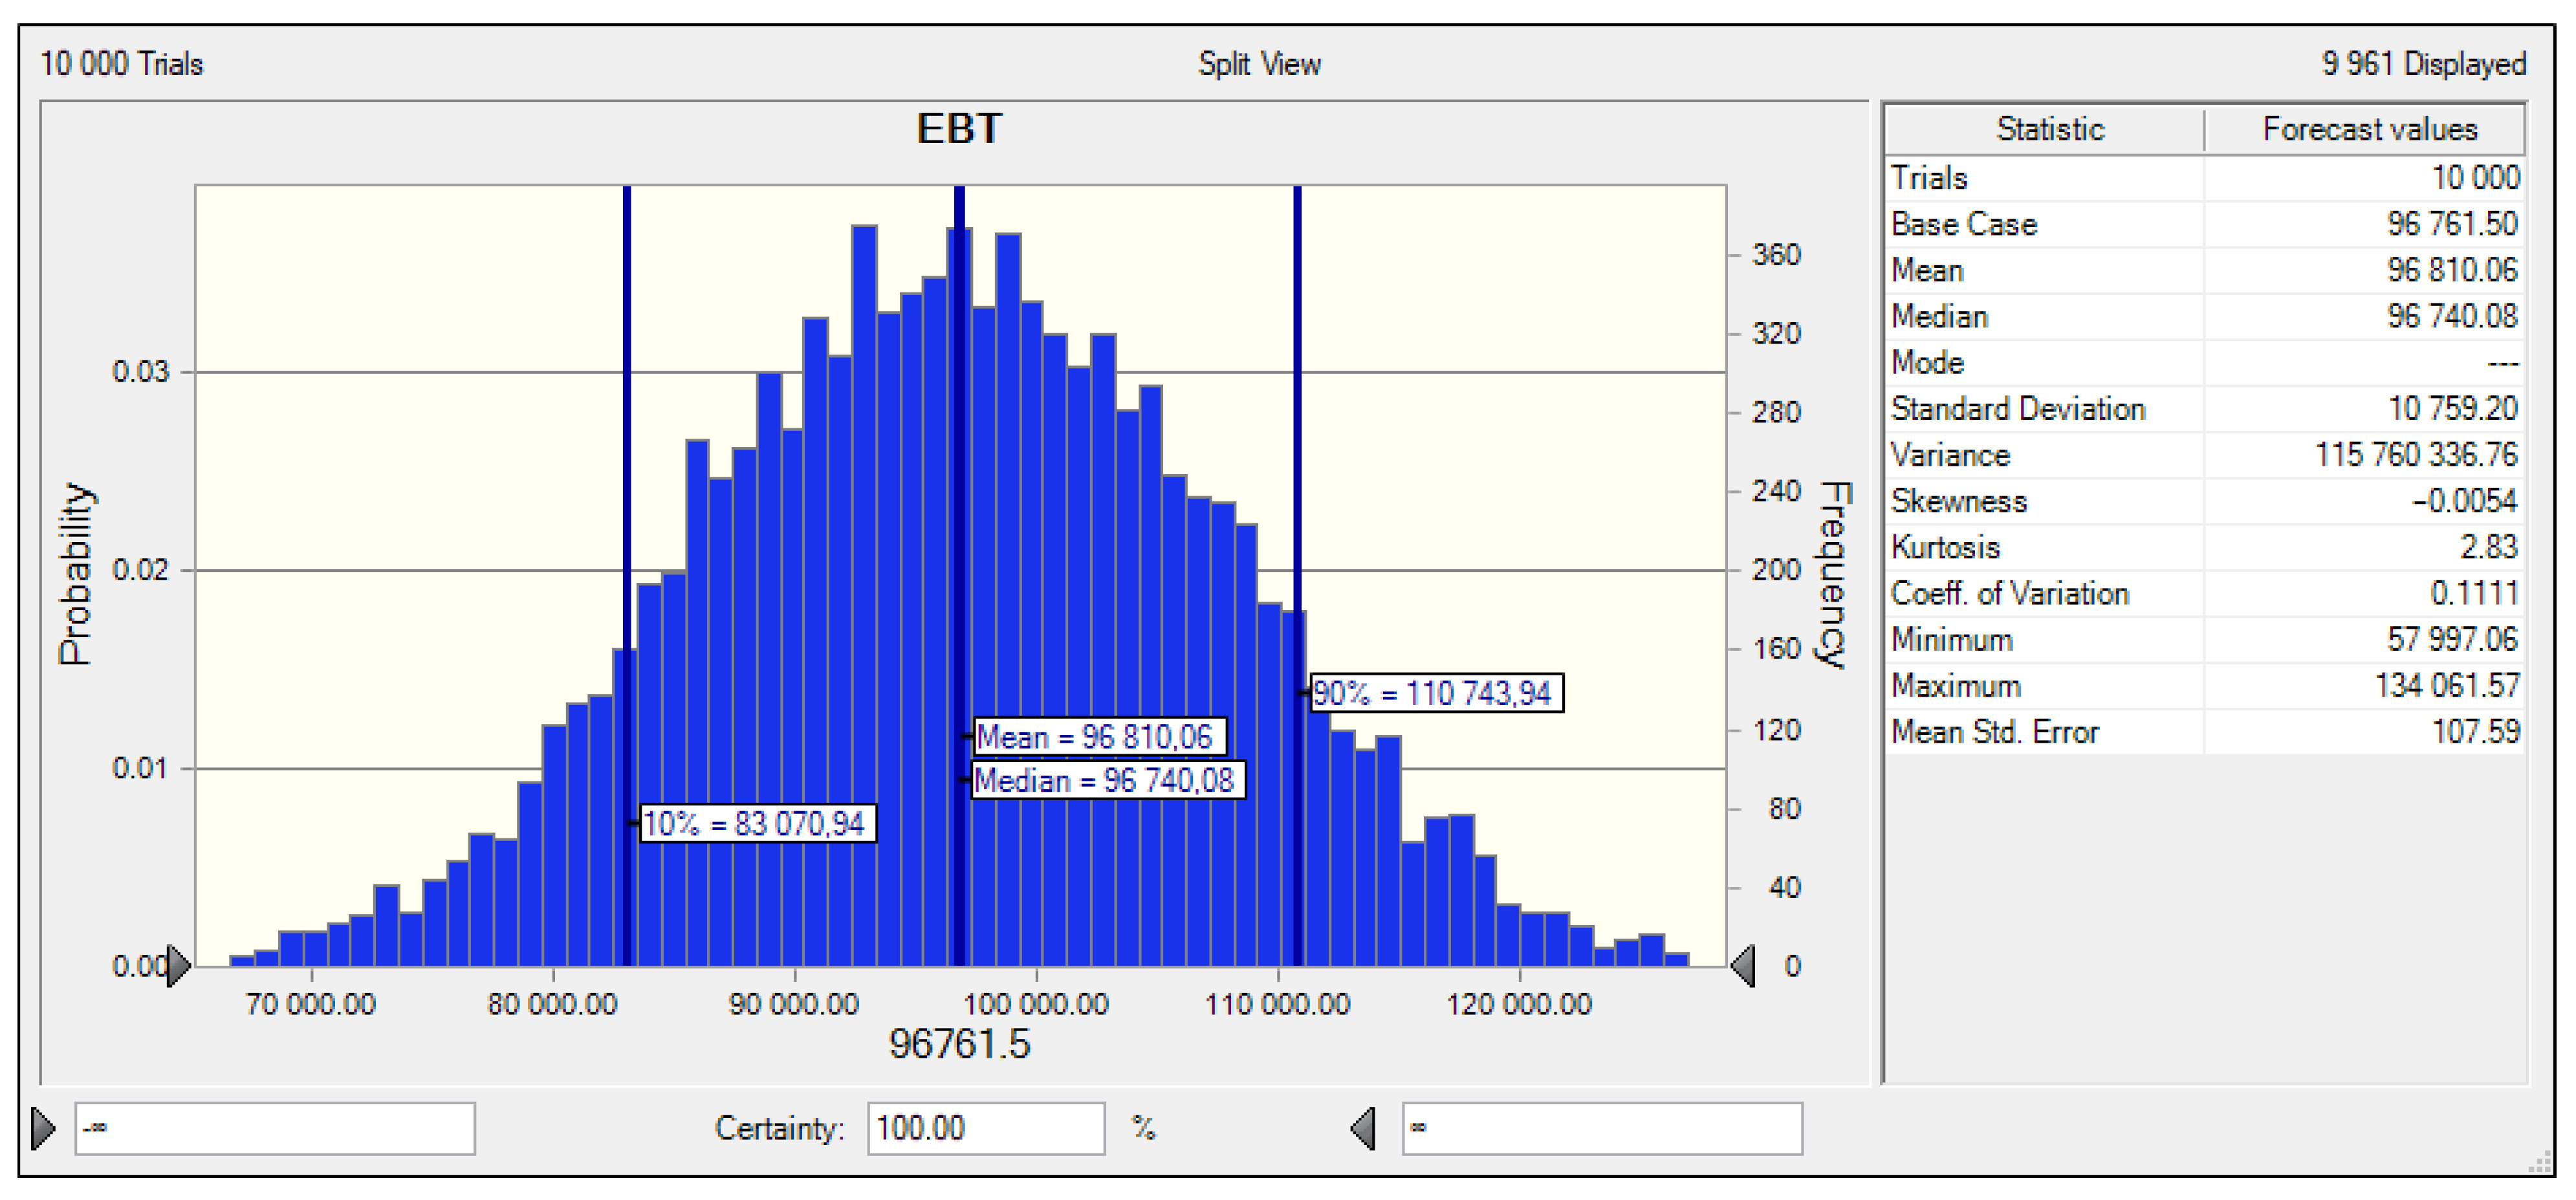
3.3. Monte Carlo Simulation

If the behavior of the model seems “reasonable”, it is possible to proceed to the Monte Carlo simulation itself in the Crystal Ball software environment. Setting the number of simulation steps is important when starting the simulation. For the needs of the simulation in the analyzed company, the number of simulation steps was set to 10,000, which means that a total of 10,000 values were generated within the simulation for each of the risk factors, for which, of course, 10,000 values were also obtained for each criterion quantity.
The primary result of the Monte Carlo simulation is the frequency histogram of the criterion variable and its automatic recalculation—normalization of the probability distribution. This fact enables the calculation of a whole range of statistical data. The main meaning of the number/probability distribution from the point of view of risk analysis is the overall view of the possible values of the criterion quantity and their number/probability. The results of the Monte Carlo simulation and the statistical analysis of the selected company for the A project are shown in Figure 8, and for the B project, in Figure 9.
Both graphs show that the distribution for both projects is symmetrical according to the mean value and the probability. At the same time, it follows from both graphs that in the case of the A project and the B project, the company will achieve a positive value for the criterion value with a 100% probability, i.e., profit.
Another important analysis was obtained using the Monte Carlo simulation: the Monte Carlo sensitivity analyses. It should be noted that although these results are similarly interpreted as per the classic sensitivity analyses mentioned above, the sensitivity analysis using Monte Carlo simulation is based on a completely different principle. This means that individual risk factors are analyzed from the point of view of their contribution to the total variance of the distribution of the criterion quantity. The graphic outputs of these analyses for the A project are shown in Figure 10, and for the B project, in Figure 11.
Crystal Ball calculates the sensitivity by computing the rank correlation coefficients between every assumption and every forecast while the simulation is running. Correlation coefficients provide a meaningful measure of the degree to which assumptions and forecasts change together. If an assumption and a forecast have a high correlation coefficient, it means that the assumption has a significant impact on the forecast (both through its uncertainty and its model sensitivity). Positive coefficients indicate that an increase in the assumption is associated with an increase in the forecast. Negative coefficients imply the opposite situation. The larger the absolute value of the correlation coefficient, the stronger the relationship. It is important to note that the “Contribution To Variance” method is only an approximation and is not precisely a variance decomposition. Crystal Ball calculates Contribution To Variance by squaring the rank correlation coefficients and normalizing them to 100%. Both the alternate “Rank Correlation View” and the Contribution To Variance view display the direction of each assumption’s relationship to the target forecast. Assumptions with a positive relationship have bars on the right side of the zero line; assumptions with a negative relationship have bars on the left side of the zero line [54].
The influence of risk factors on the criterion value described in this way is very illustrative and can be shared mainly by laymen. However, from an analytical point of view, it is necessary to bear in mind that this is a derived and not completely accurate calculation. The principle of this sensitivity analysis is a rank correlation, within which the values of individual risk factors are generated, and the resulting criterion values are calculated. This is a kind of contribution to the variance based on squaring the rank correlation values and normalizing them to 100%. Subsequently, all the generated values are ranked, and the degree of rank correlation between the risk factors and criterion variables is calculated. In this way, the influence of individual risk factors on the criterion value is proven through the correlation value while simultaneously including the influence of all the other variables.
Despite the fact that a problem may arise when comparing both sensitivity analyses, in the case of the A project and the B project, the results are uniform in the identification of the riskiest factors, i.e., the fixed costs and selling price.

4. Discussion

Applying risk analysis to financial and investment decision-making is not easy due to the fundamental differences between deterministic and probabilistic approaches. Important barriers to successful implementation include, above all, the fact that it requires a change in thinking and a change in the traditional, long-established system processes for decision-making, and it is necessary to overcome resistance to changes.
An important limiting factor within sensitivity analysis in a simulation environment is that it analyzes the impact of individual risk factors in isolation, i.e., without including the dependencies between risk factors. Therefore, there is a danger arising from the exclusion of one of the risk factors, which, based on this sensitivity analysis, appears to be insignificant due to the neglect of its influence in connection with another risk factor. However, if we summarize the conclusions from the sensitivity analysis in the simulation environment, whether in the form of a tornado or spider web graph, it is significant mainly because of the following reasons:
  • A certain first visual check of the consistency of the relationships between the risk factors and the criterion value;
  • Evaluation of the significance of individual assumed risk factors in relation to the criterion value and a compilation of a certain possible list of risk factors that are unlikely to be important for further analyses;
  • Detection of the possible nonlinear relationships between risk factors and the criterion value.
The sensitivity analysis is a relatively complex method, which is the result of two influences:
  • The sensitivity of the model—in general, the sensitivity of the criterion quantity is to the risk factor, which results from the relationships defined in the mathematical model, e.g., how the criterion value changes when the value of the risk factor changes by 1%;
  • Uncertainty of risk factor values—possible values the risk factor can reach.
If the sensitivity of the model is high, even small changes in the values of the risk factors will lead to significant changes in the resulting criterion value. On the contrary, if the sensitivity of the model is relatively small, even with larger deviations in the values of the risk factors, significant changes in the criterion value may not occur.
As the sensitivity analysis showed, fixed costs and selling prices can be considered the riskiest factors. The correctness of the methodology was also confirmed by the fact that both sensitivity analyses—classical (in the simulation environment) and sensitivity analysis (in the Monte Carlo method)—demonstrated the significance of the same risk factors for the criterion variable EBT.
The core of the presented methodology is the Monte Carlo method. Monte Carlo simulation requires much more complex analysis than traditional deterministic models. The objective of the verifiability of the methodology was the assessment of the profitability of the projects in the selected company. The probability of project implementation within the given time limit is determined after completing the total number of cycles. The statistical metrics derived from these iterations are useful for determining the resulting decision for the success of the project [55,56]. Monte Carlo simulation involves choosing a statistical distribution representing the risk factor, which, in our case, is the duration of each activity, and then running a large number of iterations, creating the same number of different schedules for the project and calculating its total duration [57].
In order to assess the profitability of the projects, the profit output values and statistical indicators were obtained through Monte Carlo simulation. A comparison of the outputted statistical indicators is presented in Table 2.
The most interesting value is the difference between the mean value and the median, which is given by the skewness of the distribution. The distribution of the B project is skewed to the disadvantage of the company to the left (skewness is negative), i.e., the probability of significant negative profit values is greater than the analogous probability of positive values. In the case of the B project, the difference between the minimum and maximum values generated by the simulation is significant.
When deciding on two projects, the following characteristics were applied:
  • If two projects have the same average value of expected revenues, the project with a lower standard deviation is preferred;
  • If two projects have the same standard deviation, the project with a higher average value of expected revenues is preferred;
  • In each project, a higher mean value and a lower standard deviation are preferred;
  • If the project has a higher mean value and a lower deviation than all the other projects, it is optimal;
  • If the projects have a different mean value and a different deviation, the project with a lower coefficient of variation is preferred.
On the basis of the above-mentioned findings, it can be concluded that the A project is a more advantageous and less risky project for the analyzed company.
Many companies today rely on well-known traditional methods for decision-making processes. However, in order for the decisions of the company’s management to be effective, it is necessary that they take into account individual risks and provide management with information about developments over time. For this reason, it is necessary to imply new approaches not only in decision-making processes but also in the system procedures of individual companies.
In professional contributions, it is possible to find studies dealing with the application of the Monte Carlo method in partial calculations or in the solution of partial problems. Despite the multidisciplinary nature and wide applicability of the Monte Carlo method, there is no study that could provide guidance to companies on how to imply this method in decision-making processes. The research carried out enabled the creation of a methodology that integrates this method into decision-making processes in companies in the transport sector in the territory of the Slovak Republic. At the same time, the article demonstrated the applicability of such an approach in practice. The application of this approach in enterprises in the territory of the Slovak Republic, thus, becomes unique.
However, the methodology is limited by the conditions of the market environment of the companies in the territory of the Slovak Republic. It is primarily about the legislative conditions or the financial and educational possibilities of individual companies. However, with sufficient knowledge of the Monte Carlo method, its wide applicability provides scope for use in other types of businesses as well. However, the feasibility of such an approach needs to be subjected to future research.

5. Conclusions

Our methodology for evaluating investment projects was focused on solving the financing of investment activities in transport companies, where simulations and calculations in the MS Excel software environment were chosen as a tool to achieve this goal. The simulation tool used was the Crystal Ball simulation software, which is based on the Monte Carlo method. As part of the verification of the methodology, two approaches that focused on the analysis and evaluation of financial risks of investment projects were implemented. In order to fulfill the goal of the article, deterministic calculations were used to assess the riskiness of two projects using mathematical apparatus based on the principle of financial mathematics. The resulting ranking was used to assign an uncertainty to activity duration and estimate the probability of a project being completed on time, employing the Monte Carlo simulation approach. The main contribution of this article is the development of an innovative framework that co-ordinates an established qualitative and quantitative risk classification approach with a powerful simulation approach to effectively predict time deviations while executing complex projects under uncertainty [55,56]. The integration of new software tools into investment decisions is represented by the simulations of the Monte Carlo method based on the stochastic approach in the Crystal Ball software environment. The simulation is based on the modeling of the criterion value in the form of profit, taking into account risk factors defined as the distribution functions of input variables. The application of such an approach to managerial decision-making when assessing investment projects is unknown in Slovak companies and thus becomes unique. The uniqueness of the project assessment lies in the integration of various multicriteria approaches. The outputs of the article form part of the research into the VEGA project, which verifies the methodology on a sample of 100 enterprises in the transport sector in the Slovak Republic. The transport industry is an investment-intensive industry, and the question of how to mitigate risks in this sector is currently being discussed intensively. This article presents the verification of the effective assessment of the investment projects of enterprises. The goal is to ensure the sustainability of businesses based on the integration of new approaches to managerial decision-making. The application of probabilistic approaches in financial decision-making is negatively affected, mainly by a lack of the necessary knowledge or the weak support of sophisticated computer methods in the practice of companies. It is, therefore, necessary for companies, in their future research, to focus attention on the education of managers and the use of sophisticated modern tools for managing the risk of business projects. The result of such an effort should be a gradual change in corporate culture that supports expert work with risk. The possibility of applying the procedure in specific Slovak companies can be considered a practical contribution of the article. The proposals presented in the thesis form a system of solutions and are applicable under certain conditions in the practice of other industrial enterprises through the selected selection of individual methods and models by supplementing, replacing, or expanding with other specific characteristics and processes, according to a specific type of industry [52,58]. The basis of this will be the ability of colleges, universities, and scientific and research institutions to transmit the widest possible spectrum of the latest knowledge and findings in the field of risk management, with the aim of creating a platform for business practice for further development in this area. It is possible to state that, even at present, many of the methods that are defined have shortcomings and errors, which are pointed out by several authors dealing with this issue. These shortcomings often limit the application of these models in the practice of the companies themselves [2,3]. Therefore, it is advisable for every expert, evaluator, and risk manager to use not only the results of a risk analysis but to use several methods for such an evaluation at the same time and draw conclusions from their results that will bring them objective, more correct results. The implementation of the methods and models built in this way will enable Slovak companies, as well as other companies in the European region, to create space for the further rationalization and streamlining of business processes, increasing economic efficiency and performance and establishing their own business strategies for the future. At the same time, such methods of risk analysis could be an impetus (mainly for medium-sized enterprises) for the application of not only traditional, already proven methods but also modern researched methods and approaches, which will bring them a new perspective on the field of risk management and the possible complete elimination of risks, from which they will start their business development potential.

Author Contributions

Conceptualization, A.S., A.T. and R.R.; methodology, A.S., A.T. and R.R.; software, A.S., A.T. and R.R.; validation, A.S., A.T. and R.R.; formal analysis, A.S., A.T. and R.R.; investigation, A.S., A.T. and R.R.; resources, A.S., A.T. and R.R.; data curation, A.S., A.T. and R.R.; writing—original draft preparation, A.S., A.T. and R.R.; writing—review and editing, A.S., A.T. and R.R.; visualization, A.S., A.T. and R.R.; supervision, A.S., A.T. and R.R.; project administration, A.S., A.T. and R.R. All authors have read and agreed to the published version of the manuscript.

Funding

This research received no external funding.

Institutional Review Board Statement

Not applicable.

Informed Consent Statement

Not applicable.

Data Availability Statement

Not applicable.

Acknowledgments

The article was solved within the project VEGA, grant number 1/0770/22.

Conflicts of Interest

The authors declare no conflict of interest.

References

  1. Liu, Y.; Failler, P.; Ding, Y. Enterprise financialization and technological innovation: Mechanism and heterogeneity. PLoS ONE 2022, 17, e0275461. [Google Scholar] [CrossRef] [PubMed]
  2. Li, Z.; Yang, C.; Huang, Z. How does the fintech sector react to signals from central bank digital currencies? Finance Res. Lett. 2022, 50, 103308. [Google Scholar] [CrossRef]
  3. Tanaka, H.; Tanaka, C. Sustainable investment strategies and a theoretical approach of multi-stakeholder communities. Green Financ. 2022, 4, 329–346. [Google Scholar] [CrossRef]
  4. Fabianova, J.; Kacmary, P.; Janekova, J. Operative production planning utilising quantitative forecasting and Monte Carlo simulations. Open Eng. 2019, 9, 613–622. [Google Scholar] [CrossRef]
  5. Vochozka, M.; Rowland, Z.; Vrbka, J. Financial analysis of an average transport company in the Czech Republic. Our Sea 2016, 63, 227–236. [Google Scholar] [CrossRef]
  6. Feng, Z. Financial risks from three dimensions and risk identification model of enterprise. Int. J. Manag. Sci. Eng. Manag. 2011, 6, 71–80. [Google Scholar] [CrossRef]
  7. Scholleova, H. Investment Controlling: How to Evaluate Investment Intentions and Manage Company Investments, 1st ed.; Grada: Praha, Czech Republic, 2009. [Google Scholar]
  8. Janekova, J.; Fabianova, J.; Rosova, A. Environmental and economic aspects in decision making of the investment project “wind park”. Pol. J. Manag. Stud. 2016, 13, 90–100. [Google Scholar] [CrossRef]
  9. Smejkal, V.; Rais, K. Řízení rizik ve firmách a jiných organizacích; Grada: Praha, Czech Republic, 2010. [Google Scholar]
  10. Fotr, J.; Souček, I. Podnikatelský Zámer a Investiční Rozhodování; Grada Publishing: Praha, Czech Republic, 2005; 356p. [Google Scholar]
  11. Bartošová, V.; Majerčák, P.; Hrašková, D. Taking Risk into Account in the Evaluation of Economic Efficiency of Investment Projects: Traditional Methods. Procedia Econ. Financ. 2015, 24, 68–75. [Google Scholar] [CrossRef]
  12. Kim, K.-J.; Lee, K.; Ahn, H. Predicting Corporate Financial Sustainability Using Novel Business Analytics. Sustainability 2018, 11, 64. [Google Scholar] [CrossRef] [Green Version]
  13. Nunes, M.; Abreu, A.; Saraiva, C. A Model to Manage Cooperative Project Risks to Create Knowledge and Drive Sustainable Business. Sustainability 2021, 13, 5798. [Google Scholar] [CrossRef]
  14. Larionov, A.; Nezhnikova, E.; Smirnova, E. Risk Assessment Models to Improve Environmental Safety in the Field of the Economy and Organization of Construction: A Case Study of Russia. Sustainability 2021, 13, 13539. [Google Scholar] [CrossRef]
  15. Chapman, C.; Ward, S. Project Risk Management. Processes, Techniques and Insights; John Wiley & Sons: Hoboken, NJ, USA, 1997. [Google Scholar]
  16. Bedford, T.; Cooke, R.M. Probabilistic Risk Analysis: Foundations and Methods; Cambridge University Press: Cambridge, UK, 2001. [Google Scholar]
  17. Value at Risk (VAR). Available online: https://www.risk.net/definition/value-at-risk-var (accessed on 29 December 2022).
  18. Deloach, J.W.; Temple, N. Enterprise-Wide Risk Management: Strategies for Linking Risk & Opportunity; Financial Times Management: London, UK, 2000. [Google Scholar]
  19. Tobisova, A.; Senova, A.; Rozenberg, R. Model for Sustainable Financial Planning and Investment Financing Using Monte Carlo Method. Sustainability 2022, 14, 8785. [Google Scholar] [CrossRef]
  20. Carbone, T.A.; Tippett, D.D. Project Risk Management Using the Project Risk FMEA. Eng. Manag. J. 2004, 16, 28–35. [Google Scholar] [CrossRef]
  21. Qin, H.; Stewart, M.G. Risk perceptions and economic incentives for mitigating windstorm damage to housing. Civ. Eng. Environ. Syst. 2020, 38, 1–19. [Google Scholar] [CrossRef]
  22. Valaskova, K.; Kliestik, T.; Svabova, L.; Adamko, P. Financial Risk Measurement and Prediction Modelling for Sustainable Development of Business Entities Using Regression Analysis. Sustainability 2018, 10, 2144. [Google Scholar] [CrossRef] [Green Version]
  23. Vicig, P. Financial risk measurement with imprecise probabilities. Int. J. Approx. Reason. 2008, 49, 159–174. [Google Scholar] [CrossRef] [Green Version]
  24. Sidorova, E.; Kostyukhin, Y.; Korshunova, L.; Ulyanova, S.; Shinkevich, A.; Ershova, I.; Dyrdonova, A. Forming a Risk Management System Based on the Process Approach in the Conditions of Economic Transformation. Risks 2022, 10, 95. [Google Scholar] [CrossRef]
  25. Bahamid, A.R.; Doh, I.S. A review of risk management process in construction projects of developing countries. IOP Conf. Series: Mater. Sci. Eng. 2017, 271, 012042. [Google Scholar] [CrossRef]
  26. Hertz, D.B.; Thomas, H. Risk Analysis and Its Applications; John Wiley & Sons: Hoboken, NJ, USA, 1983. [Google Scholar]
  27. Berkowitz, J.A. Coherent Framenwork for Stress–Testing. J. Risk 2000, 2, 1–15. [Google Scholar] [CrossRef] [Green Version]
  28. Savvides, S. Risk analysis in investment appraisal. Proj. Apprais. 1994, 9, 3–18. [Google Scholar] [CrossRef]
  29. Razavi, S.; Jakeman, A.; Saltelli, A.; Prieur, C.; Iooss, B.; Borgonovo, E.; Plischke, E.; Piano, S.L.; Iwanaga, T.; Becker, W.; et al. The Future of Sensitivity Analysis: An essential discipline for systems modeling and policy support. Environ. Model. Softw. 2020, 137, 104954. [Google Scholar] [CrossRef]
  30. Pesenti, S.M. Reverse Sensitivity Analysis for Risk Modelling. Risks 2022, 10, 141. [Google Scholar] [CrossRef]
  31. Tsanakas, A.; Millossovich, P. Sensitivity Analysis Using Risk Measures. Risk Anal. 2015, 36, 30–48. [Google Scholar] [CrossRef] [PubMed] [Green Version]
  32. Cont, R.; Deguest, R.; Scandolo, G. Robustness and sensitivity analysis of risk measurement procedures. Quant. Financ. 2010, 10, 593–606. [Google Scholar] [CrossRef]
  33. Borgonovo, E.; Plischke, E. Sensitivity analysis: A review of recent advances. Eur. J. Oper. Res. 2016, 248, 869–887. [Google Scholar] [CrossRef]
  34. Janekova, J.; Fabiánová, J.; Onofrejová, D.; Puškáš, E.; Buša, M. Implementation of Deviation Analysis Method in the Utilisation Phase of the Investment Project: A Case Study. Pol. J. Manag. Stud. 2017, 15, 99–109. [Google Scholar] [CrossRef]
  35. Hammersley, J. Monte Carlo Methods; Springer Science & Business Media: Berlin/Heidelberg, Germany, 2013. [Google Scholar]
  36. Züst, S.; Huonder, M.; West, S.; Stoll, O. Life-Cycle Oriented Risk Assessment Using a Monte Carlo Simulation. Appl. Sci. 2021, 12, 8. [Google Scholar] [CrossRef]
  37. Di Nitto, A.; Davide, F.; Vardaci, E.; Bianco, D.; La Rana, G.; Mercogliano, D. The New Physics in LILITA_N21: An Improved Description of the Reaction 190 MeV 40Ar + 27Al. Appl. Sci. 2022, 12, 4107. [Google Scholar] [CrossRef]
  38. Loffredo, F.; Vardaci, E.; Bianco, D.; Di Nitto, A.; Quarto, M. Protons Interaction with Nomex Target: Secondary Radiation from a Monte Carlo Simulation with Geant4. Appl. Sci. 2022, 12, 2643. [Google Scholar] [CrossRef]
  39. Yang, Y.; Zhuo, W.; Zhao, Y.; Xie, T.; Wang, C.; Liu, H. Estimating Specific Patient Organ Dose for Chest CT Examinations with Monte Carlo Method. Appl. Sci. 2021, 11, 8961. [Google Scholar] [CrossRef]
  40. Kaiser, W.; Popp, J.; Rinderle, M.; Albes, T.; Gagliardi, A. Generalized Kinetic Monte Carlo Framework for Organic Electronics. Algorithms 2018, 11, 37. [Google Scholar] [CrossRef] [Green Version]
  41. Radosz, W.; Pawlik, G.; Mituś, A.C. Characterization of Monte Carlo Dynamic/Kinetic Properties of Local Structure in Bond Fluctuation Model of Polymer System. Materials 2021, 14, 4962. [Google Scholar] [CrossRef] [PubMed]
  42. Pawlik, G.; Mitus, A. Photoinduced Mass Transport in Azo-Polymers in 2D: Monte Carlo Study of Polarization Effects. Materials 2020, 13, 4724. [Google Scholar] [CrossRef] [PubMed]
  43. Lu, Z.; Zhuang, L.; Dong, L.; Liang, X. Model-Based Safety Analysis for the Fly-by-Wire System by Using Monte Carlo Simulation. Processes 2020, 8, 90. [Google Scholar] [CrossRef] [Green Version]
  44. Koroteev, M.; Romanova, E.; Korovin, D.; Shevtsov, V.; Feklin, V.; Nikitin, P.; Makrushin, S.; Bublikov, K.V. Optimization of Food Industry Production Using the Monte Carlo Simulation Method: A Case Study of a Meat Processing Plant. Informatics 2022, 9, 5. [Google Scholar] [CrossRef]
  45. Jones, H.G.; Lee, A.M. Monte Carlo Methods in Heavy Industry. J. Oper. Res. Soc. 1955, 6, 108–116. [Google Scholar] [CrossRef]
  46. Foa, R.; Howard, M. Use of Monte Carlo Simulation for the Public Sector: An Evidence-Based Approach to Scenario Planning. Int. J. Mark. Res. 2006, 48, 27–48. [Google Scholar] [CrossRef]
  47. Zhang, Y. The value of Monte Carlo model-based variance reduction technology in the pricing of financial derivatives. PLoS ONE 2020, 15, e0229737. [Google Scholar] [CrossRef]
  48. Mucha, V.; Páleš, M.; Sakálová, K. Calculation of the Capital Requirement Using the Monte Carlo Simulation for Non-life Insurance. J. Econ. 2016, 64, 878–893. [Google Scholar]
  49. Arenas, D.J.; Lett, L.A.; Klusaritz, H.; Teitelman, A.M. A Monte Carlo simulation approach for estimating the health and economic impact of interventions provided at a student-run clinic. PLoS ONE 2017, 12, e0189718. [Google Scholar] [CrossRef] [PubMed] [Green Version]
  50. Ross, S.M.; Ghamami, S. Efficient Monte Carlo Barrier Option Pricing When the Underlying Security Price Follows a Jump-Diffusion Process. J. Deriv. 2010, 17, 45–52. [Google Scholar] [CrossRef]
  51. Fleming, P.J.; Schaeffer, D.; Simon, B. Efficient Monte-Carlo simulation of a product-form model for a cellular system with dynamic resource sharing. ACM Trans. Model. Comput. Simul. 1995, 5, 3–21. [Google Scholar] [CrossRef]
  52. Liao, G.; Hou, P.; Shen, X.; Albitar, K. The impact of economic policy uncertainty on stock returns: The role of corporate environmental responsibility engagement. Int. J. Financ. Econ. 2020, 26, 4386–4392. [Google Scholar] [CrossRef]
  53. Act, No. 461/2003 Coll. on Social Insurance as Amended, Act No. 580/2004 Coll. on Health Insurance as Amended. Available online: https://www.podnikajte.sk/dan-z-prijmov/sadzby-dane-z-prijmov-fyzickych-pravnickych-osob-2019-2020 (accessed on 13 April 2022).
  54. How Crystal Ball Calculates Sensitivity. Available online: https://docs.oracle.com/cd/E12825_01/epm.111/cb_user/frameset.htm?ch07s04s03.html (accessed on 29 December 2022).
  55. Koulinas, G.K.; Demesouka, O.E.; Sidas, K.A.; Koulouriotis, D.E. A TOPSIS—Risk Matrix and Monte Carlo Expert System for Risk Assessment in Engineering Projects. Sustainability 2021, 13, 11277. [Google Scholar] [CrossRef]
  56. An, J.; Kim, D.-K.; Lee, J.; Joo, S.-K. Least Squares Monte Carlo Simulation-Based Decision-Making Method for Photovoltaic Investment in Korea. Sustainability 2021, 13, 10613. [Google Scholar] [CrossRef]
  57. Rees, M. Business Risk ans Simulation Modelling in Practice Using Excel, VBA and @RISK; John Wiley & Sons Ltd.: Hoboken, NJ, USA, 2015. [Google Scholar]
  58. Kanupriya Indian textile sector, competitiveness, gender and the digital circular economy: A critical perspective. Natl. Account. Rev. 2022, 4, 237–250. [CrossRef]
Figure 1. Products of the analyzed company.
Sustainability 15 01006 g001
Figure 2. The assessment methodology algorithm for the investment decisions [19].
Sustainability 15 01006 g002
Figure 3. Matrix of risk.
Sustainability 15 01006 g003
Figure 4. Tornado graph of the A project.
Sustainability 15 01006 g004
Figure 5. Tornado graph of the B project.
Sustainability 15 01006 g005
Figure 6. Spider chart of the A project.
Sustainability 15 01006 g006
Figure 7. Spider chart of the B project.
Sustainability 15 01006 g007
Figure 8. Probability/numerical distribution of profit for the A project.
Sustainability 15 01006 g008
Figure 9. Probability/numerical distribution of profit for the B project.
Sustainability 15 01006 g009
Figure 10. Profit sensitivity analysis—Monte Carlo Simulation in the A project.
Sustainability 15 01006 g010
Figure 11. Profit sensitivity analysis—Monte Carlo Simulation in the B project.
Sustainability 15 01006 g011
Table 1. Overview of risk analysis methods [16,18,19,20].
Group of Risk Analysis MethodsTypes of Methods
QualitativelyWhat-if method, scenario analyses, failure mode and consequence questionnaires, criticality analyzes (FMEA / FMECA), hazard and operability analysis (HAZOP), human error analysis (HEA), block reliability scheme, fault tree analysis (FTA), event tree analysis (ETA), probability risk analysis and safety assessment (PRA &PSA), survey questionnaires
QuantitativelyStatistical, cost and efficiency analysis, expert systems, analysis of the relative value of risk, sensitivity analyses, Monte Carlo simulations, critical point analysis; reduced standard methods, cost–benefit analysis, the Delphi method
Combined (qualitative and quantitative approaches)Fault tree analysis, the Delphi method, value chain analysis
Qualitative methodologies used in nuclear and chemical processing plantsPreliminary hazard analysis (PHA), hazard and operability analysis (HAZOP), failure mode and consequence analysis (FMEA/FMECA)
Tree techniques used to quantify the probability of occurrence of accidents and other adverse events leading to loss of life or economyFault tree analysis (FTA), event tree analysis (ETA), cause and effect analysis (CCA), fault tree risk management (MORT), organizational safety management by assessment technique (SMORT)
Techniques for a dynamic systemDynamic event logic analytical method (DYLAM), dynamic event tree analytical method (DETAM), Markov model, transition method
Updated (positive) riskMarket research, prospecting, test marketing, research and development, business impact analysis
Downside risk (negative)Approach analysis, fault tree analysis (FTA), failure mode and consequence analysis (FMEA)
BothDependency modeling, swot analysis (strengths, weaknesses, opportunities, threats), tree and event analysis (ETA), business continuity planning, bpest analysis (business, political, economic, social, technological), real option modeling, decision making under conditions of risk and uncertainty, statistical inference, measures of central tendency and dispersion PESTLE (political, economic, social, technological, and legal environment)
Intuitive techniqueGuided discussion (brainstorming)
Inductive technique (What if?)Preliminary hazard analysis (PHA), checklists, human error analysis (HEA), hazard and operability analysis (HAZOP), criticality failure mode and consequence analysis (FMECA)
Deductive method (so how?)Events and fault trees
Table 2. Comparison of the A project and the B project statistics.
StatisticA ProjectB Project
Base Case31,403.0096,761.50
Mean31,402.4996,810.06
Median31,413.2396,740.08
Standard Deviation3573.4010,759.20
Variance12,769,151.90115,760,336.76
Skewness0.0123−0.0054
Kurosis2.792.83
Coefficient of Variability0.11380.1111
Minimum19,183.9357,997.06
Maximum43,339.7139,061.57
Disclaimer/Publisher’s Note: The statements, opinions and data contained in all publications are solely those of the individual author(s) and contributor(s) and not of MDPI and/or the editor(s). MDPI and/or the editor(s) disclaim responsibility for any injury to people or property resulting from any ideas, methods, instructions or products referred to in the content.

