
Investigation into the Water Exit Behavior of a Cavity

1
College of River and Ocean Engineering, Chongqing Jiaotong University, Chongqing 400074, China
2
Power China Kunming Engineering Corporation Limited, Kunming 650051, China
*
Author to whom correspondence should be addressed.
Sustainability 2023, 15(2), 1007; https://doi.org/10.3390/su15021007
Submission received: 13 December 2022
/
Revised: 30 December 2022
/
Accepted: 2 January 2023
/
Published: 5 January 2023
(This article belongs to the Special Issue Sustainable Hydrodynamic Modelling in Offshore and Ocean Engineering)
Abstract
:Launching-type ship lifts are commonly used in navigational mountain rivers to realize river channelization and communicate different water systems. However, the complicated water–gas–solid coupling process incurred during the water exit of cavities beneath a ship chamber can strongly affect the stability of the chamber and even affect the ship lift operation. In this study, the water exit behavior of a generalized cavity model was investigated using an experimental–numerical approach. Both the air pressure and flow patterns during the water exit process were analyzed. The results demonstrate three different types of air pressure process in cavity exits. Based on the results, a series of relationships are proposed to predict the maximum negative pressure incurred in the water exit process. Moreover, a method was developed to determine the optimum ported area of the cavity regarding the absence of additional hydrodynamic loads. Furthermore, a classification system to typify the flow patterns manifesting in the cavity is proposed. It was found that the transition from a slug flow to a drop flow could be determined as a transition coefficient K equal to 1.
1. Introduction
Ship lifts are important navigation structures involved in river channelization and communicating different water systems in inland water transport. Under the conditions of climate change, the hydrological cycle will complicate the conditions of the water level downstream of a ship lift [1,2,3]. Launching-type ship lifts have played a key role in solving the problem of large and rapid variation in the water level of the downstream approach channel, and are widely used in navigational mountain rivers. Several famous ship lifts of this type are the Jinghong ship lift [4,5,6], Goupitan ship lift [7], and Yantan ship lift [8] in China.
The wedge-shaped bottom of the chamber of a launching-type ship lift is usually reinforced by beams to bear hydrodynamic forces incurred during the water exit process [9]. In the case of water exit, negative pressure conditions commonly occur in two ways. On the one hand, the separation of the bottom of beams by water also causes a large amount of negative pressure, resulting in significant additional loads on the chamber. Once the beams have exited the water, severe vibrations of the chamber may occur due to the rapid subduction of negative pressure [10]. In addition, several relevant studies have been performed to investigate the water exit behavior of solids. Here, we cite De Rosis, A. and Tafuni, A. [11], Basic, J. et al. [12], Del Buono, A. et al. [13], Breton, Thibaut et al. [14], Korobkin, A. A. et al. [15], Greenhow and Martin [16], and Rajavaheinthan and Greenhow [17]. On the other hand, negative pressure conditions can occur in the cavities enclosed by the surrounding webs, the chamber bottom, and water body, resulting in additional tension on the lift’s cables. Moreover, air entrainment occurs immediately after the chamber is raised above the still water, causing disturbances and vibrations of the chamber, and even disturbing the ship lift operation. In contrast, the study of the water exit behavior of cavities has so far received less attention. In addition, the influence of negative cavity conditions on the chamber can be decreased or eliminated by equipping these webs with a series of port openings. Increasing the ported area on the webs will decrease the strength and stiffness of the chamber. Therefore, the quantification of the optimum ported area is essential for engineering practice.
In this study, experimental testing and numerical calculations were carried out to investigate the water exit behavior of a cavity. Both the air pressure and flow patterns during the water exit process were analyzed. The main objectives were to predict the maximum negative pressure incurred during the water exit process and to determine the optimum ranges of the ported area in order to avoid negative pressure conditions in the cavity.
2. Methods
2.1. Physical Model
Considering that the spacing of the ship chamber along the longitudinal beam is unchanged, a cavity enclosed by the main longitudinal beam of the ship chamber and the adjacent beams can be used for water exit behavior investigation. A schematic of the experiments is shown in Figure 1. The shape parameters of the cavity were selected by referring to those of the Jinghong ship lift [4,5,6] and Yantan ship lift [8] in China. If the design tested is considered to be a scale model, the scale is 1:15 and the model and prototype cavities are related by Froudian similitude. The lift of the cavity was driven by a steeper motor. Using the motor, the cavity can be raised at a constant speed v. The side wall of the cavity was equipped with a circle air entrance with a diameter of D, through which the air can flow into the cavity during the water exit process.
In this study, the water exit behavior was governed by three relevant parameters: water exit height h, water exit velocity v, and air entrance diameter D. Overall, 147 experiments were carried out by combining these three parameters. The air pressure in the cavity was measured using a pressure sensor embedded in the upper wall of the cavity with an accuracy of 10 Pa. The flow patterns during the water exit process were recorded using a digital camera at 100 fps.
2.2. Numerical Calculation
Herein, an approximation method was proposed for simulating the temporary variation of air pressure in cavity during the water exit process. Regarding the air flowing through the air entrance, the Bernoulli equation can be written as [18].
where p2 is the air pressure in the cavity, whereas pa is the atmospheric pressure; ρa is the air density; and ξ is the local resistance efficient. Therefore, the following equations can be obtained by
where qa is discharge. The calculation steps are (a) calculate the air pressure reduction in the cavity in a narrow time interval Δt from a specified lift velocity v; (b) compute the volume of air entrainment from the atmosphere in Δt according to Equation (2); (c) update the air pressure in the cavity. Steps (a)–(c) were repeated until the bottom of the cavity was at the still water level.
Here, the experimental data were used to validate the proposed numerical solution. Comparisons of calculated and measured air pressure profiles are shown in Figure 2. It can be seen from this figure that the agreement was good; the entire air pressure process in the cavity during the water exit was reproduced with good accuracy regarding the maximum negative pressure. Therefore, the numerical method could satisfactorily reproduce the key features of air pressure in the cavity. In the subsequent result analyses in this paper, the parameters are provided in full-scale values unless otherwise stated. The maximum negative pressure was primarily governed by the water exit height h, water exit velocity v, and air entrance diameter D. Overall, 714 simulations were performed by combining these three parameters with 0 ≤ D ≤ 1.1 m, 0.0167 ≤ v ≤ 0.2 m/s, and 5.24 ≤ h ≤ 6.42 m.
3. Results and Discussion
3.1. Air Pressure in Cavity before Water Exit
3.1.1. Pressure Type
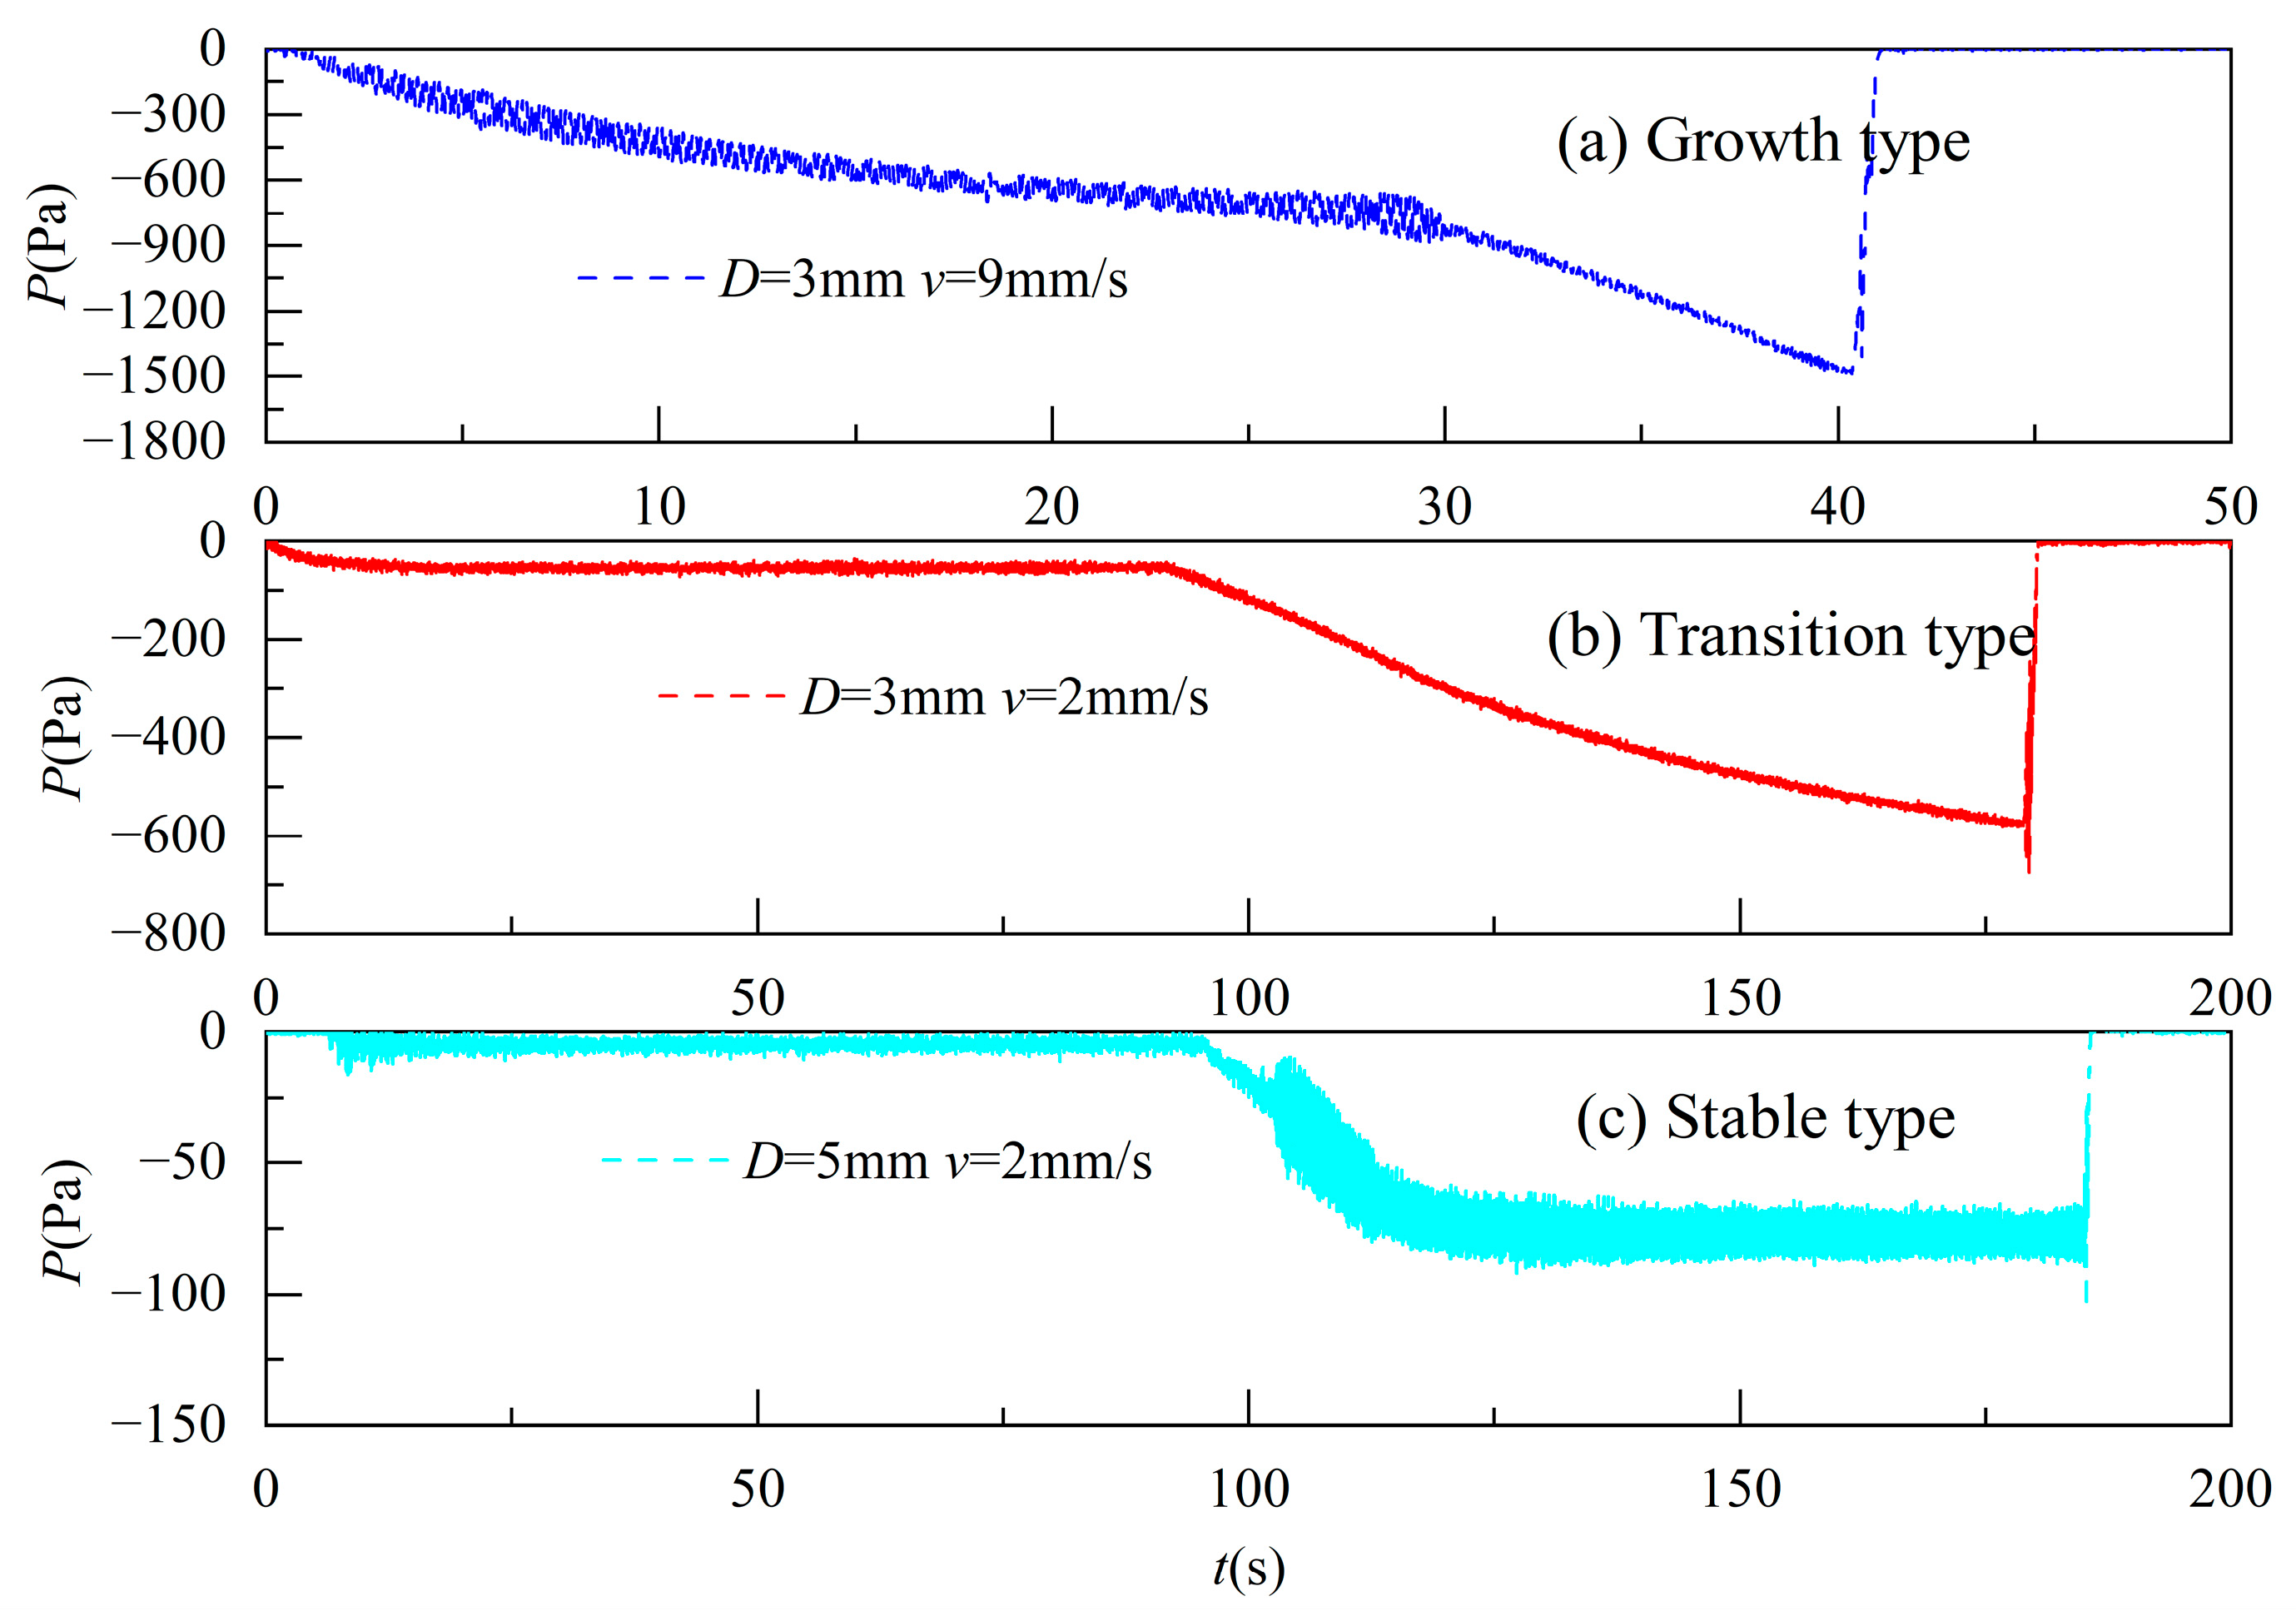
Three different types of air pressure in the cavity during the water exit process were recognized and defined:
- (1)
- Growth type. The air pressure in the cavity exhibited an increasing trend throughout the entire water exit process, with a relatively small increasing rate at its initial stage, as indicated in Figure 3a.
- (2)
- Transition type. This type is illustrated in Figure 3b. The air pressure in the cavity showed an increasing trend after the lifting of the beam and subsequently reached a stable process with an almost constant pressure. After that, the pressure increased again until the end of the water exit process.
- (3)
- Stable type. This type is illustrated in Figure 3c. The pressure exhibited similar behavior to that seen in the transition type earlier in the water exit process. In contrast, it underwent another stable process before the end of the water exit process.
Figure 3.
Air pressure type classification.
3.1.2. Maximum Negative Pressure
The maximum negative pressure during the water exit process was further analyzed using the proposed numerical model in Section 2.2. Based on the experimental results, two main dimensionless parameters governing the water exit process were selected and combined to investigate the maximum negative pressure characteristics: relative lifting velocity v/(gh)0.5 and relative ported area Ae/Ac. The details of the numerical simulations are presented in Figure 4.
The numerical results indicated that four zones can be identified in Figure 4; namely, S1, S2, S3, and S4. The S1 zone was characterized by Ae/Ac = 0. In this zone, the maximum negative pressure was solely dependent on the initial submerged water depth, and can be described by the following equation (r2 = 0.99):
The maximum negative pressure located in the S2 zone if the relative lifting velocity was v/(gh)0.5, fulfilled the following relationship: y > 10.058x. In zone S2, the maximum negative pressure occurred under the condition where a stable pressure process shortly before the end of the water exit could not be reached. The maximum negative pressure in zone S2 can be determined by (r2 = 0.98)
The S3 zone was determined by
In this zone, the maximum negative pressure occurred through a stable pressure process shortly before the end of the water exit and can be expressed as (r2 = 0.99)
Zone S4 was observed if the relative lifting velocity v/(gh)0.5 satisfied the empirical relationship:
In this zone, the maximum negative pressure was close to 0.
In the design of a ship lift chamber, the smaller the ported area in the chamber, the larger the strength and stiffness. However, the chamber might be subjected to significant additional hydrodynamic loads if a relatively small ported area is equipped in the chamber. A proper ported area resulted from a relative balance of these two conditions. The present results reveal that if the strength and stiffness of the ship lift chamber is large enough, the optimum ported area can be determined using Equation (7) to eliminate additional hydrodynamic loads in the water exit process.
3.2. Hydraulic Characteristics inside the Cavity at Water Exit
A significant difference in the water levels inside and outside the cavity existed if the ported area in the chamber was not large enough. In this context, air entrainment occurred owing to the presence of negative pressure in the cavity. Based on the experimental observations, a classification system typifying the flow patterns manifested in the cavity is described herein:
- (1)
- Slug flow. A photo sequence of this flow type is shown in Figure 5. Sudden bursts of air were periodically sucked in from the corner of the cavity. The entrained air formed a slug of air that propagated across the continuous water phase or a mix of water–air. The original volume of the entrained air bubble was occupied by water immediately after its runout, resulting in significant fluctuations in air pressure.
- (2)
Figure 5.
Slug flow pattern.
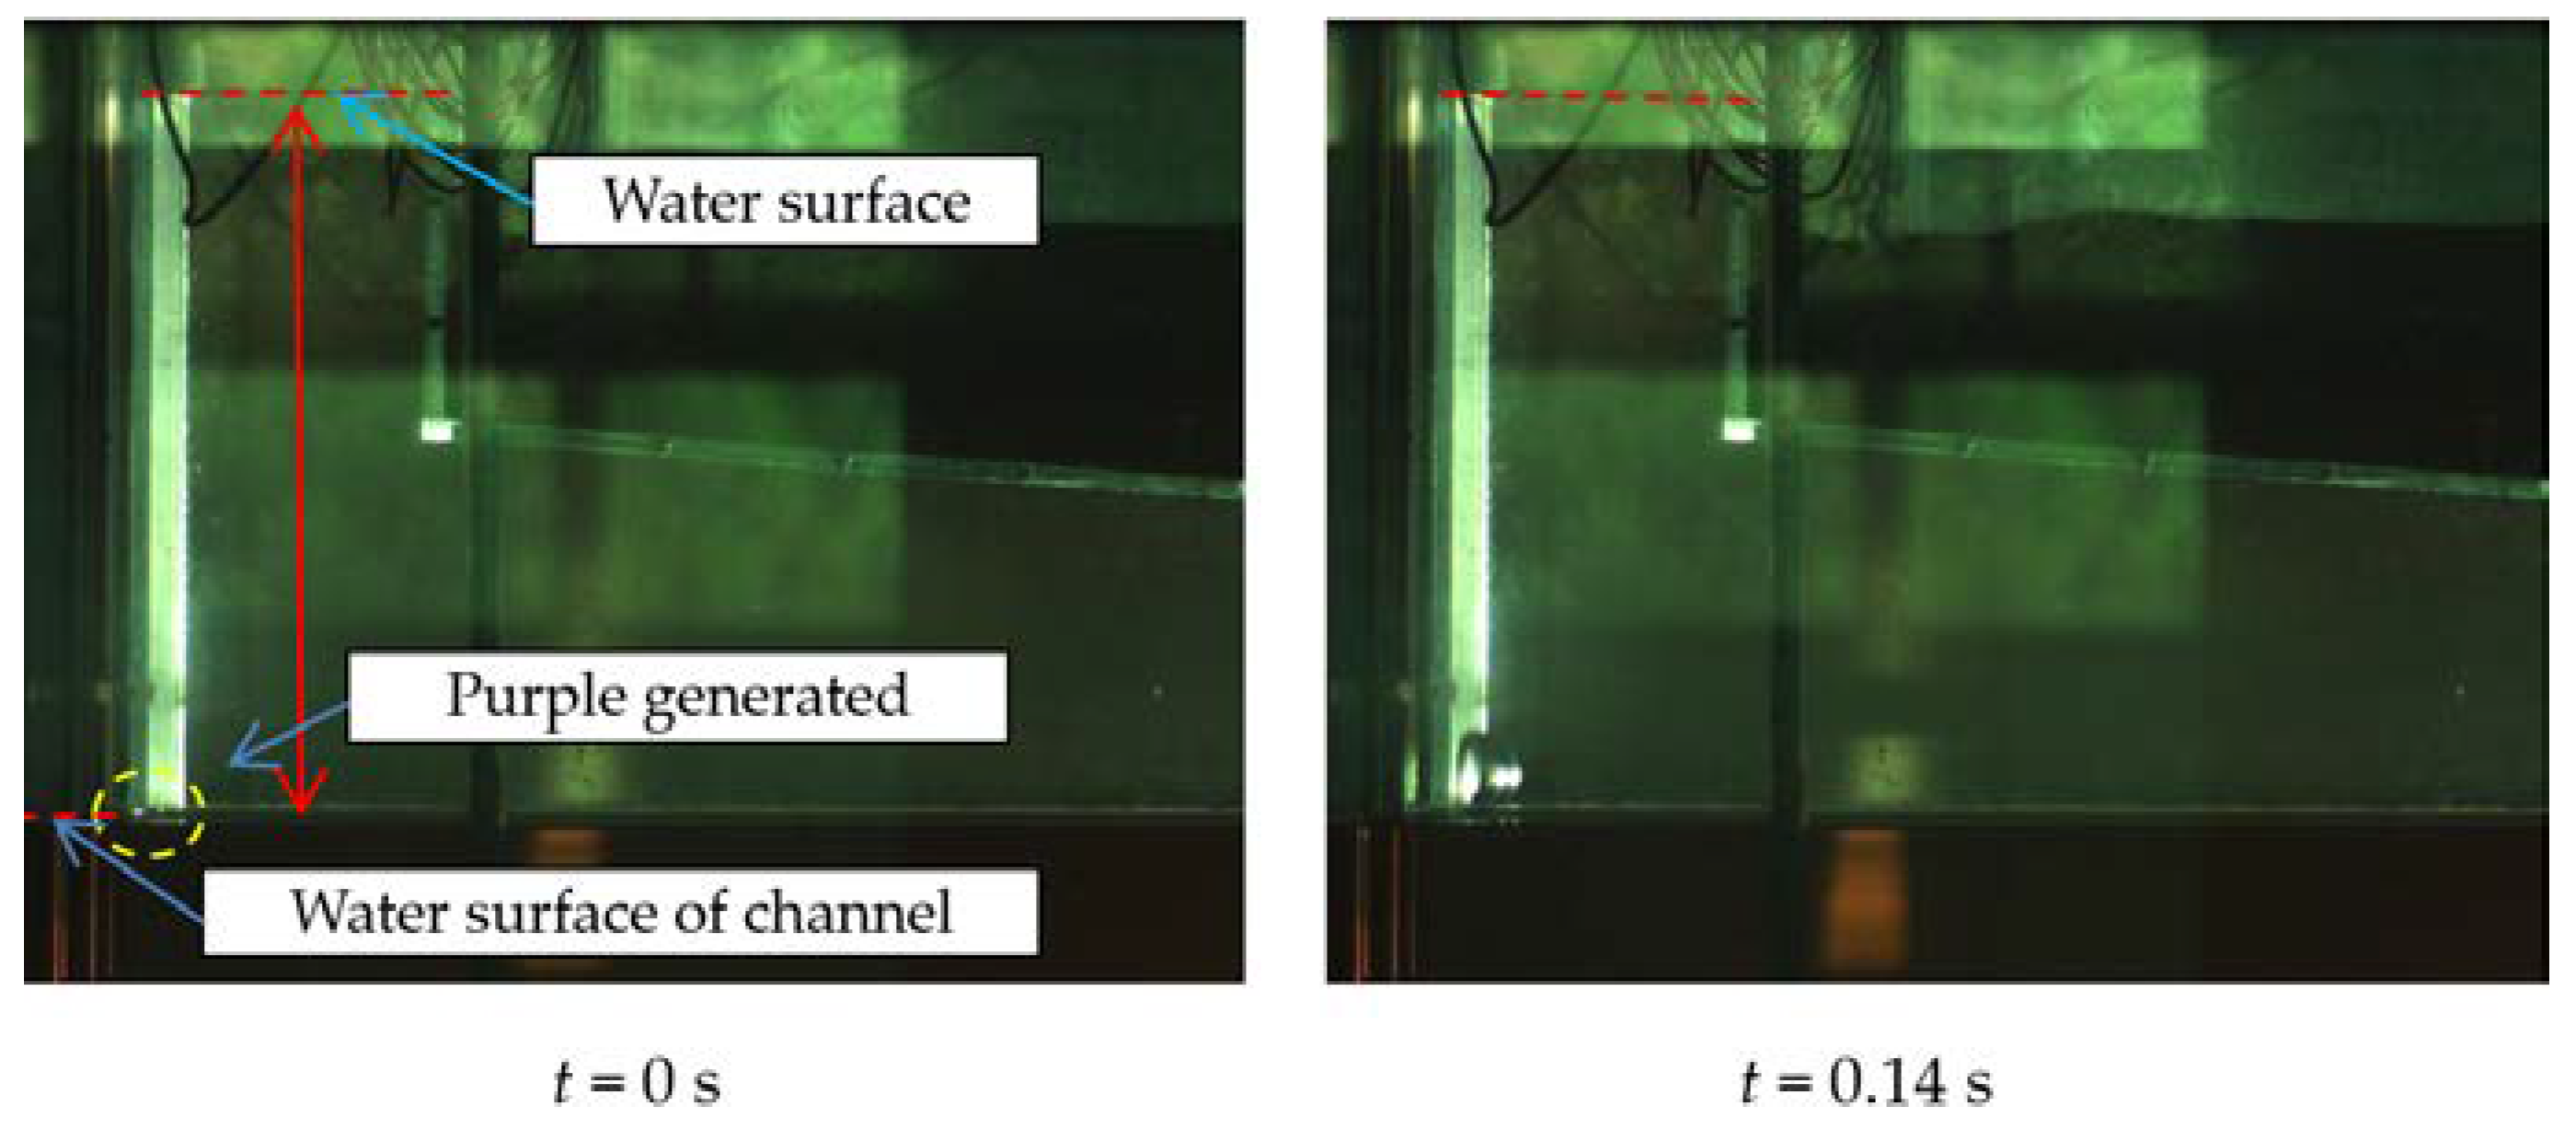
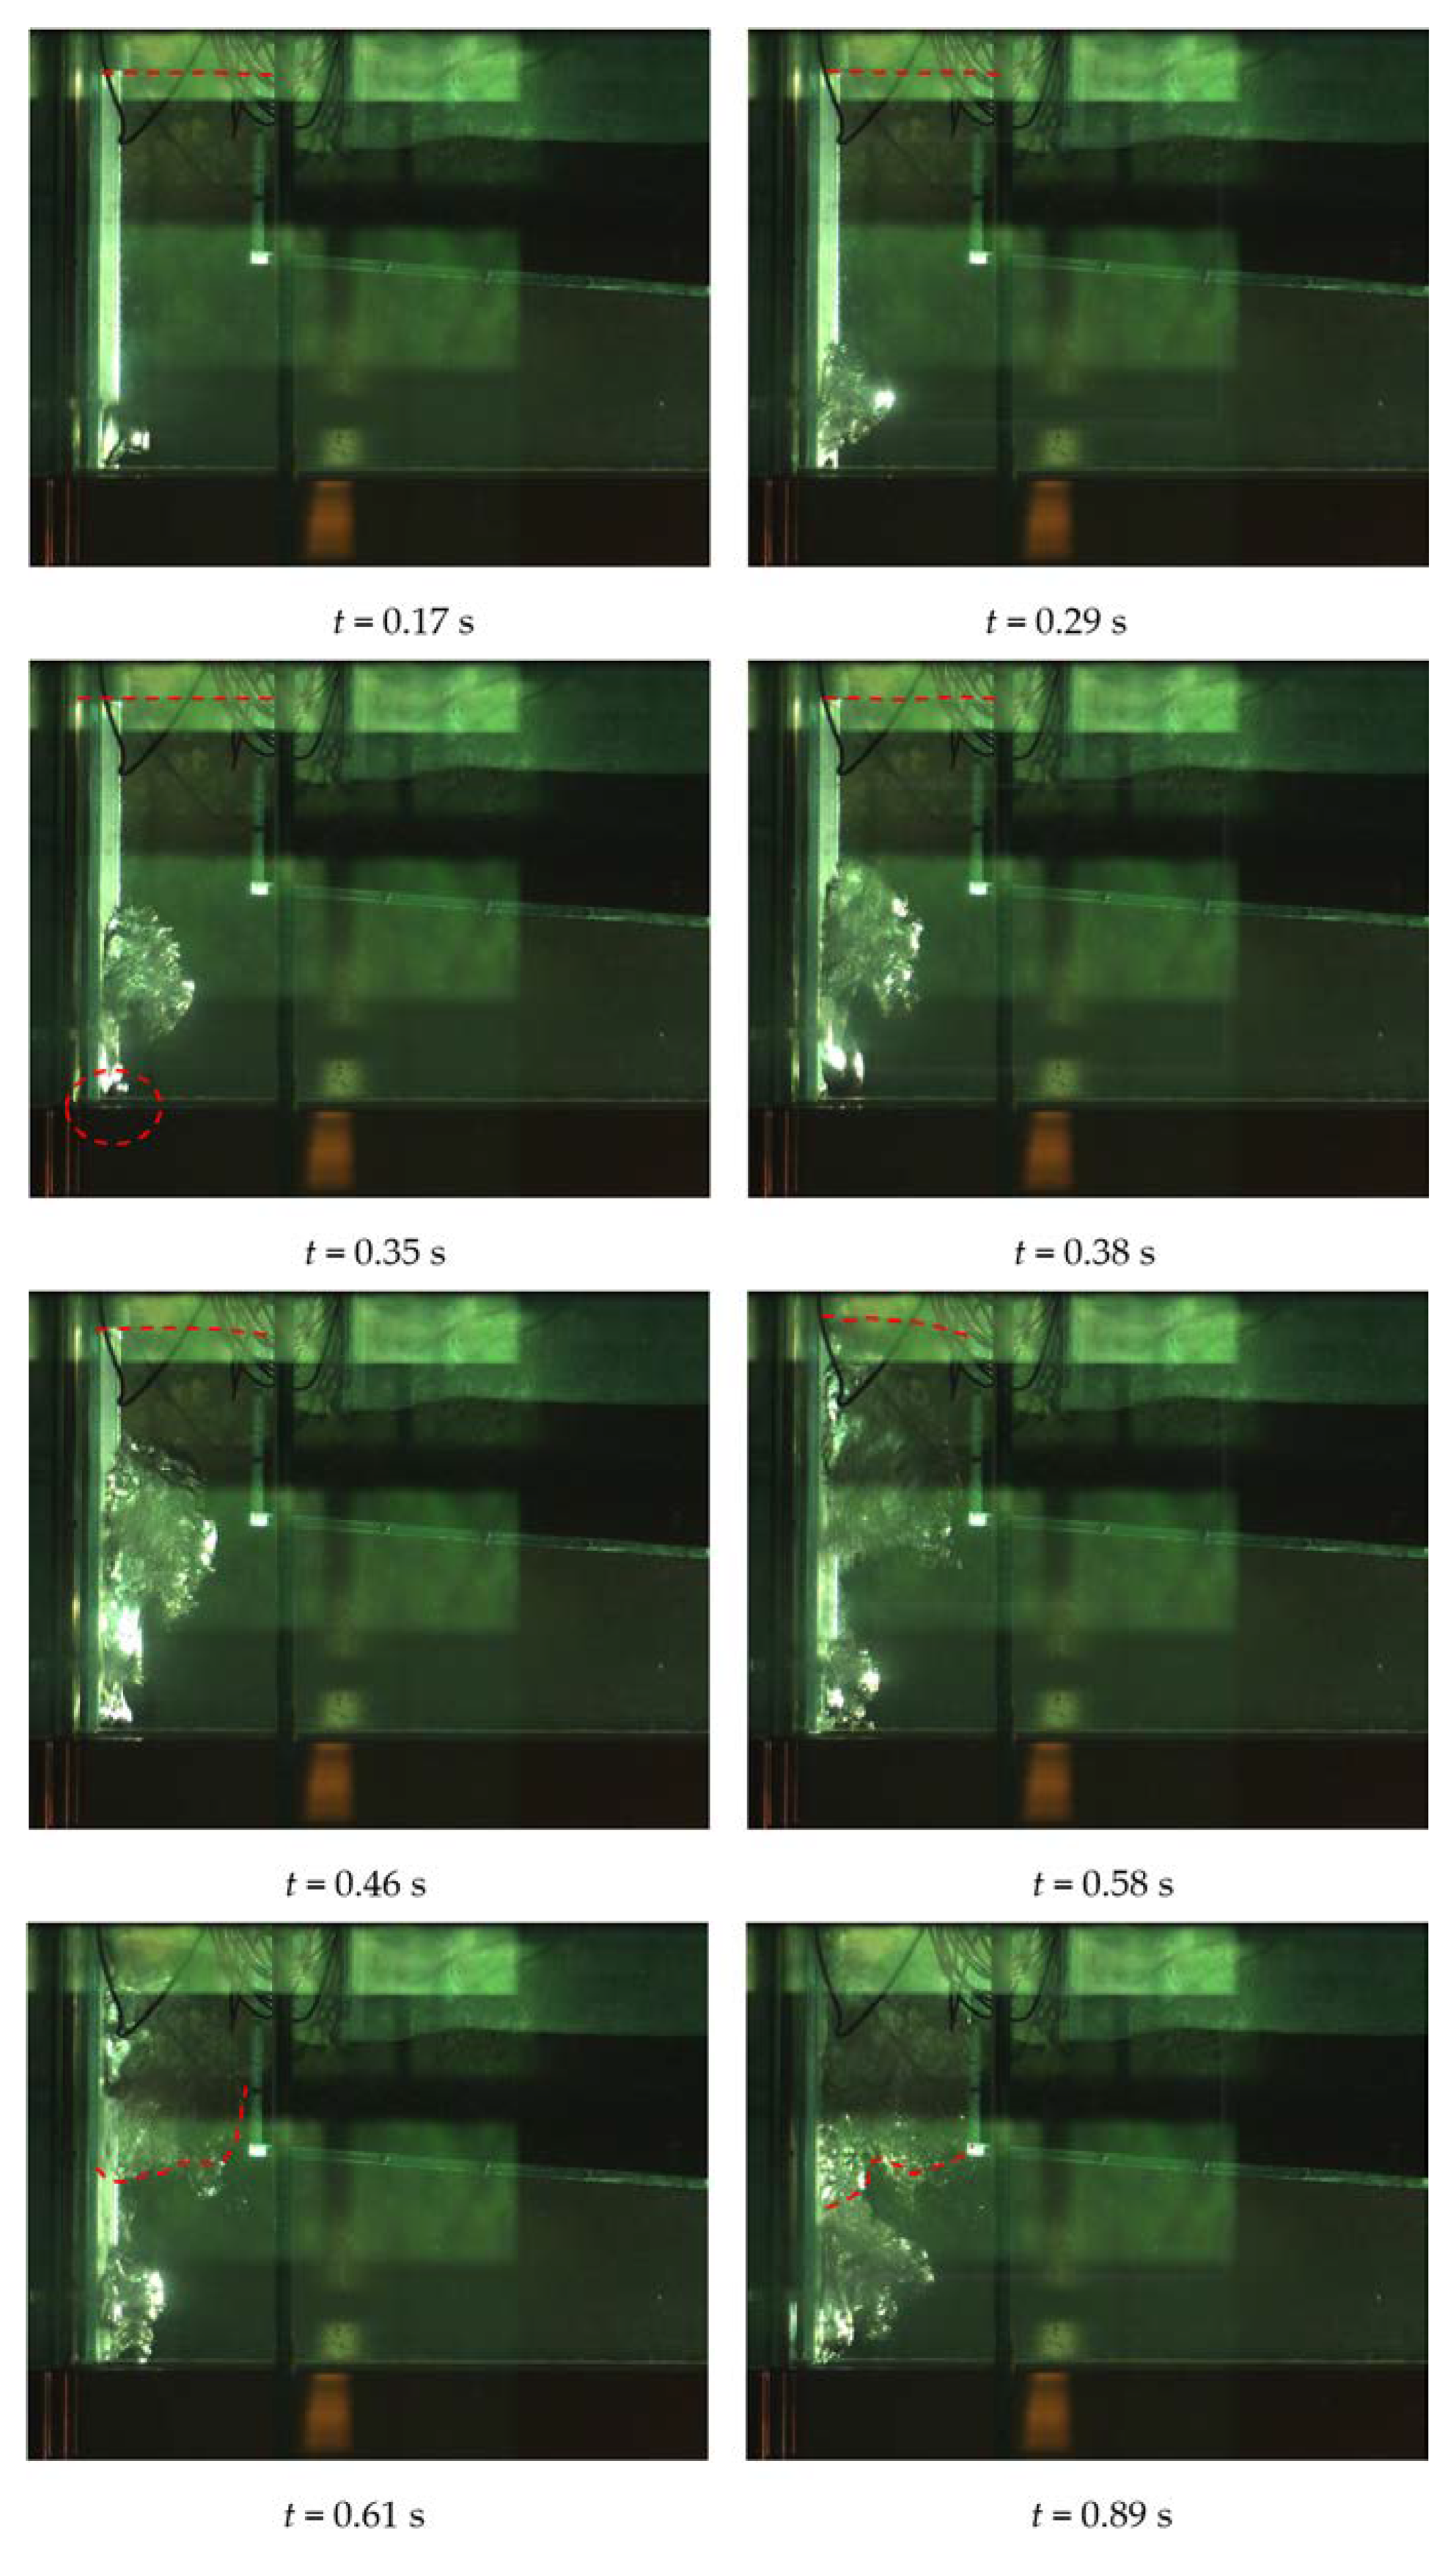
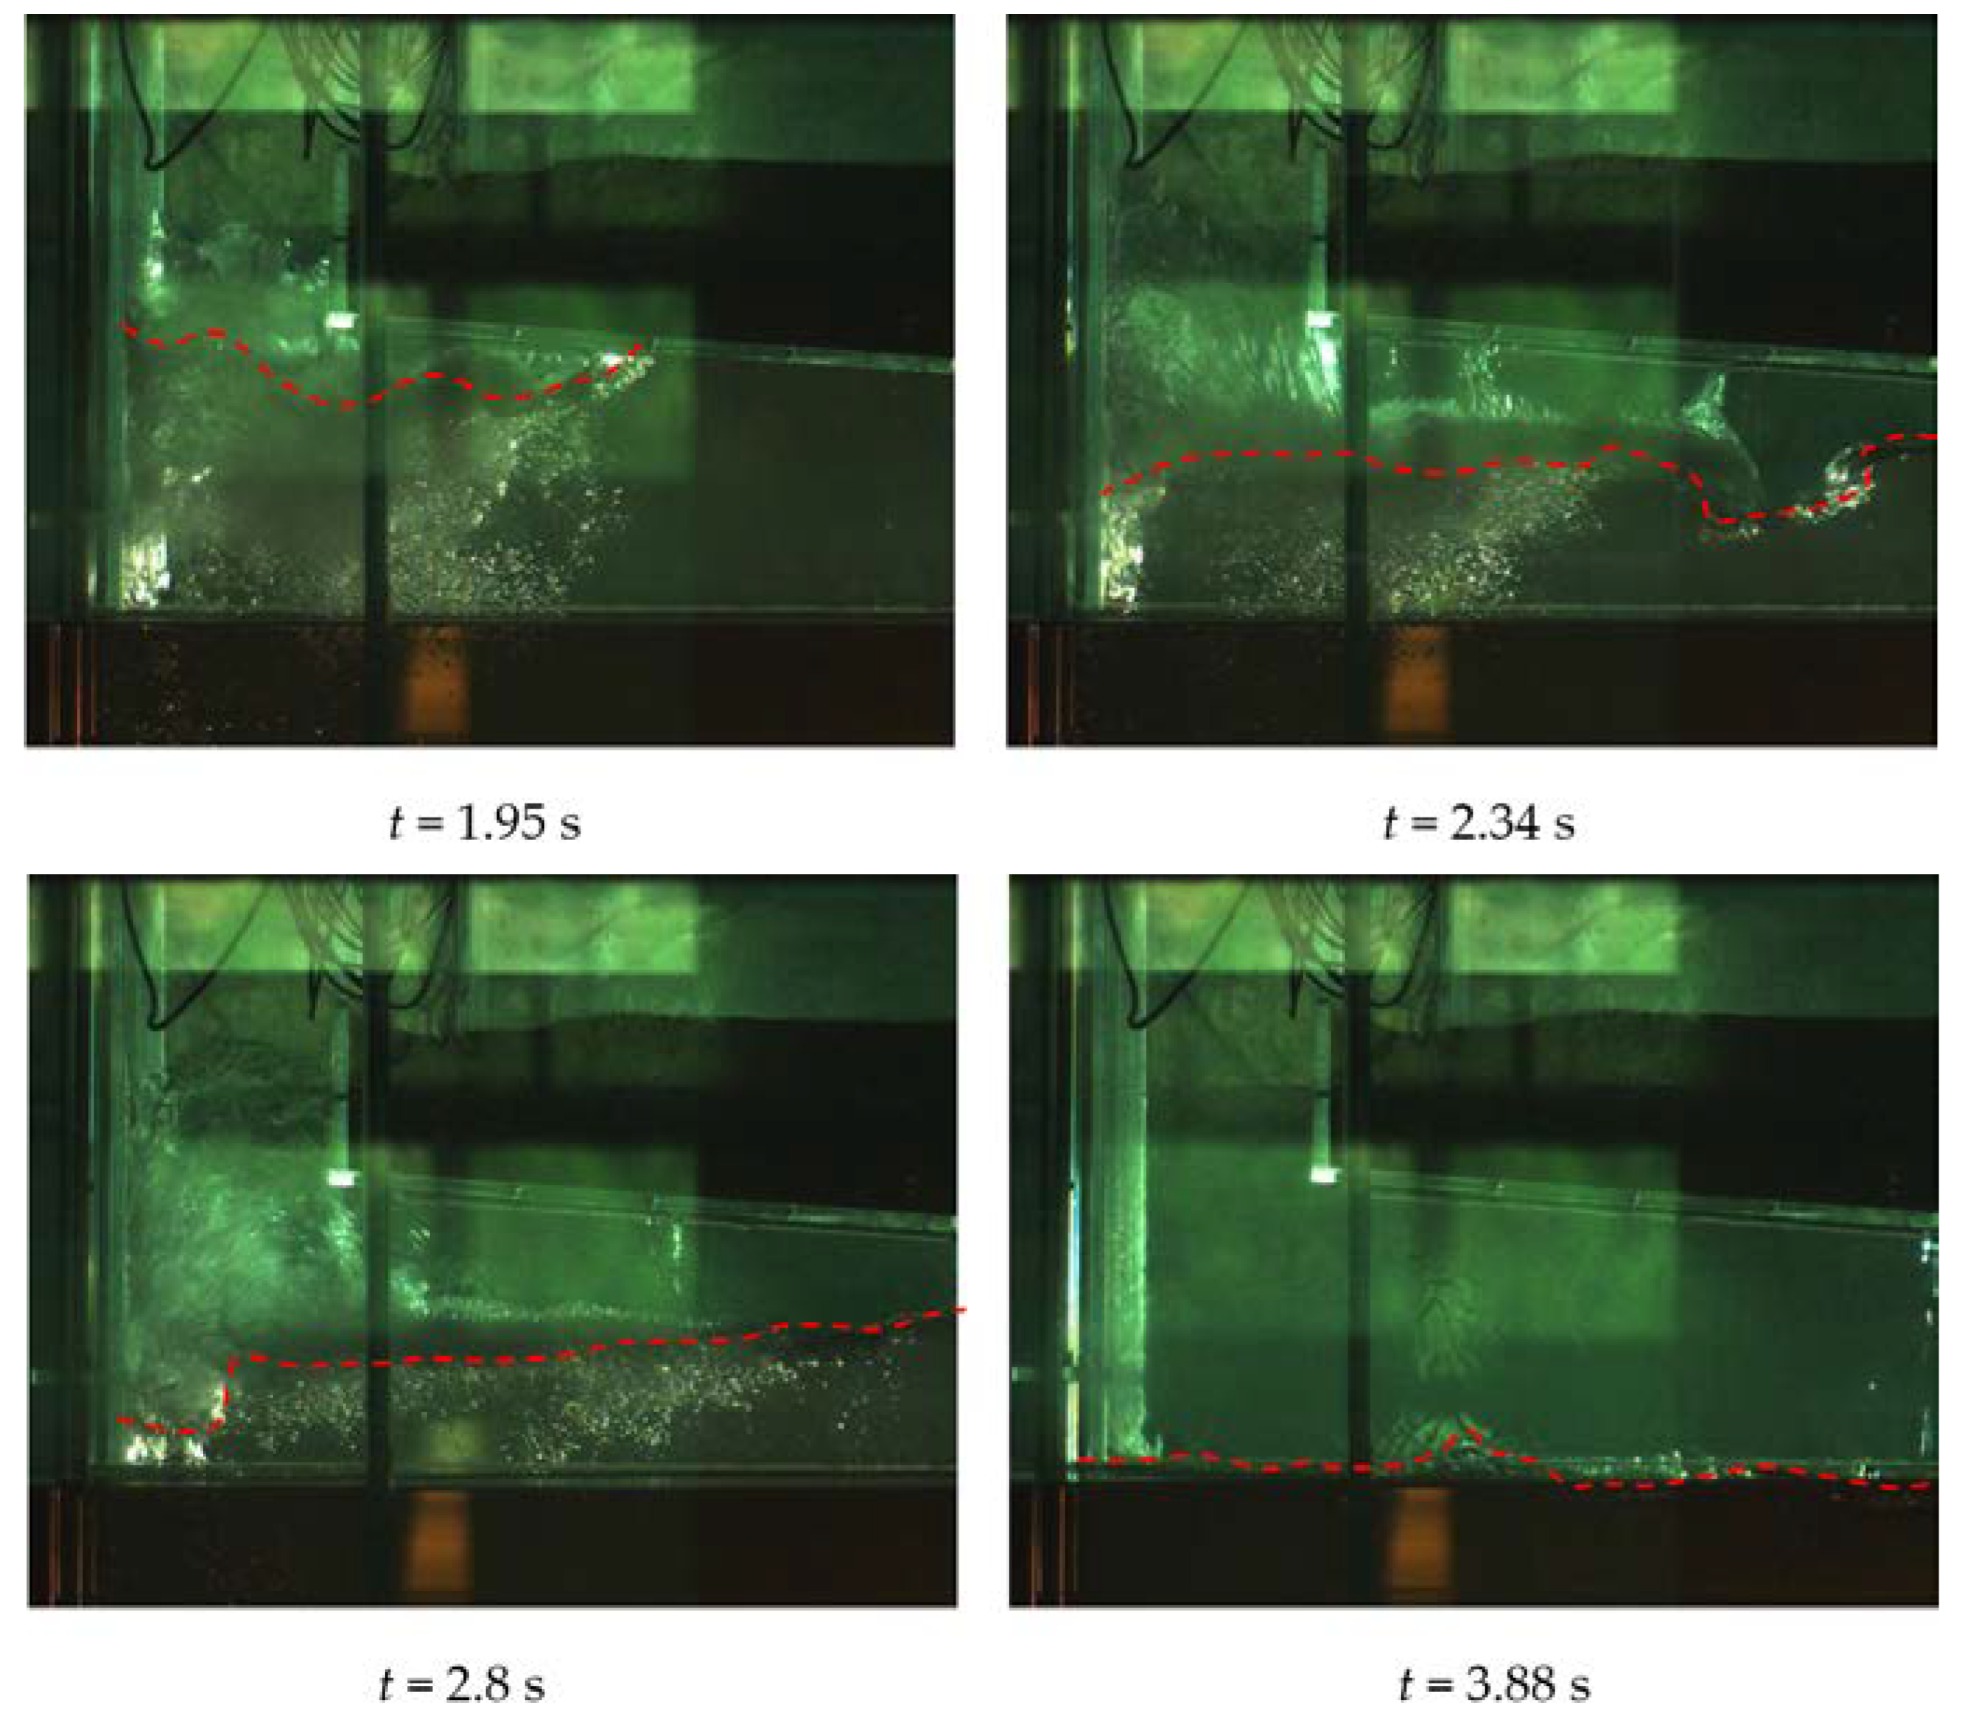
Figure 6.
Drop flow pattern.

Figure 7.
Air pressure profiles for different flow patterns: (a) slug flow for K = 5.33; (b) drop flow for K = 0.39.
Figure 7.
Air pressure profiles for different flow patterns: (a) slug flow for K = 5.33; (b) drop flow for K = 0.39.
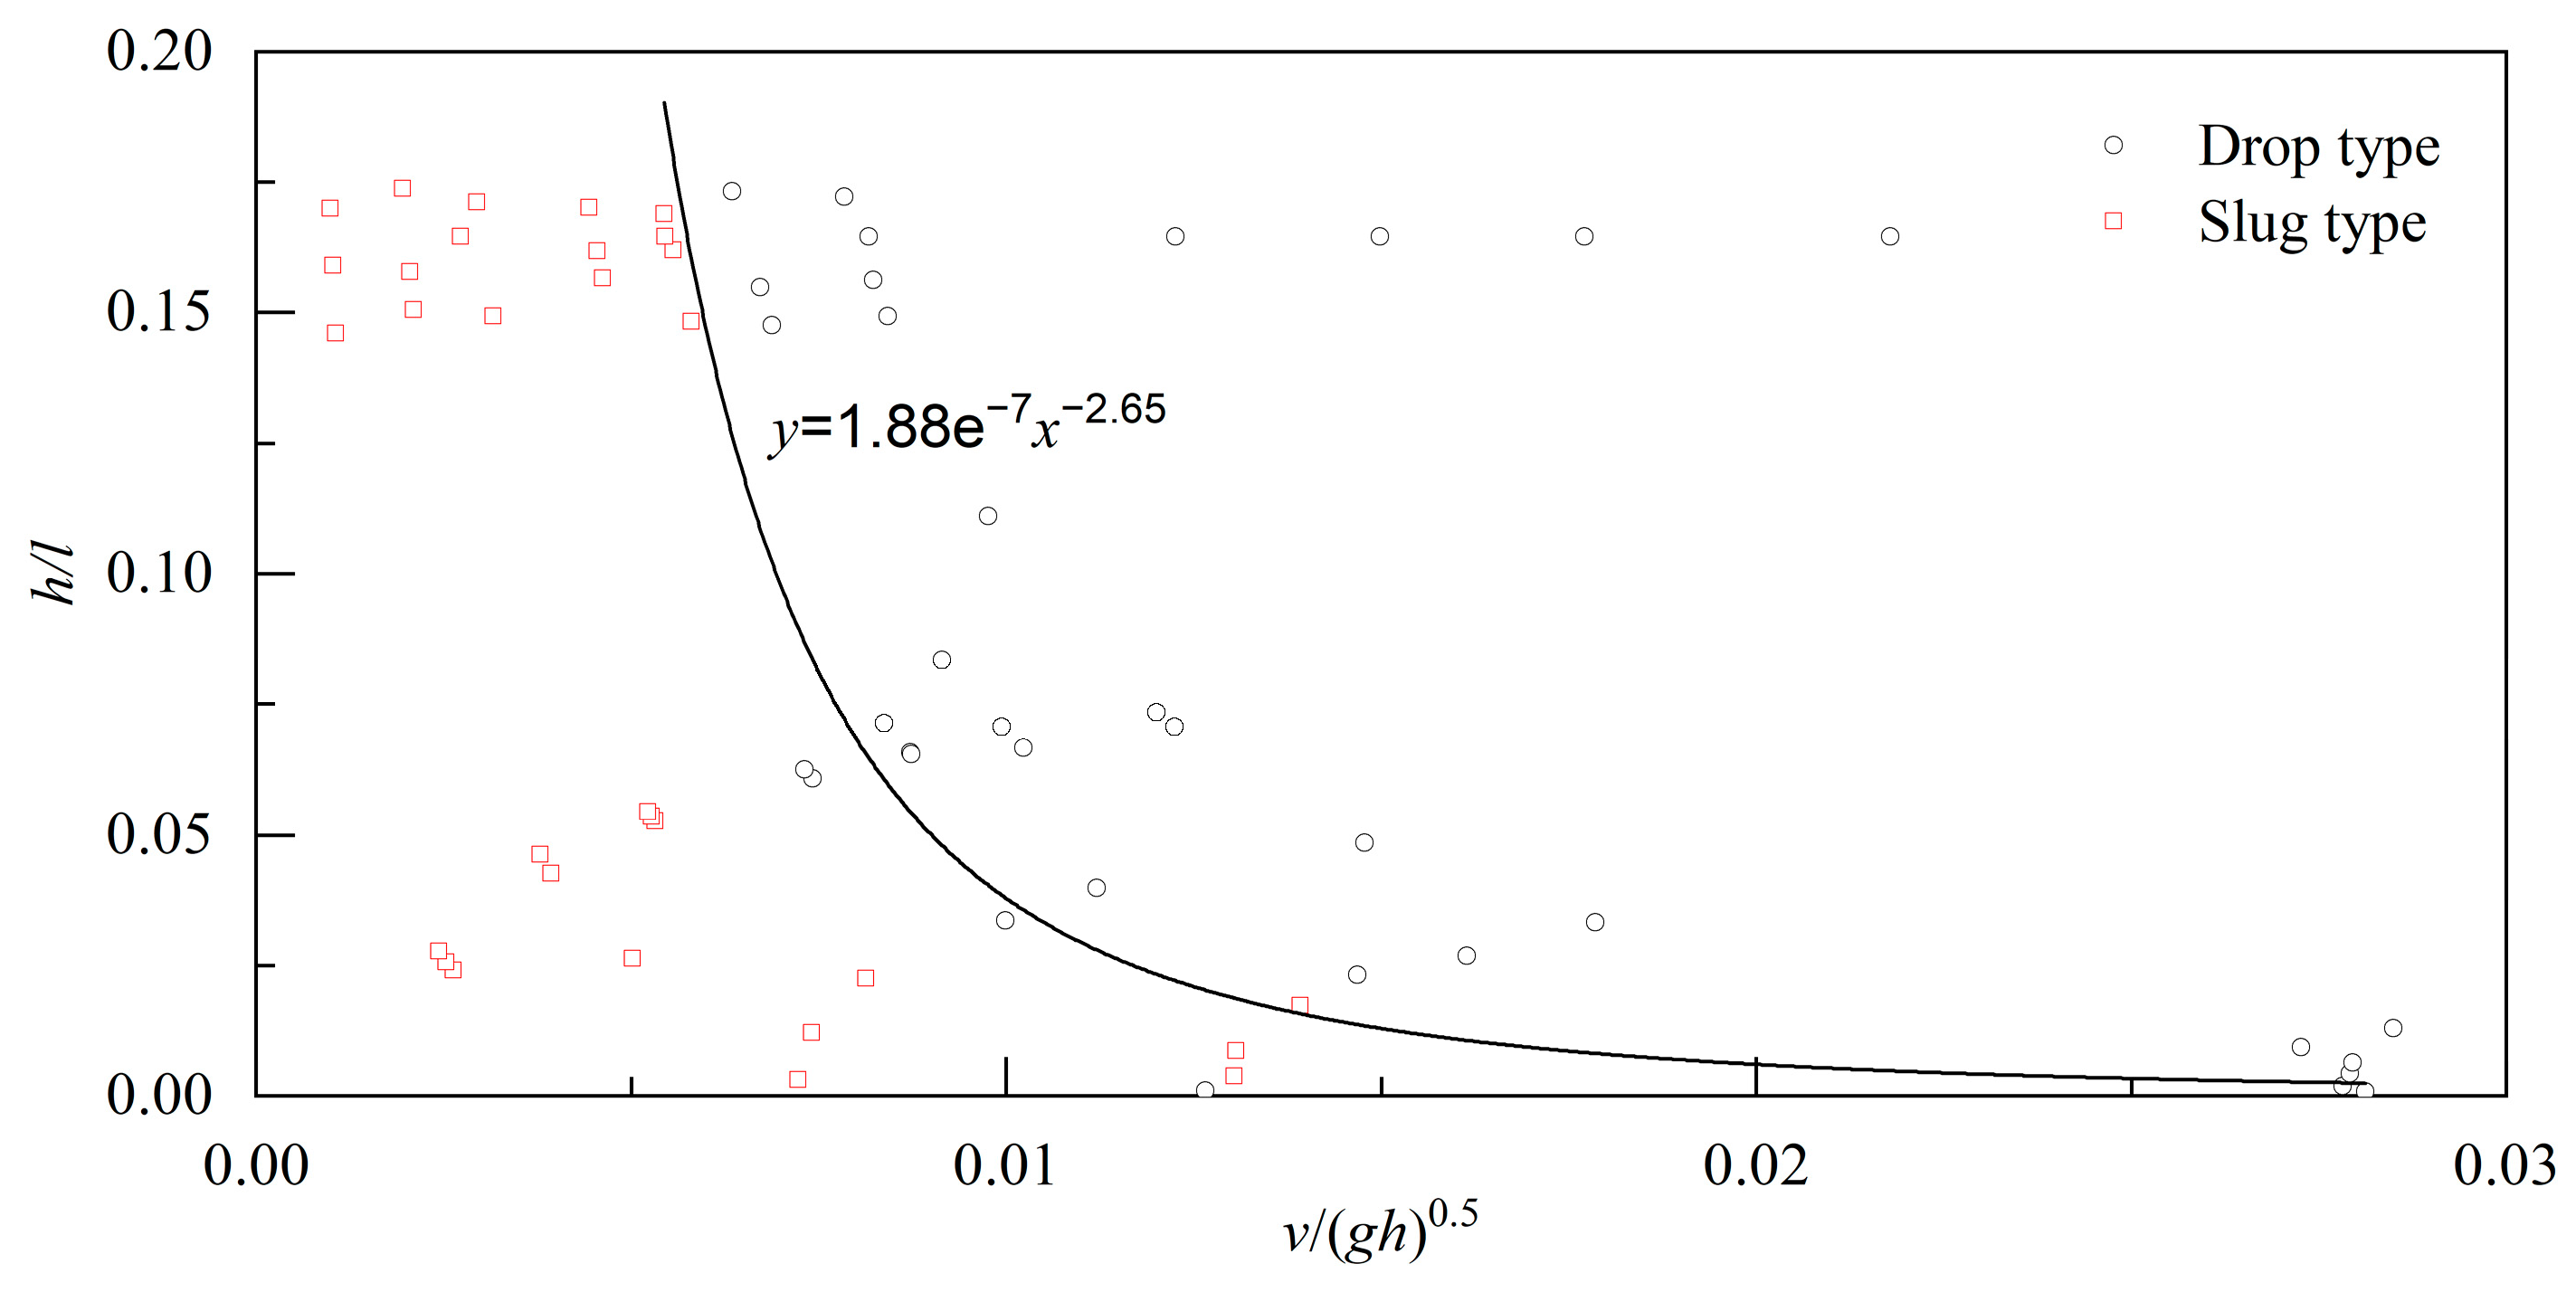
The experimental results indicate that the flow type inside the cavity at water exit was strongly dependent on the relative lifting velocity v/(gh)0.5 and relative characteristic length l/h, with l as the length of air entrainment. In Figure 8, the flow types were related to l/h as a function of v/(gh)0.5. It is evident that a limit line split the plane (v/(gh)0.5, l/h) into a “slug zone” and a “drop zone”, which can be expressed as
Thus, a transition coefficient K was introduced to characterize the transition between two types of flows in the cavity and defined by the following equation:
Therefore, the flow in the cavity was a slug type for K < 1 and a drop type for K > 1.
4. Conclusions
Launching-type ship lifts are widely used in navigational mountain rivers where the water level in the downstream approach channel is characterized by large fluctuations in amplitude or variation ratio with time. However, the cavities enclosed by surrounding webs of the ship chamber and water bodies during the water exit process are subjected to negative pressure conditions, resulting in additional loads, perturbations, and vibrations on the chamber, and even disturbing the ship lift operation. In this study, the water exit behavior of a schematic cavity was investigated using experimental testing and numerical calculation. The main findings are as follows.
Three different types of air pressure process were recognized: growth type, transition type, and stable type. The maximum negative pressures were classified based on the relative lifting velocity and relative ported area into four different zones. For each zone, empirical relation was proposed to predict the maximum negative pressure. Moreover, a formula was developed to estimate the optimum ported area regarding the absence of additional hydrodynamic loads. At water exit, two flow patterns in the cavity were observed, depending on the relative lifting velocity and relative characteristic length. Furthermore, a novel dimensionless parameter was introduced to characterize the transition between two types of flows in the cavity: the flow was a slug type for K < 1 and a drop type for K > 1.
Author Contributions
Conceptualization, X.L. and F.Z.; writing—original draft preparation, X.L.; writing—review and editing, F.Z. All authors have read and agreed to the published version of the manuscript.
Funding
This study was supported by the China Postdoctoral Fund (Grant No. 2021M700620); Natural Science Foundation of Chongqing, China (Grant No. cstc2021jcyj-bshX0049).
Institutional Review Board Statement
Not applicable for studies not involving humans or animals.
Informed Consent Statement
Informed consent was obtained from all subjects involved in the study.
Data Availability Statement
The data that support the findings of this study are available from the corresponding author upon reasonable request.
Acknowledgments
The authors acknowledge the administrative support of Yaan Hu.
Conflicts of Interest
The authors declare no conflict of interest.
References
- Ukkola, A.M.; De Kauwe, M.G.; Roderick, M.L.; Abramowitz, G.; Pitman, A.J. Robust future changes in meteorological drought in CMIP6 projections despite uncertainty in precipitation. Geophys. Res. Lett. 2020, 47, e2020GL087820. [Google Scholar] [CrossRef]
- Yin, J.; Slater, L.; Gu, L.; Liao, Z.; Guo, S.; Gentine, P. Global Increases in Lethal Compound Heat Stress-Hydrological Drought Hazards under Climate Change. Geophys. Res. Lett. 2022, 49, e2022GL100880. [Google Scholar] [CrossRef]
- Wan, W.; Zhao, J.; Popat, E.; Herbert, C.; Döll, P. Analyzing the Impact of Streamflow Drought on Hydroelectricity Production: A Global-Scale Study. Water Resour. Res. 2021, 57, e2020WR028087. [Google Scholar] [CrossRef]
- Hongqi, M.; Xuexing, C. Research on the key technologies of hydraulic new type ship lift. J. Hydraul. Eng. 2018, 49, 446–455. [Google Scholar]
- Liu, J.; Hu, Y.; Li, Z.; Xue, S. Risk Analysis and Optimization of Water Surface Deviation from Shafts in the Filling–Emptying System of a Mega-Scale Hydro-Floating Ship Lift. Water 2021, 13, 1377. [Google Scholar] [CrossRef]
- Sun, Z.; Zheng, H.; Sun, L. Analysis on the Characteristics of Bed Materials in the Jinghong Reservoir on the Lancang River. Sustainability 2021, 13, 6874. [Google Scholar] [CrossRef]
- Cheng, X.; Shi, D.; Li, H.; Xia, R.; Zhang, Y.; Zhou, J. Influence of structural parameters on pitching stability of a vertical shiplift. SN Appl. Sci. 2020, 2, 1527. [Google Scholar] [CrossRef]
- Lang, S.; Yang, Z.; Hao, C.; Ji, Z.; Wei, S.; Re, X. Stability analysis of Hoist Vertical Shiplift chamber under pitching motion. IOP conference series. Mater. Sci. Eng. 2019, 631, 32028. [Google Scholar] [CrossRef]
- Wang, X.; Hu, Y.; Li, Z.; Yan, X. Prototype monitoring of mechanical characteristics of large ship lift chamber filling and outleting of water. Hydro-Sci. Eng. 2019, 3, 1–8. [Google Scholar]
- Li, X.; Zheng, F. Experimental and Numerical Investigation of the Water-Exit Behaviour of an Inverted T-Shaped Beam. Adv. Civ. Eng. 2022, 2022, 1–9. [Google Scholar] [CrossRef]
- De Rosis, A.; Tafuni, A. A phase-field lattice Boltzmann method for the solution of water-entry and water-exit problems. Comput.-Aided Civ. Inf. 2022, 37, 832–847. [Google Scholar] [CrossRef]
- Basic, J.; Degiuli, N.D.N.; Werner, A.W.A. Simulation of water entry and exit of a circular cylinder using the ISPH method. T. Famena 2014, 38, 45–62. [Google Scholar]
- Del Buono, A.; Bernardini, G.; Tassin, A.; Iafrati, A. Water entry and exit of 2D and axisymmetric bodies. J. Fluid. Struct. 2021, 103, 103269. [Google Scholar] [CrossRef]
- Breton, T.; Tassin, A.; Jacques, N. Experimental investigation of the water entry and/or exit of axisymmetric bodies. J. Fluid Mech. 2020, 901, 559. [Google Scholar] [CrossRef]
- Korobkin, A.A.; Khabakhpasheva, T.I.; Maki, K.J. Hydrodynamic forces in water exit problems. J. Fluid. Struct. 2017, 69, 16–33. [Google Scholar] [CrossRef] [Green Version]
- Greenhow, M. Water-entry and-exit of a horizontal circular cylinder. Appl. Ocean Res. 1988, 10, 191–198. [Google Scholar] [CrossRef]
- Rajavaheinthan, R.; Greenhow, M. Constant acceleration exit of two-dimensional free-surface-piercing bodies. Appl. Ocean Res. 2015, 50, 30–46. [Google Scholar] [CrossRef]
- Chanson, H. The Hydraulics of Open Channel Flows: An Introduction; Butterworth-Heinemann: Oxford, UK, 2004. [Google Scholar]
Figure 1.
Schematic of the experiments with defined parameters: (a) the front view, (b) the side view.
Figure 1.
Schematic of the experiments with defined parameters: (a) the front view, (b) the side view.

Figure 2.
Comparison between numerical and experimental air pressure profiles: (a) D = 2 mm and v = 16 mm/s; (b) D = 7 mm and v = 16 mm/s; (c) D = 7 mm and v = 2 mm/s.
Figure 2.
Comparison between numerical and experimental air pressure profiles: (a) D = 2 mm and v = 16 mm/s; (b) D = 7 mm and v = 16 mm/s; (c) D = 7 mm and v = 2 mm/s.
Figure 4.
Graph defining different air pressure zones.
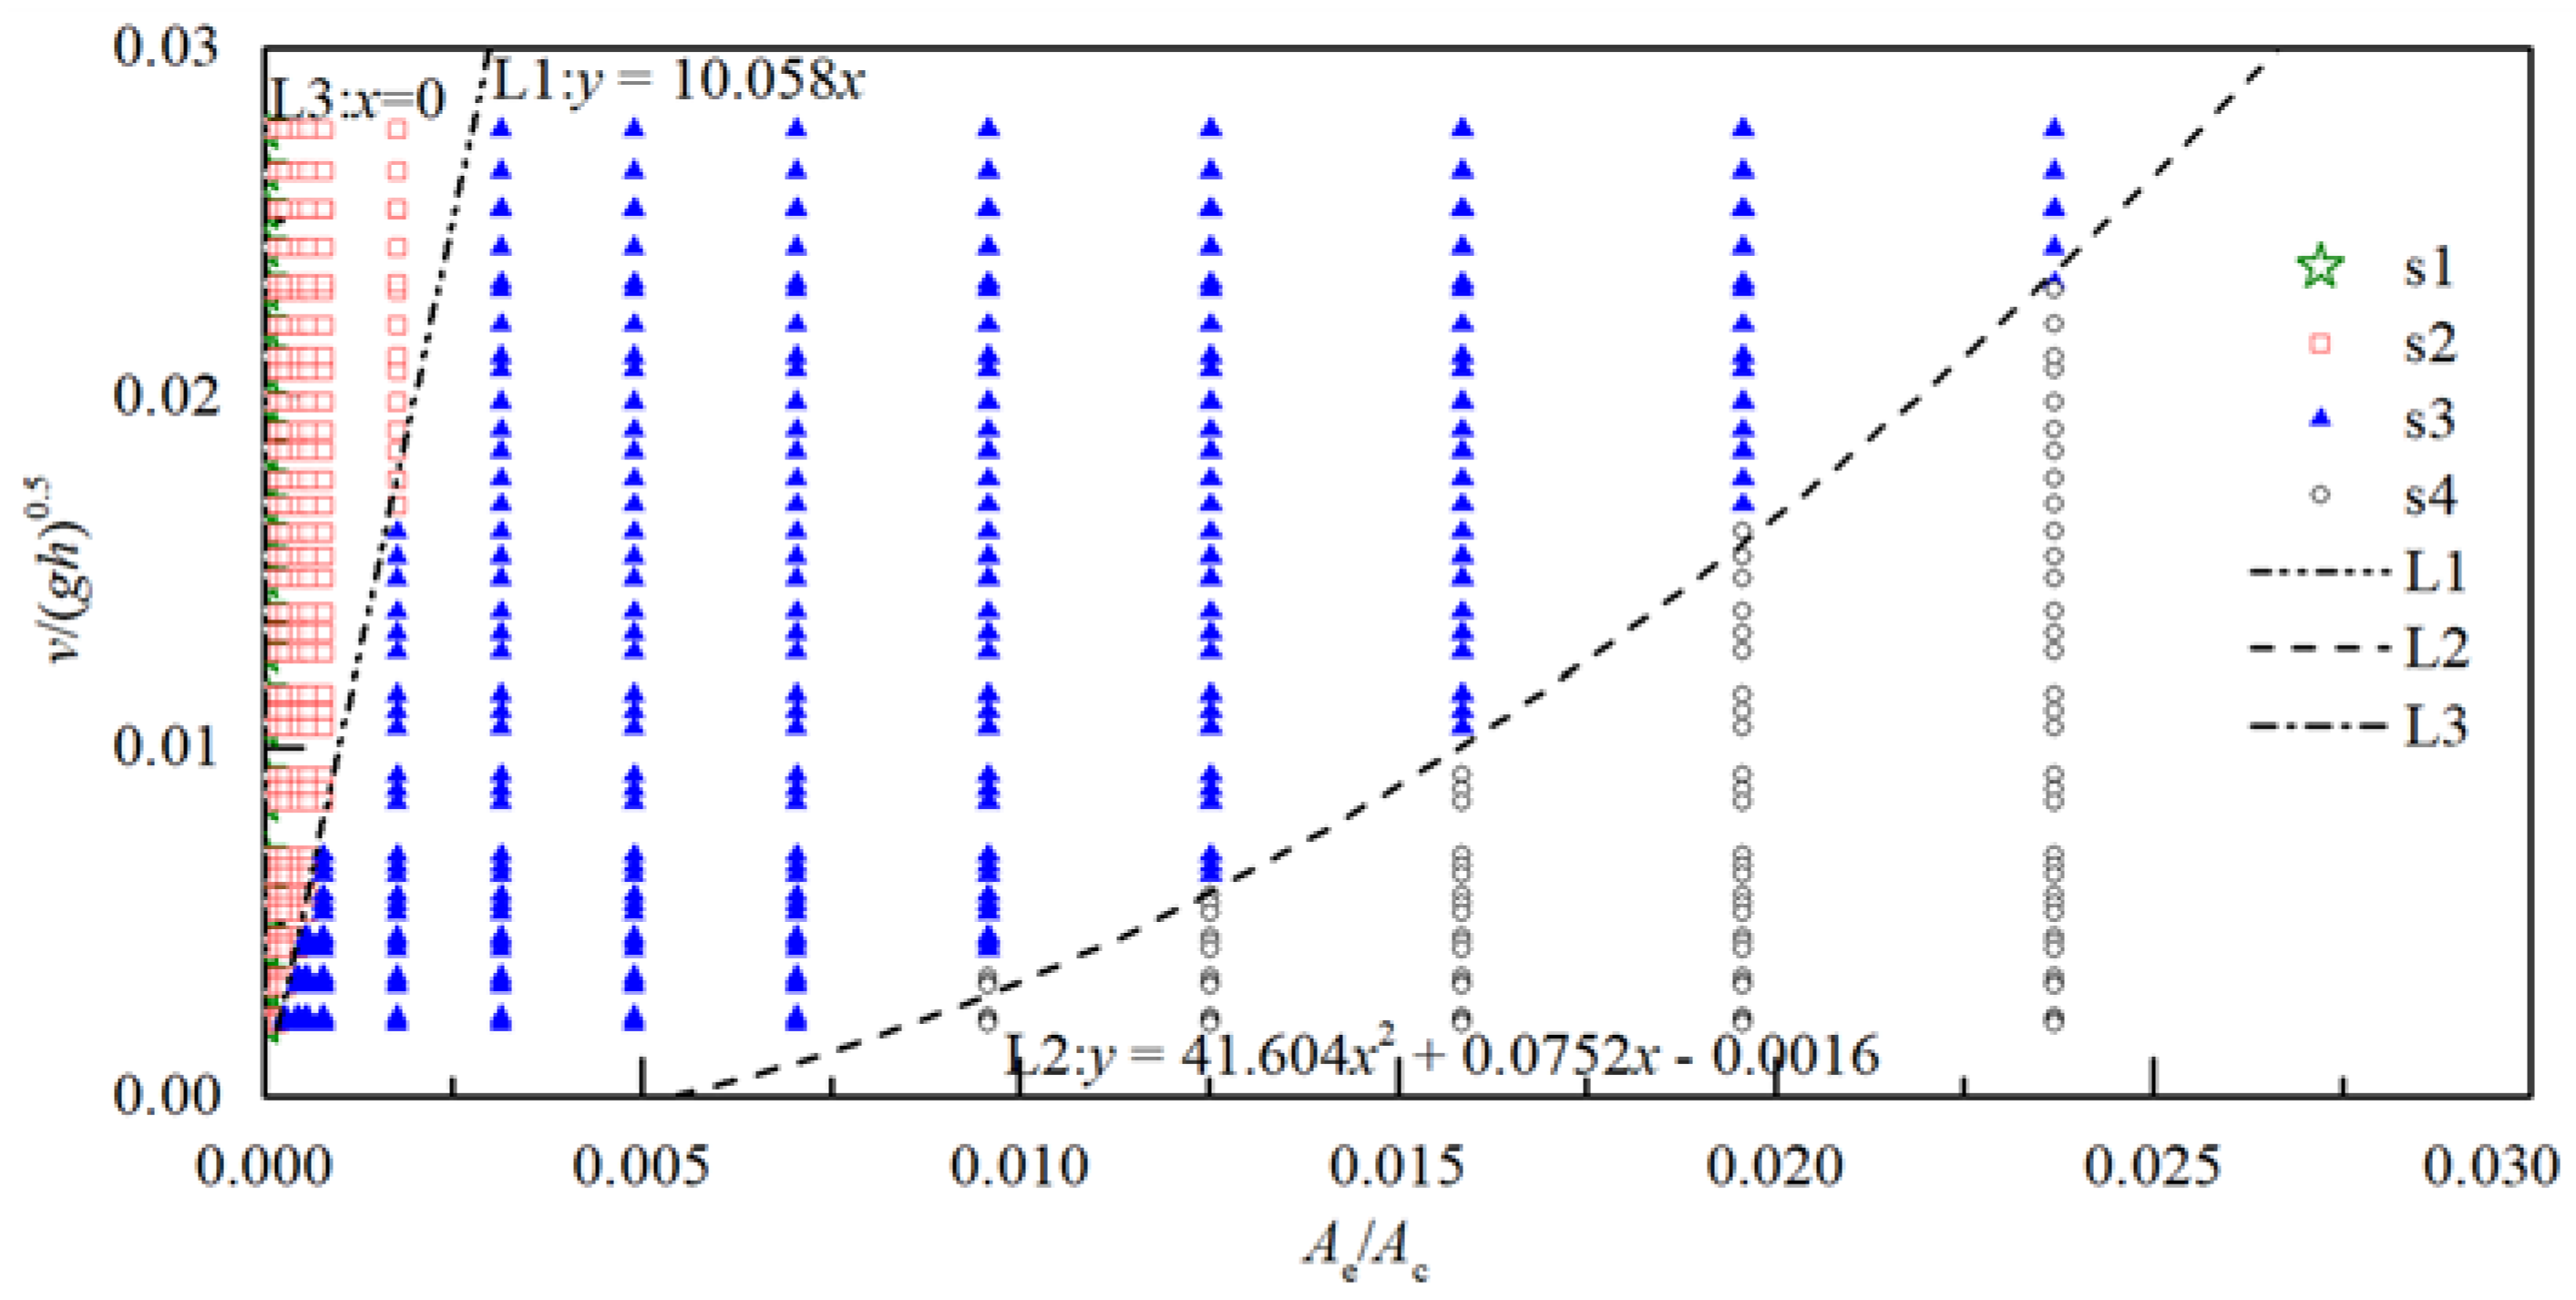
Figure 8.
Criteria for the flow type classification.
Disclaimer/Publisher’s Note: The statements, opinions and data contained in all publications are solely those of the individual author(s) and contributor(s) and not of MDPI and/or the editor(s). MDPI and/or the editor(s) disclaim responsibility for any injury to people or property resulting from any ideas, methods, instructions or products referred to in the content. |
© 2023 by the authors. Licensee MDPI, Basel, Switzerland. This article is an open access article distributed under the terms and conditions of the Creative Commons Attribution (CC BY) license (https://creativecommons.org/licenses/by/4.0/).
Share and Cite
MDPI and ACS Style
Li, X.; Zheng, F. Investigation into the Water Exit Behavior of a Cavity. Sustainability 2023, 15, 1007. https://doi.org/10.3390/su15021007
AMA Style
Li X, Zheng F. Investigation into the Water Exit Behavior of a Cavity. Sustainability. 2023; 15(2):1007. https://doi.org/10.3390/su15021007
Chicago/Turabian StyleLi, Xueyi, and Feidong Zheng. 2023. "Investigation into the Water Exit Behavior of a Cavity" Sustainability 15, no. 2: 1007. https://doi.org/10.3390/su15021007
Note that from the first issue of 2016, this journal uses article numbers instead of page numbers. See further details here.