Article

Improvement Mechanism of the Mechanical Properties and Pore Structure of Rubber Lightweight Aggregate Concrete with S95 Slag

1
College of Water Conservancy and Civil Engineering, Inner Mongolia Agricultural University, Hohhot 010018, China
2
Autonomous Region Collaborative Innovation Center for Integrated Management of Water Resources and Water Environment in Inner Mongolia Section of Yellow River Basin, Hohhot 010018, China
3
Gansu Provincial Seismological Bureau, Lanzhou 730000, China
*
Author to whom correspondence should be addressed.
Sustainability 2023, 15(2), 1008; https://doi.org/10.3390/su15021008
Submission received: 10 November 2022 / Revised: 14 December 2022 / Accepted: 19 December 2022 / Published: 5 January 2023
(This article belongs to the Special Issue Industrial Design and Production Engineering for Sustainability)

Abstract

:
This paper used natural pumice from the Inner Mongolia region as coarse aggregate to produce a lightweight concrete mix with a 3% rubber particle (20 mesh) content and dissimilar slag contents (0%, 5%, 10%, 15%, 20%, 25%, and 30%). It measured the compressive strength in five periods (3, 7, 14, 21, and 28 d). It also observed the development of the microstructure and measured the air content and pore distribution of the concrete using environmental scanning electron microscopy and nuclear magnetic resonance. A microtest combined with macroscopic mechanical experiments were used to analyze the influence on the mechanical properties of the rubber lightweight aggregate by the content of the S95 slag. The results showed that slag can improve the microstructure of rubber lightweight aggregate concrete. It hydrated the products, optimized the porous structure, and enhanced the compressive strength of the rubber lightweight aggregate concrete at 28 days, with excellent results regarding the air entraining. The best compressive strength of the rubber powder lightweight aggregate concrete at 28 days was when the content of the slag was 15%. An Atzeni pore-structure–strength model was introduced that contained a cement mass fraction. The results of the fitting indicate that the pore structure located at 0.1~1 μm had a marked influence on the mechanical properties of the rubber powder concrete.

1. Introduction

The construction industry is an important driver of national economic development, and it plays an irreplaceable role in the process of economic and social development. Cement is one of the most basic building materials, and its usage increases with each passing day. Since 1985, China has become the world’s largest cement producer, producing more than half of the world’s total supply since 2006 [1]. According to statistics, direct emissions of C O 2 by the cement industry accounted for 12% of total emissions, among which the emissions from industrial processes accounted for more than 60% of the total [2,3]. At present, our national economy is in a period of transformation and upgrading, and people’s requirements for environmental protection are constantly improving. In September 2020, China set the goals of “carbon peaking” by 2030 and “carbon neutrality” by 2060 [4]; therefore, minimizing the need for cement, preparing “low-carbon concrete” according to local conditions, and maintaining sustainable development [5] has become an urgent task for scientific researchers. Slag is the product of grinding blast furnace slag; its chemical composition is mainly calcium oxide, magnesium oxide, iron oxide, silicon oxide, alumina, and five other oxides. In mortar and concrete, slag can be used as an admixture to partially replace cement, effectively reducing greenhouse gas emissions, bringing considerable environmental and economic benefits, and making an important contribution to the sustainable development of the construction industry [6,7,8]. It was found that slag can improve the internal microstructure of concrete and enhance the strength and durability of concrete in later stages [9,10,11]. According to the different activity index, slag can be divided into S75, S95, and S105 grades. At present, the production efficiency of S95 grade slag powder is higher, and according to the market demand, it is the most common. The natural pumice stone resources located in Inner Mongolia, China, are abundant and of good quality [12]. Research shows that pumice coarse aggregate greatly improves the freeze–thaw durability of concrete because of its porous property [13,14,15]. It provides reliable support for the sustainable development of water conservancy projects in the cold areas of northern China. To make full use of the resources in this region, this paper took pumice powder concrete as the coarse aggregate concrete configuration; explored the slag powder’s effect on the mechanical properties of the lightweight aggregate concrete powder’s mechanism; expanded the slag powder in the application of the lightweight aggregate concrete; accelerated the resource waste recycling; and reduced the economic loss caused by environmental governance.

2. Materials and Methods

2.1. Materials

Cement: JIDONG P·O 42.5 Portland cement. Its performance indicators are shown in Table 1.
Coarse aggregate: pumice stone from Inner Mongolia. The main physical properties are shown in Table 2.
S95 slag: the chemical composition of the grade S95 slag powder is shown in Table 3.
Fly ash: grade II fly ash from the Jinqiao Thermal Power Plant in Hohhot, Inner Mongolia.
Fine aggregate: natural river sand with a maximum particle size of 5 mm, continuous gradation, fineness modulus of 2.56, mud content of 1.98%, apparent density of 2630 kg/m3, bulk density of 1510 kg/m3, and water content of 1.3%.
Admixture: naphthalene series highly effective water reducing agent, which is a yellow–brown powder that is easily dissolves in water, with the content of the cementification material of 1% and a water reduction rate of 20%.
Mixing water: ordinary tap water with a pH value of 7.2.
Rubber powder: particle size of 20 mesh waste tire rubber powder.

2.2. Method

According to the “Technical Specification for Lightweight Aggregate Concrete” JGJ51-2002, rubber powder lightweight aggregate concrete is configured with a water–cement ratio of 0.34 and a strength grade of LC40. The replacement rate of the Portland cement was 0%, 5%, 10%, 15%, 20%, 25%, and 30%. The base group with a 0% replacement rate was denoted as B-0, and a replacement rate of 5% was denoted as B-5. The concrete mixture ratio design is shown in Table 4. The cubic compressive strength test was carried out with reference to the “Standard for Mechanical Properties of General Concrete” GB/T50081-2002, and the test block size was 100 × 100 × 100 mm. The cubic compressive strength reduction factor was taken as 0.95 considering the size effect of the specimens, and the test was carried out at a rate of 0.5 MPa/s, with continuous uniform loading. Each group of specimens was tested three times, and the data were averaged. In this study, MesoMR-60 low-field NMR was used to analyze the pore structure of the concrete at 28 d. The magnetic field strength was 0.55 T, the magnetic field temperature was 32 °C, and the operating frequency was 23.32 MHz. The cores were taken using a diamond drill corer before the test, and the specimens were 48 mm in diameter and 50 mm in height. The cylindrical concrete specimens were placed in water and vacuum saturated with water using a vacuum saturation device for 24 h and then subjected to NMR testing. MATLAB software programming was used and combined with the experimental results to fit the analysis.

3. Results

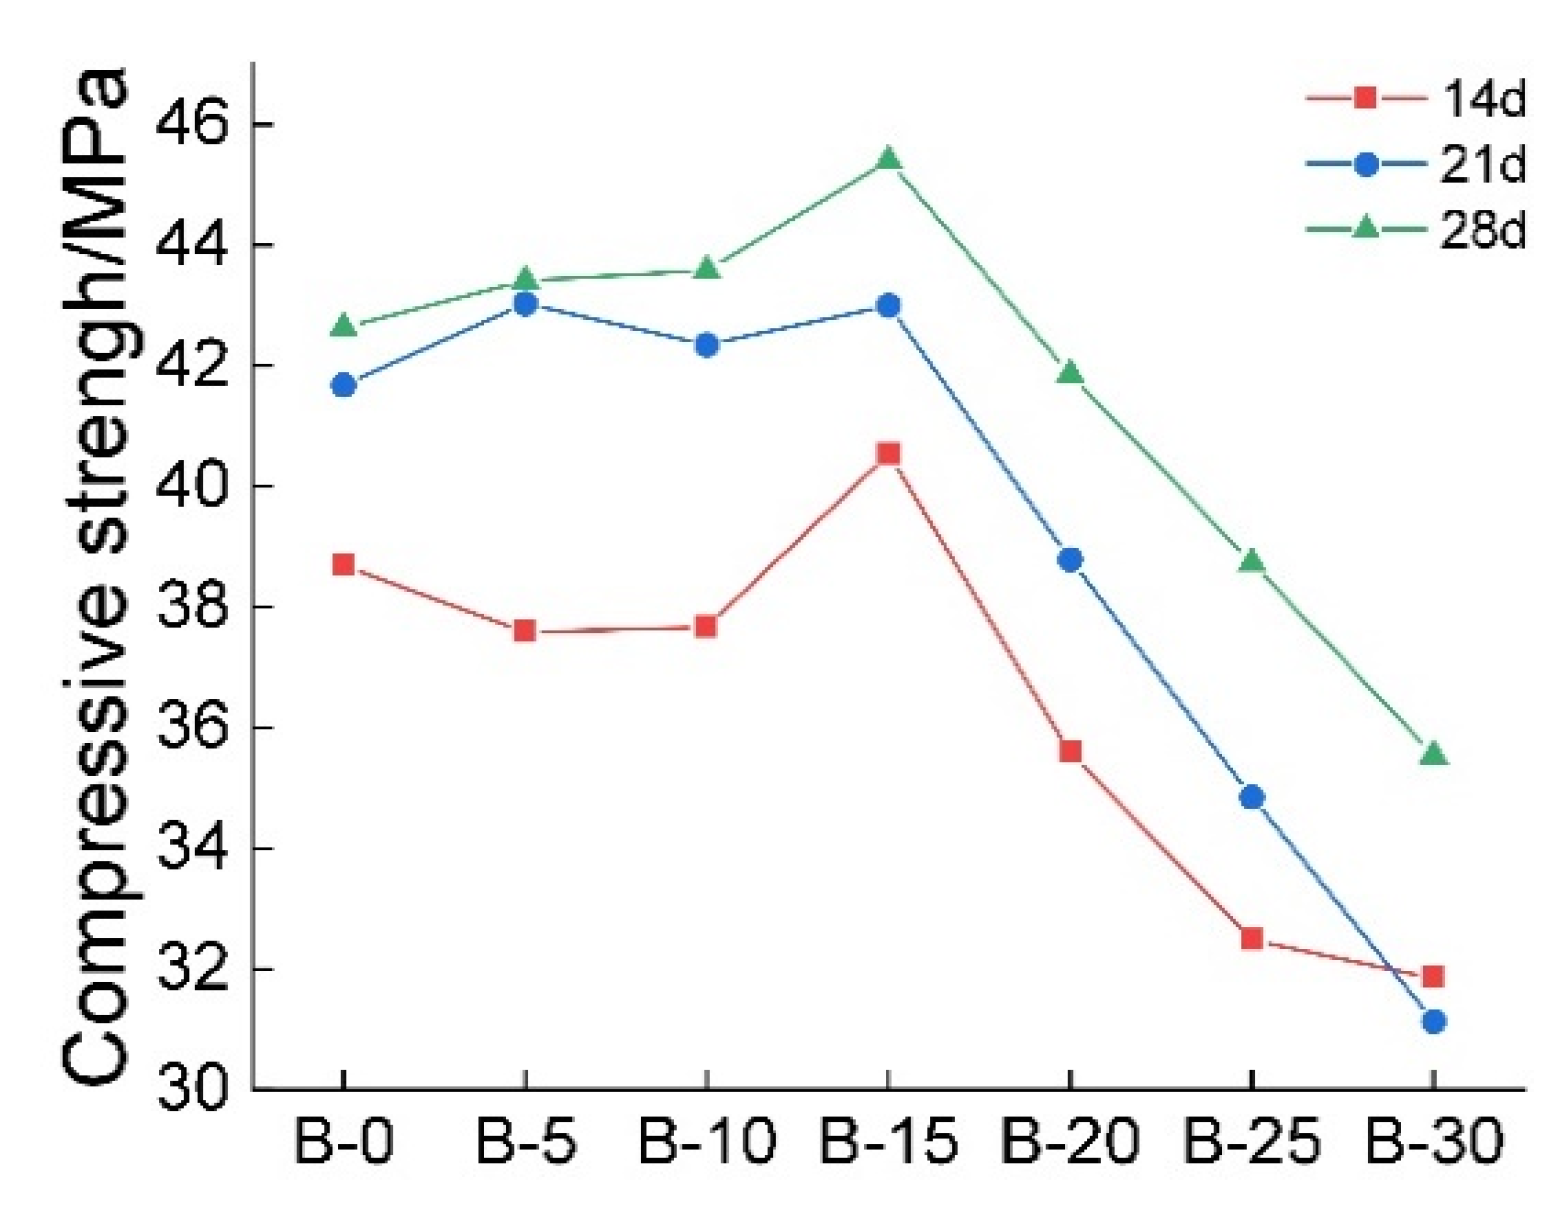
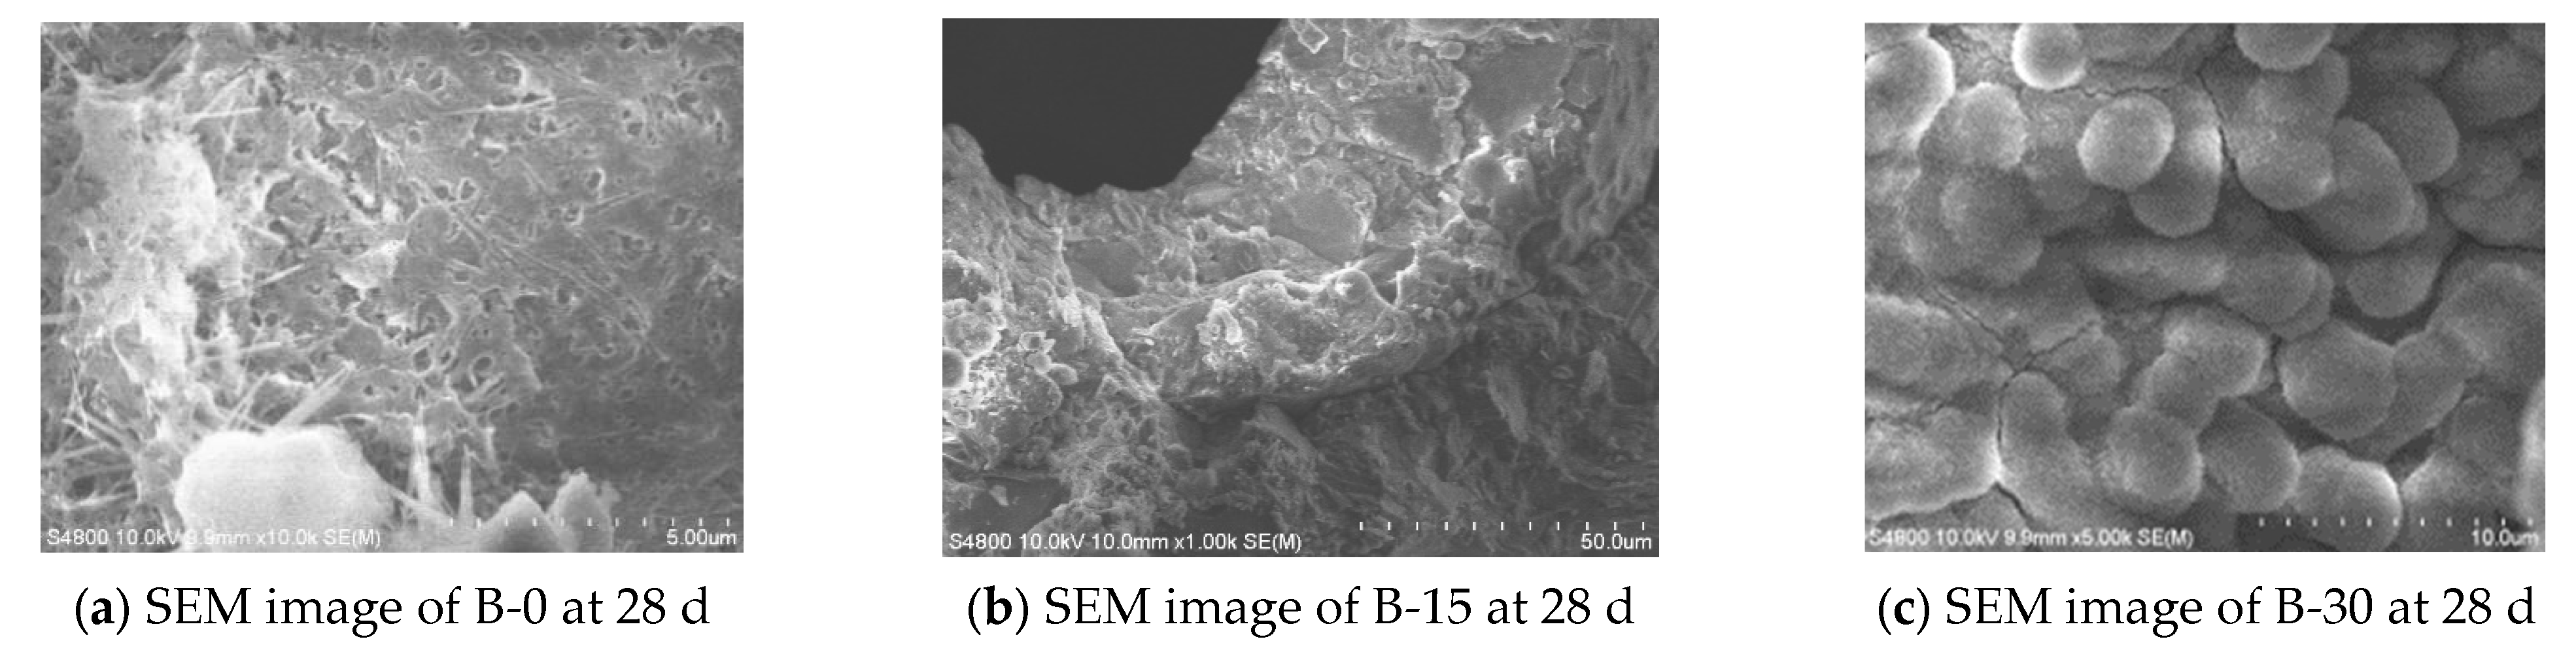
3.1. Mechanical Properties and SEM Analysis of Rubber Powder Concrete

The purpose of this section is to illustrate the effect of the mineral powder admixture in relation to the microscopic morphology and compressive strength of the concrete at different stages. The compressive strength of the rubber powder concrete at different ages is shown in Figure 1 and Figure 2. It can be seen from Figure 1 that the strength of the samples mixed with slag powder at 3 d was generally lower than that of samples B-0 of the reference group for all ages, while the compressive strength of the groups B-15, B-20, and B-25 approached that of group B-0 at 7 days, indicating that these three mixtures had obvious advantages in improving the compressive strength of concrete in the early stage of hydration. As can be seen from Figure 2, the compressive strength of groups B-5 and B-10 approached or even exceeded that of group B-0 in the middle and late stages of the concrete hydration, and the compressive strength of group B-15 improved significantly, showing good development in the three periods, as shown in Figure 2. When the content of the slag powder exceeded 15%, the compressive strength of the concrete showed a downward trend to varying degrees. The reason for this may be that the excessive content of the slag powder reduced the performance of the cementing materials, affecting the degree of mechanical meshing between the aggregate and mortar, and finally leading to the deterioration of the concrete’s compressive strength. As the compressive strength of group B-15 was significantly better than that of the other groups, groups B-15, B-30, and the comparison sample, group B-0, were selected for a comparative analysis in the microtest.
According to the fluctuation rule for the compressive strength of concrete at 28 days, the specimens B-0, B-15, and B-30 at 28 days were selected for an environmental scanning electron microscopic analysis, and the microstructural results of the specimens are shown in Figure 3. By comparing Figure 3a–c, it can be observed that in the hydration products of group B-0, the C-S-H presented a fibrous distribution near the hexagonal Ca(OH)2. While the C-S-H in group B-15 was massive, the volume of Ca(OH)2 was significantly reduced compared with group B-0, and the overall hydration products were denser than group B-0. This indicates that the slag powder participated in the secondary hydration reaction and reduced the content of Ca(OH)2 in the hydration products [16,17]. The uniformity of the hydration products improved, and the hydration products were denser, providing a basis for the good development of the compressive strength of group B-15. In Figure 3c, for the B-30 group, the amount of C-S-H and the density increased significantly, and the hydration products of the different distributions had a large number of pores and cracks. Although with an excessive dosage of slag powder there was a promoting effect on the rubber powder concrete’s hydration, at the same time, it destroyed the microstructure of the cement mortar, producing adverse effects on the strength of the cement base’s development. This resulted in the deterioration of the concrete’s compressive strength.

3.2. Gas Content—Mechanical Analysis

It is believed that in the late curing period of 28 days, the hydration degree of concrete tends to be stable, and the compressive strength of the concrete at this time is closely related to the microstructure, where the gas content of the concrete can represent the change in the compressive strength of the concrete to a certain extent. This section explores the linear relationship between the compressive strength and the air content of concrete at 28 d. It can be seen from the Figure 4 that the greater the variation in the gas content, the more sensitive the reaction of the compressive strength to the change, which indicates that the addition of the slag micro-powder had a significant regulating effect on the gas content of the rubber powder lightweight aggregate concrete. When the slag powder content was 15%, at 28 d the compressive strength of the rubber powder lightweight aggregate concrete peaked, and the gas content was only 6.4%, which is lower than for the other groups.
Through the correlation analysis between the gas content and the compressive strength of the rubber powder lightweight aggregate concrete, it can be seen from Figure 5 that the compressive strength of the concrete at 28 d was negatively correlated with the gas content, and the goodness of fit was 0.89, which had a good correlation. The reason for this is that the higher the gas content, the greater the negative impact of the bubble content in the concrete on the cement stone and the lower the concrete’s compactness, subsequent leading to the deterioration of the compressive strength.

3.3. Mechanical Analysis of the Gas Content and Macroporous Porosity

From Section 3.2, it can be seen that the regulation of the slag powder on the internal air content of the concrete directly affected the compressive strength of the concrete. Therefore, this section mainly explores the range of the pore distribution that affects the mechanical properties of concrete. Compared with ordinary concrete, more air will be introduced, and a more complex pore structure will be formed during the mixing process of the rubber powder lightweight aggregate concrete due to the air entrain action of the rubber powder particles. It has been concluded that the proportion of the macroscopic pores (>200 × 10 3 nm ) in concrete can represent the compressive strength of the concrete to a certain extent [18]. It has also been found that the pore-structure–mechanical model, established by the pore radius, can explain the influence of the pore structure on the compressive strength of the concrete [19]. Therefore, when exploring the change law of a concrete’s compressive strength, it is necessary to consider the influence of various pore structures comprehensively, and only considering the influence of the gas content on the concrete is not rigorous.
The pore structure of the concrete samples was detected using the Carr–Purcell–Meiboom–Gill (CPMG) pulse sequence for nuclear magnetic resonance [20]. In the magnetic field, the number of hydrogen atoms in the fluid in the concrete pores can be determined according to the transverse relaxation time T 2 , and the pore structure can then be analyzed. According to nuclear magnetic resonance theory [21,22,23], the transverse relaxation time T 2 , can be expressed as
1 T 2 = 1 T 2 S + 1 T 2 B + 1 T 2 D
where T 2   represents the measured relaxation time of the pore fluid; T 2 s represents the surface relaxation time; represents the body relaxation time; and T 2 B represents the relaxation time due to the fact of diffusion. Since the value of   T 2 B is usually much larger than the transverse relaxation time T 2 , the second term on the right in Formula (1) can be ignored [24]. Meanwhile, the corresponding magnetic field and echo time in this study were small enough, so the third item on the right can also be ignored [25]; therefore, Equation (1) can be simplified as
1 T 2 = ρ 2 S V = F s ρ 2 r
where ρ 2 is the transverse surface relaxation strength ( μ m / s ) , and 3~10 μ m / s of the concrete is generally taken from experience [26]; S is the concrete’s pore surface area ( μ m 2 ); V is the pore volume ( μ m 3 ); F s is the shape geometry factor and general number, and because the pores are approximately spherical, F s   = 3; and r is the pore radius ( μ m ).
The smaller the transverse relaxation time T2 value, the smaller the pores; the larger the pores, the larger the T2 value. Therefore, the T2 distribution reflects the distribution of the pores in the concrete. The position of the peak of the image is related to the aperture size, and the area of the peak is related to the number of the corresponding aperture. By classifying and processing the nuclear magnetic data in Figure 6, a macroscopic pore ratio diagram was obtained (>200 × 10 3   n m ), as shown in the Table 5. It can be seen from Figure 7 that the absolute slope of the line fitting the relationship between the compressive strength of the rubber powder lightweight aggregate concrete at 28 days and the macroscopic pore porosity was 25.86, which was much higher than the absolute slope of the line fitting the relationship between the compressive strength and the gas content at 28 days, which was 0.93 This indicates that the sensitivity of the compressive strength of the light aggregate concrete at 28 d to the change in the macropore porosity was significantly higher than that to the change in the gas content; that is, the macropore porosity of the light aggregate concrete had a greater influence on its compressive strength at 28 day. Figure 4 illustrates that the different dosages of the slag powder changed the air content of the powder of the lightweight aggregate concrete from 6.44% to 12.48%, and the macropore porosity increased from 1.27% to 1.43%. The effect of adjusting the slag powder on the lightweight aggregate concrete’s air content was very clear, and it had a reasonable structure as long as the content of slag powder was properly controlled. It can replace the air entrainment agent, to a certain extent, in order to increase the gas content of the rubber powder lightweight aggregate concrete, effectively improving the durability of the rubber powder lightweight aggregate concrete and, thus, more macropores will not appear, affecting the compressive strength.

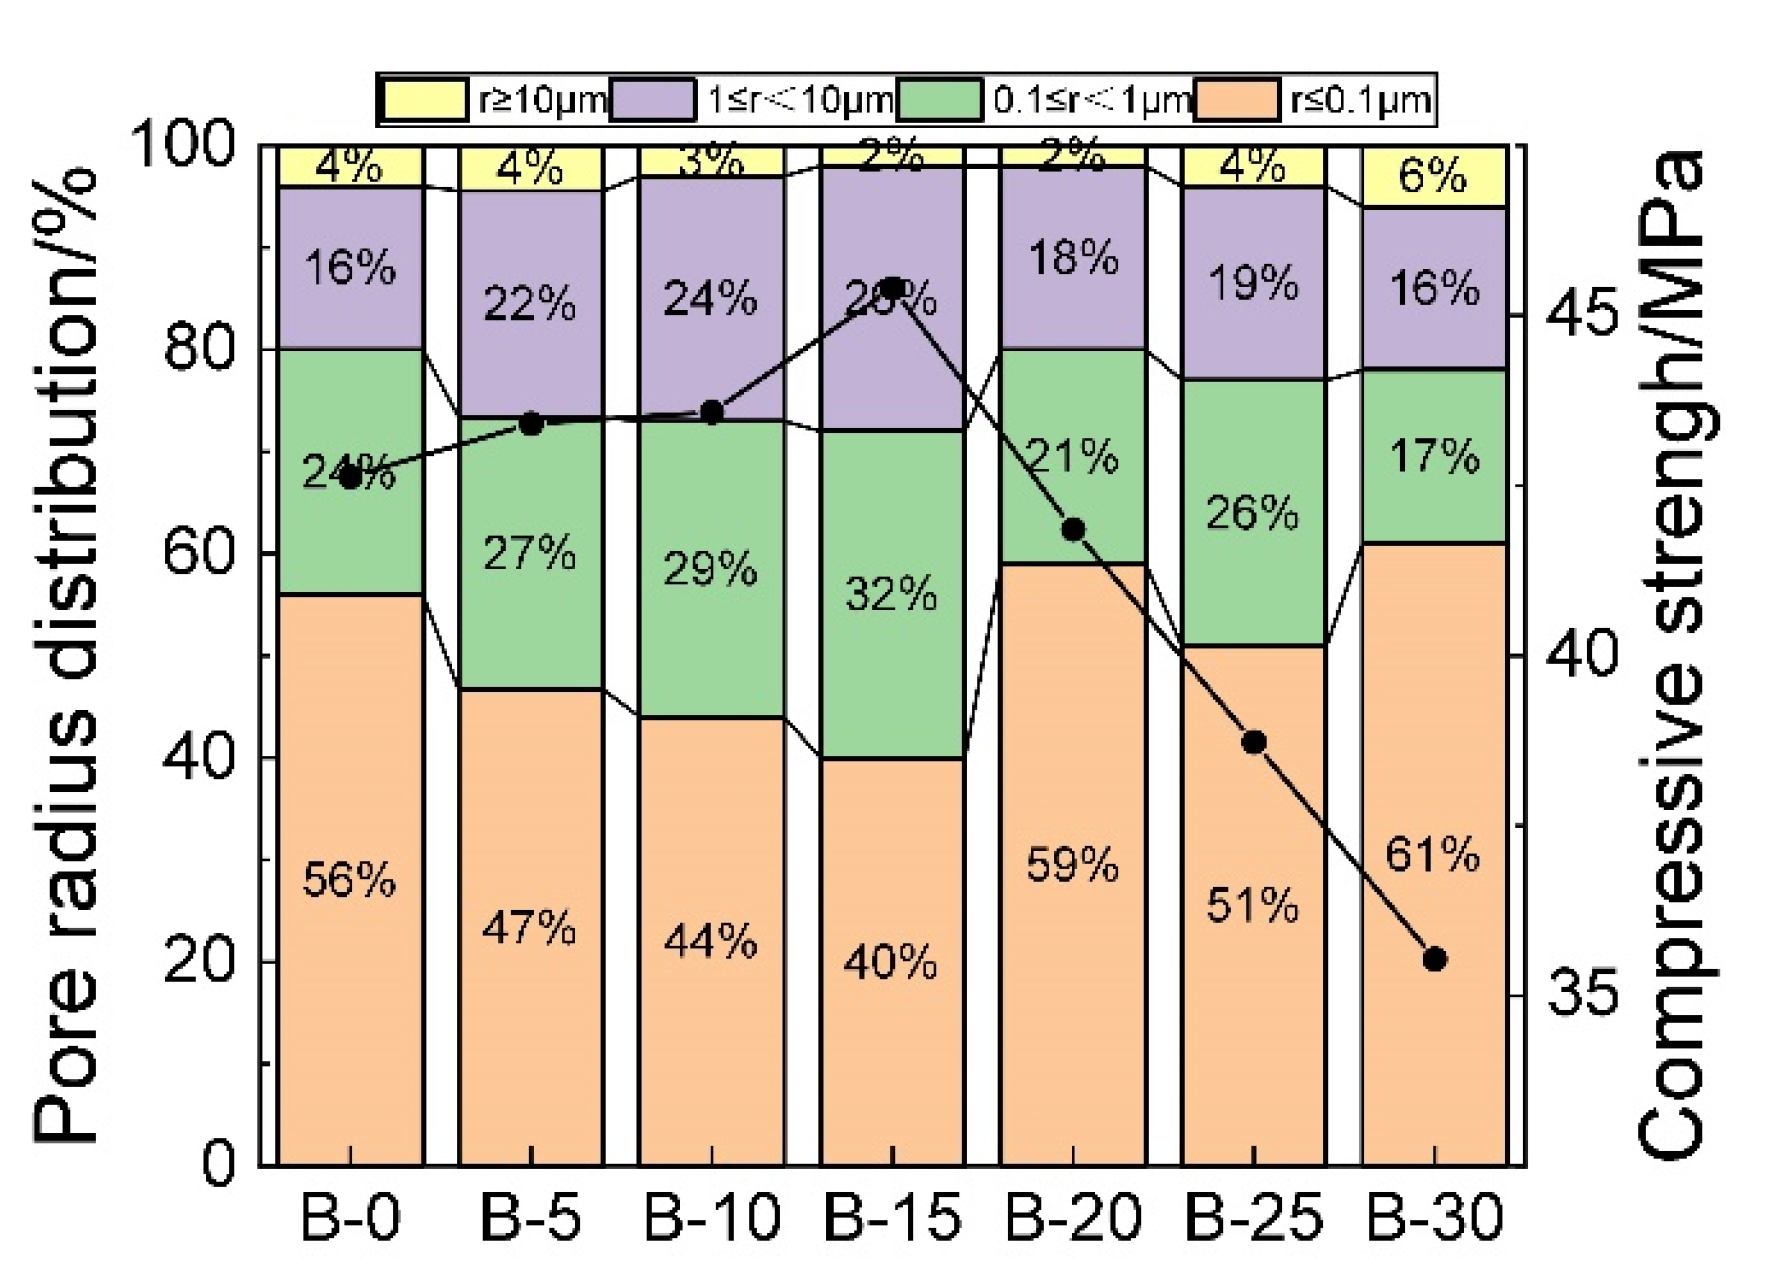
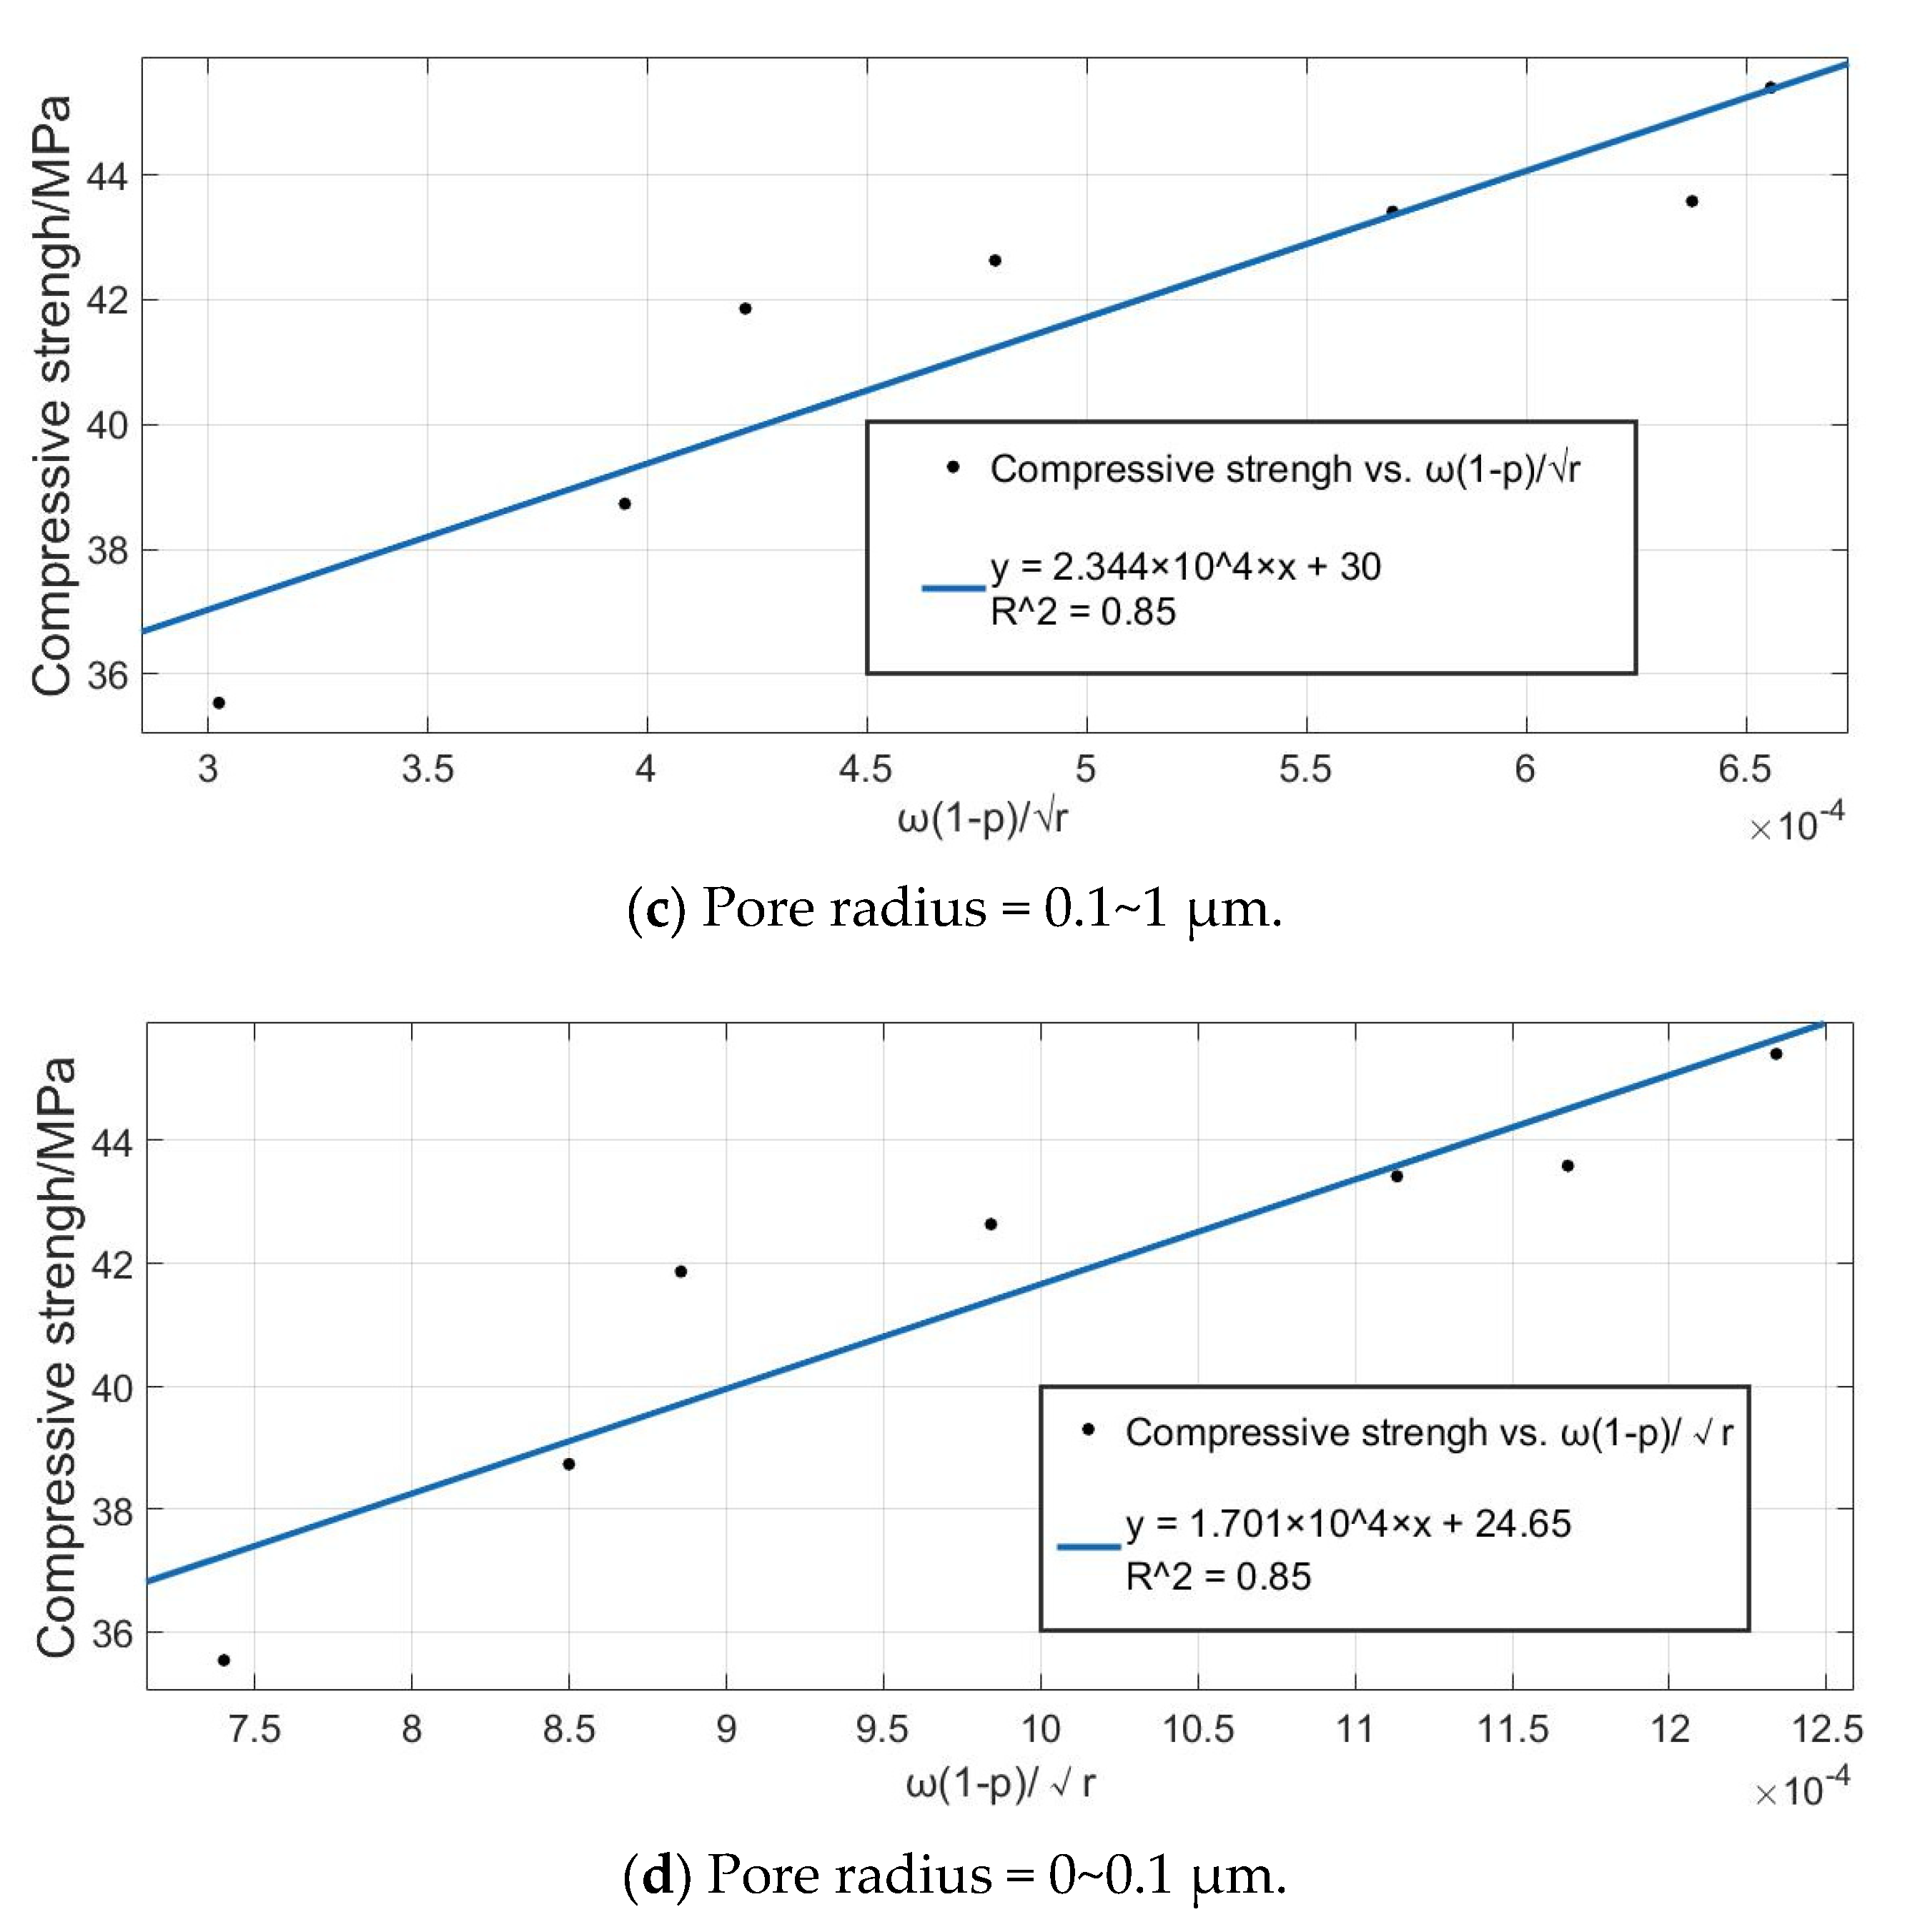
3.4. Porosity—Mechanical Analysis

Combined with the NMR T2 map in Figure 6, the pore radius of the rubber powder lightweight aggregate concrete was divided into four sections: 0~0.1, >0.1~1, >1~10, and >10 μm [27,28,29]. Moreover, the percentage of the porosity at different size intervals with a standard curing of 28 d was calculated. The volume distribution of the concrete at the different size intervals is shown in Figure 7. As can be seen, the pore volume proportions at the intervals of 0.1~1 and 1~10 μm showed a regular change of first increasing and then decreasing with an increase in the slag powder replacement rate, and the pore volume proportion reached the peak when the slag powder replacement cement content was 15%. The proportion of the large pore volume at the interval r > 10 μm decreased first and then increased with the increase in the slag micro-powder replacement rate and reached the minimum value when the slag micro-powder replacement cement content was 15% and 20%. This indicates that the addition of an appropriate amount of slag micro-powder changed the internal pore structure of the rubber powder concrete. The secondary hydration reaction caused the C-S-H to grow continuously and fill the internal pores of the concrete, thus reducing the proportion of the large pore volume. With the increase in the replacement rate of the slag powder, the proportion of the large pore volume in the interval r > 10 μm increased, and the proportion of the pore volume at each interval r < 10 μm presented a disordered state. The reason for this is that the agglomeration of the slag powder and its uneven distribution affected the overall hydration efficiency of the rubber powder concrete. This resulted in the disordered development of the pore structure and the deterioration of the concrete’s compressive strength.
According to Figure 8, it can be seen that the goodness of fit between the compressive strength of the rubber powder lightweight aggregate concrete at 28 d and the macropore porosity and gas content needed to be improved, which is probably because the change range of the cement mass of the concrete was too large, which directly affected the connection strength of the matrix strength and the concrete particle system.
Therefore, when the proportion of cement in the concrete changes in a large range, if the influence of the cement mass fraction on the compressive strength of the concrete is not independently considered in the pore-structure–strength model, it will lead to a certain degree of deviation. Therefore, considering the cement mass fraction, porosity and pore radius, the Atzeni pore-structure–strength model including the cement mass fraction is introduced [30]
σ = K ω ( 1 p ) / r
where K is the coefficient reflecting the strength of the concrete matrix; ω is the cement mass fraction; r represents the average pore radius of the concrete, and the pores were divided into four sections: 0~0.1, 0.1~1, 1~10, and >10 μm, as shown in Figure 7; p is the fraction porosity of the pore radius.
MATLAB software was used to program and simulate the model. The vertical axis represents the compressive strength, and the horizontal axis represents ω ( 1 p ) / r . The results from Figure 9 show that there was a certain correlation between the proportion of the pore volume and the compressive strength in each section.
Among them, the pores at an interval of 0.1~1 μm had a better fitting effect, and the goodness of fit of the R-square was 0.94, which was much higher than the goodness of fit between the compressive strength at 28 d and the macroscopic pore porosity (0.81) and the goodness of fit between the compressive strength at 28 d and the gas content (0.89). This indicates that the pore-structure–mechanical model considering the cement mass fraction could better reflect the relationship regarding the compressive strength at 28 d between the slag micro-powder and the rubber powder lightweight aggregate concrete. When considering the effect of the pore structure on the compressive strength, the pores in the range of 0.1~1 μm should be adjusted preferentially. If the cement mass fraction is constantly changing, it is necessary to consider the influence of the cement mass fraction on the compressive strength of the rubber powder lightweight aggregate concrete at 28 d independently.

4. Conclusions

  • S95 slag micro-powder can effectively improve the compressive strength of rubber powder lightweight aggregate concrete and has a good air-entraining effect. Among them, the 15% slag powder had the most obvious improvement advantage on the compressive strength of the concrete at 28 d.
  • The results showed that the compressive strength of the concrete at 28 d had a decreasing trend with the increase in the gas content and macroporous porosity. Compared with the gas content, the macroscopic pore porosity had a more significant influence on the compressive strength of the rubber powder lightweight aggregate concrete at 28 d.
  • The Atzeni pore-structure–strength model including the cement mass fraction showed that the correlation coefficient between a porosity of 0.1~1 μm and the compressive strength of the lightweight rubber powder aggregate concrete 28 d was optimal.

Author Contributions

Writing—original draft preparation and writing—review and editing, Z.G.; Conceptualization and methodology, H.W.; resources, S.S.; validation, S.F., L.S. and C.T.; All authors have read and agreed to the published version of the manuscript.

Funding

National Natural Science Foundation of China (52069024): Major Science and Technology Special Project of Inner Mongolia Autonomous Region (2021ZD0007).

Institutional Review Board Statement

“Not applicable” for studies not involving humans or animals.

Informed Consent Statement

Informed consent was obtained from all subjects involved in the study.

Data Availability Statement

Not applicable.

Conflicts of Interest

The authors declare no conflict of interest.

References

  1. Xu, D.; Cui, Y.; Li, H.; Yang, K.; Xu, W.; Chen, Y. On the future of Chinese cement industry. Cem. Concr. Res. 2015, 78, 2–13. [Google Scholar] [CrossRef]
  2. Xu, J.H.; Fleiter, T.; Eichhammer, W.; Fan, Y. Energy consumption and CO2 emissions in China’s cement industry: A perspective from LMDI decomposition analysis. Energy Policy 2012, 50, 821–832. [Google Scholar] [CrossRef]
  3. Yang, N.; Li, Y.-X.; Zhao, M.; LYU, C.; Liu, Z.-L.; Chen, S. Establishment of direct CO2 emission calculation model for cement clinker production enterprises. Adv. Clim. Chang. Res. 2021, 17, 79–87. [Google Scholar]
  4. He, J.Y.; He, J.; Wang, Y.T.; Fan, Y.B.; Shi, H.W.; Cai, B.F.; Yan, G. Study on the path of carbon dioxide emission peak in China’s cement industry. Res. Environ. Sci. 2022, 35, 347–355. [Google Scholar]
  5. Dong, L.; Haibin, Z. Impact of the 2030 Agenda for Sustainable Development on global and Chinese environmental governance. China Popul. Resour. Environ. 2016, 26, 8–15. [Google Scholar]
  6. Isaia, G.C.; Gastaldini, A.L.G. Concrete sustainability with very high amount of fly ash and slag. Rev. IBRACON Estrut. Mater. 2009, 2, 244–253. [Google Scholar] [CrossRef] [Green Version]
  7. Javali, S.; Chandrashekar, A.R.; Naganna, S.R.; Manu, D.S.; Hiremath, P.; Preethi, H.G.; Vinod Kumar, N. Eco-concrete for sustainability: Utilizing aluminium dross and iron slag as partial replacement materials. Clean Technol. Environ. Policy 2017, 19, 2291–2304. [Google Scholar] [CrossRef]
  8. Ulubeyli, G.C.; Artir, R. Sustainability for Blast Furnace Slag: Use of Some Construction Wastes. Procedia Soc. Behav. Sci. 2015, 195, 2191–2198. [Google Scholar] [CrossRef] [Green Version]
  9. Wang, Q.; Yan, P.; Yang, J.; Zhang, B. Influence of steel slag on mechanical properties and durability of concrete. Constr. Build. Mater. 2013, 47, 1414–1420. [Google Scholar] [CrossRef]
  10. Osborne, G.J. Durability of Portland blast-furnace slag cement concrete. Cem. Concr. Compos. 1999, 21, 11–21. [Google Scholar] [CrossRef]
  11. Bouikni, A.; Swamy, R.N.; Bali, A. Durability properties of concrete containing 50% and 65% slag. Constr. Build. Mater. 2009, 23, 2836–2845. [Google Scholar] [CrossRef]
  12. Qian, Z. Research progress of pumice and its exploitation and utilization. J. Mineral. Petrol. 1998, 111–115. [Google Scholar]
  13. Wang, X.X.; Liu, C.; Yin, L.Q.; Yan, C.W.; Liu, S.G. Freeze-thaw damage and life prediction model of natural pumice concrete. Bull. Chin. Ceram. 2021, 40, 98–105. [Google Scholar]
  14. Huo, J.; Yu, N.; Wang, T. Freeze-thaw damage model and Residual life prediction of pumice Aggregate concrete. Bull. Chin. Ceram. 2014, 33, 11–14. [Google Scholar]
  15. Huo, J.F.; Chu, J.J.; Yang, H. Experimental study on frost resistance of pumice mixed aggregate concrete in cold area. Bull. Chin. Ceram. 2013, 32, 1201–1205. [Google Scholar]
  16. Chidiac, S.E.; Panesar, D.K. Evolution of mechanical properties of concrete containing ground granulated blast furnace slag and effects on the scaling resistance test at 28days. Cem. Concr. Compos. 2008, 30, 63–71. [Google Scholar] [CrossRef]
  17. Bentz, D.P. Influence of water-to-cement ratio on hydration kinetics: Simple models based on spatial considerations. Cem. Concr. Res. 2006, 36, 238–244. [Google Scholar] [CrossRef]
  18. Zhang, J.X.; Zhang, J.H.; Wu, C.S. Study on properties and pore structure of recycled concrete. J. Build. Mater. 2006, 142–147. [Google Scholar]
  19. Jin, N.; Xianyu, J.; Guo, J. Study on the Relationship Model between concrete pore structure and Strength. J. Zhejiang Univ. Eng. Sci. 2005, 1680–1684. [Google Scholar]
  20. Zhong, J.; Yan, R.; Zhang, H.; Feng, Y.; Li, N.; Liu, X. Identification of fluid properties by NMR transverse relaxation time spectrum decomposition. Pet. Explor. Dev. 2020, 47, 691–702. [Google Scholar]
  21. Kleinberg, R.L.; Kenyon, W.E.; Mitra, P.P. Mechanism of NMR Relaxation of Fluids in Rock. J. Magn. Reson. Ser. A 1994, 108, 206–214. [Google Scholar] [CrossRef]
  22. Kewen, W.; Ning, L. Numerical simulation of rock pore-throat structure effects on NMR T2 distribution. Appl. Geophys. 2008, 5, 86–91. [Google Scholar] [CrossRef]
  23. Xiaoxiao, W.; Xiangdong, S.; Hailong, W.; Chu, G. Nuclear magnetic resonance analysis of concrete-lined channel freeze-thaw damage. J. Ceram. Soc. Jpn. 2015, 123, 43–51. [Google Scholar] [CrossRef] [Green Version]
  24. Zhang, N.; Zhao, F.F.; Wang, S.B.; Li, J.B.; Sun, D.Y. Review of NMR study on pore structure and seepage characteristics of rock. Water Resour. Hydropower Technol. 2018, 49, 28–36. [Google Scholar]
  25. Liu, Y.F.; Tang, D.Z.; Xu, H.; Li, S.; Zhao, J.L. Stress and deformation characteristics of pore fracture in coal rock based on nuclear magnetic resonance. J. China Coal Soc. 2015, 40, 1415–1421. [Google Scholar]
  26. Liu, W.; Xing, L. NMR Logging; Petroleum Industry Press: Beijing, China, 2011; ISBN 9787502187460. [Google Scholar]
  27. Jin, S.; Zhang, J.; Han, S. Fractal analysis of relation between strength and pore structure of hardened mortar. Constr. Build. Mater. 2017, 135, 1–7. [Google Scholar] [CrossRef]
  28. Liu, Q.; Shen, X.D.; Dong, R.X.; Wei, L.S.; Xue, H.J. Grey entropy analysis of the effect of pore structure on compressive strength of aeolian sand concrete. Trans. Chin. Soc. Agric. Eng. 2019, 35, 108–114. [Google Scholar]
  29. Li, W.; Wang, H.L.; Zhang, J.H.; Yang, H.; Wang, L.; Feng, S. Experimental study on mechanical properties and pore structure of gangue mixed aggregate concrete. J. Shandong Univ. Eng. Sci. 2022, 1–7. [Google Scholar]
  30. Kumar, R.; Bhattacharjee, B. Porosity, pore size distribution and in situ strength of concrete. Cem. Concr. Res. 2003, 33, 155–164. [Google Scholar] [CrossRef]
Figure 1. Compressive strength for 3 and 7 d.
Sustainability 15 01008 g001
Figure 2. Compressive strength for 14, 21, and 28 d.
Sustainability 15 01008 g002
Figure 3. Electron microscopy photos of the concrete at 28 d.
Sustainability 15 01008 g003
Figure 4. Air content and compressive strength of the concrete.
Sustainability 15 01008 g004
Figure 5. Correlations between the compressive strength of the concrete and the air content.
Sustainability 15 01008 g005
Figure 6. Nuclear magnetic resonance of the T2 spectrum.
Sustainability 15 01008 g006
Figure 7. Relationship between the compressive strength of the concrete at 28 d and the air content or porosity of the macroscopic pores.
Sustainability 15 01008 g007
Figure 8. Concrete pore radius distribution.
Sustainability 15 01008 g008
Figure 9. Graphs of the fit of the Atzent pore-structure–strength model.
Sustainability 15 01008 g009aSustainability 15 01008 g009b
Table 1. Performance of the cement.
Fitness (%)Initial SetFinal SetStability of VolumeLoss on IgnitionCompressive Strength (MPa)Rupture Strength, (MPa)
MinMin(%)3 d28 d3 d28 d
1.3135175Qualified1.0226.654.85.28.3
Table 2. Principal physical properties of the pumice.
Physical PropertiesBulk DensityPerformance DensityWater Absorption, 1 hCylinder Compressive StrengthCrush Index
Pumice Stone690 kg/ m 3 1593 kg/ m 3 16.44%2.978 MPa39.6%
Table 3. The main chemical composition of the S95 grade mineral powder (%).
CaO Al2O3SiO2CNa2OFe2O3MgOK2OOther
5294420.30.20.0528.42
Table 4. Concrete mixture ratio design.
GroupCement
(kg/m3)
Coal Ash
(kg/m3)
Slag
(kg/m3)
Lightweight Aggregate (kg/m3)Sand
(kg/m3)
Rubber Powder
(kg/m3)
Water
(kg/m3)
Water Reducer
(kg/m3)
B-0370100057072011.11603.7
B-5346.510023.557072011.11603.7
B-103231004757072011.11603.7
B-15299.510070.557072011.11603.7
B-202761009457072011.11603.7
B-25252.5100117.557072011.11603.7
B-3022910014157072011.11603.7
Table 5. NMR macroscopic pore peak areas.
GroupArea Under SpectrumMacroscopic Pore Peak Area
AreaPercent (%)
B-04160.74058.6661.41
B-54013.32558.9961.47
B-103624.69751.4711.42
B-152948.32237.4441.27
B-204185.86259.8581.43
B-254501.32967.0701.49
B-304793.85180.0431.67
Disclaimer/Publisher’s Note: The statements, opinions and data contained in all publications are solely those of the individual author(s) and contributor(s) and not of MDPI and/or the editor(s). MDPI and/or the editor(s) disclaim responsibility for any injury to people or property resulting from any ideas, methods, instructions or products referred to in the content.

