Article

Bi-Objective Optimization and Emergy Analysis of Multi-Distributed Energy System Considering Shared Energy Storage

1
School of Mechanical Engineering, Beijing Institute of Technology, Beijing 100083, China
2
Innovation Center in Chongqing, Beijing Institute of Technology, Chongqing 401120, China
3
Institute of Engineering Thermophysics, Chinese Academy of Sciences, Beijing 100190, China
*
Authors to whom correspondence should be addressed.
Sustainability 2023, 15(2), 1011; https://doi.org/10.3390/su15021011
Submission received: 10 December 2022 / Revised: 30 December 2022 / Accepted: 3 January 2023 / Published: 5 January 2023
(This article belongs to the Special Issue Reaching Net Zero—Energy Conversion and Storage Systems)

Abstract

:
Shared energy storage (SES) provides a solution for breaking the poor techno-economic performance of independent energy storage used in renewable energy networks. This paper proposes a multi-distributed energy system (MDES) driven by several heterogeneous energy sources considering SES, where bi-objective optimization and emergy analysis methods are used for the system’s optimal capacity planning and operating scheduling considering economic, environmental, and sustainable performances, and Nash bargaining is adopted for the reasonable distribution of benefits of MDES. Then, an energy system composed of four different DESs (distributed energy system) considering one Shared Energy Storage Operator (SESO) is taken as an example for further study, namely one to four shared energy storage multi-energy systems, where MDES with and without SESO are compared. The results reveal that the operation cost of MDES considering SESO and Nash bargaining is reduced by 3.03%, while all the distributed energy systems have lower operating costs, and SESO has an additional income of $142.4/day. Correspondingly, the emergy yield ratio, emergy sustainability index, and emergy investment ratio of the corresponding system increase by 5.15%, 3.83%, and 9.94%, respectively, wherein the environmental load rate increases by 1.67% because of the greater consumption reduction of renewable resources than that of non-renewable resources under the premise of reduced emergy consumption.

1. Introduction

The proposition of the sustainable development concept accelerates the large-scale development and utilization of renewable energy [1,2]. It is known that renewable energy is cost-saving and environmentally friendly, but new problems for renewable energy systems are piling up [3]. Both the uncertainty of renewable energy supply and dynamic energy consumption make it difficult to transmit, distribute, and dispatch energy. On the other hand, the spatial and temporal mismatch between the energy supply and energy demand is a huge issue for the new energy system [4]. With the ever-rising installed capacity of new energy, the traditional energy system struggles to address those problems. Alternatively, the multi-energy complementary distributed multi-energy system shows unique talents in finding the solution [5]. Under this context, energy storage technology is an essential way to achieve the dynamic energy match and reduce the impact of renewable energy on the grid [6,7].
Although energy storage is expected to solve the problems mentioned above, it is difficult to obtain the investment return from the energy storage system only by transferring power from off-peak periods to peak periods. Shared energy storage (SES) provides a solution for breaking the poor techno-economic performance of independent energy storage used in renewable energy networks [8]. Due to the complementarity of power generation and consumption behavior among different prosumers, the implementation of SES in the community can share the complementary charging and discharging demands among prosumers, further promote the consumption of renewable energy, and provide opportunities for prosumers to save costs. As a result, SES has generated significant global research interest and several real-world case studies of SES projects. For instance, the Sacramento Municipal Utility District (SMUD) [9] launched the first shared energy storage plan in the United States to accompany the dual-carbon target. The plan allowed SMUD commercial customers to invest and use remote energy storage systems even without installing energy storage. The multi-energy complementary energy storage power station in Qinghai Province of China adopted the strategies of bilateral negotiation and market bidding, which successfully improves the peak shaving capacity of the system, increases power generation, and solves the insufficient utilization of new energy [10]. As various SES stakeholders can promote the complementarity of multiple heterogeneous energy sources and avoid high individual investment costs, SES could be the future of global power markets. Therefore, designing an effective MDES considering SESO optimization and evaluation is the primary task to promote the commercialization of the SESO mechanism.
A host of studies have been conducted to design and optimize the shared energy storage system. For example, Lombardi et al. [11] compared the influence of different battery types on the shared energy storage system. It was concluded that a vanadium redox flow battery is suitable for a seasonal peak shaving system for long-term storage, whereas a lithium battery is suitable for a frequent charging and discharging system. Mignoni et al. [12] proposed two novel resolution algorithms, i.e., a coordinated and an uncoordinated one, based on a game theoretical control formulation. Those two algorithms can be alternatively used depending on the underlying communication architecture of the grid. Fathi and Bevrani et al. [13,14] studied the coordinated power dispatching of multiple interconnected distributed energy systems and considered the influence of demand uncertainty. They assumed that the grid operation is coordinated by grid operators while the distributed energy system is an independent individual. Dimitrov et al. [15] designed an iterative resource allocation mechanism through the negotiation process between users. It can be seen that designing an effective MDES considering SESO sizing and operations has become an important research focus.
Concerning the evaluation of multi-energy systems, a reasonable evaluation method and its index are the keys to the system’s optimal capacity planning and operating scheduling considering economic and environmental factors. Venkatesan and Scarabaggio et al. [16,17] evaluated the impact of energy storage on the distributed energy system through power flow variations between the source side and the load side. Adewumi et al. [18] investigated the effect of distributed Energy Storage Systems (ESSs) on the power quality of distribution and transmission networks and compared their power quality performance with a benchmark network. Zheng et al. [19] analyzed the impact of net-zero energy communities with energy flexibility and smart readiness on the network, utilities, and each participant from a techno-economic-environmental perspective. Choudhury [20] analyzed the impact of an energy storage system on a microgrid regarding the power and energy density, time of response, size, storage capacity, operational cost, life span, and selection of materials. Zhang et al. [21] evaluated the impact of shared energy storage on a residential area through real load and electricity prices data. All of those investigations validated the significance of the evaluation indicator system. A scientific and systematic performance evaluation indicator system is fundamental for the planning, design, and operation of an energy project.
Although sharing energy storage is promising to mitigate the investment problem in traditional energy systems and improve energy utilization, a series of difficulties remain to be solved in an MDES considering SES. Firstly, one must consider balancing benefits and costs between SESO and MDES. Secondly, it is important to ensure the reasonability of the benefit distribution of the MDES and improve the enthusiasm for participating in shared energy storage. Last but not least, the overall benefits of the system are difficult to evaluate due to its multi-dimensional characteristics. For example, bi-level optimization between the revenue of shared energy storage operators and the user cost leads to an oversized capacity of energy storage that fails to consider the investment return of energy storage equipment [22]. Unreasonable planning of user interests involved in energy storage systems induces low enthusiasm in users to use energy storage [23]. The entropy of the thermal storage system was analyzed in ref. [24], but the sustainability and return on investment of the whole system were ignored. Accordingly, the results cannot provide universal guidance for further investigations.
Based on these discussions, to reduce the cost of energy storage and improve the sustainability of the energy system, a one to four multi energy system considering a shared energy system is built, and then the double-objective optimization and energy value evaluation methods of a distributed energy system taking into account the shared energy storage are proposed to optimize and evaluate the performance of the energy system. The main contributions of this paper are as follows:
(1) Based on the concept of energy interconnection and sharing, a one to four shared energy storage multi-distributed energy system is constructed, in which the MDES covers the four users’ load differences in electricity, heat, and cold.
(2) In view of the trade-off between the increase in SESO revenue and the decrease in MDES cost, a planning scheduling method based on the Pareto non-inferior solution is proposed, which solves the trade-off between SESO and MDES and determines the optimal capacity of shared energy storage.
(3) Aimed at the problem of the uneven distribution of benefits of an MDES participating in SESO, the Nash bargaining model is used to optimize the distribution of benefits and promote the enthusiasm of different DESs participating in SESO.
(4) The emergy theory method is introduced to evaluate the system’s sustainability of the MDES after its Pareto optimization. Four typical emergy evaluation indicators are used.
The content of this paper is organized as follows: Section 2 presents a distributed energy system model based on SESO, namely a one to four shared energy storage multi-energy system. Section 3 formulates the solution scheme and emergy analysis method for the above energy system. Section 4 analyzes the impact of SESO and Nash bargaining on the MDES regarding the economy, the environment, and sustainability. Section 5 presents the main conclusions.

2. System Architecture and Models

2.1. Architecture of Shared Energy Storage System

The energy storage sharing framework is schematically shown in Figure 1, which consists of four DESs, one SESO, an energy information scheduling system (EISS), and the supporting power grid (PG) and gas network (GN). On the one hand, the four distributed energy systems are connected to each other, representing the typical energy consumption characteristics of residential houses, commercial hotels, office buildings, and shopping malls. It is assumed that the user’s heat load demand only occurs in winter, and the cold load demand only occurs in summer. There are electricity load requirements in winter, summer, and transition seasons, but different distributed multi-energy systems have different seasonal requirements. On the other hand, the power interconnection between two pairs of DESs can be realized through the power connection line according to individual power surplus, which is different from the operation mode of the independent energy storage built by each MDES. This can avoid the barriers of high investment and low return of independent energy storage and bridges the information and resources between independent DESs.
The MDES described in this paper adopts the operation mode of shared energy storage, that is, SESO provides lithium iron phosphate battery energy storage services with the capacity and energy sharing for four DESs at the same time. The SESO business model charges the flow fee when MDES stores electricity from the shared energy storage system or uses the stored electricity in the shared energy storage system. Meanwhile, the energy interaction between DESs can be realized by sharing the energy storage system. The cost is only generated from the interaction between the two DESs in the interactive charging mode.

2.1.1. SESO Model

SESO provides energy storage capacity for MDES, and profits are achieved by charging fees when MDES uses energy storage capacity to charge and discharge. SESO income CSESO is determined by income and cost [22].
C S E S O   =   C S E S O 1 C S E S O 2 C S E S O 3 ,
where CSESO1 is the operating income of SESO, which is determined by λSESO and PtSESO,c/d. It should be noted that the decision variable is the real number PtSESO,c/d. CSESO2 is the construction cost of SESO and CSESO3 is the maintenance cost of SESO [22]
C S E S O 1   =   λ S E S O t = 1 T ( P S E S O , c t + P S E S O , d t ) C S E S O 2   =   ( λ S E S O , P P S E S O max + λ S E S O , U U S E S O ) × r   ×   ( 1 + r ) p S E S O 365 ( ( 1 + r ) p S E S O 1 ) ,
where λSESO is the unit power rental cost, PtSESO,c/d is the power of MDESi charging/discharging with SESO, λSESO,P/U is the unit power/capacity cost of SESO, PMAXSESO /USESO is the maximum power/capacity of SESO, r is the interest rate, and pSESO is the operation cycle of SESO.
During operation, the SESO system must satisfy the battery state of charge constraints, battery charging and discharging power constraints, battery capacity, and power constraints [22]:
E S E S O t + 1 = E S E S O t + i = 1 n ( η c / d P S E S O , c i / d i t ) Δ t 0.1 U S E S O E S E S O t 0.9 U S E S O E S E S O 0 = E S E S O T 0 P S E S O , c i t P S E S O max P S E S O max P S E S O , d i t 0 P S E S O max = α U S E S O ,
where EtSESO is the capacity of SESO at time t, ηc/d represents the charging/discharging efficiency of SESO, PtSESO,c/d is the power of DESi charging/discharging with SESO, and α is the proportional coefficient between the maximum power and the maximum capacity of SESO.

2.1.2. Power Interaction Model between DESs

When DESi interacts with DESj, the purchaser needs to pay a certain purchase cost to the seller. The interaction cost between DESi and DESj is expressed by Equation (4), where Pti,j is the decision variable [22]:
C M i t = λ M t P i , j t Δ t C M j t = λ M t P i , j t Δ t ,
where Pti,j is the decision variable, CtM and, CtMi are the respective interaction costs of DESi and DESj when interacting with each other, λtM is the unit interaction power costs between DESs, and Pti,j represents the interaction power, which must satisfy the following constraints [22]:
P i , j max P i , j t P i , j max ,

2.2. MDES Model and Cost Model

We take residential houses DES as an example, which consists of a photovoltaic panel (PV), combined heat and power generation (CHP), an electric boiler (EB), absorption refrigeration (AC), and electric compression refrigeration (EC). The schematic diagram is shown in Figure 2.

2.2.1. DES Energy Model

In DES, AC and EC meet the demand of the cold load, CHP and EB meet the demand of the heat load, EG, CHP, and PV meet the demand of the electric load, and the redundant electricity can be sold to other systems or stored through SESO services. The constraints of each unit are shown in Table 1.

2.2.2. DES Cost Model

In the mode without SESO, the cost of a single DES includes the equipment construction cost Cbi, equipment maintenance cost Cmi, electricity purchase cost CEgi, and gas purchase cost Cgas [22].
The construction cost of equipment X (CHP, EB, AC, EC, PV) in the ith DES, denoted as Cb,Xi, is calculated as
C b , X i = C b , X i U λ X i U X i r ( 1 + r ) T X i 365 [ ( 1 + r ) T X i 1 ] ,
where Cb,Xi is the construction cost of equipment X (CHP, EB, AC, EC, PV) in the ith DES, CUb,Xi is the unit construction cost of equipment X, UXi is the installation scale of equipment X, and TXi is the operation cycle of equipment X [22].
The maintenance cost of equipment X, Cm,Xi, is formulated by
C m , X i = f m C b , X i ,
where fm is the proportion coefficient of the maintenance cost and construction cost [22].
The electricity purchase cost expressed as CEGi is formulated by
C EG i = p EG t P EG i t ,
where ptEG is t timing of power grid electricity price [22].
Lastly, the gas purchase cost Cgas is
C gas i = p gas P CHPe i t η CHPe i Q LHV ,
where pgas is the unit price of natural gas and QLHV is the low heating value of natural gas.
Assuming that the pipeline network, pre-planning, and other cost inputs are ignored, the total cost of DES CDES_all can be obtained by the following equation [22]:
C D E S _ a l l = i = 1 4 ( C b i + C m i + C E G i + C g a s i ) ,
In the case of shared energy storage access, the DESi increases the interaction cost CSESOi with SESO and the interaction cost CI with other DESs compared with the system without SESO [22].
C D E S = i = 1 4 C E G i + C g a s i + C S E S O i + C I ,
Since the optimization objective is the sum of DES costs, an optimal total cost with an increase in individual DES costs is possible. To ensure the interests of each DES, cost constraints need to be added [22].
C D E S i C D E S i _ i s o ,
where CDESi_iso is the operation cost of DESi without SESO and CDESi is the operation cost of the ith DES considering SESO.

3. Solution Process and Evaluation Method

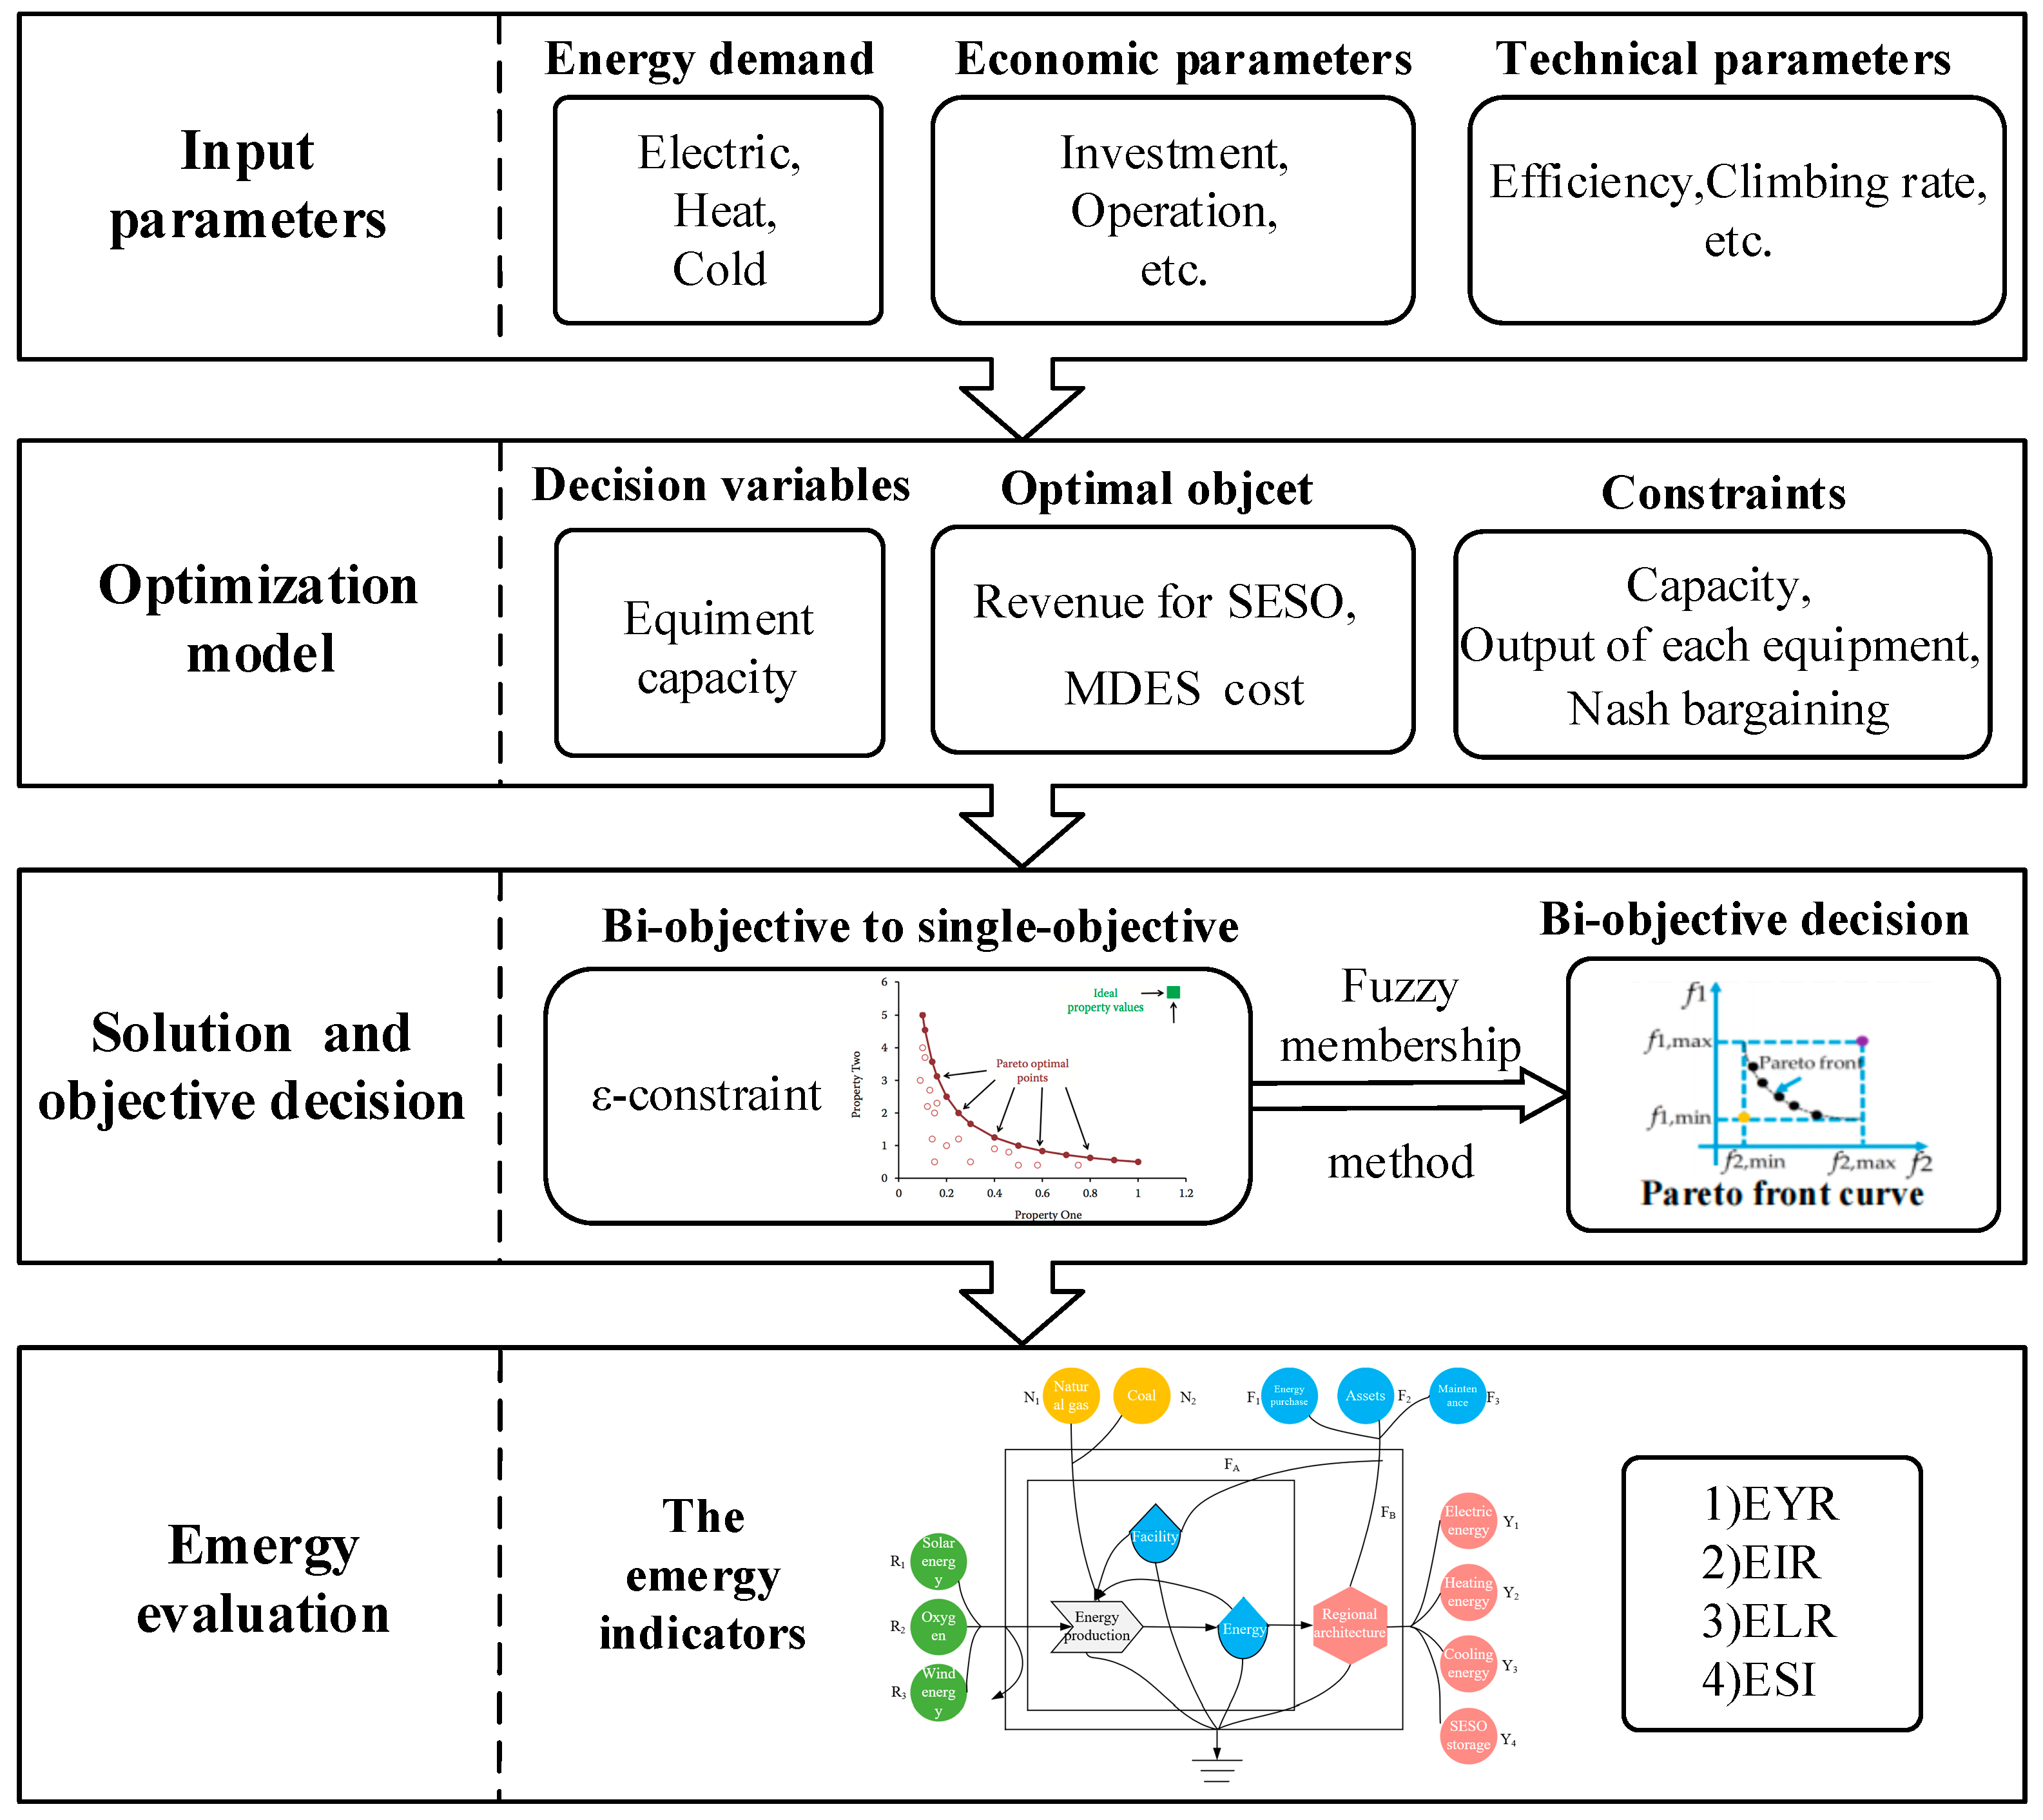
Although intelligent algorithms such as the genetic algorithm and the ant colony algorithm can directly solve the above bi-objective optimization model, the resulting Pareto front curve is not smooth and does not easily fall into a local optimum [4]. The essence of this bi-objective optimization model is a mixed integer nonlinear programming problem. This section introduces a solution algorithm by transforming the original problem into a convex programming problem. All simulations are performed in MATLAB using CPLEX, installed on a middle-end machine equipped with an AMD Ryzen 7 4800U, 4.20 GHz (8 cores) CPU, and 16 GB of RAM. The running time is 180 s. The solution process is shown in Figure 3.
Firstly, the basic parameters of the model include the user load demand and equipment technical and economic parameters. Secondly, the operation constraints and system energy balance are established, and the operation cost of DES is discussed by Nash bargaining. The non-inferior solution set of the optimization model is obtained by using the ε-constraint method. Then, the fuzzy membership function method is used to find the optimal solution. Finally, a comprehensive evaluation of the obtained results considering the environment, the economy, and sustainability is carried out using the emergy analysis method.

3.1. System Pareto Solutions

The ε-constraint method transforms bi-objective optimization into solvable single-objective optimization by selecting a principal objective function from the optimization objective and taking other objectives as constraints. In this paper, the average daily operating cost of MDES (CMDES_avg) is taken as the main objective in the bi-objective optimization, and constraints are added to the average daily revenue of SESO (CSESO_avg) to solve the Pareto front curve of CMDES_avgCSESO_avg, and then the Pareto curve is solved by setting different constraints. The bi-objective optimization problem is described in Equation (13) [26].
min i = 1 m f 1 ( x ) st .   h u ( x ) 0 , u = 1 , 2 , , v f 2 ( x ) ε 2 ,
where f1(x) is the main optimization objective (CMDES_avg); hu (x) is the original constraint; f2 (x) is the target converted into constraint (CSESO_avg); ε2 is the constraint to be satisfied.
Usually, f2 (x) is divided into n equidistant points and constrained one by one [26].
ε 2 = f 2 , min + q f 2 , max f 2 , min n , q = 0 , 1 , , n ,

3.2. Nash Bargaining of DESs

When the optimization goal is to minimize CMDES_avg, there may be a small number of DESs with a lower cost reduction or an equal cost. In order to improve the enthusiasm of DESs’ participation, it is necessary to rationally allocate their costs. In this paper, the Nash bargaining method [27] is used to allocate the cost between DESs. The specific process is as follows: CDESi_iso is used as the negotiation break point of Nash bargaining; after negotiation, with the objective of maximizing the product of the difference between the operating costs after DES negotiation and the operating costs without sharing energy storage, the operating costs accepted by all DESs are the Nash bargaining solution. This method can simultaneously satisfy the four properties of symmetry, Pareto optimality, independent and irrelevant selection, and linear transformation invariance. The specific expression is
max i = 1 n C D E S i _ i s o C i   s . t .   C i C D E S i _ i s o ,
where Ci is the operation cost of the ith DES after participating in Nash bargaining of communicating energy storage and interacting with no charge in a cycle. Considering that Equation (15) is a non-convex nonlinear problem, it is decomposed into two convex sub-problems by the method in Reference [28]. The decomposed sub-problems are as follows:
min i = 1 n C i ,
max i = 1 n ln C M D E S i _ i s o C i + Z i ,

3.3. Bi-Objective Solution Process

The flow chart of the bi-objective optimization solution in this paper is shown in Figure 4. Firstly, m USESO and n bi-objective optimization nodes are set. Under a certain capacity, the optimization is carried out with the single objective of CSESO_avg and the single objective of CMDESi, respectively. After obtaining the maximum value and minimum values of CSESO_avg, the revenue range is divided into n equal parts for single-objective optimization with CMDESi as the goal. After traversing m USESO to obtain the Pareto front curve, we the select appropriate USESO and solve the Pareto optimal solution using the fuzzy membership method.

3.4. System Sustainability Analysis Based on Emergy Theory

The planning, design, and operation of an MDES need a scientific and systematic performance evaluation index system. However, an MDES is characterized by the coupling of various energy forms such as cold, heat, and electricity, high technical complexity, and a multi-agent mutual game, which introduces challenges to performance evaluation indexes. It is difficult to evaluate an MDES via energy efficiency evaluation or exergy analysis alone. The emergy theory proposed by American biologist Odum can unify all kinds of energies or substances into solar energy through the emergy conversion rate (the solar energy value of each unit of energy or substance, that unit for solar joule (sej)), thus solving the problem that it is difficult to make quantitative analysis and comparison between different subjects or energies [29].
In this paper, four DESs are regarded as a whole for research in the emergy analysis, and the emergy diagram is shown in Figure 5. For the power grid, since power sources include thermal power generation and various new energy generation, the power grid purchase is calculated according to the proportion of each generation mode.
Emergy values of local renewable energy R, emergy values of non-renewable energy N, emergy values of purchased energy and services F, and emergy values of output energy products Y are as follows [30]
R = i R i × Tr i i = 1 , , n ,
N = i N i × Tr i i = 1 , , n ,
F = i F i × Tr i i = 1 , , n ,
Y = i Y i × Tr i i = 1 , , n ,
where Tri is the transform rate of emergy.
The emergy indicators used for system evaluation in the current study are as follows:
(1) Environmental load ratio (ELR): The ELR represents the ratio of the sum of N and F to R. It can reflect the pressure index of the energy system on the environment. The higher the value, the more pressure the system exerts on the surrounding environment. The ELR is defined as Equation (22) [30]:
E L R = ( F + N ) / R ,
(2) Emergy yield ratio (EYR): The EYR represents the ratio of Y to F. The larger the value is, the higher the production efficiency and emergy return of the system is. The EYR is defined as Equation (23) [30]:
E Y R = Y / F ,
(3) Emergy sustainability index (ESI): The ESI represents the ratio of EYR to ELR. The larger the sustainability index, the smaller the pressure on the environment when the output energy value is the same. The ESI is defined as Equation (24) [30]:
E S I = E Y R / E L R ,
(4) Emergy investment ratio (EIR): The EIR represents the ratio of F to local input energy (R and F). The higher the value is, the higher the level of economic development is and the lower the dependence on environmental resources is. The EIR is defined as Equation (25) [30]:
E I R = F / ( R + N ) ,
The emergy conversion rates listed are shown in Table 2.

4. Results and Discussion

4.1. The Impact of SESO on MDES

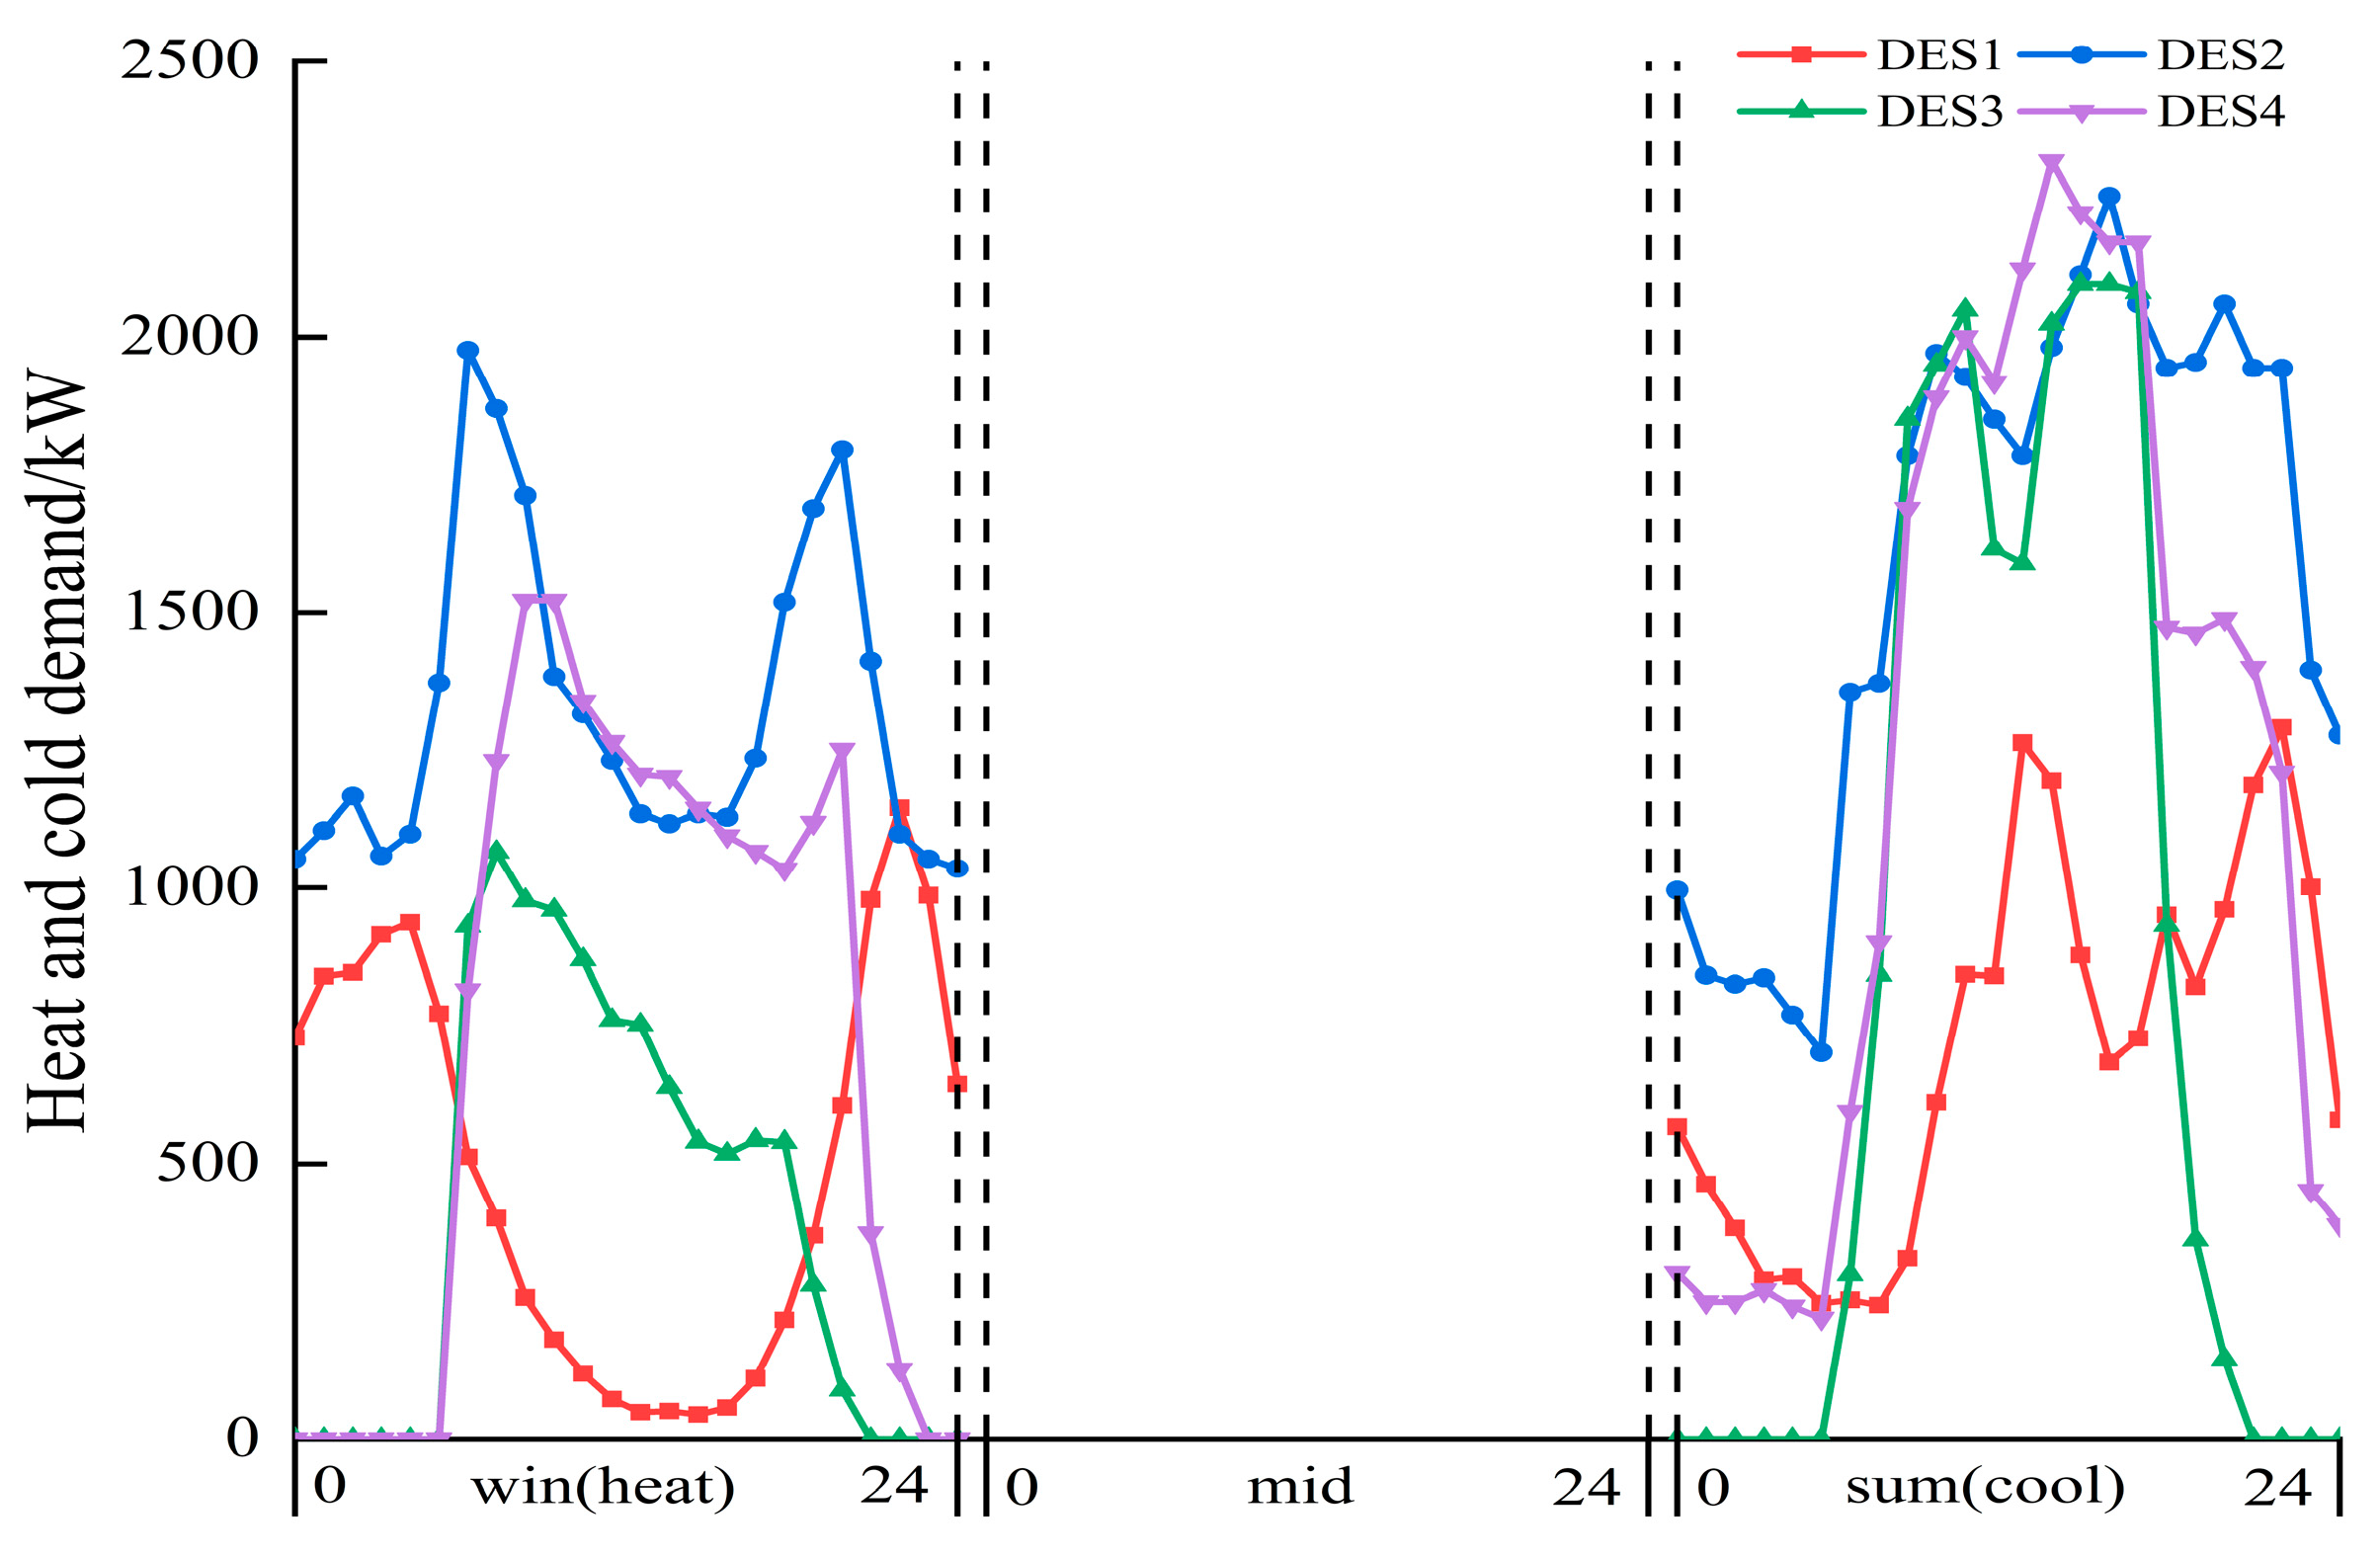
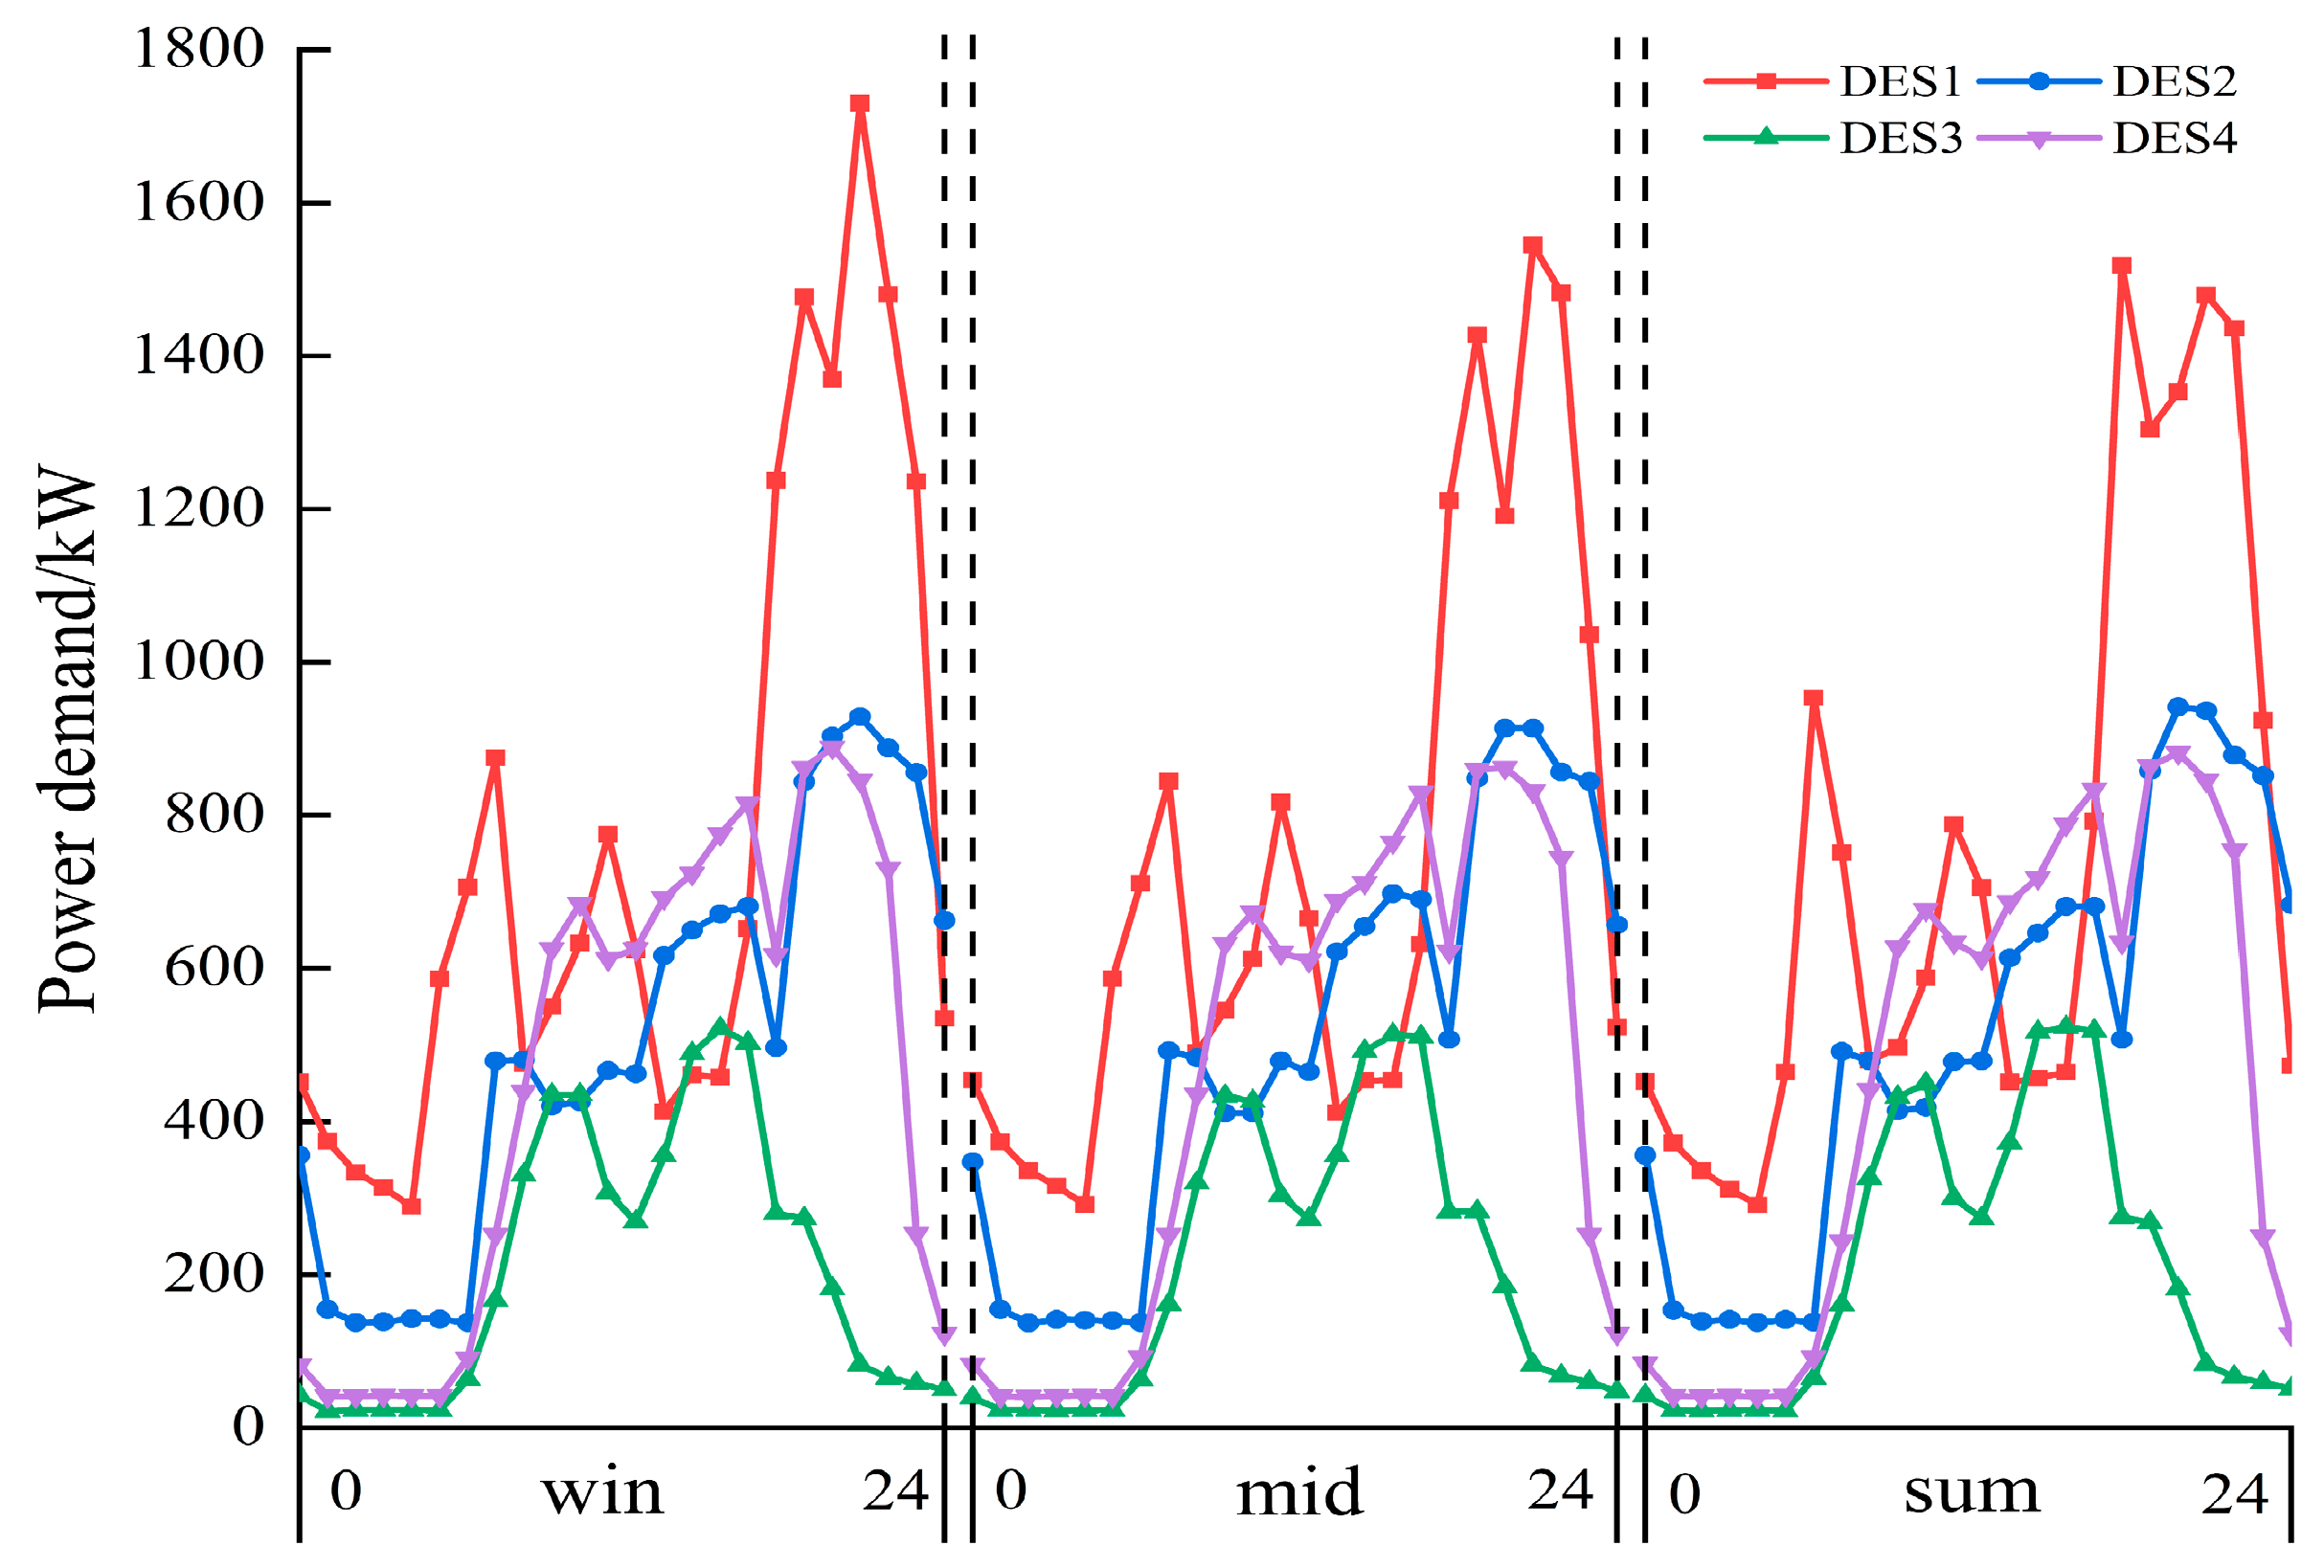
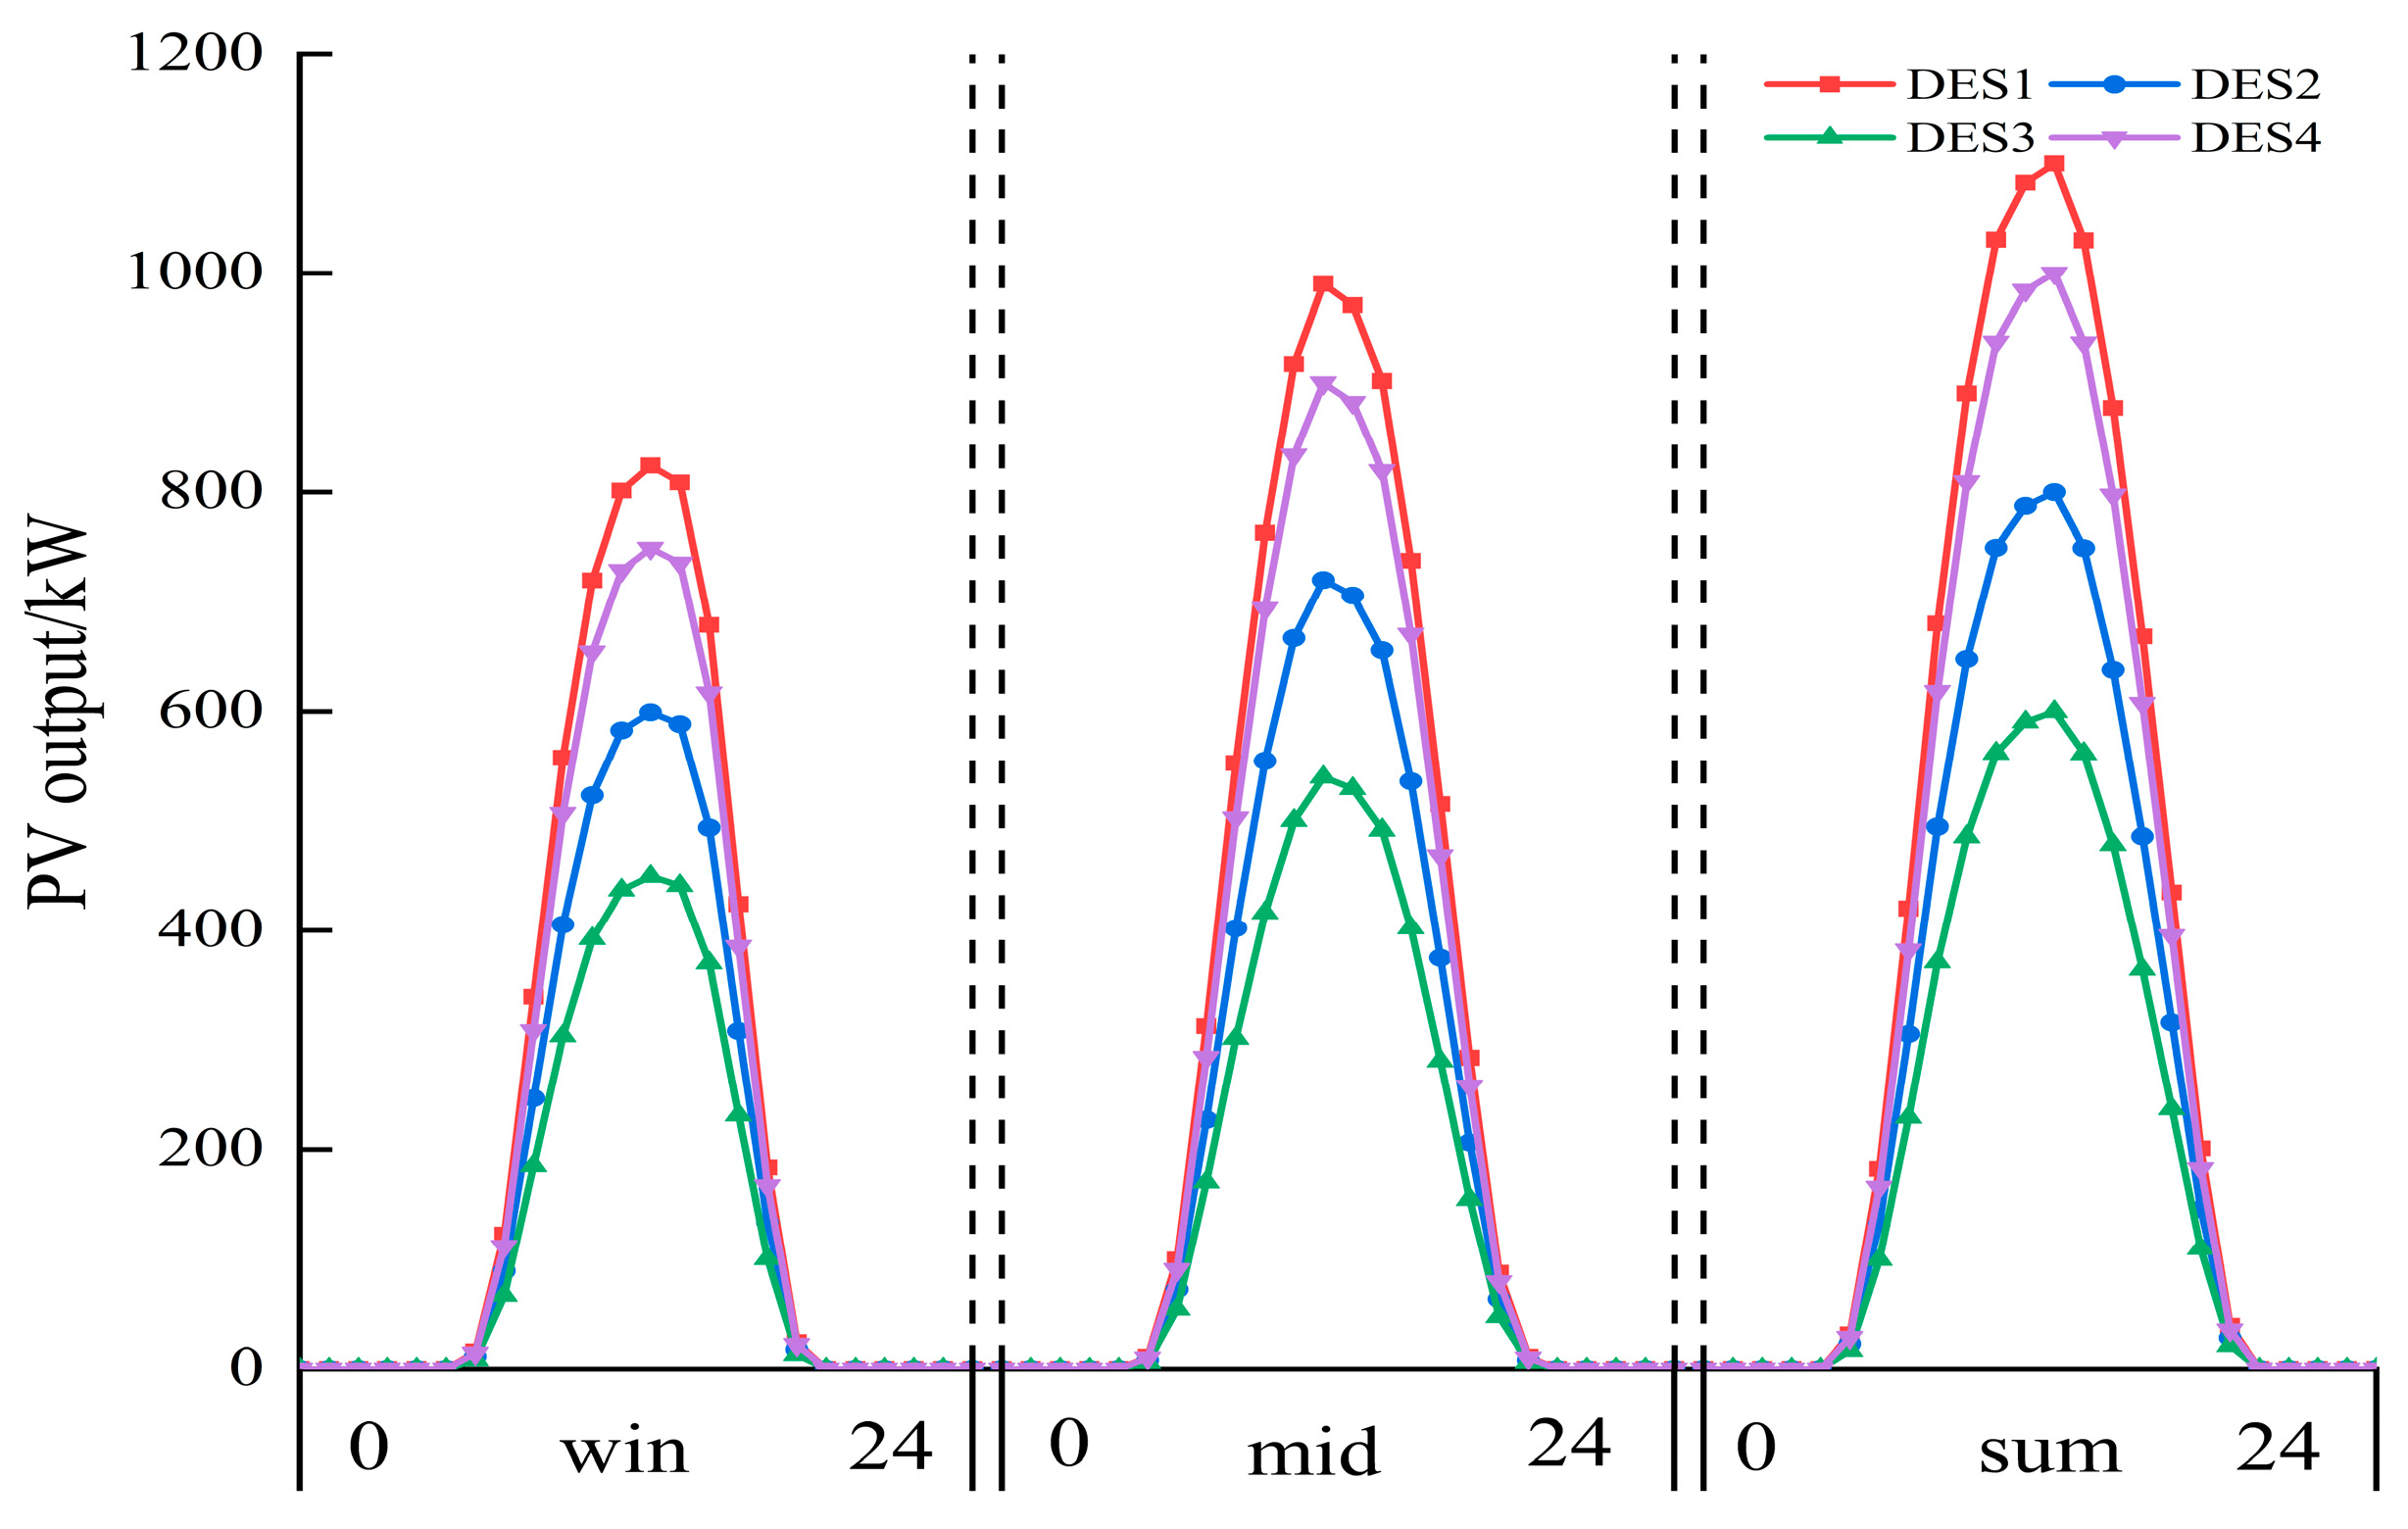
The cooling, heating, and power load requirements of the four DESs considering SESO are shown in Figure 6 and Figure 7. At the same time, according to the local typical daylight, temperature, and energy system construction area planning, the PV unit output curve is shown in Figure 8, and the grid price is shown in Figure 9. Among them are winter (December–February, 90 days), the transitional season (March–May, September–November, 183 days), and summer (June–August, 92 days) [25]. The parameters are shown in Table 3. The capacity planning here determines the optimal equipment installed capacity of MDES without SESO. This is the foundation for the optimization of MDES considering SESO. Specifically, the annual total cost of MDES consists of annual construction, maintenance, and annual operation costs. Among them, the annual construction and maintenance costs are determined by the installed capacity, and the annual operation cost is the sum of the single-day operation cost of each season multiplied by the corresponding days. Figure 10 shows the optimal installation scale of each MDES when taking the total annual cost of MDES as the optimization objective. CMDES_avg is 25,826 $ in this mode.
Adding SESO to the above MDES will result in changes in operating costs. The sensitivity analysis of energy storage capacity is the premise for achieving a win–win situation between SESO and MDES. The optimization objective of case 1 is CMDES_avg, and the optimization objective of case 2 is CSESO_avg. Figure 11 presents the influence of the capacity change of a shared energy storage system on CMDES_avg and CSESO_avg under different optimization objectives.
Figure 11 tells that when CMDES_avg is taken as the optimization objective, CMDES_avg decreases continuously with the increase in the capacity of SESO, but the decreased amplitude of CMDES_avg gradually attenuates due to the marginal effect. When taking CSESO_avg as the optimization objective, with the increase in the capacity of the shared energy storage system, CSESO_avg shows a trend of first increasing and then decreasing, which is due to the need for CMDES_avg to be less than the cost without the introduction of shared energy storage. With the increase in the shared energy storage capacity, the MDES cannot provide the cost of balancing the capacity increase after exceeding a certain capacity due to cost constraints, which leads to a decrease in CSESO_avg. CSESO_avg and CMDES_avg are two opposite optimization variables, which require reasonable planning of the energy storage capacity and the benefits and costs of both parties.
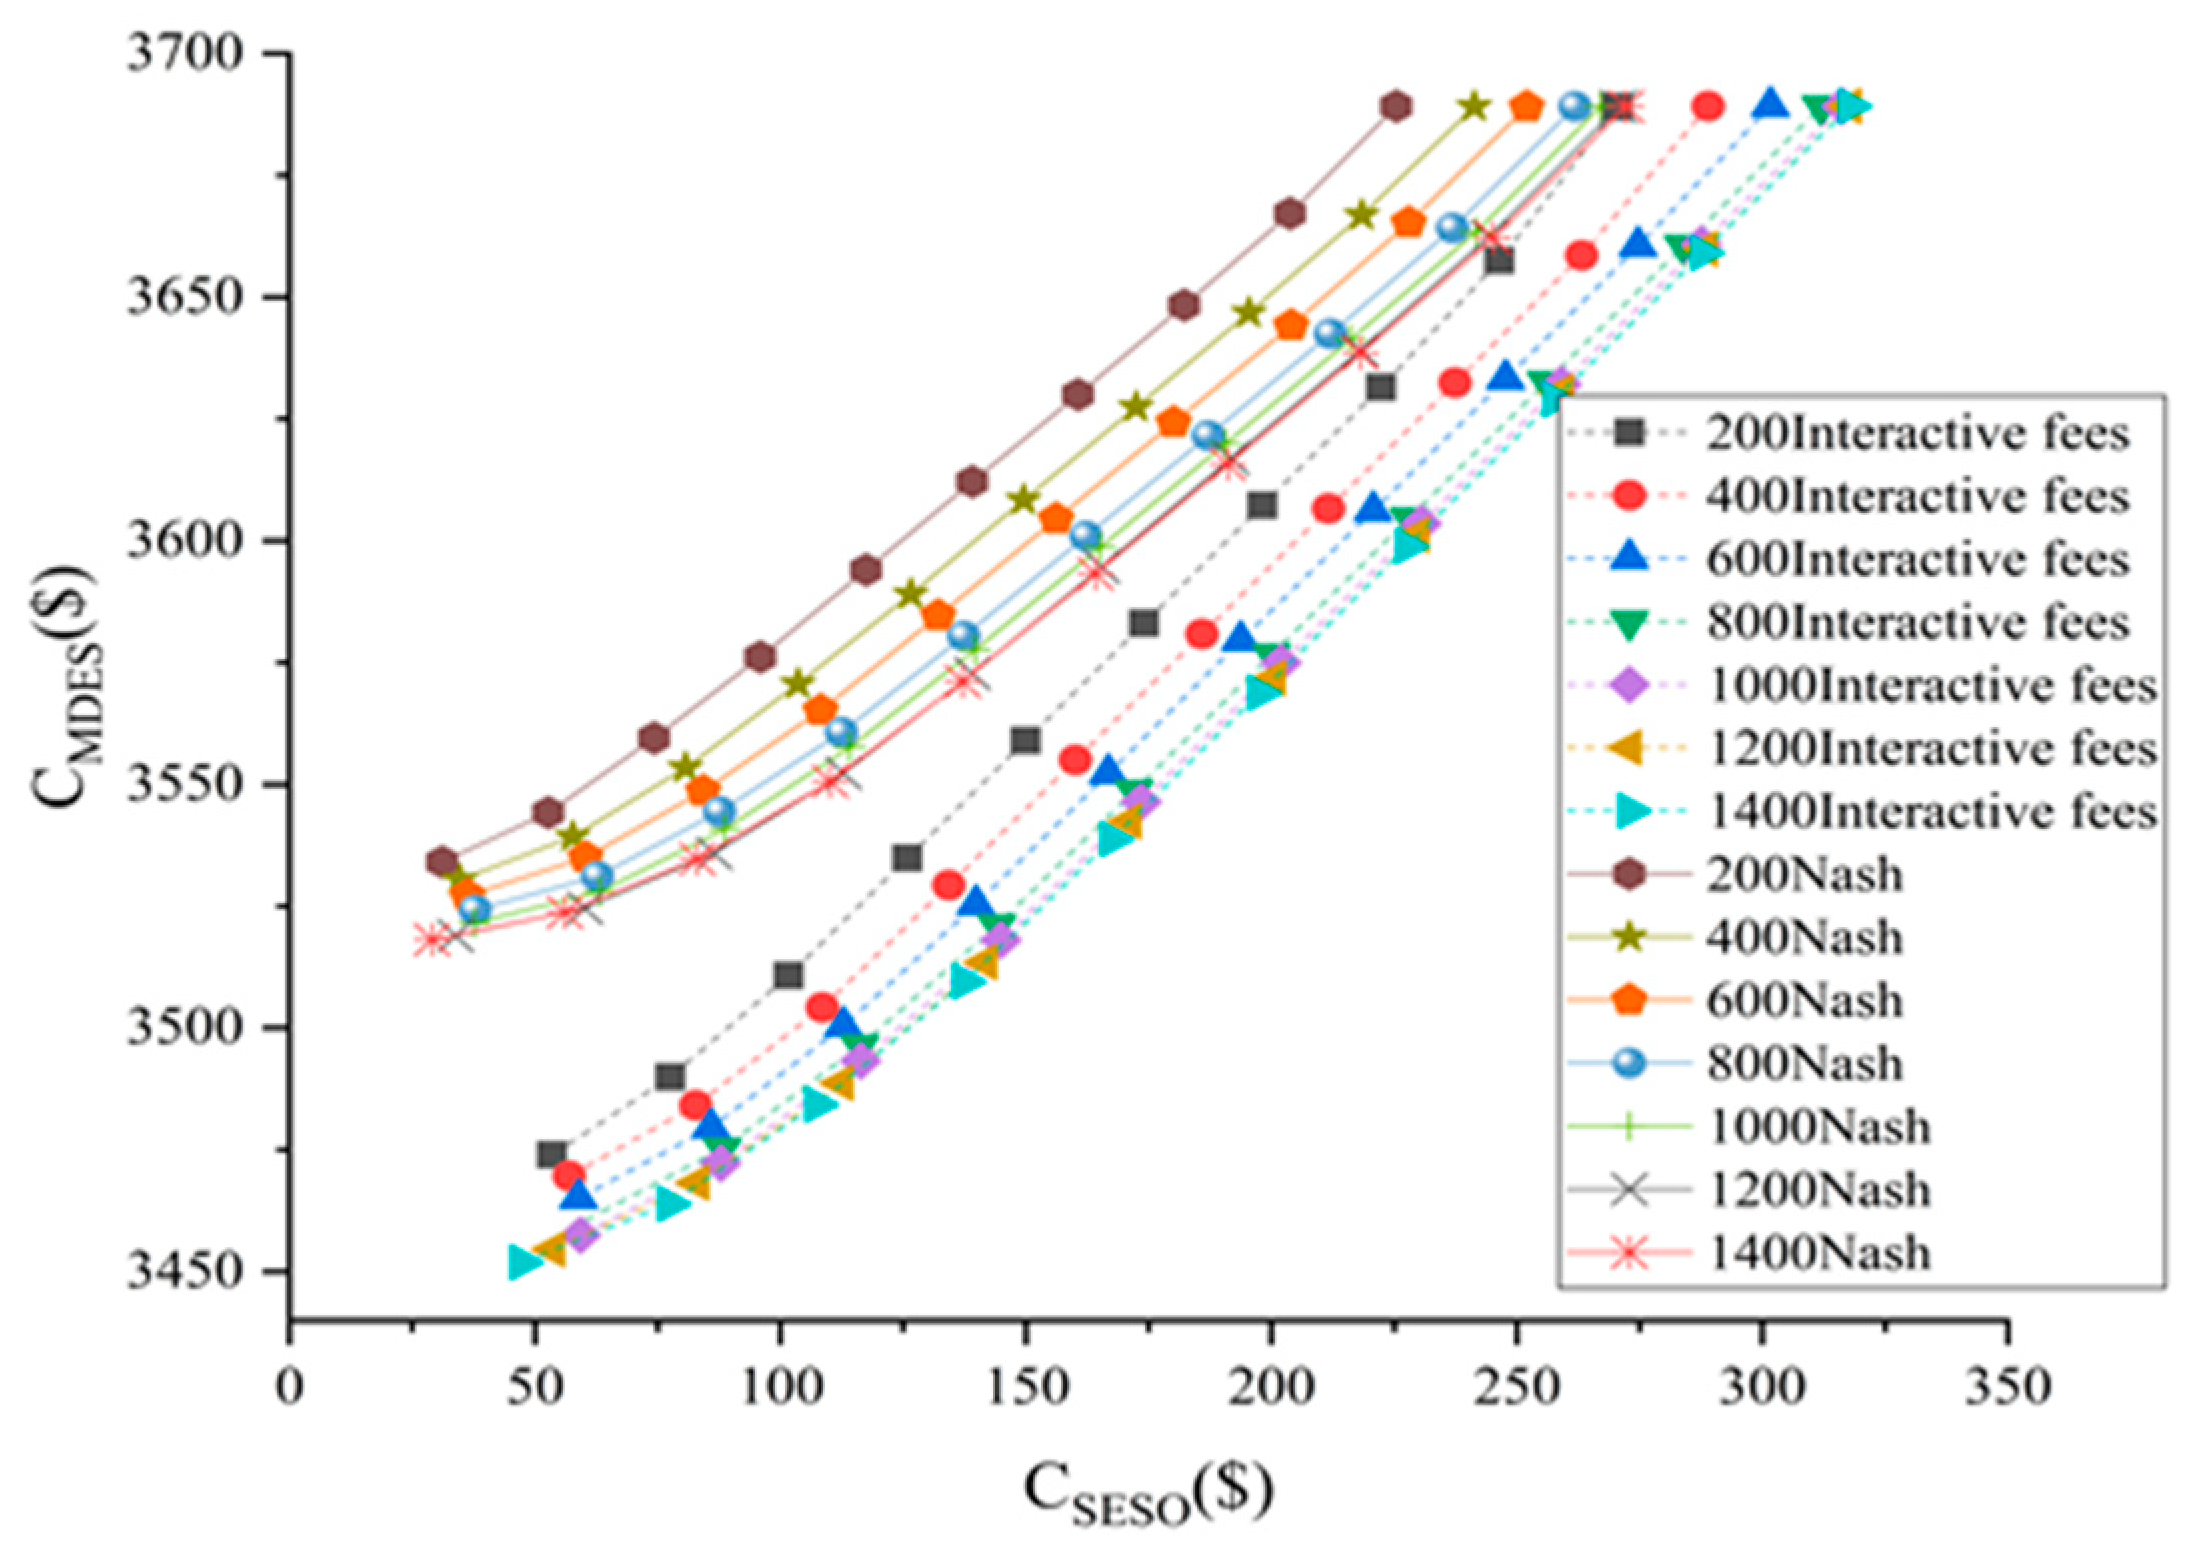
In order to obtain the win–win results of comprehensive consideration of CSESO_avg and CMDES_avg, the main objective function method is used to solve the front curve of CMDES_avg (p, q)-CSESO_avg (p, q) via Nash bargaining between the micro energy networks with and without interactive charges, as shown in Figure 12.
It can be found that with the increase in the capacity of SESO, the Pareto front curves obtained under each mode are close to the optimal solution, and the trend of proximity slows down with the increase in capacity. For example, when the capacity of the shared energy storage system is 200 kW·h under the Nash bargaining mode, the result is $3529.9 when the optimization goal is CMDES_avg and $225.4 when the optimization goal is CSESO_avg. When the capacity of the shared energy storage system is 600 kW·h, the results are $3523.4 when the optimization goal is CMDES_avg and $252.0 when the optimization goal is CSESO_avg, which are better than the results of the shared energy storage system capacity of 200 kW·h. However, with the increase in the capacity of the shared energy storage system, the optimization effect is gradually weakened. When the capacity of the shared energy storage system increases to 1000 kW·h, the optimization result is $3517.7 when the optimization goal is CMDES_avg and $267.1 when the optimization goal is CSESO_avg. The change trend of the Pareto front curve with energy storage capacity is the same when the MDES charges for interaction with Nash bargaining. However, due to the balance of interests among multiple subjects, the restriction conditions for energy interactions increase, resulting in the Pareto front curve moving to the theoretical worst point compared with the interaction charge. After the capacity of the shared energy storage system increases to 1000 kW·h, their Pareto curves approximately coincide. For the consideration of the equipment investment recovery cycle, the capacity of the shared energy storage system is 1000 kW·h.
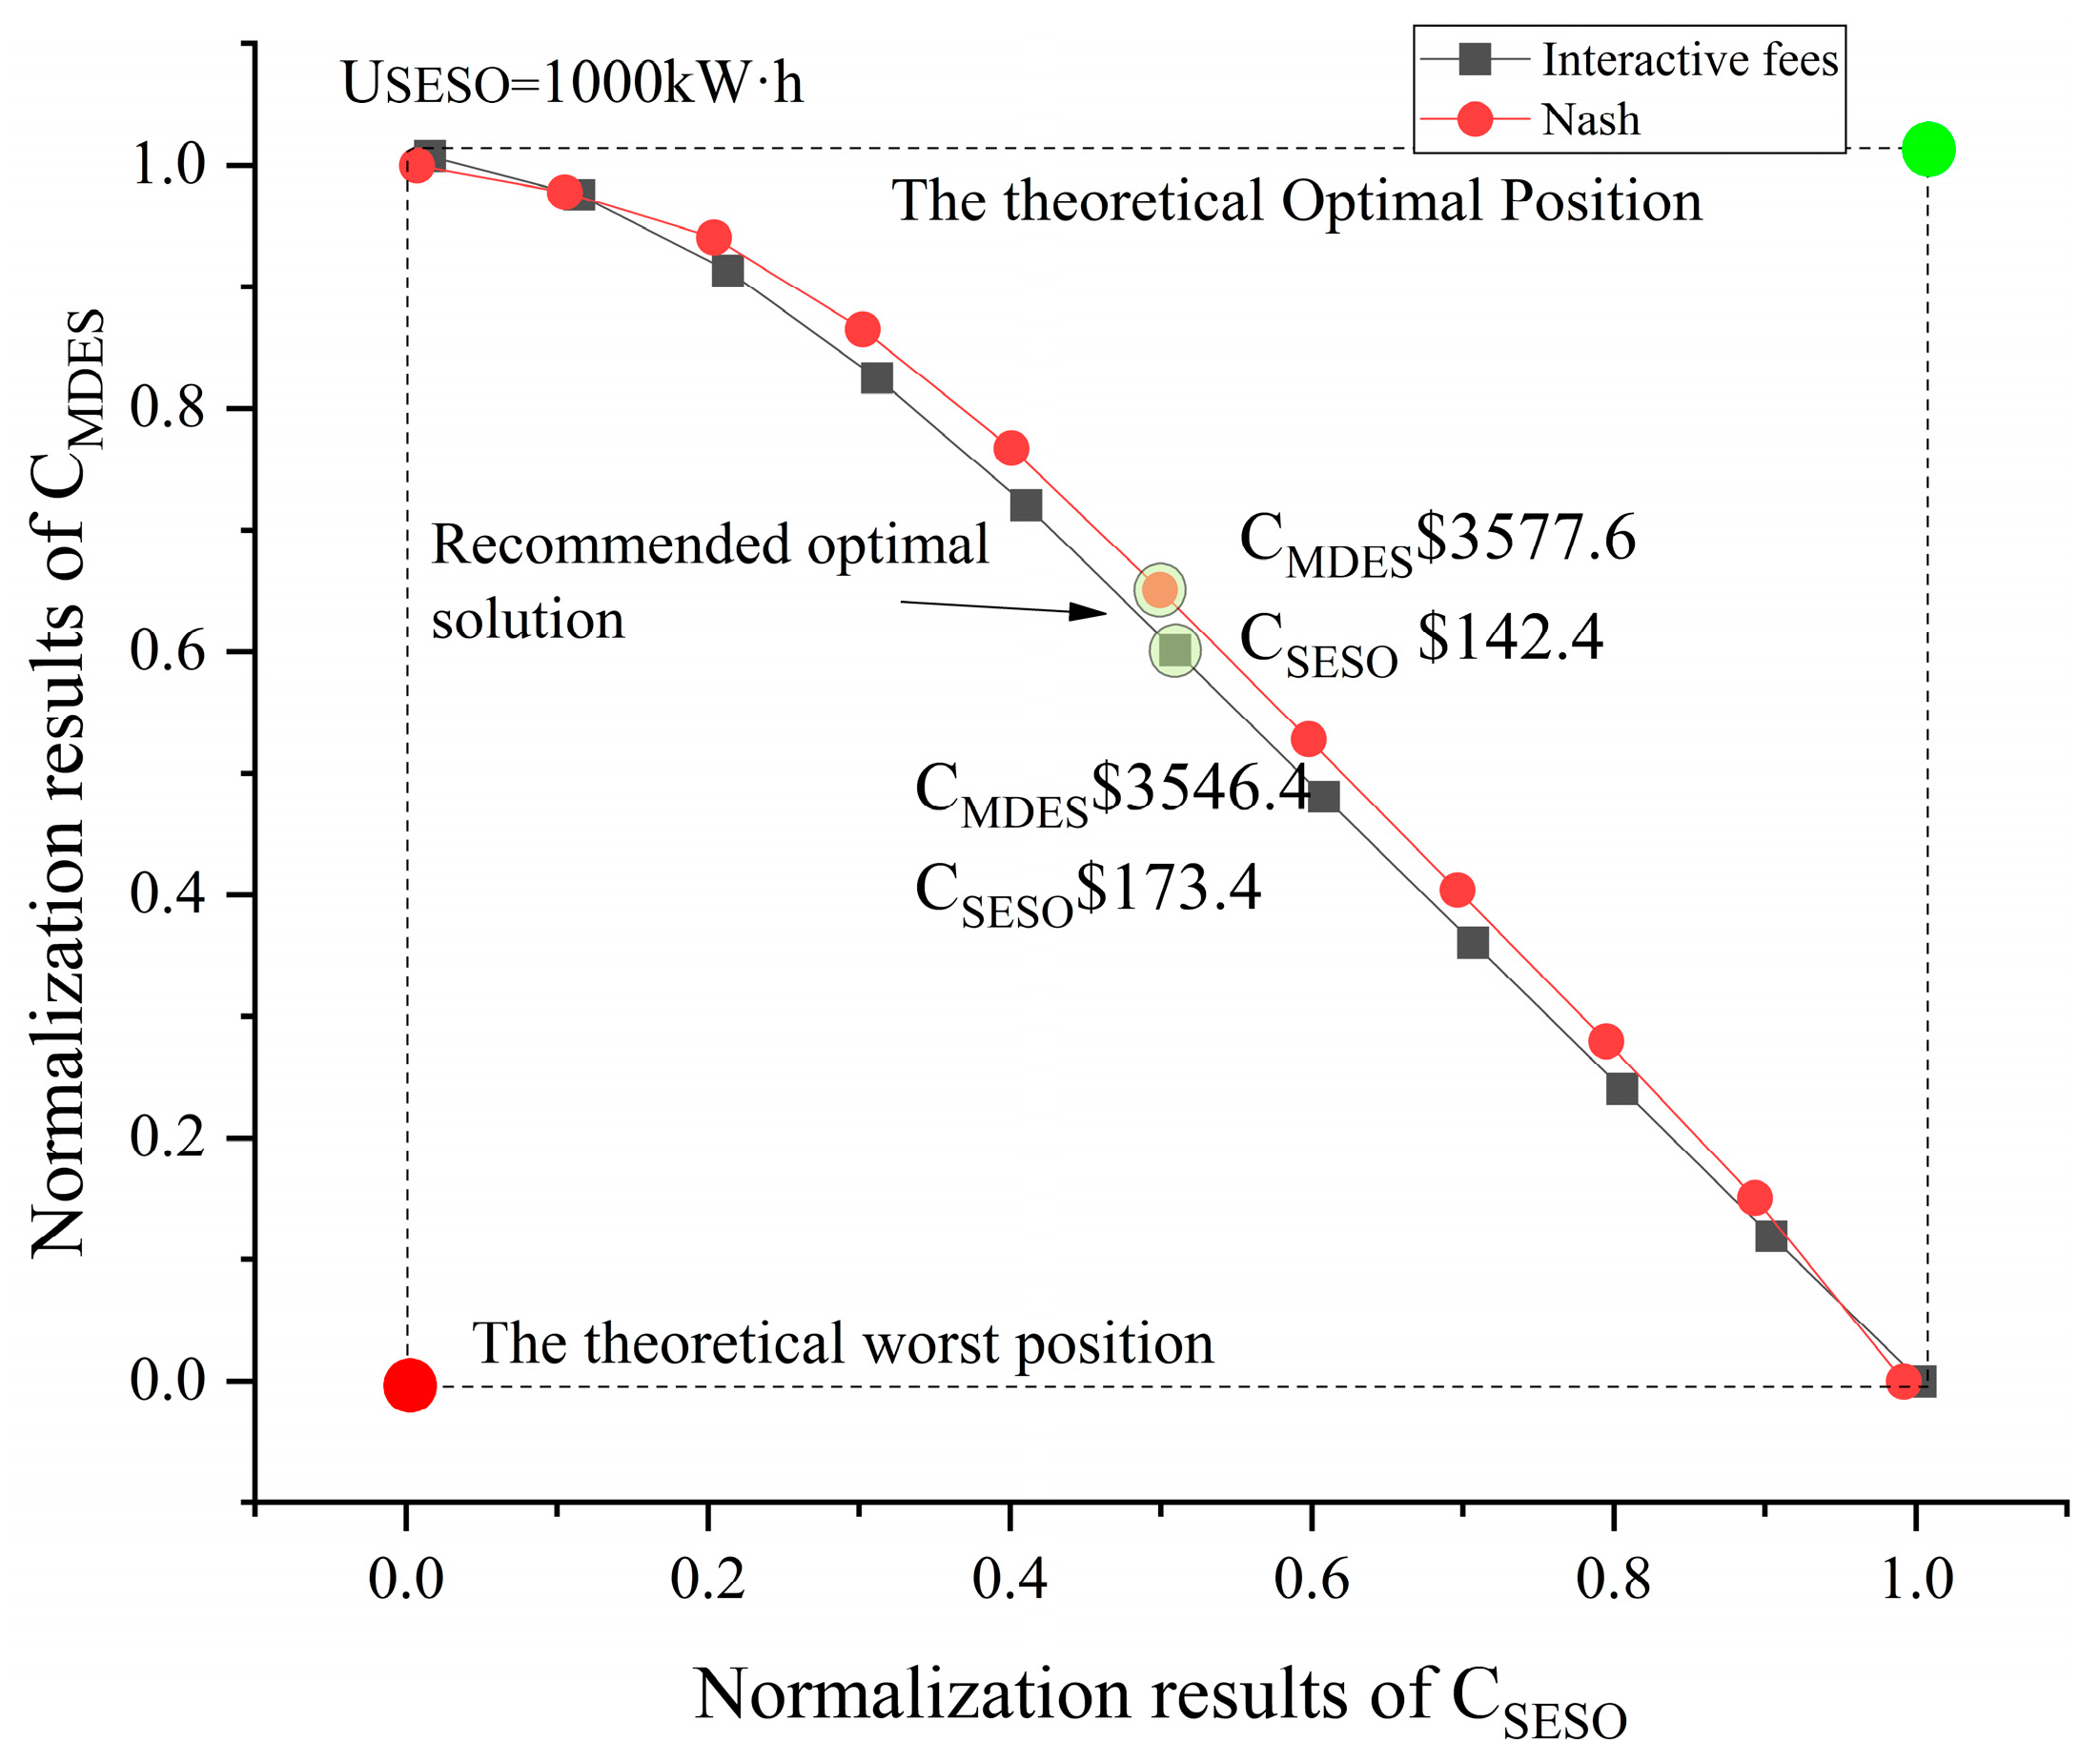
Due to the different scales of different objective functions, it is difficult to directly obtain the optimal solution representing the deviation between the actual objective and the optimal objective from the Pareto front. The fuzzy membership method can represent the deviation degree between the actual target and the optimal target, and the membership degree of the objective function is calculated by the linear method.
When the energy storage capacity is 1000 kW·h, the membership curves of the two modes are shown in Figure 13. According to the simulation calculation, under the interactive charging mode, the recommended optimal solution is $3546.4 for the total cost of the MDES system and $173.4 for the revenue of the shared energy storage system; under the Nash bargaining model, the recommended optimal solution is $3577.6 for the total cost of MDES system and $142.4 for the revenue of shared energy storage system. The cost of MDES in both modes is lower than that without SESO.
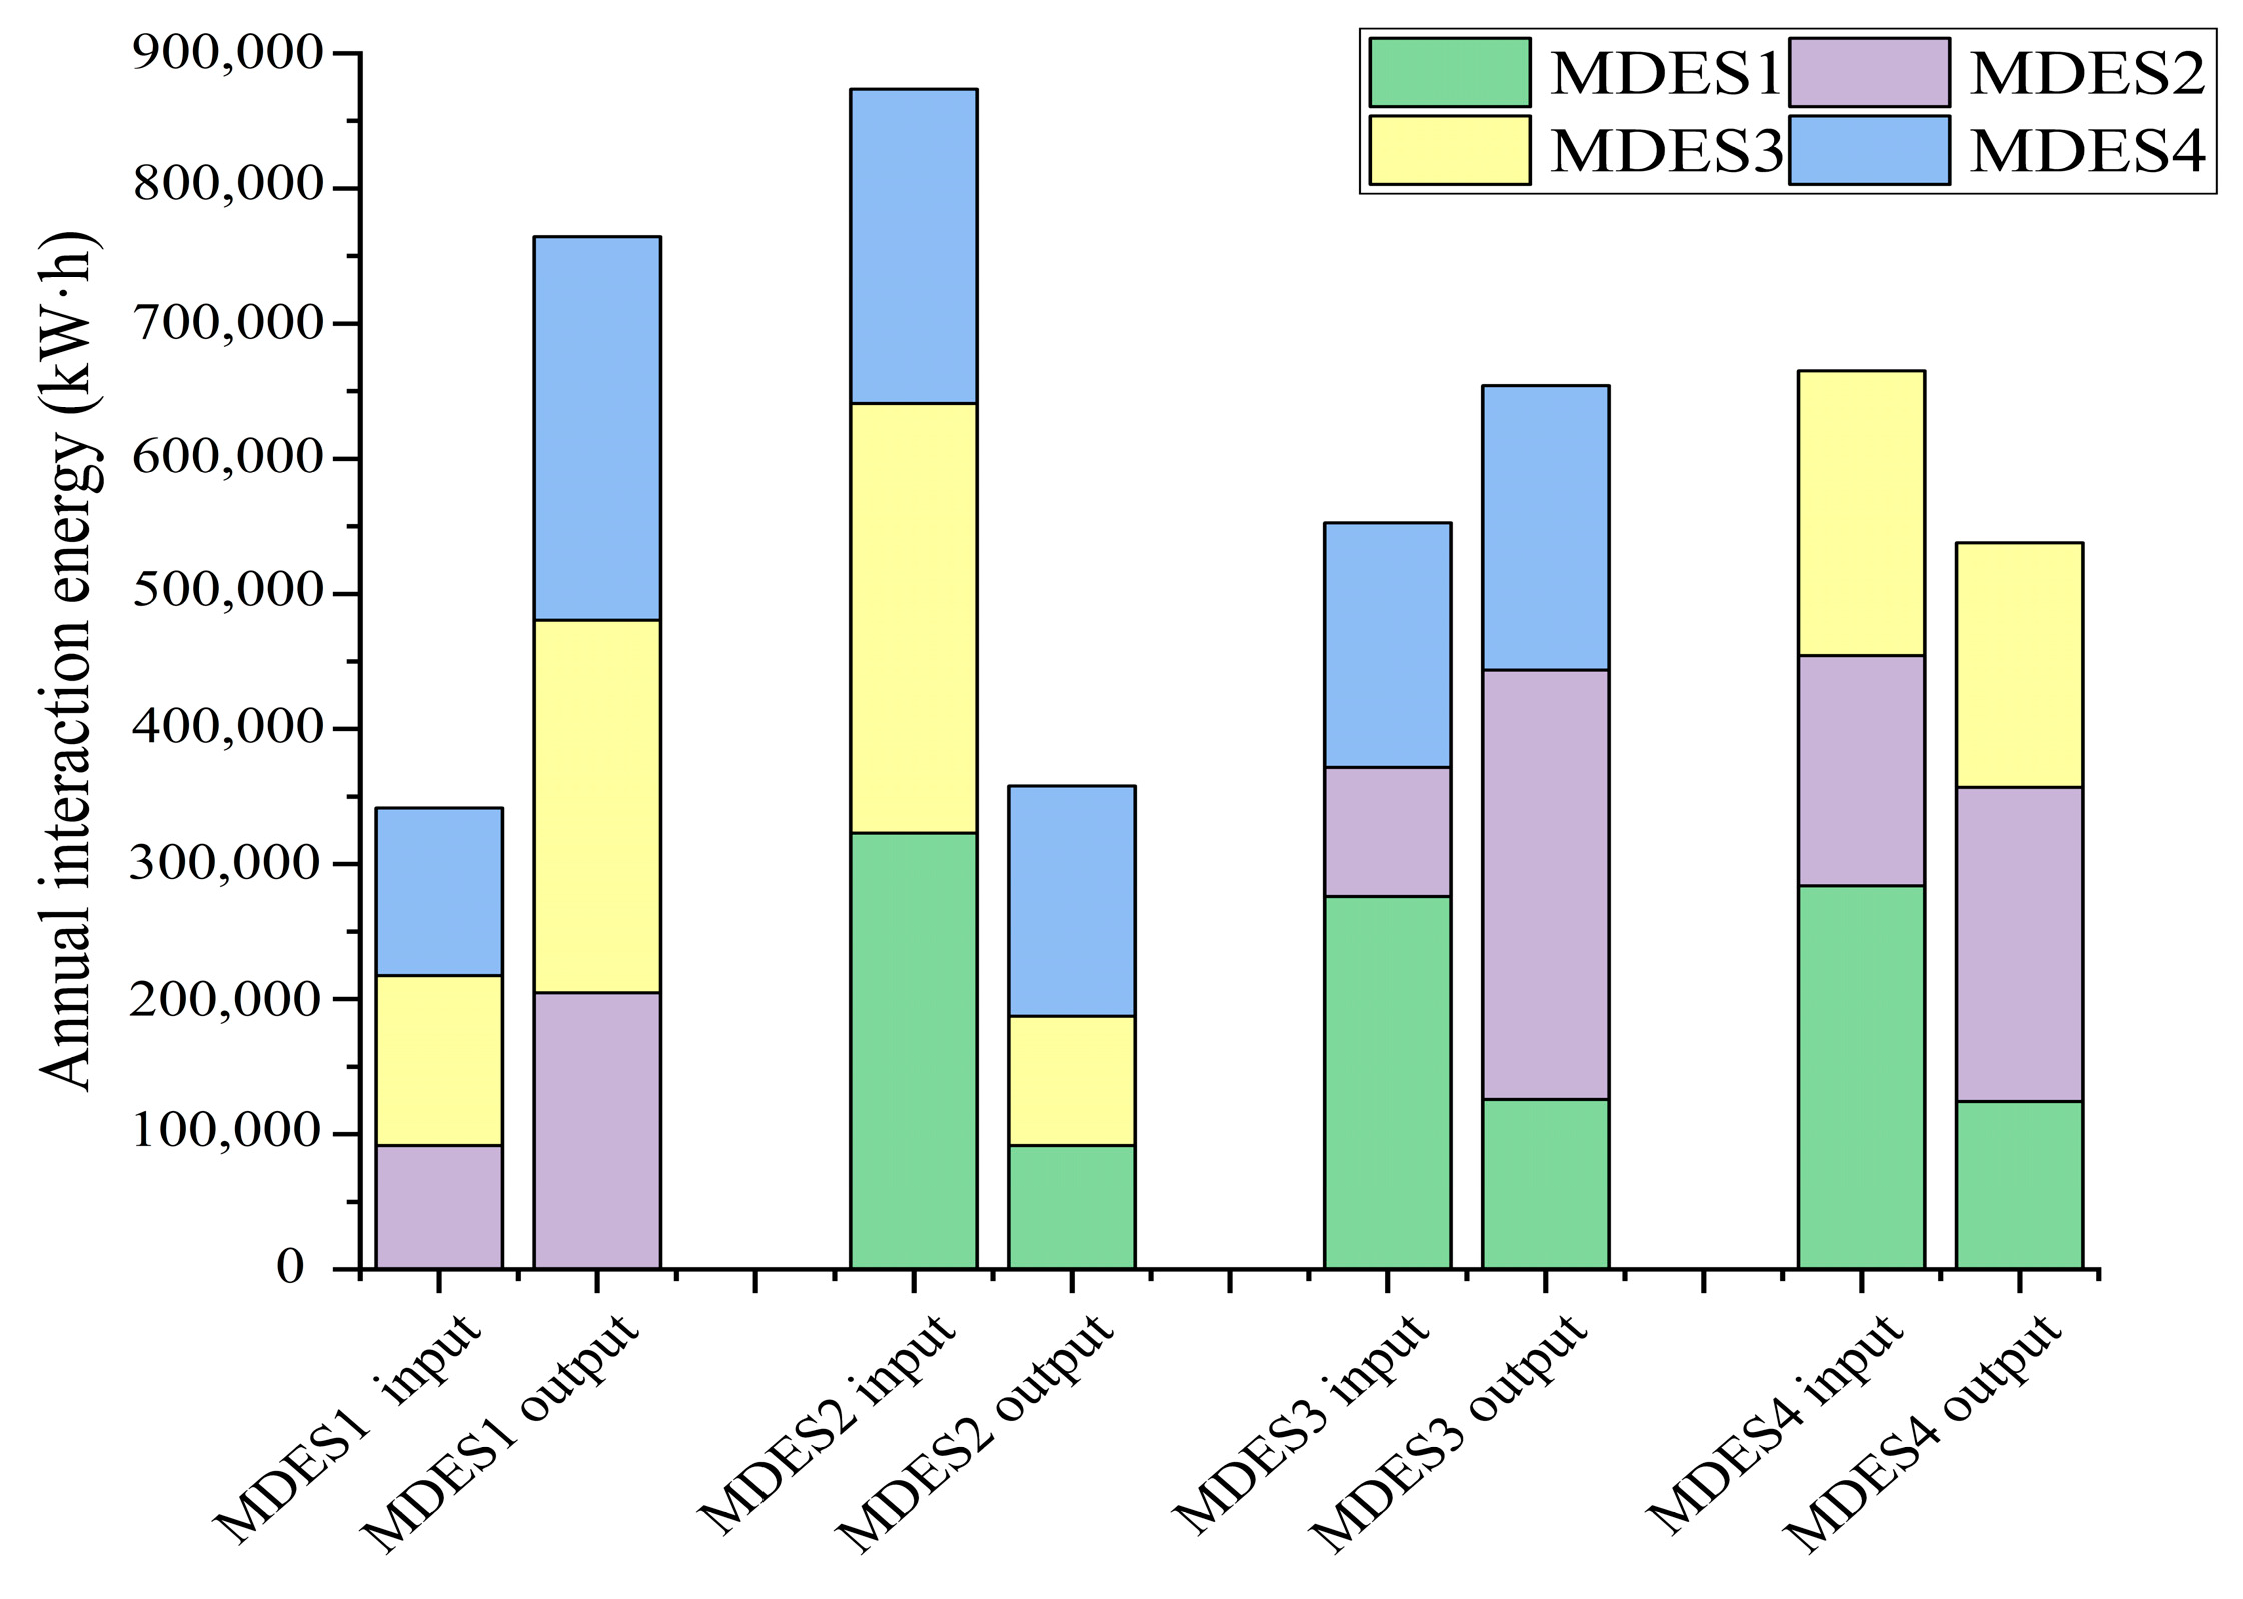
It can be seen from Figure 14 and Figure 15 that after adding Nash bargaining of the operating costs between the systems, the difference between the input and output energy of the interaction of a single energy system is reduced, which leads to more balanced benefits of the MDES through shared energy storage and improves the enthusiasm for participating in shared energy storage. The interaction power changes between the MDES and SESO are shown in Figure 16.

4.2. System Emergy Analysis

In this section, the emergy evaluation method is used to study the MDES. According to the input and output energy parameters of the MDES, the emergy analysis theory of the MDES described in Section 3.2 is used to compare the evaluation indexes of the MDES without SESO, shared energy interactive charging, and shared energy storage interactive Nash bargaining. Combined with Table 2, the emergy values of the distributed multi-energy system before and after adding the shared energy storage system are calculated, and the results are compared in Table 4.
The table shows that before and after adding SESO, the overall economic input emergy value F of MDES remains unchanged, the local renewable energy emergy value R and the non-renewable resource emergy value N are reduced, and the output emergy value Y increased. Nash bargaining and interactive charges have little effect on the distributed multi-energy system. Specifically, for non-renewable emergy N, the decrease in the natural gas purchase and the increase in the power grid purchase directly affect the energy value change of natural gas and coal combustion; for the local renewable emergy R, due to the increase in power grid purchase, the corresponding solar radiation, wind energy, and coal consumption of oxygen increase, but the reduction in natural gas corresponds to a greater reduction in oxygen consumption, so the total emergy value of oxygen decreases. It can be seen from Table 3 that the order of magnitude of the emergy conversion rate of oxygen is significantly higher than that of other inputs, which eventually leads to a decrease in local renewable energy. For the output emergy value Y, the corresponding emergy value of the electric energy output to the shared energy storage system is increased under the condition of the constant demand for cooling, heating, and power loads. The evaluation indexes of the MDES before and after considering SESO are shown in Table 5.
The emergy evaluation indicators show that compared with the cases without SESO, EYR, ESI, and EIR are significantly better, except for ELR. The addition of Nash bargaining almost has no influence on the indicators of the MDES except for ELR. The emergy value of non-renewable resources decreases more significantly than that of renewable resources under the same economic input emergy value, which leads to an increase in ELR. When the economic input emergy remains unchanged, the overall output emergy increases, that is, the emergy output rate increases. According to the definition, the change in ESI is related to the change in ELR and EYR. Thus, the change in ESI ranges between ELR and EYR. When the economic input emergy value remains unchanged, the renewable resource emergy value and the non-renewable resource emergy value decrease at the same time, resulting in a substantial increase in EIR.

4.3. Discussion

This paper focuses on the bi-objective optimization and comprehensive evaluation of MDES considering SESO. In terms of emergy evaluation, EYR, ESI, and EIR of the corresponding system increased by 5.15%, 3.83%, and 9.94%. Although ELR increased slightly by 1.67%, this is because, based on the premise of the reduction in renewable energy consumption, the reduction in renewable resources consumption is greater than that of non-renewable resources; therefore, it cannot be considered that the environmental friendliness of the MDES decreases after the addition of shared energy storage. However, there is still room and value for research on the MDES considering SESO. This paper divides the annual load into three typical seasons, which may be different from the real situation. In future work, this aspect can be considered, and the annual data can be directly selected for solving. In addition, the economy is taken as the optimization index, and it is then evaluated from the aspect of emergy. Subsequently, the emergy evaluation index can be considered the optimization objective for multi-objective optimization. In the end, this paper does not consider power flow constraints, and the influence of power flow constraints on the MDES should be included in subsequent research.

5. Conclusions

To overcome the problem of poor technical and economic performance and difficult evaluation of independent energy storage used in renewable energy networks, this paper proposes a bi-objective optimization and emergy evaluation method for capacity planning and operation scheduling of the multi-distributed energy system considering the shared energy storage. The expected benefits are analyzed. In detail, an MDES composed of four different distributed energy systems considering one Shared Energy Storage Operator (SESO) is taken as an example, and the main results are as follows:
(1) Under optimization with the average daily operating cost of MDES and the average daily revenue of SESO as objectives, with the increase in SESO capacity, the Pareto front curve considering the average daily operating cost of the MDES and the average daily revenue of SESO has a better trend. Under the boundary parameters of this paper, when the SESO capacity exceeds 1000 kW·h, the optimization effect of the Pareto front curve decreases rapidly with the increase in the SESO capacity.
(2) The addition of Nash bargaining achieves a more even distribution of the distributed energy system’s benefits from SESO, which promotes the enthusiasm of an MDES to participate in SES. Specifically, the operating cost of MDES considering SESO and Nash bargaining is reduced by 3.03%, while the operating cost of all the distributed energy systems is lower, with SESO having an additional income of $142.4/day. This is the result of comprehensively considering the benefits of SESO, and the addition of SESO resulted in an improvement in the emergy index of MDES.
(3) The emergy theory method effectively evaluates the sustainability of an MDES and successfully proves the greater benefits of shared energy storage. The emergy yield ratio, emergy sustainability index, and emergy investment ratio of the corresponding system increased by 5.15%, 3.83%, and 9.94%, respectively, while the environmental load ratio increased by 1.67%.

Author Contributions

Conceptualization, Y.W., K.H. and C.Z.; methodology, Z.Y. and Y.W.; validation, Z.Y.; investigation, J.H. and Y.Z.; writing—original draft, Z.Y. All authors have read and agreed to the published version of the manuscript.

Funding

This research was funded by “the Special Plan for Improving the Scientific Research Level and Innovation Ability of Postgraduates of Beijing Institute of Technology, Beijing Institute of Technology, grant number 2022YCXZ005”, and “the Youth Program of National Natural Science Foundation of China, National Natural Science Foundation of China, grant number 52006114”.

Institutional Review Board Statement

Not applicable.

Informed Consent Statement

Not applicable.

Data Availability Statement

Not applicable.

Conflicts of Interest

The authors declare no conflict of interest.

Abbreviations

ACAbsorption refrigeration
CHPCombined heat and power generation
DESDistributed energy system
EBElectric boiler
ECElectric compression refrigeration
EISSEnergy information scheduling system
GNGas network
MDESMulti distributed energy system
PGPower grid
PVPhotovoltaic panel
SESShared energy storage
SESOShared Energy Storage Operator
CbiEquipment construction cost ($)
Cb, XiConstruction cost of equipment X (CHP, EB, AC, EC, PV) in the i DES ($)
CDES_allTotal cost of DES
CEGiElectricity purchasing cost ($)
CgGas purchase costs ($)
CiThe operation cost of the ith DES after participating in Nash bargaining of communicating energy storage and interacting with no charge in a cycle
C*IOperation cost of the ith DES after optimization
CIInteraction cost with other DESs ($)
COPACiCoefficient of performance of AC
CMDES_avgThe average daily operating cost of MDES
CSESORevenue for SESO ($)
CSESO_avgThe average daily revenue of SESO
CSESO1Operating income of SESO ($)
CSESO2Construction cost of SESO ($)
CSESO3Maintenance cost of SESO ($)
CSESOiInteraction cost with SESO ($)
CmiCost of equipment maintenance ($)
Cm_XiMaintenance cost of equipment X ($)
CMDES_allTotal cost of DES ($)
CMDESiThe operation cost of the ith DES consdering SESO ($)
CMDESi_isoOperation cost of the ith DES without shared energy storage ($)
CtMiInteraction cost of MDESi ($/kW)
EIREmergy investment ratio
ELREnvironmental load ratio
EmThe total solar emergy (sej)
ESIEmergy sustainability index
EYREmergy yield ratio
EtSESOCapacity of SESO at time t (kW·h)
FEmergy values of purchased energy and services (sej)
fmProportion coefficient of maintenance cost and construction cost
NEmergy values of non-renewable energy (sej)
pgasNatural gas unit price ($/m3)
Pmaxi,jThe upper limit of interaction power between MDES (kW)
PMAXSESOMaximum power of SESO (kW)
pSESOOperation cycle of SESO (year)
PtACciCold output of AC (kW)
PtAChiHeat consumption power of AC (kW)
PtCHPeiElectric output of CHP (kW)
PtCHPhiHeat output of CHP (kW)
PtECiCold output of EC (kW)
PtECeiPower consumption of EC (kW)
ptEGt Timing of power grid electricity price
PtEBeiPower consumption of EB (kW)
PtEBhiThermal power of EB (kW)
PtEGiElectric network power (kW)
Pti,jInteraction power between DESi and DESj (kW)
Ptload,ciCooling load (kW)
Ptload,eiElectric load (kW)
Ptload,hiThermal load (kW)
PtPViElectric power of PV (kW)
PtSESO,c/dPower of MDESi charging/discharging with SESO (kW)
PtSESOi,c/dCharge/discharge power at t time in SESO (kW)
PtSESO,dTotal discharge power at time t of SESO (kW)
pXiOperation cycle of equipment X ($)
QLHVLow heating value of natural gas
REmergy values of local renewable energy (sej)
rInterest rate
TXiOperation cycle of equipment X
USESOMaximum capacity of SESO (kW·h)
UXiEquipment X installation scale ($/kW)
YEmergy values of output energy products (sej)
YmThe output of emergy products
ZiThe bargaining income transfer of the ith DES
αProportional coefficient between maximum power and a maximum capacity of SESO
ηc/dCharging/discharging efficiency of SESO (kW)
ηCHP,eiPower Generation Efficiency of CHP
ηCHP,hiCHP thermal efficiency
ηEBCoefficient of performance of EB
ηECRefrigeration efficiency of EC
λmaxCHPeiUpper limit of CHP climbing rate (kW)
λSESOUnit power rental cost ($/kW)
λSESO,PUnit power cost of SESO ($/kW)
λSESO,UUnit capacity cost of SESO ($/kW·h)
λtEGt Timing of power grid electricity price ($/kW·h)
λtMUnit interactive power costs between DESs ($/kW)
λXiEquipment X (CHP, EB, AC, EC, PV) unit construction cost ($/kW)

References

  1. Li, C.; Shi, H.; Cao, Y.; Wang, J.; Kuang, Y.; Tan, Y.; Wei, J. Comprehensive Review of Renewable Energy Curtailment and Avoidance: A Specific Example in China. Renew. Sustain. Energy Rev. 2015, 41, 1067–1079. [Google Scholar] [CrossRef]
  2. Shang, B.; Jiang, T.; Bao, Z. A Study on Inter-Regional Cooperation Patterns and Evolution Mechanism of Traditional and Renewable Energy Sources. Sustainability 2022, 14, 16022. [Google Scholar] [CrossRef]
  3. Vahid-Pakdel, M.; Nojavan, S.; Mohammadi-Ivatloo, B.; Zare, K. Stochastic Optimization of Energy Hub Operation with Consideration of Thermal Energy Market and Demand Response. Energy Convers. Manag. 2017, 145, 117–128. [Google Scholar] [CrossRef]
  4. Yu, H.; Yang, X.; Chen, H.; Lou, S.; Lin, Y. Energy Storage Capacity Planning Method for Improving Offshore Wind Power Consumption. Sustainability 2022, 14, 14589. [Google Scholar] [CrossRef]
  5. Wang, Y.; Wang, Y.; Huang, Y.; Yu, H.; Du, R.; Zhang, F.; Zhang, F.; Zhu, J. Optimal Scheduling of the Regional Integrated Energy System Considering Economy and Environment. IEEE Trans. Sustain. Energy 2019, 10, 1939–1949. [Google Scholar] [CrossRef]
  6. Zhao, N.; You, F. Can Renewable Generation, Energy Storage and Energy Efficient Technologies Enable Carbon Neutral Energy Transition? Appl. Energy 2020, 279, 15889. [Google Scholar] [CrossRef]
  7. Nieto, A.; Vita, V.; Ekonomou, L. Economic Analysis of Energy Storage System Integration with a Grid Connected Intermittent Power Plant, for Power Quality Purposes. Technology 2016, 11, 65–71. [Google Scholar]
  8. Walker, A.; Kwon, S. Design of Structured Control Policy for Shared Energy Storage in Residential Community: A Stochastic Optimization Approach. Appl. Energy 2021, 298, 117182. [Google Scholar] [CrossRef]
  9. Zhang, C.; Wu, J.; Zhou, Y.; Cheng, M.; Long, C. Peer-to-Peer Energy Trading in a Microgrid. Appl. Energy 2018, 220, 1–12. [Google Scholar] [CrossRef]
  10. Li, J.L.; Jiang, Y.R.; Zhang, L.J. Policy Recommendations and Business Model Exploration of Electrochemical Energy Storage in Qinghai Province. Energy Sci. Technol. 2021, 19, 7–12. (In Chinese) [Google Scholar]
  11. Lombardi, P.; Schwabe, F. Sharing Economy as a New Business Model for Energy Storage Systems. Appl. Energy 2017, 188, 485–496. [Google Scholar] [CrossRef]
  12. Mignoni, N.; Scarabaggio, P.; Carli, R.; Dotoli, M. Control Frameworks for Transactive Energy Storage Services in Energy Communities. Control Eng. Pract. 2023, 130, 105364. [Google Scholar] [CrossRef]
  13. Fathi, M.; Bevrani, H. Adaptive Energy Consumption Scheduling for Connected Microgrids Under Demand Uncertainty. IEEE Trans. Power Deliv. 2013, 28, 1576–1583. [Google Scholar] [CrossRef]
  14. Fathi, M.; Bevrani, H. Statistical Cooperative Power Dispatching in Interconnected Microgrids. IEEE Trans. Sustain. Energy 2013, 4, 586–593. [Google Scholar] [CrossRef]
  15. Dimitrov, P.; Piroddi, L.; Prandini, M. Distributed Allocation of a Shared Energy Storage System in a Microgrid. In Proceedings of the 2016 American Control Conference (ACC), Boston, MA, USA, 6–8 July 2016. [Google Scholar]
  16. Venkatesan, K.; Govindarajan, U. Optimal Power Flow Control of Hybrid Renewable Energy System with Energy Storage: A WOANN Strategy. J. Renew. Sustain. Energy 2019, 11, 015501. [Google Scholar] [CrossRef]
  17. Scarabaggio, P.; Carli, R.; Dotoli, M. Noncooperative Equilibrium-Seeking in Distributed Energy Systems Under AC Power Flow Nonlinear Constraints. IEEE Trans. Control. Netw. Syst. 2022, 9, 1731–1742. [Google Scholar] [CrossRef]
  18. Adewumi, O.B.; Fotis, G.; Vita, V.; Nankoo, D.; Ekonomou, L. The Impact of Distributed Energy Storage on Distribution and Transmission Networks’ Power Quality. Appl. Sci. 2022, 12, 6466. [Google Scholar] [CrossRef]
  19. Zheng, S.; Jin, X.; Huang, G.; Lai, A.C. Coordination of Commercial Prosumers with Distributed Demand-Side Flexibility in Energy Sharing and Management System. Energy 2022, 248, 123634. [Google Scholar] [CrossRef]
  20. Choudhury, S. Review of Energy Storage System Technologies Integration to Microgrid: Types, Control Strategies, Issues, and Future Prospects. J. Energy Storage 2022, 48, 103966. [Google Scholar] [CrossRef]
  21. Zhang, W.; Wei, W.; Chen, L.; Zheng, B.; Mei, S. Service Pricing and Load Dispatch of Residential Shared Energy Storage Unit. Energy 2020, 202, 117543. [Google Scholar] [CrossRef]
  22. Shuai, X.Y.; Wang, X.L.; Huang, J. Optimal Configuration of Shared Energy Storage Capacity Under Multiple Regional Integrated Energy Systems Interconnection. J. Glob. Energy Interconnect. 2021, 4, 382–392. (In Chinese) [Google Scholar] [CrossRef]
  23. Szabó, D.Z.; Duck, P.; Johnson, P. Optimal Trading of Imbalance Options for Power Systems Using an Energy Storage Device. Eur. J. Oper. Res. 2018, 285, 3–22. [Google Scholar] [CrossRef]
  24. Guelpa, E.; Sciacovelli, A.; Verda, V. Entropy Generation Analysis for the Design Improvement of a Latent Heat Storage System. Energy 2013, 53, 128–138. [Google Scholar] [CrossRef] [Green Version]
  25. Jing, R.; Na Xie, M.; Wang, F.X.; Chen, L.X. Fair P2P Energy Trading between Residential and Commercial Multi-Energy Systems Enabling Integrated Demand-Side Management. Appl. Energy 2020, 262, 114551. [Google Scholar] [CrossRef]
  26. Xu, Y.-P.; Liu, R.-H.; Tang, L.-Y.; Wu, H.; She, C. Risk-Averse Multi-Objective Optimization of Multi-Energy Microgrids Integrated with Power-to-Hydrogen Technology, Electric Vehicles and Data Center under a Hybrid Robust-Stochastic Technique. Sustain. Cities Soc. 2022, 79, 103699. [Google Scholar] [CrossRef]
  27. Nehra, A.; Caplan, A.J. Nash Bargaining in a General Equilibrium Framework: The Case of a Shared Surface Water Supply. Water Resour. Econ. 2022, 39, 100206. [Google Scholar] [CrossRef]
  28. Liu, N.; Cheng, M.; Yu, X.; Zhong, J.; Lei, J. Energy-Sharing Provider for PV Prosumer Clusters: A Hybrid Approach Using Stochastic Programming and Stackelberg Game. IEEE Trans. Ind. Electron. 2018, 65, 6740–6750. [Google Scholar] [CrossRef]
  29. Odum, H.T. Environmental Accounting. In The Economics of the Environment and Natural Resources; Wiley-Blackwell: Hoboken, NJ, USA, 1996. [Google Scholar]
  30. Wang, J.; Wang, J.; Yang, X.; Xie, K.; Wang, D. A Novel Emergy-Based Optimization Model of a Building Cooling, Heating and Power System. Energy Convers. Manag. 2022, 268, 115987. [Google Scholar] [CrossRef]
  31. Liu, J.Y.; Yang, Z.F.; Jiang, D.N. Emergy Theory and Practice: Ecological Environmental Accounting and Urban Green Management; Science Press: Beijing, China, 2018. (In Chinese) [Google Scholar]
  32. Pan, H.; Zhang, X.; Wu, J.; Zhang, Y.; Lin, L.; Yang, G.; Deng, S.; Li, L.; Yu, X.; Qi, H.; et al. Sustainability Evaluation of a Steel Production System in China Based on Emergy. J. Clean. Prod. 2015, 112, 1498–1509. [Google Scholar] [CrossRef]
  33. Peng, T.; Lu, H.F.; Wu, W.L.; Campbell, D.E.; Zhao, G.S.; Zou, J.H.; Chen, J. Should a Small Combined Heat and Power Plant (CHP) Open to Its Regional Power and Heat Networks? Integrated Economic, Energy, and Emergy Evaluation of Optimization Plans for Jiufa CHP. Energy 2008, 33, 437–445. [Google Scholar] [CrossRef]
  34. Tian, L.T.; Cheng, L.; Guo, J.B.; Sun, S.M.; Cheng, Y.; Wei, D.J. Multi-energy System Valuation Method Based on Emergy Analysis. Power Syst. Technol. 2019, 43, 2925–2934. (In Chinese) [Google Scholar] [CrossRef]
  35. Li, L.; Cao, X.; Zhang, S. Shared Energy Storage System for Prosumers in a Community: Investment Decision, Economic Operation, and Benefits Allocation under a Cost-Effective Way. J. Energy Storage 2022, 50, 104710. [Google Scholar] [CrossRef]
  36. Chen, T.; Wu, G.X.; Zhou, N.C.; Lv, X.H.; Liu, W.; Wu, X.H. Optimal configuration of integrated energy system on user side in Southwest China. Renew. Energy Resour. 2021, 39, 8. (In Chinese) [Google Scholar]
  37. Walker, A.; Kwon, S. Analysis on Impact of Shared Energy Storage in Residential Community: Individual versus Shared Energy Storage. Appl. Energy 2021, 282, 116172. [Google Scholar] [CrossRef]
  38. Zhou, C.; Zheng, J.; Jing, Z.; Wu, Q.; Zhou, X. Multi-Objective Optimal Design of Integrated Energy System for Park-Level Microgrid. Power Syst. Technol. 2018, 42, 1687–1697. (In Chinese) [Google Scholar]
  39. Ma, M.; Huang, H.; Song, X.; Peña-Mora, F.; Zhang, Z.; Chen, J. Optimal Sizing and Operations of Shared Energy Storage Systems in Distribution Networks: A Bi-Level Programming Approach. Appl. Energy 2022, 307, 118170. [Google Scholar] [CrossRef]
Figure 1. Multi-distributed energy system considering shared energy storage.
Sustainability 15 01011 g001
Figure 2. Schematic diagram of internal energy flow in DES.
Sustainability 15 01011 g002
Figure 3. Flow chart of the bi-objective optimization process.
Sustainability 15 01011 g003
Figure 4. Bi-objective optimization solution process.
Sustainability 15 01011 g004
Figure 5. Emergy analysis schematic diagram of MDES.
Sustainability 15 01011 g005
Figure 6. Typical daily cooling and heating requirements in each season.
Sustainability 15 01011 g006
Figure 7. Typical daily electricity demand in each season.
Sustainability 15 01011 g007
Figure 8. Typical daily PV output in each season.
Sustainability 15 01011 g008
Figure 9. Grid commercial electricity and residential electricity prices.
Sustainability 15 01011 g009
Figure 10. The installed capacity of each system.
Sustainability 15 01011 g010
Figure 11. SESO benefits and MDES costs for different optimization goals.
Sustainability 15 01011 g011
Figure 12. Comparison of interactive fee and Pareto frontier curve of Nash bargaining model between MDES.
Sustainability 15 01011 g012
Figure 13. Normalized curves in both modes.
Sustainability 15 01011 g013
Figure 14. Electric energy interaction curve of each system under interactive charging.
Sustainability 15 01011 g014
Figure 15. Electric energy interaction curve of each system under even bargaining conditions.
Sustainability 15 01011 g015
Figure 16. Electric energy interaction curves of micro-energy grid and shared energy storage system in two modes.
Sustainability 15 01011 g016
Table 1. DES equipment model [25].
NameConstraintsRemark
CHP P CHP , e i min P CHP , e i t P CHP , e i max P CHP , h i t = η CHP , h i η CHP , ei P CHP , e i t λ CHP , e i max Δ t P CHP , e i t + 1 P CHP , e i t λ CHP , e i max Δ t PtCHP,ei: Electric output of CHP (kW)
PtCHP,ei: Heat output of CHP (kW)
ηCHP,ei: Power Generation Efficiency of CHP
ηCHP,hi: CHP thermal efficiency
λmaxCHP,ei: Upper limit of CHP climbing rate (kW)
EB P EB , h i t = η EB P EB , e i t P EB , h i min P EB , h i t P EB , h i max PtEB,hi: Thermal power of EB (kW)
ηEB: Coefficient of performance of EB
PtEB,ei: Power consumption of EB (kW)
AC P AC , c i t = C OP P AC , h i t P AC , c i min P AC , c i t P AC , c i max PtAC,ci: Cold output of AC (kW)
PtAC,hi: Heat consumption power of AC (kW)
COPAC,i: coefficient of performance of AC
EC P EC , c i t = η EC P EC , e i t P EC , c i min P EC , c i t P EC , c i max PtEC,i: Cold output of EC (kW)
PtEC,ei: Power consumption of EC (kW)
ηEC: Refrigeration efficiency of EC
Electric heat and cold balance P CHP , e i t + P PV i t + P EG i t = P EB , e i t + P EC , e i t + P load , e i t P CHP , h i t + P EB , h i t = P AC , h i t + P load , h i t P AC , c i t + P EC , c i t = P load , c i t PtPVi: electric power of PV (kW)
PtEGi: electric network power (kW)
Pteload,ei: electric load (kW)
Ptload,hi: thermal load (kW)
Ptload,ci: cooling load (kW)
Electric balance considering SESO P CHP , e i t + P PV i t + P SESO , d i t + P EG i t + j i n P i , j t = P EB , e i t + P EC , e i t + P SESO , c i t + P load , e i t Ptload,hi: thermal load (kW)
Ptload,ci: cooling load (kW)
Table 2. Conversion rates corresponding to various emergy values.
ParameterTransform Rate of EmergyUnit
Solar energy1.000 × 106 [31]sej/MJ
Oxygen5.160 × 1010 [32]sej/kg
Wind energy7.900 × 108 [31]sej/MJ
Natural gas1.460 × 1011 [31]sej/MJ
Coal1.110 × 1012 [31]sej/kg
Investment cost3.460 × 1012 [33]sej/$
Electrical load demand2.210 × 1011 [31]sej/MJ
Cool load demand6.070 × 1010 [34]sej/MJ
Head load demand6.070 × 1010 [34]sej/MJ
Table 3. MDES Considering SESO Unit Parameters [22,35,36,37,38,39].
ParametersTitle
SESO unit power rental Cost/($/kW)0.04
SESO unit power cost/($/kW)142.8
SESO unit capacity cost/($/kW·h)157.1
SESO operation cycle/a8
The proportional coefficient between the upper limit of SESO power and the upper limit of capacity0.20
Power generation efficiency of CHP unit0.35
EB heat efficiency0.95
Coefficient of performance of AC1.50
EC refrigeration efficiency2.50
Natural gas unit price/($/m3)0.36
Unit scale construction cost of CHP/($/kW)457.1
EB unit scale construction cost/($/kW)171.4
AC unit scale construction cost/($/kW)171.4
EC unit scale construction cost/($/kW)154.3
PV unit construction cost/($/kW)342.9
Equipment operating cycle/year20
Interest rate0.05
Ratio of maintenance cost to construction cost0.02
Table 4. MDES emergy comparison.
NO.ParameterTotal Emergy Value without SESOMDES Emergy Value of Interactive Charge Considering MDESMDES Emergy Value of Nash Bargaining Considering MDES
R1Solar energy1.516 × 10141.648 × 10141.640 × 1014
R2Oxygen2.714 × 10182.532 × 10182.511 × 1018
R3Wind energy1.857 × 10152.211 × 10152.096 × 1015
RRenewable2.72 × 10182.53 × 10182.513 × 1018
N1Natural gas1.717 × 10191.538 × 10191.545 × 1019
N2Coal5.875 × 10176.996 × 10176.632 × 1017
NNon-renewable1.78 × 10191.61 × 10191.611 × 1019
F1PV assets2.331 × 10182.331 × 10182.331 × 1018
F2CHP assets3.729 × 10183.729 × 10183.729 × 1018
F3CHP assets3.729 × 10183.729 × 10183.729 × 1018
F4EC assets8.691 × 10178.691 × 10178.691 × 1017
F5EB assets9.657 × 10179.657 × 10179.657 × 1017
F6Operating cost1.939 × 10171.939 × 10171.939 × 1017
FPurchased emergy9.89 × 10189.89 × 10189.887 × 1018
Y1Electrical load demand1.244 × 10191.244 × 10191.244 × 1019
Y2SESS storage0.0007.358 × 10177.376 × 1017
Y3Cool load demand5.810 × 10175.810 × 10175.810 × 1017
Y4Heat load demand3.836 × 10173.836 × 10173.836 × 1017
YEmergy yield1.34 × 10191.41 × 10191.414 × 1019
Table 5. Comparison of emergy evaluation indicators.
NO.Without SESOSESO and Interactive FeesRate of ChangeSESO and Nash BargainingRate of Change
ELR10.1810.240.62%10.351.67%
EYR1.361.435.49%1.435.15%
ESI0.13310.13964.84%0.13823.83%
EIR0.48280.531210.02%0.53089.94%
Disclaimer/Publisher’s Note: The statements, opinions and data contained in all publications are solely those of the individual author(s) and contributor(s) and not of MDPI and/or the editor(s). MDPI and/or the editor(s) disclaim responsibility for any injury to people or property resulting from any ideas, methods, instructions or products referred to in the content.