Article

Energy Use Efficiency and Carbon Footprint of Greenhouse Hydroponic Cultivation Using Public Grid and PVs as Energy Providers

by
Georgios Liantas
1,
Ioanna Chatzigeorgiou
1,2,
Maria Ravani
1,
Athanasios Koukounaras
2 and
Georgios K. Ntinas
1,*
1
Institute of Plant Breeding and Genetic Resources, ELGO-DIMITRA, Thermi, 57001 Thessaloniki, Greece
2
Department of Horticulture, School of Agriculture, Aristotle University of Thessaloniki, 54124 Thessaloniki, Greece
*
Author to whom correspondence should be addressed.
Sustainability 2023, 15(2), 1024; https://doi.org/10.3390/su15021024
Submission received: 9 December 2022 / Revised: 27 December 2022 / Accepted: 1 January 2023 / Published: 5 January 2023

Abstract

:
As the greenhouse cultivation industry considers new ways to reduce energy demand and increase sustainable production, the global energy crisis constitutes a major issue. In this paper, two different energy sources for heating and cooling the root zone area of baby leafy vegetables grown in hydroponic tanks by resistors and chillers, respectively, were compared in order to fully cover power demand. The energy needs in the first case were met by the public electricity grid, while in the second case, the energy needs were covered by a photovoltaic system. The greenhouse was equipped with photovoltaic panels, an inverter, a charge controller and a storage system. The target-value of the root zone temperature was 22 °C. Data on solar radiation, root zone temperature, air temperature and humidity from the indoor and outdoor space of the greenhouse were recorded, and the energy production and carbon footprint for different seasons of the year were evaluated along with the crop yield. The results showed that the energy provided by solar panels was able to cover 58.0%, 83.3% and 9.6% of the energy for heating or cooling the root zone area during the spring, summer and winter periods, respectively. Regarding the carbon footprint of the energy used between the two systems, the system with the PV had a substantially lower value, which was calculated at 1.6 kg CO2-eq kg−1, compared to 49.9 kg CO2-eq kg−1 for the system with PPG for the whole year.

1. Introduction

The climate crisis, as a result of climate change, is causing major issues in agricultural production. Global warming is a crucial factor for agricultural production, causing desertification [1] and extreme weather events such as hail, large amounts of rain in short intervals and wind [2]. At the same time, the need to secure increased food production is a widespread, common issue [1]. The market demand for vegetables has seen a significant increase due to their positive effects on the human body; they have become an integral part of daily diets.
Protected agriculture, and especially greenhouses, can offer both crop protection and climate control. The monitoring and controlling of temperature, light and CO2 offer yearly stable production and the accurate prediction of harvest time. In conjunction with hydroponic cultivation, efficient usage of resources is achieved along with higher yield and high-quality products [3]. Hydroponic cultivation, especially of baby leaf vegetables, in greenhouses is one of the most intensive crop farming practices concerning yields. However, it is also characterized by high initial investment, operating costs, and energy consumption [4].
Especially in temperate regions, greenhouse crops are characterized by their high energy requirements [1,2,5,6]. Electric energy is utilized to cover heating and cooling needs during winter and summer months, respectively. A hybrid energy system consisting of a PV system and a heat pump for heating and cooling greenhouse lettuce cultivation was studied in Turkey [7]. The annual energy demand regarding 150 m2 of cultivated area for cooling and heating (without July and August) reached 128.33 kWh m−2, while for the Mediterranean region, the energy consumption needed was equivalent to 60–80 kWh m−2 y−1 [7,8]. In experiments conducted in Saudi Arabia from August to November, the consumption of 7.38 kWh m−2 was recorded only for cooling, ventilation, and irrigation [9]. In the Mediterranean basin, the energy consumption for the cooling of the greenhouses was estimated at 100 kWh m−2 [10]. Three different greenhouse-heating scenarios were evaluated in Italy [11]. In the first scenario, the greenhouse was heated by using an air heater. In the second and third scenarios, the greenhouse was equipped with two systems of coaxial pipes circulating hot water. In the second scenario, a heat pump was used, while in the third scenario, a condenser boiler was selected and the pipes were placed on the surface of the crop. Regarding the total energy consumption from February to March, during 49 days of cultivation, the highest value was observed in the third scenario and was calculated to be 300.25 kWh m−2, followed by the first scenario, with 175.91 kWh m−2, while the second scenario had the lowest value of 159.41 kWh m−2 [11].
The high energy cost urges growers to avoid the use of the greenhouse in extreme weather conditions. On the other hand, the use of renewable energy sources (RES), despite the high initial cost, offers the possibility of growing “green”, environmentally friendly products with a reduced carbon footprint and high added commercial value [12,13,14].
The calculation of the carbon footprint contributes to the assessment of the environmental impact of each production process [15]. The carbon footprint per mass unit of product or per unit area has been calculated in similar studies and the percentage of contribution of electricity to the final result has been recorded [14,16,17,18]. It appears that the use of electricity for heating greenhouses has a significant effect on the production process. Indicatively, it has been observed to occupy 67.2–75.8% of the carbon footprint compared to other inputs [14] and 67.7% of the energy use in greenhouses [17]. This fact highlights the need to study electrical energy as a factor affecting the environmental impact of production process.
In a floating hydroponic system, the water has a higher heat capacity than air, so it should be easier to keep the temperature constant at the desired value. In addition, it has been reported that a floating system can offer high plant yields, even higher than other systems, such as NFT [19]. A temperature of 22 °C was the suggested optimum temperature in terms of overall plant performance (nutrient uptake, root growth, metabolites accumulation, etc.) and yield in a floating system for leafy vegetables and other vegetables [20,21,22].
The purpose of this work was to evaluate the energy use and its environmental impact in a greenhouse with baby lettuce leaves grown in a floating hydroponic system during the spring, summer and winter seasons. Energy was supplied either from the public grid or from PV panels generating renewable energy and was used to maintain root zone temperature (RZT) at 22 °C, while no air temperature control was applied. According to the results of this study, hydroponics along with RES can extend the cultivation period of baby leaves in greenhouses throughout the entire year, including the summer, with minimal environmental impact.

2. Materials and Methods

2.1. Experimental Set Up and Microclimate Measurements

The experiment was carried out in a greenhouse at the campus of ELGO-DIMITRA in Thermi Thessaloniki, Greece (40°32′17.4″ N, 22°59′58.2″ E). The greenhouse is of a pitched-type, covered with diffusion glass and a metal frame, while its dimensions are 11.2 m in length, 9.6 m in width, 5.9 m in ridge height and 4.0 m in gutter height. Galvanized steel tanks covered with a black colored low-density polyethylene (LDPE) sheet were used for the hydroponic cultivation. The dimensions of each tank were 2.5 m × 1.0 m × 0.25 m. Three tanks, with a total volume of 0.5 m3 each, were used in the experiments throughout the year (Figure 1). Every tank was equipped with a water recirculating pump (Leo XKF-110P Water Pump) with a maximum flow of 3750 Lh−1, maximum manometric head of 3.7 m and electric power of 110 W. In addition, in every tank, an air pump (Resun Air-3000) with a maximum flow of 180 Lh−1, maximum pressure of 0.014 Mpa and electric power of 3.5 W enriched the water with oxygen. The air was provided through two 150 × 20 × 20 mm ceramic air stones, per tank. Water temperature sensors (type PT-100) were also installed to monitor and control RZT inside each tank. RZT was kept at 22 °C in two of the tanks, while the third one served as a control unit and was not heated or cooled. The energy needs of the first tank, which will be referred to as the PPG tank, were met by the public power or electricity grid, while for the second one (PV tank), the energy needs were covered by the photovoltaic system installed outside the greenhouse, consisting of 4 solar panels with a total power of 1 kWp.
Experiments were conducted in different environmental conditions, in March 2018, April 2018, July 2018 and January 2019. During the winter and spring periods, heating was applied to the PPG and PV tanks through electric resistors supplied with electricity. The electric heating resistors were installed inside the two tanks and were operating when water temperature was lower than 22 °C. During the summer period, the PV and Control tanks were utilized, while the PPG tank was not included in the experimental design. A hydroponic chiller was used to cool water in the PV tank, thus keeping the plants’ root zone temperature at 22 °C. The electric power of the chiller (TECO—HY2000) was 435 W, with refrigerant R134a and water supply with a minimum value of 600 Lh−1 and a maximum value of 800 Lh−1. The energy of the PV tank was generated from the photovoltaic system, similarly to the rest of the experiments.
Throughout the experiments, neither heating nor cooling was applied to the greenhouse, apart from natural ventilation through roof openings. Greenhouse air temperature and humidity were recorded every 5 min with a HOBO data logger (HOBO microstation, Onset Inc., Bourne, USA). Photosynthetically Active Radiation (PAR) and Pyranometer (PYR) sensors were also installed beside the tanks.
Romaine lettuce (Lactuca sativa cv. Paris Island) seeds were sown in Styrofoam rafts (33 × 67), and each tank contained 10 rafts in total per experiment. After seeds sprouting and first true leaf appearance, the rafts were placed in the tanks. Hoagland nutrient solution was used in each experiment, and no plant protection products were applied. The duration of the cultivation period in the greenhouse varied between the conducted experiments. The first experiment lasted 18 days, the second lasted 15 days, the third lasted 14 days and the fourth lasted 17 days. This period refers to the period starting with the appearance of the first true leaf until the harvest day. More information regarding plant material, cultivation and quality of the produced product can be found in [20].

2.2. Energy Analysis and Energy Use Efficiency

The evaluation of all three tanks per seasonal experiment was performed according to the Energy Use Efficiency (EUE) index, which expresses the kilograms (kg) of fresh produced lettuce per kWh [23].
Harvested lettuce baby leaves per raft and per tank were weighted and the yield was expressed in kg per square meters (m2). The PPG tank had an energy meter installed, with accurate kWh readings throughout the experiment, while in the PV tank, there was one electricity meter which recorded the consumed energy. The energy consumed by the recirculation pumps, aerators, lights and greenhouse automation was not included, as it was the same for all three tanks.
The photovoltaic system was autonomous and consisted of four solar panels, charge controller, storage system and solar inverter (Table 1). The connection design is depicted in Figure 2. The charge controller converted the photovoltaic current to DC-DC current and was used to reduce the output voltage of the photovoltaics to the battery voltage levels. For the needs of the experiment, two batteries were used; 12 V and 180 Ah deep discharge, each.
To assess the potential of the whole greenhouse used all year-round, a case study was performed, where yield, energy production and energy consumption were calculated per year. The total electricity production from the photovoltaic panels was calculated with PVGIS calculator and PVSYST software to simulate the energy consumption under the assumption that the experiment lasted a full year, based on the available electricity generation from the panels. According to PVGIS and PVSYST, the annual production from photovoltaics in Thermi, Thessaloniki amounts to 1480 kWh for each installed 1 kWp. The panels had a south orientation and a 30° tilt on a fixed base.

2.3. Carbon Footprint of the Energy Consumption

Carbon footprint is a valuable indicator for assessing the environmental impact of the input energy consumption. In the present study, the carbon footprint was calculated specifically for the greenhouse energy consumption during the four experiments. The carbon footprint results for the two energy supply systems (photovoltaic and grid electricity) were compared. To convert the amounts of energy into kg CO2-eq, coefficient values for the photovoltaics and the electricity grid were retrieved from the EcoInvent3 and ELCD databases and refer to the amount of kg CO2-eq emitted from the production of 1 kWh by the photovoltaic panels and the electricity grid.

2.4. Statistical Analysis

Ten Styrofoam rafts were used per tank, considering each raft a replication. Data regarding plants’ yield were analyzed by applying one-way analysis of variance (ANOVA). Comparisons of the means were performed using Tukey’s post-hoc test at with a critical level a = 0.05 .

3. Results and Discussion

3.1. Greenhouse Microclimate Conditions

Microclimatic parameters can highly affect many plants’ biochemical and physiological functions. Temperature is the principal factor affecting yield, as well as plants’ qualitative characteristics.

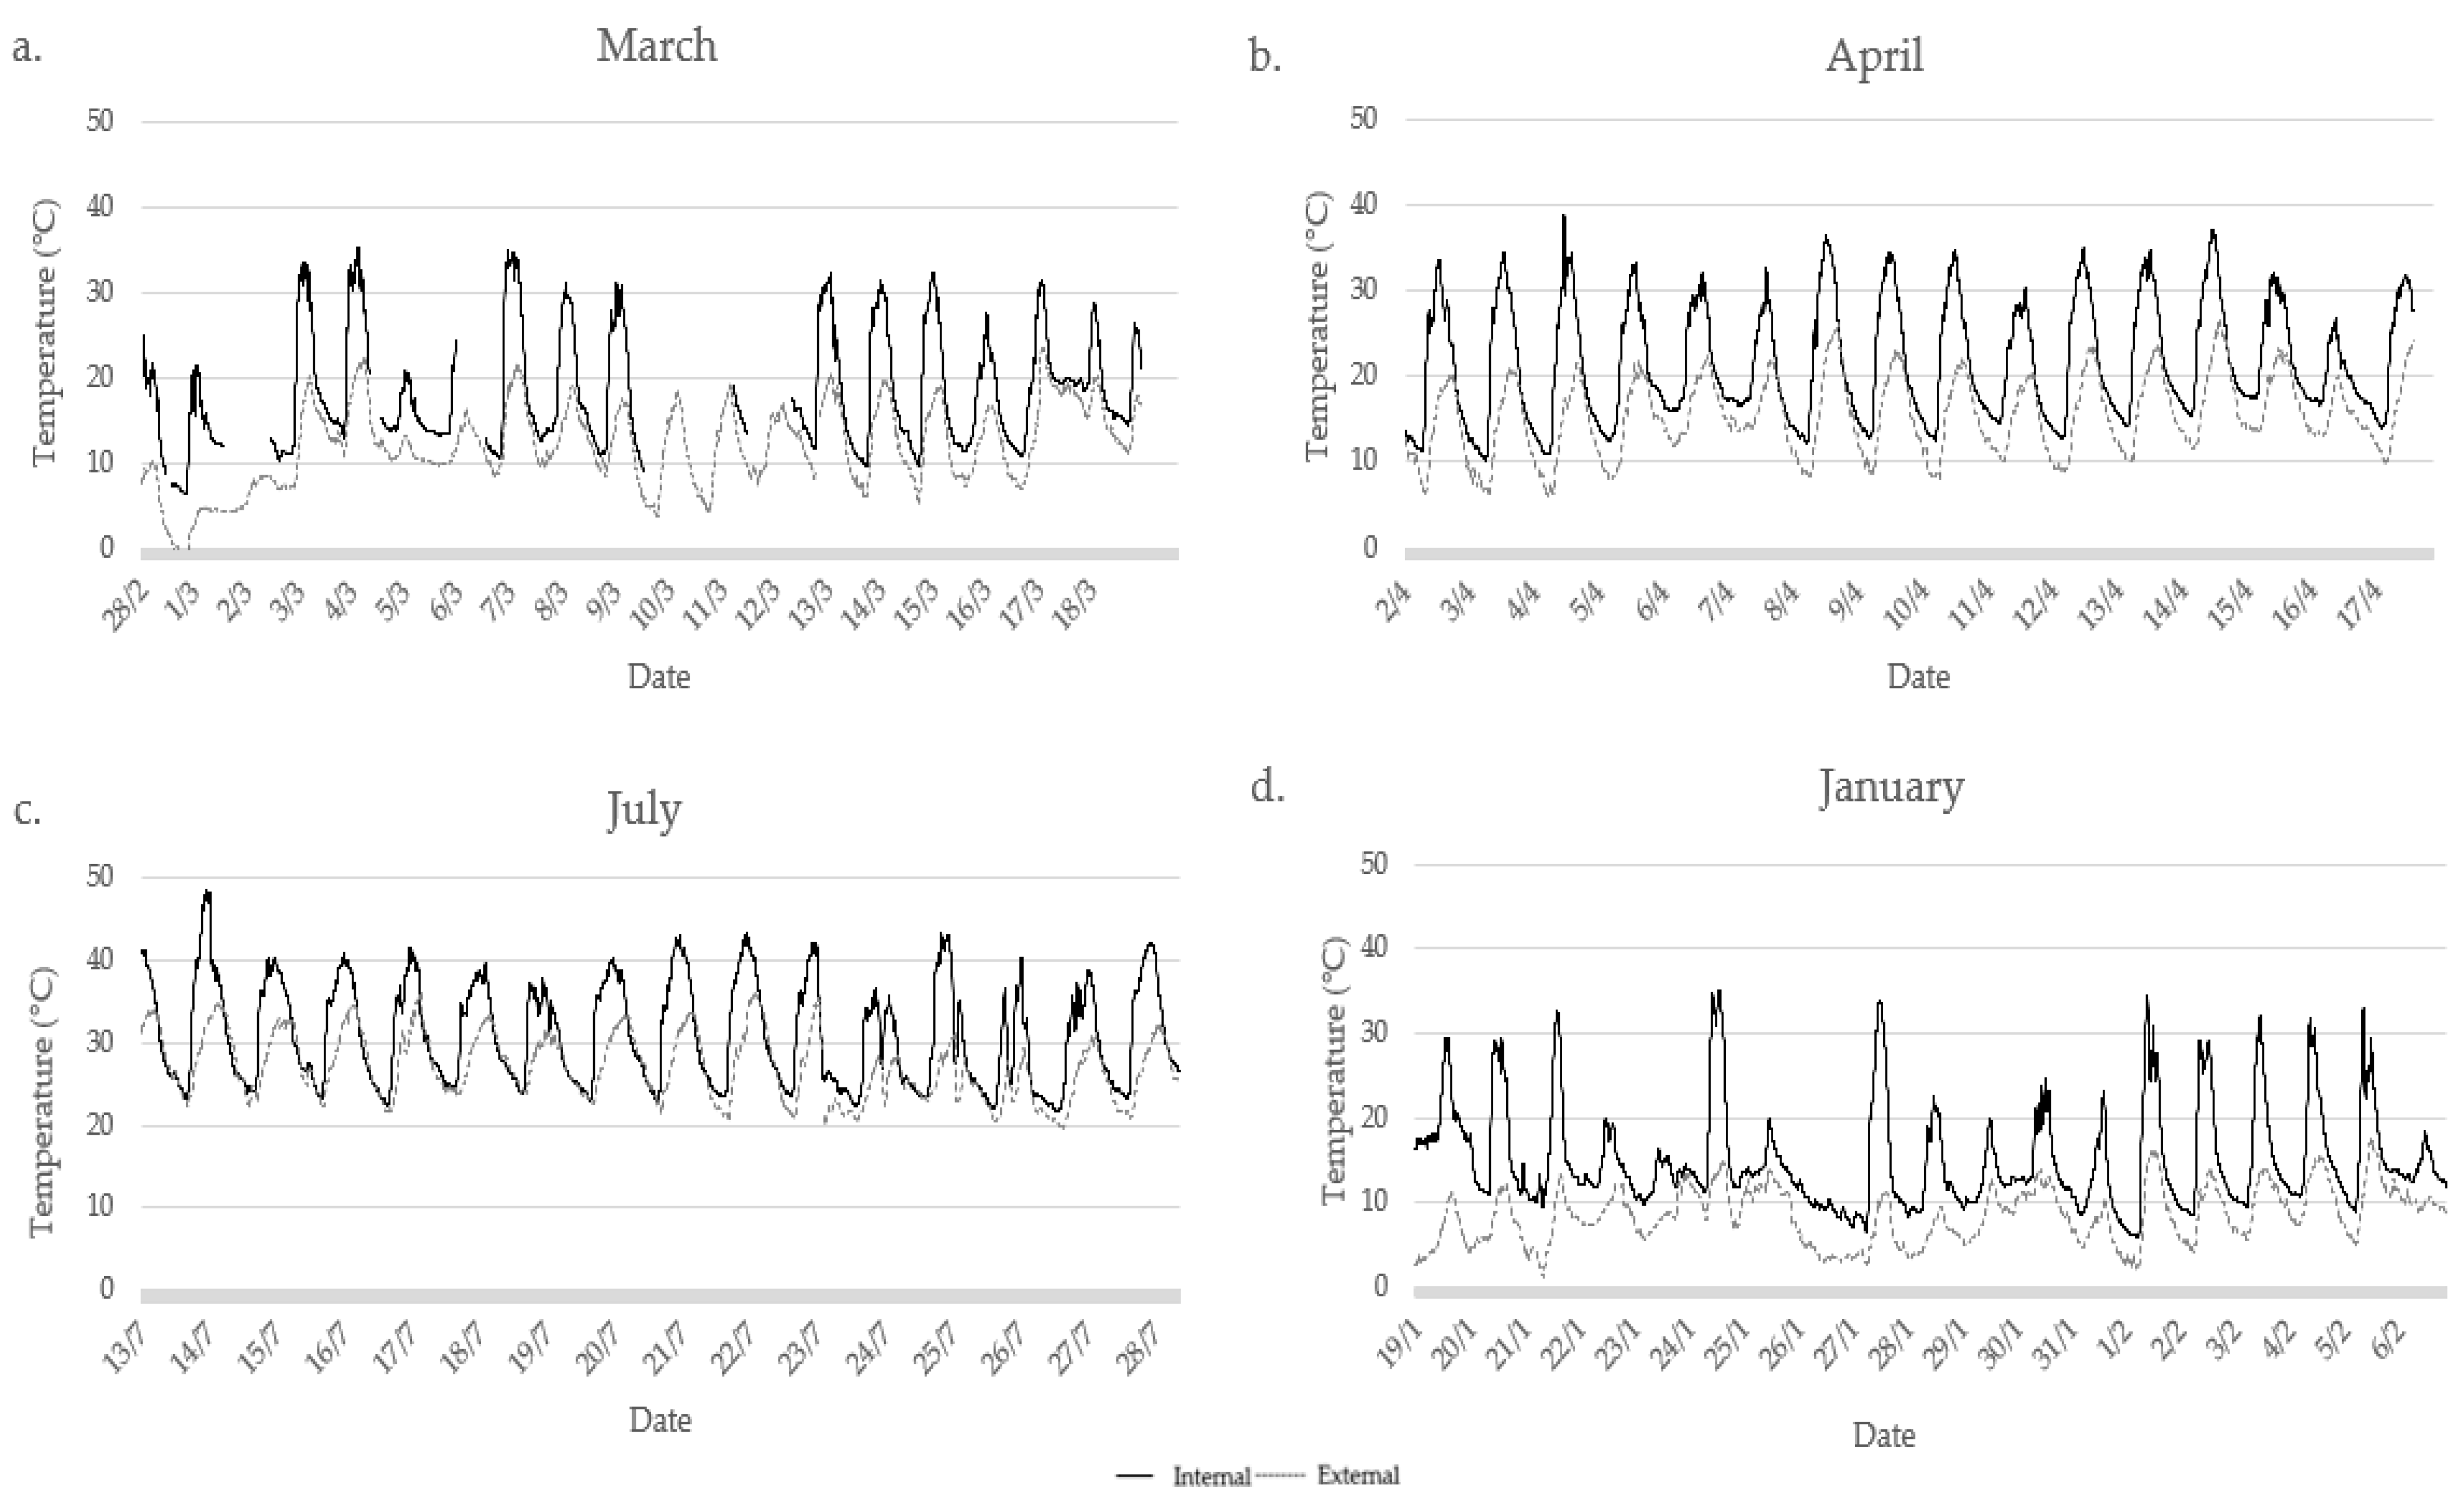
3.1.1. Air Temperature and Relative Humidity (RH)

In all seasonal experiments, the greenhouse temperature was in accordance with the external temperature, in terms of maximum and minimum of each day (Figure 3). In the experiment conducted in March, the maximum external temperature was noted on 17 March, while the maximum greenhouse temperature was on the 04 (Figure 3a). Greenhouse temperature was affected both by the external temperature and the daylight. The minimum greenhouse air temperature was recorded on the first of 1–3 March, although the period 10–13 March was not taken into account because the inside temperature sensor was not functional. The minimum greenhouse temperature in March was 6.4 °C while the maximum was close to 35.3 °C, with an average internal temperature of 18.4 °C. The average external monthly temperature in March is usually around 11.9 °C. The greenhouse air temperature in April exceeded 30 °C daily whilst the external was about 20 °C (Figure 3b). The minimum air temperature ranged from 10–15 °C inside the greenhouse and 5–10 °C in the external environment. The average external temperature in April usually reaches 15.5 °C. In April, the average temperature inside the greenhouse was 3.2 °C higher compared to March, while the minimum and maximum temperatures inside the greenhouse were 10.2 °C and 38.8 °C, respectively. In July, given that it is typically the hottest month of the year, with an average monthly temperature around 27 °C, extreme air temperatures were noted inside the greenhouse (Figure 3c). The average air temperature inside the greenhouse was 30.9 °C, while the minimum and maximum air temperatures were 21.7 °C and 48.3 °C, respectively. January is the month with the lowest temperatures of the year with an average monthly temperature around of 8.5 °C in Thessaloniki (North Greece). Despite the fact that the external temperature was low, the greenhouse air temperature exceeded 25 °C on sunny days. The minimum indoor air temperature was 5.8 °C and the maximum was 35 °C, while the average temperature was 15.1 °C (Figure 3d).
Air humidity is a determining factor in the development of a greenhouse crop. The total RH inside the greenhouse results from condensation on the walls of the greenhouse due to the evaporation of the crop. RH is the result of the balance between the loss of water vapor in the greenhouse environment and the evaporation of the plant. Plants exposed to high air temperatures need higher levels of RH [24]. In March, the mean greenhouse RH was 56%, while the corresponding value for the external was 70.6%. In April, the average internal RH was close to 56.4% while the corresponding value for the external reached 71.2%, being slightly different from March. In July, due to high temperatures, the average internal RH was 43.5%, while the average external RH was 58.7%. In January, RH values were higher compared to previous experiments. The average external RH was 84.4% and the internal RH was 66.1%.

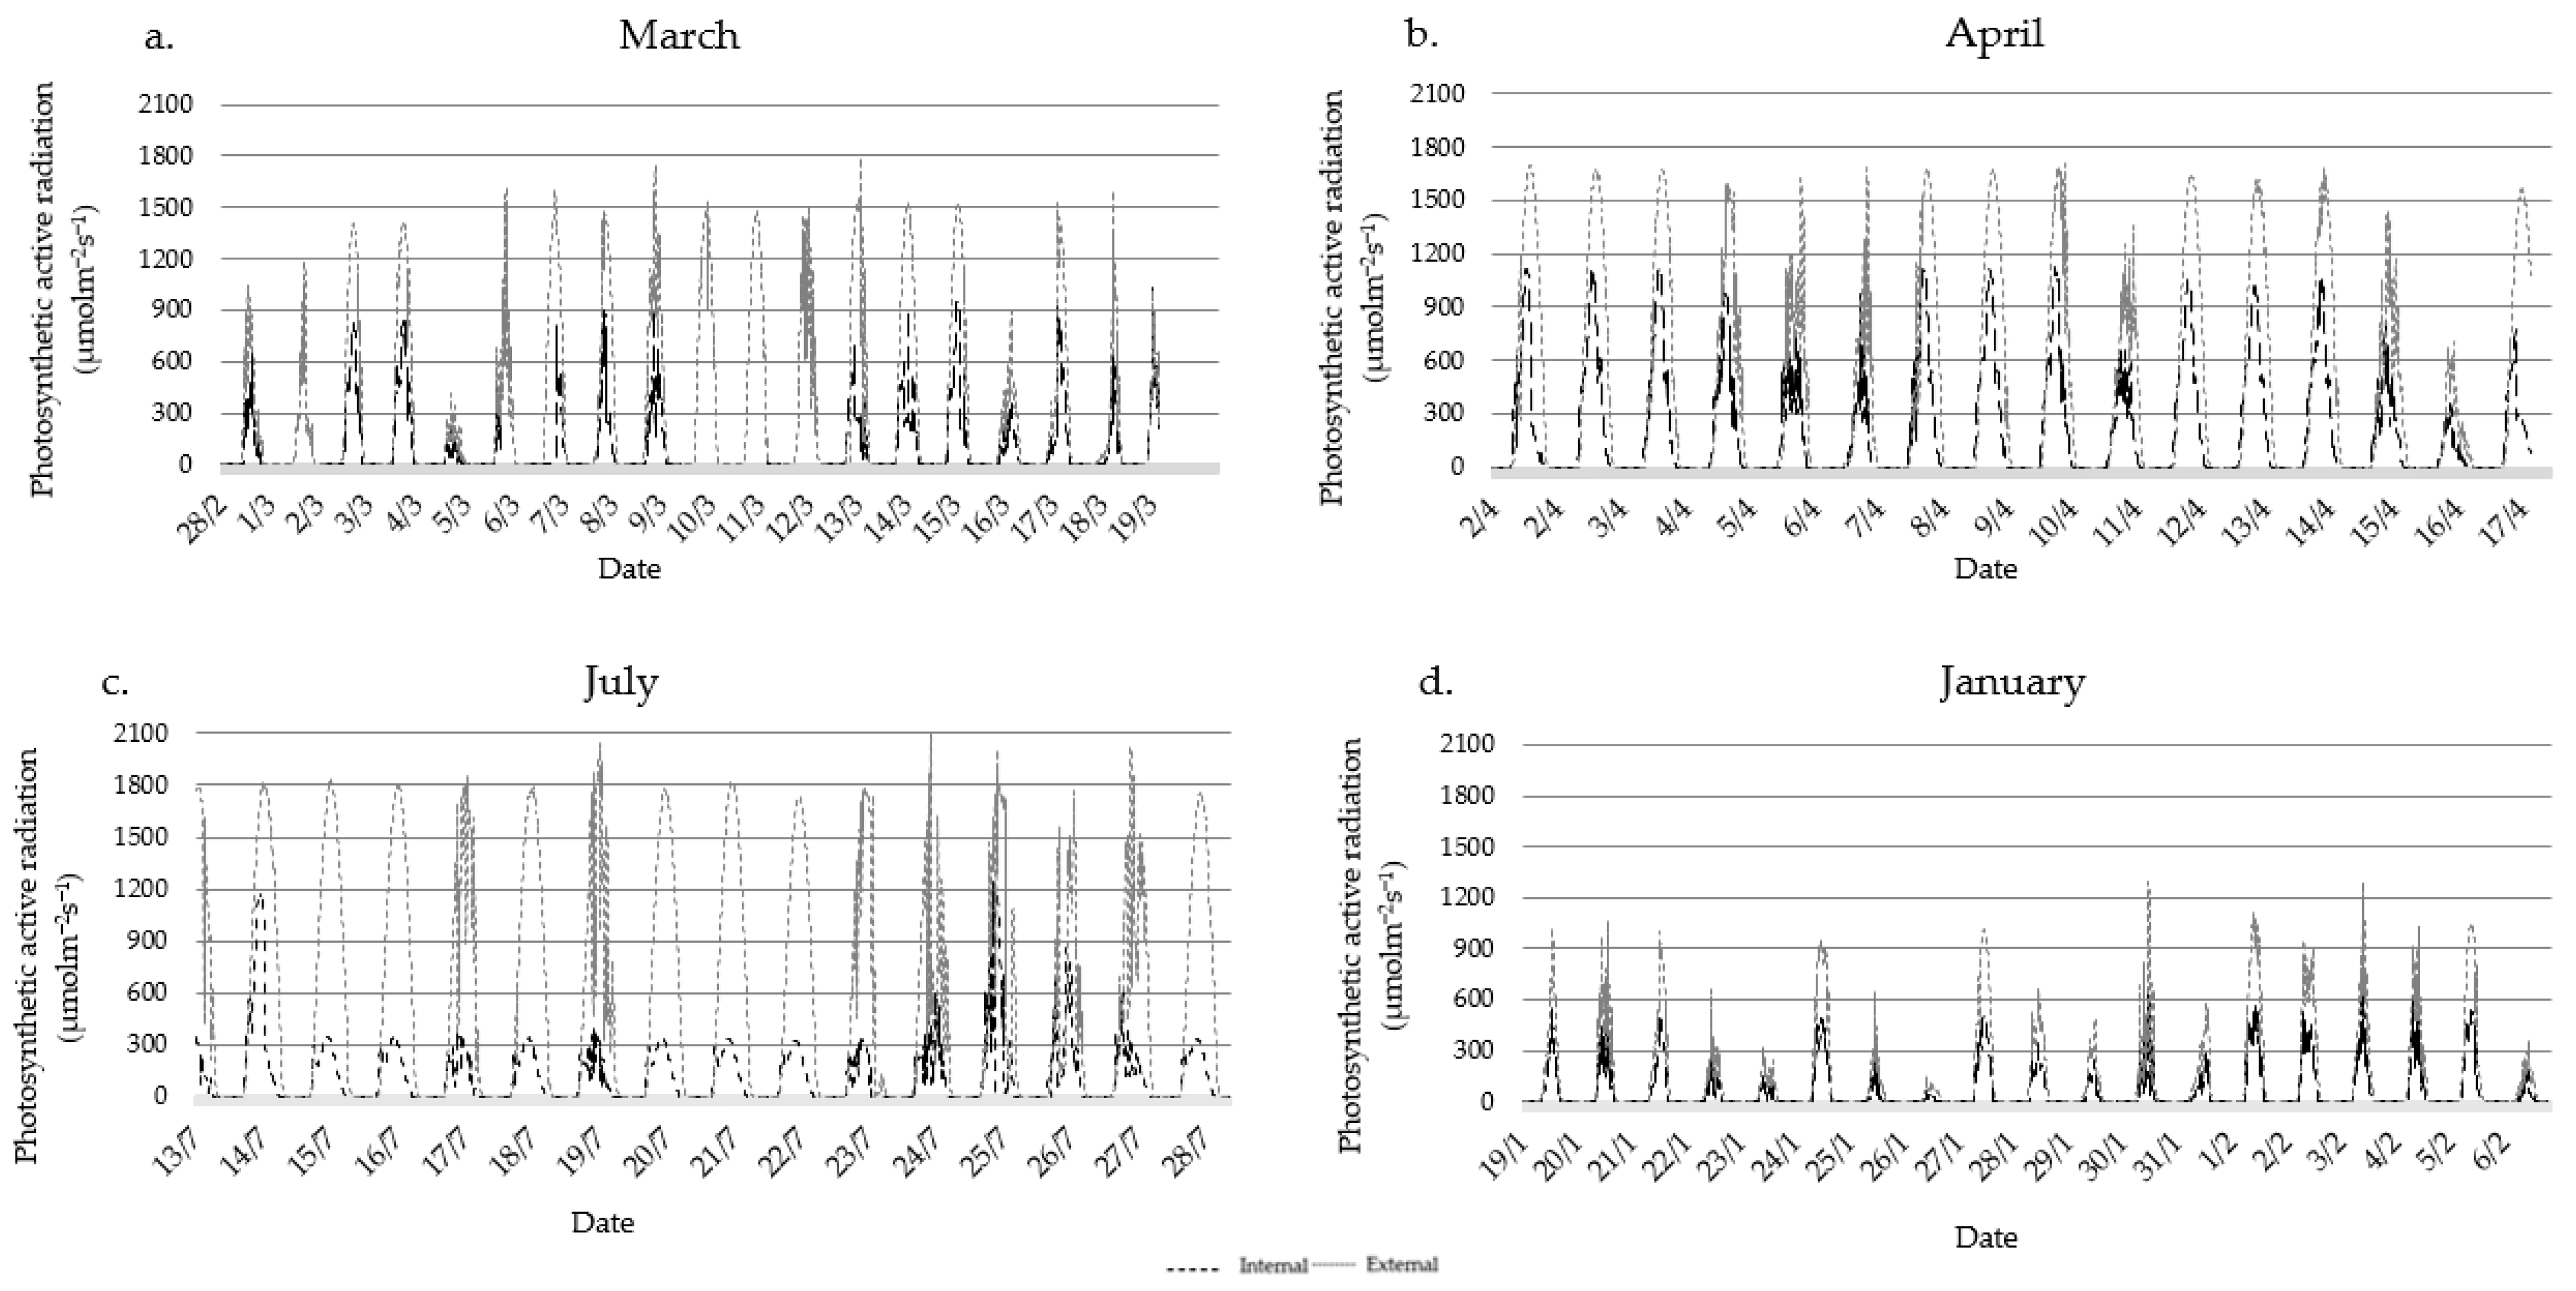
3.1.2. Photosynthetic Active Radiation (PAR) Evaluation

Photosynthetic active radiation is the light used by plants for photosynthesis that includes only the visible part of the solar spectrum with wavelength between 400 and 700 nm, measured in μmolm−2s−1. PAR in the greenhouse is lower than the external PAR due to the greenhouse covering material, causing a reduction of up to 45%. In April (Figure 4b), PAR values were higher than March (Figure 4a) due to the increase in solar irradiation. Significantly lower PAR was observed during the summer, due to the use of shadow screens, while in January (Figure 4d), the external conditions did not allow for an increase of PAR inside the greenhouse.

3.2. Root Zone Temperature per Tank

The minimum (min), maximum (max) and average (mean) RZT per tank and per seasonal experiment are presented in Table 2.
In March (Figure 5a), the minimum and maximum RZT in the PV and PPG tanks were close to the target value of 22 °C, with an average of 22.2 °C in both tanks. On the contrary, the RZT for the Control tank ranged from 15.9 °C to 18.1 °C, as it was affected by environmental conditions, in contrast to the other two. In April (Figure 5b), the water temperature increased following the ambient temperature, resulting in higher average RZT in the PPG and PV tanks, while in the Control tank, it was near the target value. The RZT for the PPG and PV tanks ranged from 21.6 °C to 25.8 °C, and 22.1 °C to 26.3 °C, respectively, exceeding the target value of 22 °C.
In April, the RZT in the Control tank was very close to the target value due to the internal air temperature of the greenhouse during the day. The fresh water that filled the tank was at a higher temperature compared to March, and it complied to the environmental temperature within 3 days, in comparison to 4 days in March. During that experiment, the chiller was not used in any tank. Hence, there was no way to cool the water temperature when it rose above normal levels. Despite the fluctuations, the RZT in the PPG and PV tanks were close the target value set. Thus, the requirements of both tanks, regarding energy, were met.
In July (Figure 5c), a hydroponic chiller was used for cooling the water when needed, using the solar panel outside the greenhouse as the only source of energy. The PPG tank was not used during the summer period. Regarding the photovoltaics, they performed well due to the high solar irradiation, resulting in them adequately covering the cooling needs of the nutrient solution and, consequently, the RZT. Meanwhile, the ambient air temperature in the greenhouse exceeded 40 °C for several hours during the day and dropped to 25 °C in the nighttime. Thus, the RZT in the Control tank was close to 30 °C, which was much higher than the target value.
Finally, in January (Figure 5d), the RZT in the PPG tank, having no limit regarding the available energy, was completely within the limits set at the beginning of the experiment concerning minimum and maximum temperature, while the average was at 22 °C. Instead, the RZT in the PV tank had a maximum temperature of 18.7 °C, which means that January’s low solar irradiation was insufficient, and the system did not have the proper power to heat the water. During the day, when ambient temperature was rising, the RZT in both the PPG and PV tanks also rose (Figure 5d). Besides that, the RZT in the PV tank was also affected by the higher solar irradiation. On the contrary, and even though Control tank was also exposed to ambient temperatures, its RZT did not change due to high heat capacity of the water, rendering heating a difficult process, even on days when the indoor air temperature was high. Therefore, it was found that the 1 kWp power of the photovoltaic system was able to meet a large part of the needs when it was sunny, as in March, April and July, but in January, the PV system could not cope with the energy demand.

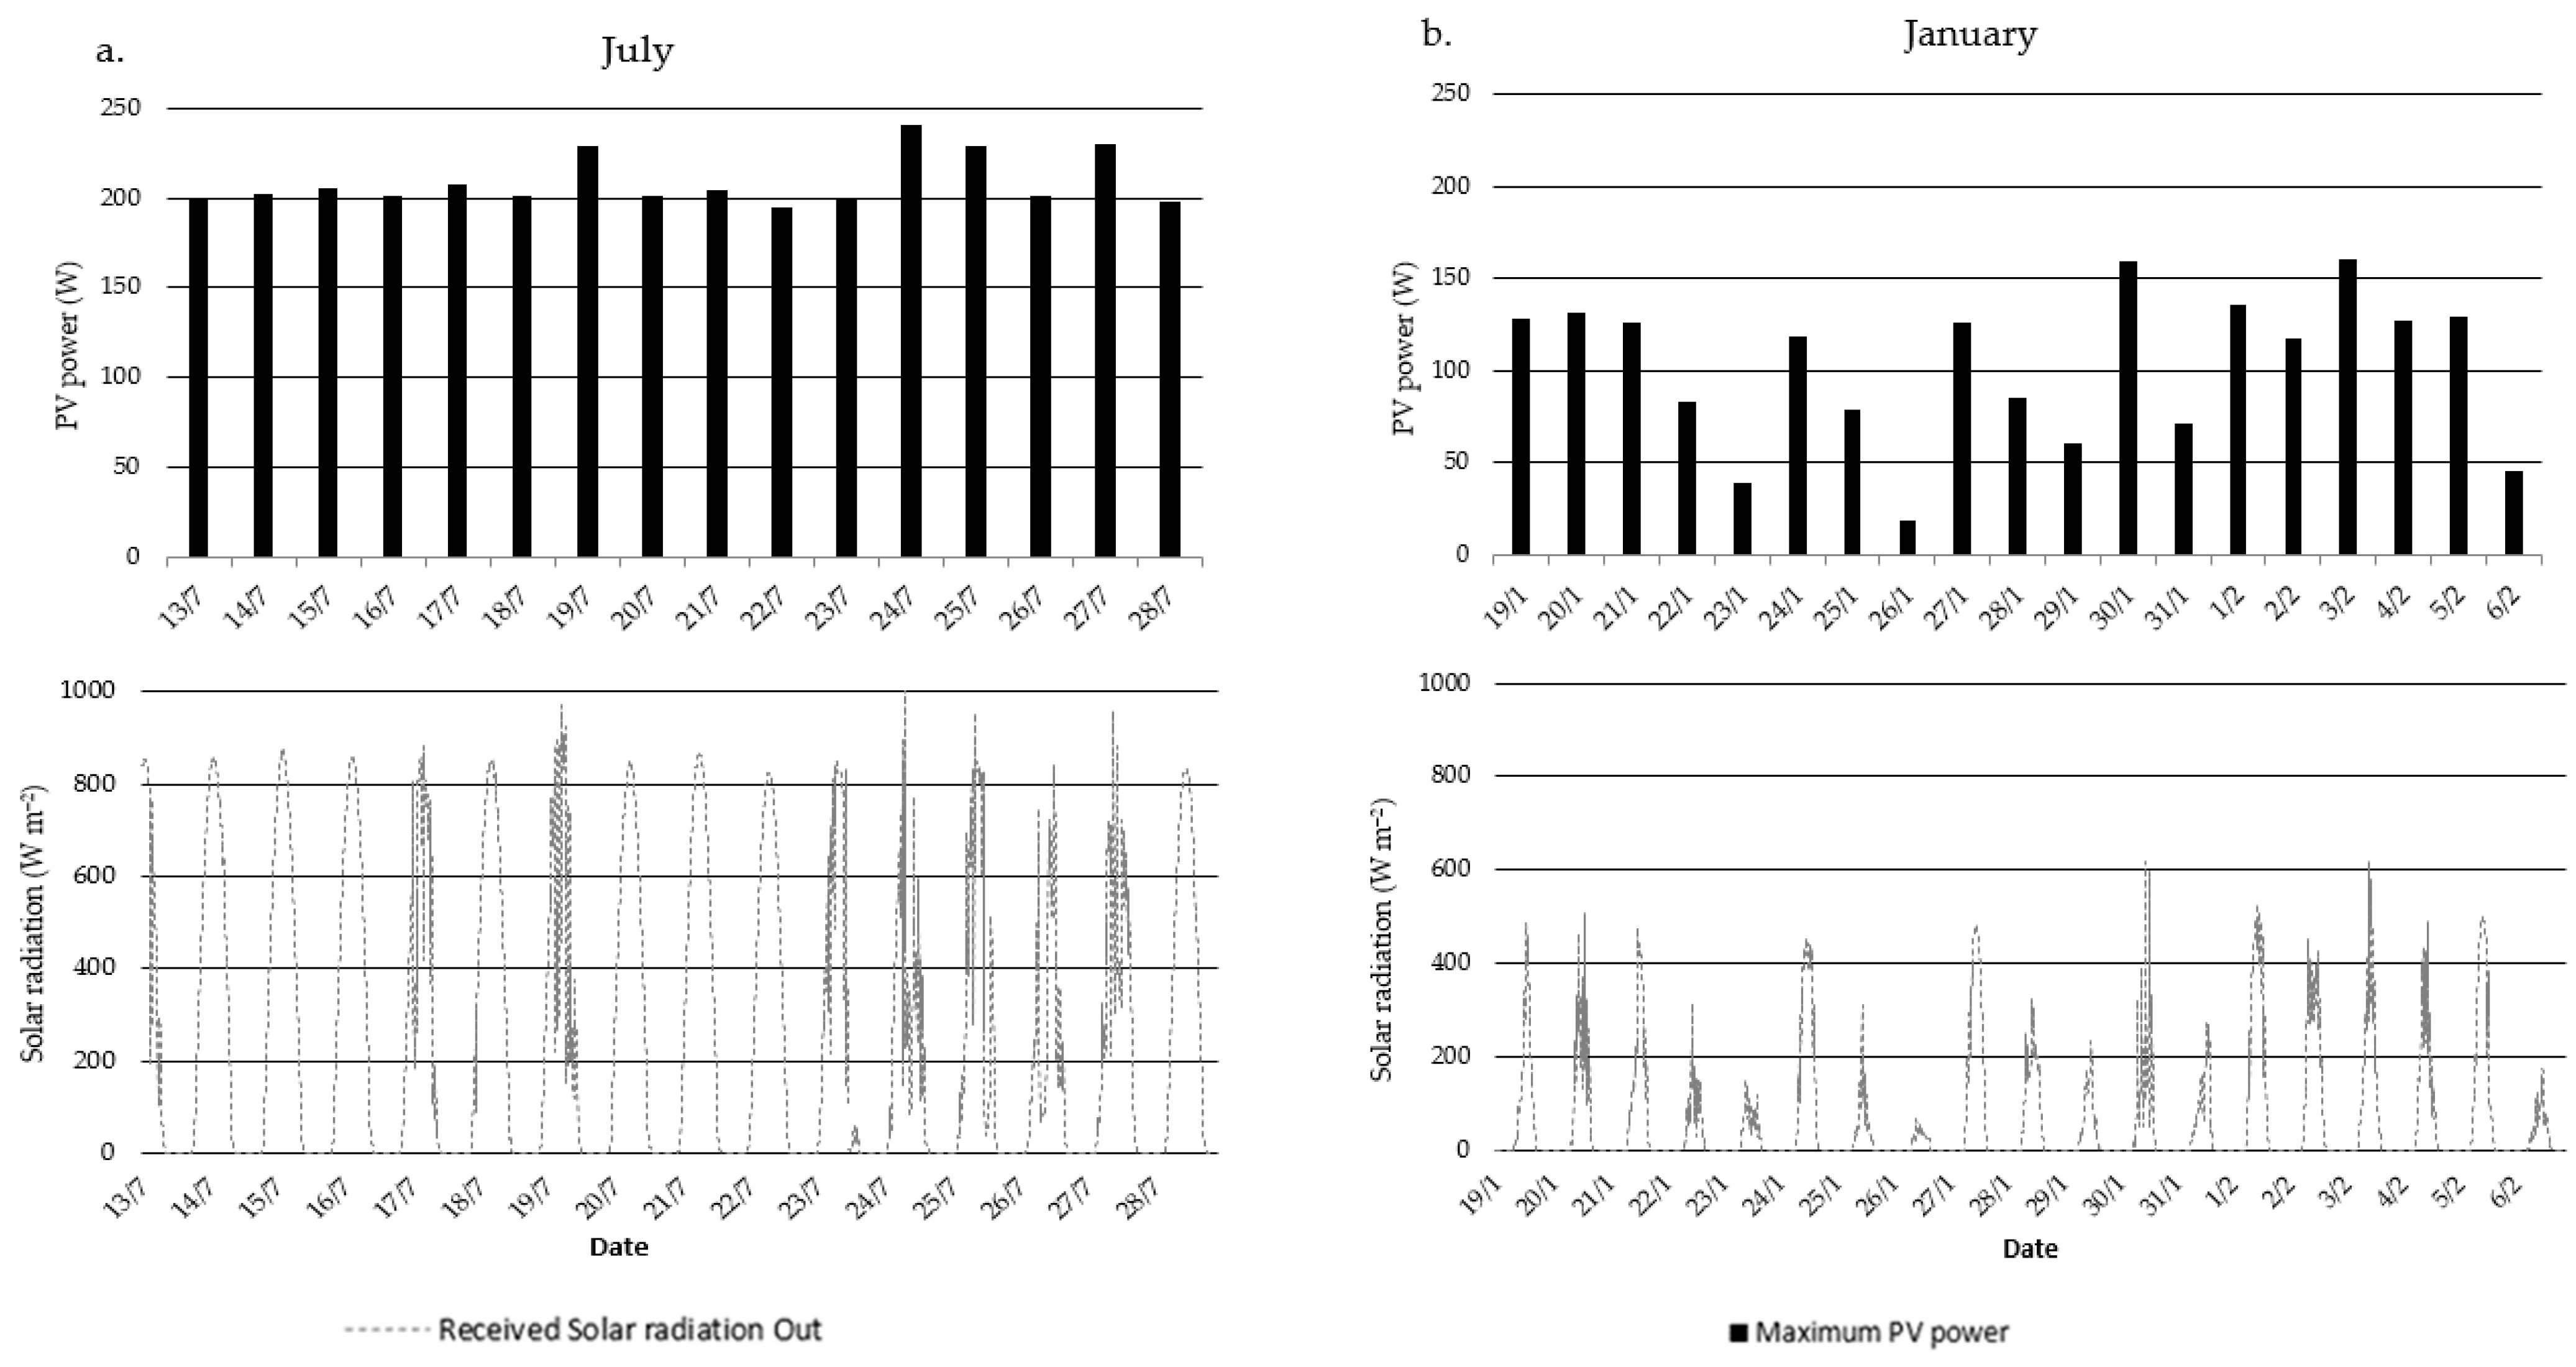
3.3. Energy Analysis, Energy Use Efficiency (EUE) and Total Yield per Experimental Period

Regarding total yield per tank, PPG was the most efficient between the three, even though 2.1 times more energy was consumed compared to the PV tank (Table 3). Energy in PPG tank was available whenever needed, while in PV tank energy availability depended on the weather conditions i.e., when the weather was sunny or when energy was stored in batteries and it was available. In March, there were no statistically significant differences between any of the tanks regarding yield. The electric energy consumptions of the PPG and PV tank were 50 kWh and 35 kWh, respectively. Nevertheless, in April, the Control tank performed better than the rest, while having statistically significant differences with the PV tank, but not with the PPG tank. April was, overall, the most productive month concerning yield and electric energy consumption (26 kWh and 12 kWh in PPG and PV, respectively). Both spring period experiments, though, led to the conclusion that there was no need to control the nutrient solution temperature. In April, the RZT actually needed cooling and not heating. Therefore, higher than 22 °C mean RZTs were recorded both in the PPG and PV tanks. High solar radiation levels in combination with mean RZT in the Control tank at 22.7 °C, when greenhouse air was neither too cold or too warm, led to optimum growth conditions and, consequently, higher yield. In the summer period, solar energy was fully available, so the PV tank consumed the highest amount of energy. A hydroponic chiller was used to cool the PV tank. Yield values were significantly higher in the PV tank compared to the Control, and energy consumption reached 73 kWh, which is below the maximum available energy from the 1 kW PV system, calculated by the PVSIS platform for Thessaloniki, Greece (next paragraph). To reach a yield of 2.3 kg m−2 (22.7* t/ha) in the PPG tank, while maintaining a RZT of 22 °C, would lead to energy needs and consumption of ca. 87.5 kWh. Based on that estimation, the energy provided to the PV tank from the photovoltaic system was adequate. That is also confirmed by Figure 5c, which shows a slight fluctuation of RZT in the PV tank throughout the experiment, with average values 10 °C lower than the Control tank. In the winter period, the yield in the PPG tank had statistically significant differences compared to the yield in the Control tank and was 32% more productive. Nevertheless, the winter period, based on the PPG energy consumption, recorded the highest energy needs for heating compared to the other experimental seasons (125 kWh and 12 kWh in PPG and PV, respectively), which, however, does not comply to yield. In general, cooling and heating of the RZT allows cultivation of baby lettuce inside greenhouses during the summer without blooming, as well as with significantly higher values both in summertime and wintertime, justifying the installation of a heating/cooling system especially powered by RES.
Conditions in all three tanks resulted in different energy consumptions, and thus, led to different energy use efficiencies (Table 3). The highest EUE was noted in the PV tank in April with 0.51 kg kWh−1, while the lowest was in the PPG tank in winter with 0.05 kg kWh−1. PV tanks in every seasonal experiment were more efficient, regarding the energy use, compared to PPG tanks. The lowest EUE both in PPG and PV tanks were observed during the summer as a result of the higher cooling needs and the insufficient energy consumption of the photovoltaic panels, in combination with lower yield.
Compared to [11], where different heating systems methods were used, the energy consumption in the current experimental study was lower. More specifically, during the similar experimental season, from February to March, the energy consumption per square meter and on an average per day amounted to 1 kWh m−2 d−1 for the the PPG tank and 0.73 kWh m−2 d−1 for the PV. On the contrary, in [11], 3.6 kWh m−2 d−1 were consumed to heat the volume of the greenhouse with an air heater technology, while 6.12 kWh m−2 d−1 were consumed for heating the roots of the plants using a condensing boiler and 3.2 kWh m−2 d−1 using a heat pump.
In all growing periods, since the energy consumption was higher in the PPG than in the PV system, carbon footprint from energy use was also higher. The carbon footprint values were higher in the fourth growing season for the system with PPG (58.3 kg CO2-eq m−2) and for the third growing season with heating energy from PV (2.3 kg CO2-eq m−2). Similar work showed that the carbon footprint value per cultivated area using electricity to heat greenhouses was 47.5–99.4 kg CO2-eq m−2 [14] and 13.9 ± 2.3 kg CO2-eq m−2 [17].
The linkage between solar irradiation and energy production of photovoltaic panels is shown in Figure 6. During spring months, external solar irradiation ranged from 700–800 W m−2 and the photovoltaic system had a power supply of 200 W for the majority of days with high solar irradiation. Consequently, increased energy production was generated from the photovoltaic panels, as shown in Figure 6a,b.
In July (Figure 7a), due to high temperature (ca. 30–35 °C maximum during daylight), the photovoltaic system could not operate to the maximum degree and yield the maximum output. The maximum power that the installed photovoltaic panel could deliver was 250 Wp with standard test conditions (STC), cell temperature conditions of 25 °C, and irradiance of 1000 W m−2. As shown by Amelia et al., with the use of PVSYST software, for constant solar irradiation 1000 W m−2 and different temperature values, the output power of the photovoltaic system is affected by the ambient temperature [25]. Increasing the temperature reduces the output voltage of the photovoltaic panels. Energy production in January was lower than in March due to lower values of solar irradiation (Figure 7b). External solar irradiation in January ranged from 400–500 W m−2. The low solar irradiation affected the energy production of the photovoltaic panels, leading to less efficient energy production.

3.4. Carbon Footprint Calculation and Year-Round Cultivation Case Study

The results of the carbon footprint calculation indicated the difference between the power supply system via photovoltaic panels and public electrical supply grid. The values of the carbon footprint for all four growing seasons are shown in detail in Table 3. The carbon footprint in the tank where electric energy was provided by PPG was calculated at 134.8 kg CO2-eq m−2, while the corresponding value for PV was 4.1 kg CO2-eq m−2. Therefore, the lowest carbon footprint resulting from PV energy may contribute to the reduction of the environmental footprint when using electricity and consequently to products with high added value. Moreover, in the work of Pereira et al., where no energy was used to heat the greenhouse, the carbon footprint for the production of one kilogram of vegetables was quite low and was estimated at 0.1 kg CO2 eq kg−1–0.5 kg CO2 eq kg−1 [26]. These results demonstrate the large contribution that electricity can make to the carbon footprint.
Energy production and consumption were also analyzed for year-round cultivation, based on the experimental data. More specifically, the April experiment was counted as a spring period and March was counted as an autumn period, mostly since the temperatures of March reflect the temperatures of October. July was considered as the average summer period and January reflected the average winter period. In this case study, the number of harvests was calculated based on the cultivation period and according to the days of each month. Thus, during spring, 5.58 harvests were calculated over a period of 92 days, which is the sum of the spring days. In summer, autumn and winter, 6.57, 5.52 and 5.29 harvests were calculated in 92, 91 and 90 days, respectively. The energy consumption of the tanks for each season were calculated in the same way. Regarding the total sum, it was observed that the PV tank had almost no difference in yield compared to the Control tank. On the other hand, PV differed from PPG, as the yield was 10.9% lower, and power consumption was also 69.6% lower (Table 4). Similarly, Yildirim and Bilir [7], who evaluated a hybrid energy system for cooling using heat pump and solar panels, calculated the annual energy consumption at 118kWh m−2. On the contrary, in this study, the energy consumption per square meter was 230.2 kWh m−2 from PPG and 191.8 kWh m−2 from PV from June to August. Based on the above assumption regarding yield and energy consumption, in a full growing season with 22.96 annual harvests, the PV tank proved to be the most efficient method of heating and cooling the nutrient solution (Table 4).

4. Conclusions

The public power grid and photovoltaic panels were evaluated for the hydroponic cultivation of baby lettuce in a floating system with RZT control but without controlling the greenhouse air temperature. Yield, EUE and carbon footprint, at different seasons of the year, were determined. During the summer period, the photovoltaic system was able to cover the energy demands of the system, though in the winter period, the system was not efficient due to low solar irradiation values. In March, the RZT was lower than the target value of 22 °C, resulting in energy being consumed. However, during April, the RZT was within the area of the target value and energy was not needed. In total, the PPG-powered tank was more productive than the PV-powered tank by 11.1%; however the carbon footprint of the energy used varied considerably between the two systems. The system with the PV system had a substantially lower annual value, which was calculated at 1.6 kg CO2-eq kg−1, compared to the 49.9 kg CO2-eq kg−1 calculated for the system with the PPG system. In future research, net metering programs could be considered, with the generated electricity being consumed if there is a demand from the system and the excess being fed into the public power grid.

Author Contributions

Conceptualization, G.K.N. and A.K.; methodology, G.K.N. and A.K.; investigation, G.K.N. and I.C.; data curation, G.K.N., G.L., I.C., M.R. and A.K.; writing—original draft preparation, G.L., I.C. and M.R.; writing—review and editing, G.K.N. and A.K. All authors have read and agreed to the published version of the manuscript.

Funding

This research received no external funding.

Institutional Review Board Statement

Not applicable.

Informed Consent Statement

Not applicable.

Data Availability Statement

Not applicable.

Conflicts of Interest

The authors declare no conflict of interest.

References

  1. Panwar, N.L.; Kaushik, S.C.; Kothari, S. Solar Greenhouse an Option for Renewable and Sustainable Farming. Renew. Sustain. Energy Rev. 2011, 15, 3934–3945. [Google Scholar] [CrossRef]
  2. Gruda, N.; Bisbis, M.; Tanny, J. Influence of Climate Change on Protected Cultivation: Impacts and Sustainable Adaptation Strategies—A Review. J. Clean. Prod. 2019, 225, 481–495. [Google Scholar] [CrossRef]
  3. Khan, F.A. A Review an Hydroponic Greenhouse Cultivation for Sustainable Agriculture. Int. J. Agric. Environ. Food Sci. 2018, 2, 59–66. [Google Scholar] [CrossRef] [Green Version]
  4. Djevic, M.; Dimitrijevic, A. Energy Consumption for Different Greenhouse Constructions. Energy 2009, 34, 1325–1331. [Google Scholar] [CrossRef]
  5. Gruda, N. Impact of Environmental Factors on Product Quality of Greenhouse Vegetables for Fresh Consumption. CRC Crit. Rev. Plant Sci. 2005, 24, 227–247. [Google Scholar] [CrossRef]
  6. Gruda, N.; Bisbis, M.; Tanny, J. Impacts of Protected Vegetable Cultivation on Climate Change and Adaptation Strategies for Cleaner Production—A Review. J. Clean. Prod. 2019, 225, 324–339. [Google Scholar] [CrossRef]
  7. Yildirim, N.; Bilir, L. Evaluation of a Hybrid System for a Nearly Zero Energy Greenhouse. Energy Convers. Manag. 2017, 148, 1278–1290. [Google Scholar] [CrossRef]
  8. Campiotti, A.C.; Bibbiani, C.; Dondi, F.; Viola, C. Efficienza energetica e fonti rinnovabili per l’agricoltura protetta. Ambiente Risorse Salut. 2010, 126, 6–12. [Google Scholar]
  9. Sagheer, A.; Mohammed, M.; Riad, K.; Alhajhoj, M. A Cloud-Based IoT Platform for Precision Control of Soilless Greenhouse Cultivation. Sensors 2020, 21, 223. [Google Scholar] [CrossRef]
  10. FAO. Unlocking the Potential of Protected Agriculture in the Countries of the Gulf Cooperation Council—Saving Water and Improving Nutrition; FAO: Cairo, Egypt, 2021. [Google Scholar]
  11. Terrosi, C.; Cacini, S.; Burchi, G.; Cutini, M.; Brambilla, M.; Bisaglia, C.; Massa, D.; Fedrizzi, M. Evaluation of Compressor Heat Pump for Root Zone Heating as an Alternative Heating Source for Leafy Vegetable Cultivation. Energies 2020, 13, 745. [Google Scholar] [CrossRef] [Green Version]
  12. Ntinas, G.K.; Neumair, M.; Tsadilas, C.D.; Meyer, J. Carbon Footprint and Cumulative Energy Demand of Greenhouse and Open-Field Tomato Cultivation Systems under Southern and Central European Climatic Conditions. J. Clean. Prod. 2017, 142, 3617–3626. [Google Scholar] [CrossRef]
  13. Ntinas, G.K.; Kadoglidou, K.; Tsivelika, N.; Krommydas, K.; Kalivas, A.; Ralli, P.; Irakli, M. Performance and Hydroponic Tomato Crop Quality Characteristics in a Novel Greenhouse Using Dye-Sensitized Solar Cell Technology for Covering Material. Horticulturae 2019, 5, 42. [Google Scholar] [CrossRef] [Green Version]
  14. Ntinas, G.K.; Dannehl, D.; Schuch, I.; Rocksch, T.; Schmidt, U. Sustainable Greenhouse Production with Minimised Carbon Footprint by Energy Export. Biosyst. Eng. 2020, 189, 164–178. [Google Scholar] [CrossRef]
  15. ISO 14044; International Standard. Environmental Management—Life Cycle Assessment—Requirements and Guidelines. International Organization for Standardization: Geneva, Switzerland, 2006.
  16. Boulard, T.; Raeppel, C.; Brun, R.; Lecompte, F.; Hayer, F.; Carmassi, G.; Gaillard, G. Environmental Impact of Greenhouse Tomato Production in France. Agron. Sustain. Dev. 2011, 31, 757–777. [Google Scholar] [CrossRef] [Green Version]
  17. Pérez Neira, D.; Soler Montiel, M.; Delgado Cabeza, M.; Reigada, A. Energy Use and Carbon Footprint of the Tomato Production in Heated Multi-Tunnel Greenhouses in Almeria within an Exporting Agri-Food System Context. Sci. Total Environ. 2018, 628–629, 1627–1636. [Google Scholar] [CrossRef]
  18. Almeida, J.; Achten, W.M.J.; Verbist, B.; Heuts, R.F.; Schrevens, E.; Muys, B. Carbon and Water Footprints and Energy Use of Greenhouse Tomato Production in Northern Italy. J. Ind. Ecol. 2014, 18, 898–908. [Google Scholar] [CrossRef]
  19. Lennard, W.A.; Leonard, B.V. A Comparison of Three Different Hydroponic Sub-Systems (Gravel Bed, Floating and Nutrient Film Technique) in an Aquaponic Test System. Aquac. Int. 2006, 14, 539–550. [Google Scholar] [CrossRef]
  20. Karnoutsos, P.; Karagiovanidis, M.; Bantis, F.; Chatzistathis, T.; Koukounaras, A.; Ntinas, G.K. Controlled Root-zone Temperature Effect on Baby Leaf Vegetables Yield and Quality in a Floating System under Mild and Extreme Weather Conditions. J. Sci. Food Agric. 2021, 101, 3933–3941. [Google Scholar] [CrossRef]
  21. Hood, T.M.; Mills, H.A. Root-Zone Temperature Affects Nutrient Uptake and Growth of Snapdragon. J. Plant Nutr. 1994, 17, 279–291. [Google Scholar] [CrossRef]
  22. Al-Rawahy, M.S.; Al-Rawahy, S.A.; Al-Mulla, Y.A.; Nadaf, S.K. Effect of Cooling Root-Zone Temperature on Growth, Yield and Nutrient Uptake in Cucumber Grown in Hydroponic System During Summer Season in Cooled Greenhouse. J. Agric. Sci. 2018, 11, 47. [Google Scholar] [CrossRef]
  23. Pennisi, G.; Pistillo, A.; Orsini, F.; Cellini, A.; Spinelli, F.; Nicola, S.; Fernandez, J.A.; Crepaldi, A.; Gianquinto, G.; Marcelis, L.F.M. Optimal Light Intensity for Sustainable Water and Energy Use in Indoor Cultivation of Lettuce and Basil under Red and Blue LEDs. Sci. Hortic 2020, 272, 109508. [Google Scholar] [CrossRef]
  24. Kittas, C.; Karamanis, M.; Katsoulas, N. Air Temperature Regime in a Forced Ventilated Greenhouse with Rose Crop. Energy Build. 2005, 37, 807–812. [Google Scholar] [CrossRef]
  25. Amelia, A.R.; Irwan, Y.M.; Leow, W.Z.; Irwanto, M.; Safwati, I.; Zhafarina, M. Investigation of the Effect Temperature on Photovoltaic (PV) Panel Output Performance. Int. J. Adv. Sci. Eng. Inf. Technol. 2016, 6, 682–688. [Google Scholar]
  26. De Pereira, B.J.; Cecílio Filho, A.B.; la Scala, N. Greenhouse Gas Emissions and Carbon Footprint of Cucumber, Tomato and Lettuce Production Using Two Cropping Systems. J. Clean. Prod. 2021, 282, 124517. [Google Scholar] [CrossRef]
Figure 1. Three-dimensional graphic representation of the experimental design.
Sustainability 15 01024 g001
Figure 2. PV System layout.
Sustainability 15 01024 g002
Figure 3. Greenhouse air temperature (external/internal), (a) March, (b) April, (c) July, (d) January.
Sustainability 15 01024 g003
Figure 4. Greenhouse photosynthetic active radiation (PAR) (internal/external), (a) March, (b) April, (c) July, (d) January.
Sustainability 15 01024 g004
Figure 5. RZT and greenhouse air temperature, (a) March, (b) April, (c) July, (d) January.
Sustainability 15 01024 g005
Figure 6. Correlation between external solar radiation and PV power potential, (a) March, (b) April.
Sustainability 15 01024 g006
Figure 7. Correlation between external solar radiation and PV power potential, (a) July, (b) January.
Sustainability 15 01024 g007
Table 1. Complete Photovoltaic Panel Ecosun—ES-POLY250 characteristics.
System ParametersNomenclatureValues
Photovoltaic Panel Ecosun—ES-POLY250
Rated Power [W]Pmpp250
Max. Power Voltage [V]Vmpp31.32
Short circuit Current [A]Isc8.86
Open circuit voltage [V] Voc37.62
Max. Power Current [V]Impp8.06
Inverter Steca Elektronik—Solarix PI1100
DC Input VoltageV 24
DC Max CurrentA 120
AC Output VoltageV, Hz230, 50
AC Max CurrentA13
Charge Controller—Charger OutBack Power—FLEXmax-8
Max PV source Voltage (open circuit)VDC150
Max PV Current (short circuit)AMPS DC64
Max Input/Output CurrentAMPS DC80
Max Battery Charge VoltageV12/24/36/48/60
Range of Operating PV VoltageVDC15–145
Storage System Ecosun—ECOAGM A-220-12
Rated CapacityAh180
Weightkg60.5
Rated VoltageV12
Operating Temperature Range°C−20 to +50
Table 2. Seasonal of RZT per tank and per seasonal experiment (min, max, mean values).
Experimental PeriodRZT (Min)RZT (Max)RZT (Mean)
PPGPVControlPPGPVControlPPGPVControl
March21.521.115.923.123.218.122.222.217.0
April21.622.120.625.826.324.923.724.222.7
July-20.628.6-23.230.9-21.929.8
January21.414.310.722.518.713.522.016.312.1
Table 3. Total yield, energy consumption, CF and EUE per cultivation period. Values with different letters were significantly different (p < 0.05).
Experimental PeriodHeatYield
(kg m−2)
Energy ConsumptionCF (Area FU)
(kg CO2-eq m−2)
CF (Mass FU)
(kg CO2-eq kg−1)
EUE
(kg kWh−1)
(kWh) (kWh m−2)
FirstPPG3.8 a50.020.023.36.10.19
28/2–19/03PV3.3 a35.014.01.10.30.24
Control3.2 a-----
SecondPPG3.5 b26.010.512.23.40.34
2/4–17/4PV3.1 a12.04.80.40.10.51
Control4.0 b--- -
ThirdPPG2.3 *87.6 *35.0 *40.817.70.06
13/7–27/7PV2.3 a73.029.22.31.00.08
Control1.7 b-----
FourthPPG2.6 ab125.050.058.322.40.05
19/1–6/2PV2.3 a12.04.80.40.20.48
Control2.0 b-----
PPG12.3288.6115.5134.849.70.64
Total SumPV11.0135.052.84.11.61.31
Control11.0-----
* Data not available in selected period. It was assumed that the yield was equal to the PV tank.
Table 4. Total yield, energy consumption, CF and EUE per season.
SeasonHeatYield
(kg m−2)
Energy ConsumptionCF (Area FU)
(kg CO2-eq m−2)
CF (Mass FU)
(kg CO2-eq kg−1)
EUE
(kg kWh−1)
(kWh) (kWh m−2)
SpringPPG20.5211.884.798.94.80.24
March–
May 2018
PV17.7139.355.74.40.20.32
Control20.1-----
SummerPPG14.9575.6230.2268.718.00.06
June–
August 2018
PV14.9479.7191.815.01.00.08
Control11.3-----
AutumnPPG20.3209.583.897.84.80.24
September–
November 2018
PV17.5137.855.14.30.20.32
Control19.9-----
WinterPPG13.9661.7264.7308.922.20.05
December 2018–February 2019PV12.263.525.42.00.10.48
Control10.5-----
PPG69.71658.6663.4774.249.90.59
Total SumPV62.5802.3328.025.71.61.2
Control62.0-----
Disclaimer/Publisher’s Note: The statements, opinions and data contained in all publications are solely those of the individual author(s) and contributor(s) and not of MDPI and/or the editor(s). MDPI and/or the editor(s) disclaim responsibility for any injury to people or property resulting from any ideas, methods, instructions or products referred to in the content.

