Article

Feasibility Study of China’s Carbon Tax System under the Carbon Neutrality Target—Based on the CGE Model

1
School of Finance, Tianjin University of Finance and Economics, Tianjin 300222, China
2
Faculty of Social Sciences, Hong Kong Baptist University, Hongkong 999077, China
*
Author to whom correspondence should be addressed.
Co-first authors.
Sustainability 2023, 15(2), 1026; https://doi.org/10.3390/su15021026
Submission received: 17 November 2022 / Revised: 20 December 2022 / Accepted: 22 December 2022 / Published: 5 January 2023
(This article belongs to the Section Economic and Business Aspects of Sustainability)

Abstract

:
In order to cope with the climate problem of global warming and respond to the call of the United Nations to reduce carbon emissions, China has put the goals of carbon peaking in 2030 and carbon neutrality in 2060 forward and has promoted the transformation and upgrading of the economic development mode and the green, low-carbon development path. In international practice, various countries have widely adopted the carbon trading market and tax policy as effective carbon emission reduction mechanisms and tools. In 2012, China implemented a carbon trading pilot project and established a national unified carbon trading market in 2021 based on accumulated experience, but the carbon tax has not yet been introduced. According to the international carbon tax practice and the current situation in China, the introduction of the carbon tax is conducive to the establishment of a sound carbon emission reduction system and the promotion of green and low-carbon development from the macro-control level. In this paper, we analyzed the necessity and theoretical research of carbon tax policy in China and explored the feasibility of a carbon tax in China by combining the internationally advanced carbon tax practice. By establishing a CGE model at the carbon-tax level and using the social accounting matrix (SAM) as the database, we simulated the impact of implementing carbon tax policies under different carbon tax prices on China’s environmental and economic benefits and whether the double-dividend effect of a carbon tax can be effectively realized. The results show that the carbon tax will help reduce carbon emissions and significantly affect carbon reduction. However, in the short term, it has a negative effect on economic development. Accordingly, it is suggested that a scientific carbon tax system should be established according to national conditions, and a carbon tax should be introduced at a lower carbon tax price. The carbon tax should be supplemented by carbon tax subsidies to ensure effective carbon emission reduction so as to alleviate the inhibiting effect on economic development. At the same time, the compound carbon emission reduction mechanism of carbon trading and tax should be improved to lay the institutional foundation for the early realization of the carbon neutrality target.

1. Introduction

As China continues to economically and socially develop, more emphasis is being placed on green and efficient sustainable development while focusing on the high-quality and stable improvement of the economy. China’s total carbon emissions have surpassed that of the United States since 2007, making it the world’s top carbon emitter [1]. According to the statistics published by British Petroleum (BP) World Energy Statistics Yearbook (70th edition), China’s total carbon emissions will reach 9.9 billion tons in 2020, accounting for 30.7% of the world’s total carbon emissions. The surge in pressure to reduce emissions is not only an increasingly serious environmental issue but, at a further level, can become a social issue that hinders quality economic development. President Xi Jinping stressed the issue of carbon emissions, “China will increase its independent national contribution, adopt more vigorous policies and measures, and strive to peak CO2 emissions by 2030 and work towards carbon neutrality by 2060” [2]. This fully reflects China’s role as a major country with the world’s second-largest economy actively participating in global emissions and carbon reductions, but it is also a huge responsibility and challenge.
According to international practice, carbon emissions trading systems and carbon taxes have been internationally recognized as effective means of achieving carbon emission reductions. In practice, China’s carbon trading pilot scheme was launched in October 2011 with the establishment of carbon exchanges in seven provinces and cities, including Beijing, Shanghai, and so on, to promote voluntary emission reduction. With the introduction of the action plan under the “double carbon” target, the national carbon emissions trading market officially went online on 16 July 2021, improving China’s institutional means to promote low-carbon development at the market-mechanism level. However, for a country with a large economy and a complex industrial structure, the role of carbon trading relying solely on market mechanisms is relatively limited. In the international practice of many developed countries, the carbon tax is commonly applied as a policy tool for carbon emission reduction. In addition, the combination of carbon emissions trading (a quantitative emission reduction tool) and the carbon tax system (a price-based emission reduction tool) has established a compound mechanism that has effectively promoted carbon emission reduction. China has not yet introduced a carbon tax in order to achieve the goal of “double carbon” for realizing high-quality economic development and strengthening environmental governance. The introduction of a carbon tax is conducive to the establishment of a sound carbon emission reduction system for green and low-carbon development at the macroeconomic-control level, laying the institutional foundation for the early achievement of the target.

2. Literature Review

2.1. Carbon Taxes and Related Theoretical Studies

The carbon tax is a tax that measures and prices the amount of carbon contained in fossil fuels or the amount of carbon dioxide emitted [3]. The tax is generally based on the carbon content or carbon emissions per tonne of CO2. By increasing the cost of using fossil fuels with high carbon content, a carbon tax will have a double effect [4]: On the one hand, it raises the price of traditional energy products with high carbon content, increasing production costs for enterprises and consumption costs for residents, and reducing production supply and consumption demand; On the other hand, it encourages traditional energy enterprises to transform and upgrade, increases the development and use of low-carbon technologies, green and clean energy and promotes the development of new energy sources.
The carbon tax as a type of environmental tax originated from the British economist Pigou (1920) as the “Pigou tax” [5]. As the main creator of the externality theory, he proposed that negative environmental externalities could be addressed through taxes or subsidies. The atmosphere is non-exclusive and non-competitive, which is a typical public good. Relying on the market operation mechanism cannot guarantee that producers and consumers do not emit carbon; thus, the individual marginal cost of producers and consumers is less than the social marginal cost and results in negative externalities [6]. The difference between the two costs inevitably leads to an excess of global carbon emissions. Therefore, when the market fails, it is not possible to effectively solve the problem by solely relying on the spontaneous regulation of the market mechanism, so it is necessary to strengthen the macroeconomic control of the government and make interventions. By imposing a carbon tax, the marginal costs of carbon pricing can be effectively internalized by providing certainty so that an equilibrium of carbon emissions can be brought to a Pareto-optimal level by economic means.
At present, developed countries widely adopt the compound mechanism of carbon emission reduction by combining carbon tax and trading. Weitzman (1974) first provided a judgment guideline for how to choose carbon tax and trading [7]: choose carbon tax when the cost of carbon emission reduction is high and choose carbon trading when the cost of environmental pollution is high. Later, scholars Mandell (2008) [8] and Ni Juan (2016) [9] pointed out that the two mechanisms of the carbon tax and trading are better used together than one of them alone. Liu Lei et al. (2019) conducted a feasibility analysis on the mixed-use of both the carbon tax and trading mechanisms and proposed an introduction of a carbon tax based on the currently implemented carbon trading market [4]. Jia Xiaowei et al. (2021) studied the theory and international practical experience of the carbon emission reduction mechanism and proposed that China should introduce a carbon tax as soon as possible in the context of “double carbon” [10]. Since the start of the carbon emissions trading pilot project in 2011 and the establishment of a national carbon emissions trading market in 2021, carbon trading as a quantitative policy tool has had a profound impact on carbon emission reduction in terms of market regulation. However, the introduction of a carbon tax at the same time will not only be more precise and flexible but also improve the mechanism of carbon emission reduction by introducing price-based policy tools that complement carbon trading, promote the transformation of economic development, the optimization and adjustment of industrial structure, and lay the foundation for the early achievement of the carbon peaking and carbon neutrality goals.

2.2. The Double Dividend Effect of the Carbon Tax

The double dividend refers to the fact that environmental taxation can achieve the first dividend on the environment, the “green dividend”, by improving environmental problems and the second dividend on the society and economy, the “blue dividend”, by increasing welfare levels and economic efficiency [11]. Then, through the imposition of an environmental tax, the environmental and economic benefits of controlling pollution emissions, protecting the ecological environment, and promoting economic development will be achieved.
The ideas of Tullock (1967) in his study of environmental taxes on water resources are the basis for the Double Dividend Effect of environmental taxes [12]. He first proposed the concept of double dividend, arguing that environmental taxes are a means of tax rebates and transfer payments that can effectively achieve pollution reduction while promoting socio-economic development. Later, Pearce (1991) formally introduced the concept of the double dividend when he studied the mitigation effect of a carbon tax on global warming and explained the possibility of the double dividend through carbon tax while adhering to the principle of “tax neutrality” [13].
For the Double Dividend Effect, a carbon tax is generally accepted by most scholars as the first (environmental) dividend of environmental taxation. However, the definition of the second (non-environmental) dividend has been controversial in the field of environmental taxation research. Academics usually divide the second dividend into a “weak double dividend” and a “strong double dividend” based on its impact on the economy. Goulder (1995) points out that the “weak double dividend” is where the introduction of a carbon tax itself reduces the costs of other tax distortions, while the “strong double dividend” is where a carbon tax not only improves the existing tax system and increases efficiency, but also enhances social welfare [14]. The difference between the two lies in whether the impact of the carbon tax on economic development is limited to the internal effects of the tax system itself or whether it can have further far-reaching effects. Foreign scholars have carried out empirical analyses to verify the existence of the Double Dividend Effect of carbon taxes in their countries’ economies. Freire-González et al. (2019) carried out simulations through a dynamic CGE model and, after some empirical analysis, simulated a reasonable price range of EUR 10–20 per tonne of carbon emissions for three different carbon tax price levels, thus demonstrating the existence of a Double Dividend Effect [15]. Glomm et al. (2008) used a CGE model to simulate the existence of the Double Dividend Effect in the US environmental tax reform and obtained results that do not support it [16].
In recent years, with the efforts and deployment of China’s carbon emission reduction efforts, academic research on whether the Double Dividend Effect of carbon tax exists in China has also increased based on international experience. Lou Feng et al. (2014) simulated that the Double Dividend Effect of the carbon tax can be effectively realized in China under certain conditions by constructing a dynamic CGE model [17]. Yun Xiaopeng (2019) demonstrated the promotion effect of a carbon tax on current carbon emission reduction, energy consumption, and economic development by constructing a CGE model of China’s energy and environmental fiscal policies under the simulation of eight policy scenarios [18]. Li Yi et al. (2021) compiled a SAM matrix using the 2017 input-output table that the data support and used the CGE model to simulate the environmental and economic impacts under different carbon tax levels, thus revealing that the levy of a carbon tax can effectively achieve a Double Dividend Effect after long-term development [19]. However, China’s current carbon tax policy is still in the stage of figuring out the feasibility of exploration. For the construction of the CGE model of the carbon tax, the plate parameters still have many different insights based on borrowing from foreign countries. There is a lack of empirical analysis of simulated carbon tax prices based on Chinese national conditions, and the sources of data for the preparation of the social accounting matrix mostly use data from input-output tables published by the National Bureau of Statistics in 2012. In this paper, the social accounting matrix (SAM) was prepared by analyzing the latest input-output tables published by the NBS from 2017 up until now. A computable general equilibrium model (CGE) was used to simulate the reasonable price range of carbon tax levies in China under different scenarios and whether the Double Dividend Effect can be effectively realized. The aim of this study is to provide more theoretical support for China to explore the feasibility of a carbon tax system.

3. Carbon Tax Practices Abroad

The World Bank’s latest report, “Carbon Pricing Developments and Future Trends (2021)”, describes the trading dynamics of the world’s major carbon trading markets, the development of carbon taxes, and the development trend of carbon emission reduction in addition to introducing the countries and regions that are imposing carbon taxes as of the end of 2021. To date, carbon tax policies have been implemented in 35 countries and regions [20]. However, the implementation of the carbon tax system is mostly concentrated in developed countries, as developing countries are still in the period of the industrial economy that relies on traditional industries with high energy consumption and must wait for rapid development because of their relatively backward economic development. Most of them are indifferent to the social problems brought about by the destruction of the ecological environment and the economic stagnation caused by high pollution and energy consumption, and are unable to pay enough attention to them and lack environmental awareness.
The Nordic countries were the first to introduce carbon taxes. Since Finland first established a carbon tax system in 1990, developed western countries, such as Sweden (1991), Norway (1991), Denmark (1992), and the U.K. (2001), have successively built an environmental tax system based on carbon taxes. Subsequently, high-income countries driven by the EU and international economic organizations, such as the U.S. and Germany, have formed a more effective carbon reduction mechanism through the introduction of carbon taxes and trading [21]. At the same time, Japan, located in Asia, also followed suit and introduced a carbon tax, which was included in the Japanese tax reform in 2009. With the further spread of the Paris Agreement and the increasingly serious climate problems, South Africa and Singapore have also taken on the commitment to reduce emissions and have started to introduce carbon taxes in their countries. More and more developed countries, and even developing countries, are set to tackle the socio-economic problems caused by greenhouse gas emissions through the imposition of a carbon tax in the future. According to the World Bank’s Carbon Emissions Data Report, the carbon tax is expected to cover nearly 3 billion tonnes of carbon-equivalent emissions in 2021, accounting for 5.5% of global greenhouse gas emissions [22].
This chapter analyzes the carbon tax practices in foreign countries and regions and examines the mechanisms and model characteristics of carbon taxes in different foreign countries and regions. Based on the problems and advantages of a carbon tax in foreign countries, policy suggestions are provided at the end of the article that China can effectively set up and establish a carbon tax system based on its national conditions. Table 1 shows the countries and regions in the world where carbon taxes are currently in place.

3.1. Carbon Tax Model

There are generally two models for the creation of a tax: stand-alone and integrated. The stand-alone model generally promotes carbon tax as an independent tax (countries such as Norway and Japan are representative of this). The integrated model includes the carbon tax as part of a tax with a similar function. For example, a carbon tax is included in the environmental and energy tax systems (countries such as Germany and Sweden are representative of this). The stand-alone model of the carbon tax is well-positioned to facilitate the public’s understanding of what carbon taxes entails. It has a high degree of direct acceptance and is conducive to achieving its goals in the long run. However, there are also problems, such as cumbersome establishment procedures and double taxation. The carbon tax in the integrated mode is widely adopted by developed countries, which can effectively reduce the resistance to the introduction of the tax and avoid conflicts in the early stage. However, the policy effect cannot reach the ideal expectation and will face great resistance if the tax rate is raised in the later stage.
The carbon tax is targeted at industries and commodities with high emissions, energy consumption, and pollution. It is focused on the scope of fossil fuels, such as oil, natural gas, coal, etc., and high-emission energy derivatives to levy a carbon tax. However, as the practice of carbon taxation progresses and the effect of carbon reduction is significant, some countries will further expand the scope of the tax in order to consolidate their environmental achievements. For example, in Finland, the carbon tax reform has been repeatedly subdivided and extended to include some biofuels and electricity to improve the effect of emission reduction further. In terms of the basis for carbon taxation, the development of foreign countries also varies, but as the world’s carbon reduction efforts advance, the development trend has generally changed from “carbon content of energy fuels” to “energy carbon emissions”.

3.2. Carbon Tax Rate

The pricing of a carbon tax rate is an important indicator of the effectiveness of the carbon tax and is the focus of this paper. A reasonable carbon tax rate range is the only way to facilitate the implementation of a carbon tax policy in China and its role in achieving the carbon neutrality target. Carbon tax rates vary widely across the world. According to the data, there is a wide range of pricing from USD 0.08/tonne CO2 equivalent in Poland to USD 137.24/tonne CO2 equivalent in Sweden, using USD/tonne CO2 equivalent as the unit of measurement. However, overall, the carbon tax rates are generally low, with more than half of the countries pricing their rates below USD 25/tCO2 [23]. Table 2 shows the carbon tax rates for selected countries and regions that have introduced carbon taxes.
Although at the initial stage of carbon taxation, countries have priced their tax rates at a low level in order to reduce the negative impact of their high energy consumption products, which become less competitive after being forced to raise their prices in international trade competition. However, with the improvement of the economic development level and the requirements of environmental protection, the carbon tax rate of each country will be steadily increased in order to promote carbon emission reduction further and ensure the sustainable development of the economy, showing a progressive, low-to-high trend. In this way, it promotes the transformation and upgrading of enterprises, as well as the development of new energy sources, technologies, and research. At the same time, differentiated tax rates are also a common approach adopted abroad [24]. There are generally two categories: First, differentiated tax rates for different levy sectors; Second, differentiated tax rates for different levy targets. There are different settings for the carbon tax to be borne by households and businesses. Countries also continue to explore reforms while implementing carbon tax policies and setting tax rates, seeking to balance environmental benefits with economic benefits.

3.3. The Carbon Tax Collection Process

Carbon taxes are generally levied at the end-use of energy, mainly at the production and consumption levels. However, considering international experience, carbon taxes are levied much more often at the production stage than at the consumption stage. This is because production-based carbon taxes are conducive to tax collection and source control and can effectively safeguard the collection of carbon taxes [4]. However, although a consumption-based carbon tax is conducive to the social effect of popularizing energy conservation and emission reduction, it is complicated to regulate and has greater resistance to implementation, making it difficult to ensure that the carbon tax works well in the initial stage of collection. At present, in international practice, the United States, Canada, and other regions adopted a carbon tax at the production stage, which is also the model that domestic scholars recommend China adopt while taking into account their own national conditions. In contrast, developed Nordic countries, such as Finland and Norway, have chosen to levy a carbon tax at the consumption stage in order to further cultivate public awareness of energy saving and emission reduction because of their early introduction of a carbon tax.
The use of revenue from the carbon tax is focused on two main purposes [25]. One is to continue to use the carbon tax revenue for environmental protection and to promote sustainable economic development; this is accomplished through the continued development of renewable and green energy sources, as well as through the development of new technologies and the upgrading of energy-saving and emission-reducing equipment. Norway, for example, uses part of its carbon tax revenue to provide incentives for companies to develop clean energy and green technology. Another way to reduce the distortionary effects of other taxes is through a carbon tax. In international practice, France has a carbon tax bill that provides for a certain amount of corporate and personal income tax deductions.
The imposition of a carbon tax generally imposes a tax burden on the lives of enterprises and residents and can also have a negative effect on economic development and social welfare. According to the principle of tax neutrality, countries will generally develop corresponding tax incentives to reduce the negative impact of a carbon tax. In addition to the aforementioned use of part of the revenue from the carbon tax as a rebate to companies for technology development, aviation and transportation industries are also exempt from taxation in Canada. In particular, countries have certain tax breaks for energy-intensive and export-trading companies to ensure their stable operation and competitiveness in international trade. For example, the United States provides a 30% tax credit for energy tax incentives, such as solar power and small wind energy. Most countries that levy a carbon tax will establish a carbon tax mechanism based on tax incentives in order to balance economic development with energy saving and emissions reduction and to better realize the Double Dividend Effect of the carbon tax.

3.4. Carbon Tax and Carbon Trading

As carbon emission reduction efforts in countries around the world progress, more and more countries are recognizing that carbon taxes and emissions trading are not separate policy tools from each other, but rather, they can work together to form a carbon emission reduction compound mechanism effectively. This makes it possible to guide the development of a low-carbon economy from the perspective of market mechanisms and macro regulation. In 2005, the EU established the world’s first carbon trading system, the EU ETS. It covers heavy industry sectors, such as electricity, while some light industry sectors are included in the scope of the carbon tax. Meanwhile, in Asia, Japan established a carbon trading market in 2010 and introduced a carbon tax in 2012, creating a compound carbon reduction policy. Table 3 shows the comparative analysis of carbon tax and carbon trading.
China has been actively exploring a more sound and complete carbon emission reduction system since the establishment of a carbon trading pilot in 2012, and a unified national carbon emissions trading market started officially trading on 16 July 2021. This means that China, as the world’s largest developing country, will make a greater contribution to global climate issues. Therefore, while learning from developed countries, such as Finland, Norway, and France, that use carbon tax and trading together as a compound mechanism for carbon emission reduction, the introduction of the carbon tax and trading can be combined to lay the institutional foundation for the early achievement of the goal of carbon neutrality.

3.5. Review of Foreign Carbon Tax Studies

Through the research on the international carbon tax practice model and tax rate, it can be found that the international practice of carbon tax has achieved good results; however, there are still some shortcomings in the implementation [26]. First, the carbon tax is less flexible and faces greater resistance to implementation. The introduction and adjustment of the tax need to go through a strict procedure, with a certain time lag and less flexibility. The carbon tax will lead to an increase in production costs for enterprises in the short term. In addition, the regressive nature of a carbon tax may increase the tax burden of low-income groups and increase the resistance to the implementation of a carbon tax. Second, the overall carbon tax rate is low, and the total carbon emission control is insufficient. The current carbon tax rate is generally low, with nearly half of the countries having a rate of less than USD 25/tonne of carbon equivalent. The carbon tax achieves emission reduction through the tax rate (i.e., the price) and some high-emission and high-revenue enterprises still maintain their original production and operation mode under the low-carbon tax situation, and their willingness to reduce emissions is low, which cannot effectively control the total emissions. Third, there is a risk of carbon leakage, which is not conducive to global emission reduction linkage. Due to the different degrees of economic development of each country, the proportion of countries with and without a carbon tax is very different, and the tax rates of countries with a carbon tax are not the same, resulting in a huge price-cost difference in carbon emissions globally, which easily leads to “carbon leakage” and greatly reduces the global carbon emission reduction effect.
As for the design of a carbon tax, most scholars at home and abroad believe that a carbon tax is an effective energy tax policy tool, and it is reasonable and scientific to be established as a separate tax. In terms of the selection of tax objects, more scholars believe that it is more reasonable to levy a carbon tax on the carbon content of fossil energy. In terms of the tax rate, scholars at home and abroad agree that, since carbon tax may bring large policy risks, it is best to start with a low tax rate and adjust the tax rate as the carbon tax system is improved and the national economic environment changes [27].
With regard to the effects and impacts of a carbon tax, scholars at home and abroad have paid more attention to the impacts of a carbon tax on carbon dioxide emissions, the national economy, and income distribution. In their research, scholars mainly adopt the Computable General Equilibrium (CGE) and panel data models to conduct empirical studies. However, most of the existing studies focus on the country as a whole. Given the vast territory of China, the many industries, and the huge differences in development styles and economic levels among different regions, the impact of China’s carbon tax on different regions is bound to be very different, but there is less in the literature on the effects and impacts of China’s carbon tax levy considering the regional division. Therefore, this chapter analyzes the international practice of carbon taxation, identifies possible problems, and provides a research basis for subsequent empirical studies and policy recommendations.

4. CGE Model Construction

The CGE model for carbon taxation is an extension of the Computable General Equilibrium (CGE) model, which has been considered a powerful tool for policy analysis in the field of applied economics and is widely used to study the impact of policies on the economy. It is widely used to study the impact of policies on the economy and their effects. In this paper, the CGE model is used to investigate the impact of carbon tax policies on China’s carbon emissions and economic development and to simulate the impact of policies under different carbon tax prices. The model consists of production modules, trade modules, residential income and expenditure modules, firm and government modules, carbon tax modules, equilibrium modules, and dynamic recursion.

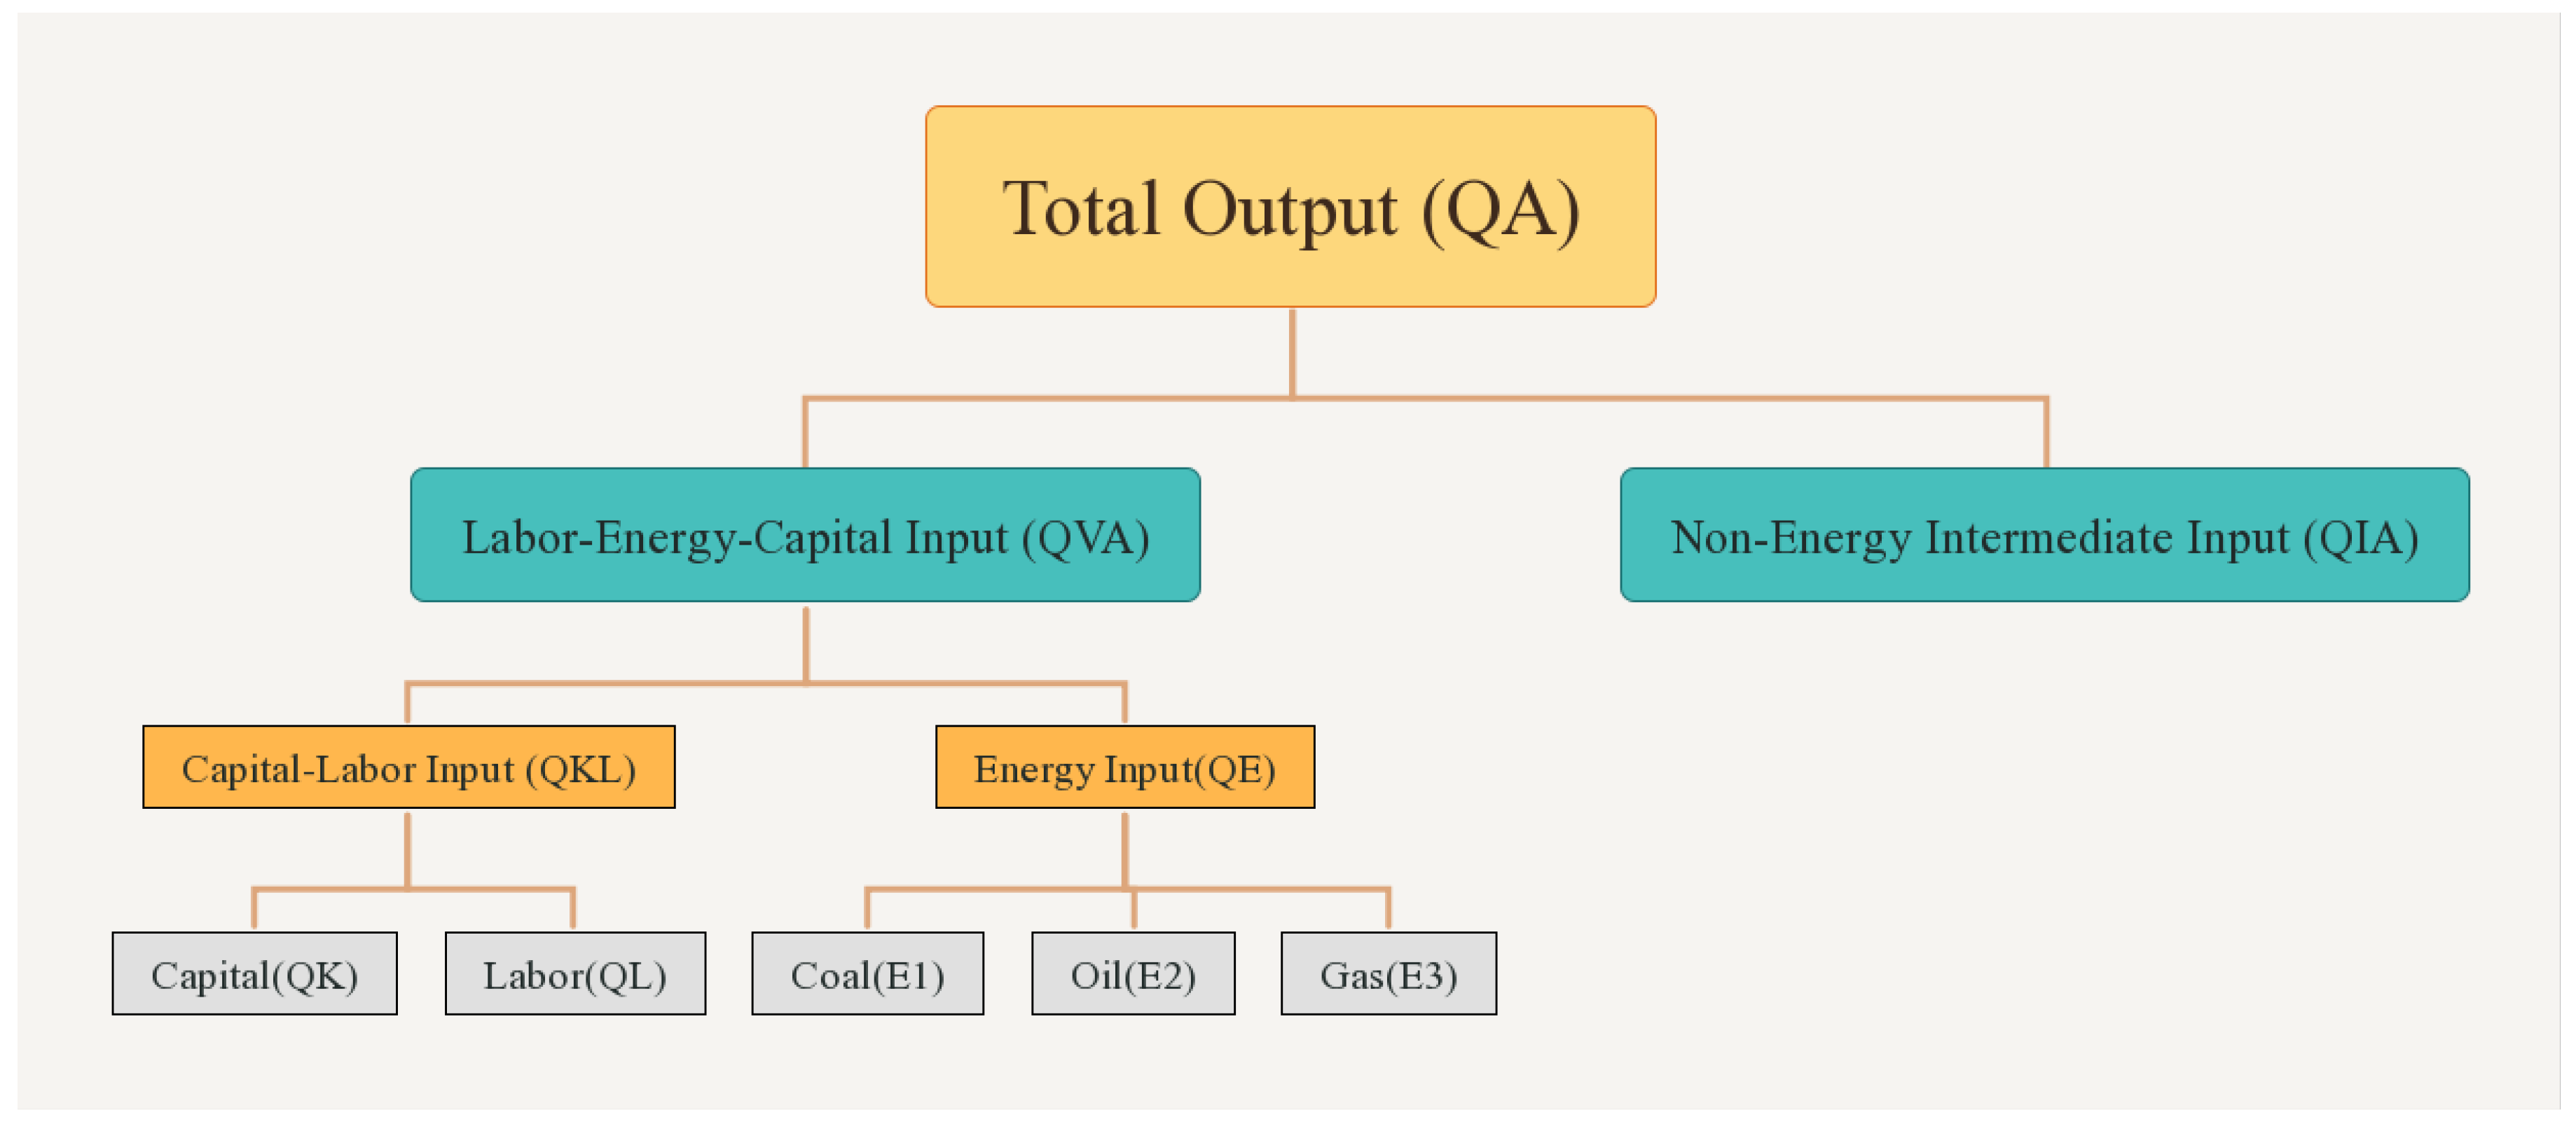
4.1. Production Modules

The production module uses the CES production function, which is divided into four levels of nested structures for production synthesis, designed to represent different substitutions between different inputs [28]. Labor, capital and carbon emissions are all used as factors of production to describe the total output of society. This is shown in the framework diagram of the CES production function for the production module in Figure 1.
The estimation of production function has always been an important subject of academic research. The construction of the production function fits the input-output relationship in the production process, which greatly facilitates the research of scholars. However, in actual economic activities, the elasticity of substitution among various factors of production is different, and there are even complementary relationships. When constructing a multi-layer nested production function, it is necessary to consider the sequential combination of relationships between factors, as different combinations will have different effects on the results. In the existing literature, He Juhuang (2022), Cao Jing (2009), Lou Feng (2014), and other scholars have introduced the economic feasibility of nesting the three elements of capital energy and labor in their papers [29].
The elasticity of the substitution coefficient is calibrated on the existing functional relationship. In the CGE model, the elasticity of substitution coefficients needs to be calibrated, and in this paper, the elasticity of substitution coefficients needs to be calibrated on the already established production, Armington, and CET functions. The calibration of the elasticity of substitution determines the degree of mutual substitution between input factors or products, which affects the policy simulation results of the whole economic system. If the elasticity of substitution between various factors in the production function is larger, then firms can choose other factors to replace external shocks, and the cost of adjustment is smaller, then the impact of external shocks on the whole economic system is smaller [30]. The choice of the elasticity of substitution coefficients in this paper mainly refers to the settings of the elasticity coefficients by Guo Zhengquan (2011) and Lou Feng (2014) and is adjusted according to the needs of actual operation.
(1) The first-nested layer: total output synthesis including the total output CES production function synthesis,
Q A i , t = α i A [ δ i A Q V A i , t ρ i A + ( 1 δ i A ) Q I A i , t ρ i A ] 1 ρ i A
and value of the total output of production activities,
P A i , t · Q A i , t = P V A i , t · Q V A i , t + P I A i , t · Q I A i , t
where the optimal factor input mix ρ a and the parameters of the CES production function index of output by the sector.
P V A i , t P I A i , t = δ a A 1 δ a A Q I A i , t Q V A i , t 1 ρ i A   ( σ i A = 1 1 ρ i A )
Table 4, Table 5, Table 6, Table 7, Table 8, Table 9, Table 10, Table 11 and Table 12 shows the explanation of the variables in the formula.
(2) The second-nested layer: labor–capital–energy synthesis, including the non-energy intermediate inputs,
U Q I A c i , t = i a c c i Q I A i , t
and the non-energy intermediate input prices,
P I A i = c i a c c i P Q c
For the labor–capital–energy CES production functionthe optimal labor–capital–energy input mix is
P K E W L = δ a v 1 δ a v Q L D Q K E 1 ρ a v
and the labor–resource–energy price relations are
min P V A i , t Q V A i , t = P E i , t Q E i , t + P K L i , t Q K L i , t
st . Q V A i , t = α i v [ δ i v Q K E i , t ρ i v + ( 1 δ i v ) Q K L i , t ρ i v ] 1 ρ i v   ( σ i v = 1 1 ρ i v )
Table 5. Description of nested variables and parameters at the second level of the production module.
VariablesMeaningVariablesMeaning
Q K L Capital–labor inputs P K L Synthetic capital–labor prices
Q E Energy inputs P E Energy prices
σ i v Elasticity of the substitution coefficient between capital–energy synthesis and labor P Q c Domestic commodity c prices
α a v Synthetic labor–capital–energy CES production function transfer parameters ica c i The amount of input required in sector c to produce one unit of sector a
δ a v Synthetic labor–capital–energy CES production function share parameters ρ a v Synthetic labor–capital–energy CES production function index parameters
(3) The third-nested layer: capital–labor synthesiswhere capital–labor price relations are
P K L i , t Q K L i , t = P K i , t Q K i , t + P L i , t Q L i , t
Q K L i , t = α i k l [ δ i k l Q K i , t ρ i k l + ( 1 δ i k l ) Q L i , t ρ i k l ] 1 ρ i k l   ( σ i k l = 1 1 ρ i k l )
and energy aggregation functions are
P E i , t Q E i , t = P E f i , t Q E f i , t + P E e i , t Q E e i , t
Q E i , t = [ δ i f e Q E f i , t ρ i f e + ( 1 δ i f e ) Q E e i , t ρ i f e ] 1 ρ i f e ( σ i f e = 1 1 ρ i f e   )
Table 6. Description of nested variables and parameters at the third level of the production module.
VariablesMeaningVariablesMeaning
Q K Amount of capital input P K Capital input prices
Q L Amount of labor input P L Labor input prices
α i k l Synthetic capital–labor CES production function transfer parameters ρ i k l Exponential parameters of the synthetic capital–labor CES production function
δ i k l Synthetic capital–labor CES production function share parameters σ i k l Coefficient of elasticity of substitution between capital and labor
(4) The fourth-nested layer: energy synthesis, where the energy CES production function is
min P Q 1 · E 1 i , t + P Q 2 · E 2 i , t + P Q 3 · E 3 i , t
Q E f i = δ 1 e E 1 i ρ i e + δ 2 e E 2 i ρ i e + δ 3 e E 3 i ρ i e 1 ρ i e ( σ i e = 1 1 ρ i e )
Table 7. Description of nested variables and parameters at the fourth level of the production module.
VariablesMeaningVariablesMeaning
P Q 1 Coal prices E 1 i Coal input volumes
P Q 2 Oil prices E 2 i Oil input volumes
P Q 3 Natural gas prices E 3 i Natural gas input volumes
δ 1 e Coal share parameter in the CES function δ 2 e Oil share parameter in the CES function
δ 3 e Natural gas share parameter in the CES function σ i e Elasticity of the substitution coefficient between fossil fuel energy sources

4.2. Trade Modules

The output of domestic production activities is distributed through products, partly for export trade and partly for domestic sales. Additionally, the aggregate domestic demand is determined by the need for imports and domestic sales [31]. Thus, balancing domestic and foreign markets and maximizing profits are the main objectives of production in the domestic production sector. This is shown in the trade module in Figure 2.
Domestic product demand function (Armington’s hypothesis):
max ( P Q i , t Q Q i , t [ P D i , t Q D i , t + ( 1 + t m i ) P M i , t Q M i , t ] ) s . t . Q Q i , t = γ m i [ δ d i ( Q D i , t ) ρ m i + δ m i ( Q M i , t ) ρ m i ] 1 ρ m i
where ρ m i = σ m i 1 σ m i is the coefficient of elasticity of substitution between domestic sales and imports.
Domestic product distribution function (CET function):
max ( P D i , t Q D i , t + P I E i , t Q I E i , t ) ( 1 + t m i ) P X i , t Q X i , t ] ) s . t . Q X i , t = γ m i [ ξ d i Q D i , t ρ e i + ξ e i ( Q I E i , t ) ρ e i ] 1 ρ e i
where ρ e i = σ e i + 1 σ e i , σ e i is the coefficient of elasticity of substitution between domestic demand for domestically produced goods and exports.
Table 8. Description of trade module variables and parameters.
VariablesMeaningVariablesMeaning
P Q i Commodity i’s domestic demand prices Q Q i Commodity i’s domestic demand
P M i Imported good i’s domestic prices P E M i Sector i’s international market prices of imported goods
P X i Output volume in sector i Q X i Output prices in sector i
Q D i Commodity i’s domestic supply P E i Domestic price of export good i
P W E i Sector i’s international market prices of export commodities Q E i Export volume of commodity i’s allocation
P D i Commodity i’s domestic supply prices E R Exchange rates
Q D i Commodity i’s demand domestic supply Q M i Imports of commodity i’s demand
Q E i Export volume of commodity i’s allocation t m i Import tariff rates of commodity i
α e i Commodity i’s overall transfer parameters for import supply and export allocation ξ d i Product i’s domestic supply share parameters
ξ e i Product i’s share of export supply parameters α m i Overall rate of transfer of domestic demand for commodity i to import demand
δ d i Commodity i’s domestic demand share parameters δ m i Commodity i’s import demand share parameters

4.3. Income and Expenditure Modules

(1) Resident modules
According to the empirical analyses of domestic and international academic scholars in CGE models, most of the residential consumption functions use simple linear consumption or Stone–Geary utility functions [32]. The Stone–Geary function is often used to model issues involving the level of living consumption, the parameters of this consumption function are difficult to estimate, and there is a lack of well-established modeling data and parameters to support it in the available information. Therefore, in this paper, a simple linear functional form is used in the residential consumption function.
Resident income equation:
Y H T = T Y L + Y H K + Y E H + Y H G + Y H W
Resident savings equation:
S H = s h Y H T
Resident consumption equation:
H D = μ h i ( 1 s h ) ( 1 t h ) Y H T P Q i
Table 9. Description of resident module variables and parameters.
VariablesMeaningParametersMeaningDescription
Y L i Sector i’s resident labor income r a t e h k Proportion of residents’ capital incomeResident capital income/total capital income (total capital income includes capital gains and depreciation)
T Y L Gross labor income of the population s h Resident savings ratio coefficientResidents’ savings divided by residents’ gross income
Y H K Residents’ capital income μ h i Proportional coefficient of residents’ consumption of product iConsumption of product i by the population as a proportion of total consumption
Y H W Residents’ income from abroad t h Personal income tax rate
H D Residents’ savings
Y H T i Gross resident income
S H Residents’ consumption of product i
(2) Corporate modules
(i) Corporate Revenue Module Functions
Total capital receipts:
T Y K i = i r · K i , t
Business capital income:
Y E K = ( 1 r a t e h k r a t e w k ) T Y K
(ii) Corporate Expenses Module Functions
Business-to-resident transfers:
Y E H = r a t e h e · Y E K
Corporate savings: S E = ( 1 r a t e h e ) · ( 1 t e ) T E K
I N V i , t = i n v i · ( S E + S H + S G + S F ¯ ) / P Q i
Table 10. Description of corporate module variables and parameters.
VariablesMeaningParametersMeaningDescription
Y K i Sector i’s capital revenue r a t e w k Proportionality factor for foreign capital investment returnsForeign capital investment income divided by total capital receipts
T Y K Total sectoral capital receipts r a t e h e Proportion of business-to-resident transfer paymentsRatio of business-to-resident transfers to business capital income
Y W K Profits earned from investments abroad i n v Investment ratio factor for sector iInvestment in sector i as a proportion of total investment
Y E K Corporate capital income t e Tax rates paid by companies
Y E H Business-to-resident transfers
S E Corporate savings
I N V i Total investment in sector i
(3) Government modules
(i) Government Revenue Module Functions
Total government revenue:
Y G T = i G I N D T A X i , t + i G T R I F M i , t + G H T A X + G E T A X + G W Y
(ii) Government Expenditure Module Functions
Transfer payments to residents and businesses:
Y H G = Y G T · r a t e h g + i s u b s i d y i
Assistance to foreign countries:
Y W G = r a t e w g · Y G T
Government savings:
S G = S G · Y G T
Consumption of product i:
G D i , t = μ g i ( 1 r a t e h g r a t e w g s g ) · Y G T / P Q i , t
Table 11. Description of government module variables and parameters.
VariablesMeaningParametersMeaningDescription
G I N D T A X i Sector i’s indirect tax revenue t i n d i Indirect tax rates for sector iIndirect taxes on sector i/total output
G T R I F M Product i’s import duty income t h Residents’ income tax rateResident income tax/resident gross income
G H T A X Resident income tax t e Corporates’ income tax rateCorporate income tax/corporate capital income
G E T A X Corporate income tax r a t e g w Government foreign revenue shareGovernment foreign revenue/imports
G W Y Government revenue from abroad r a t e w g Proportion of government foreign transfer paymentsGovernment transfer income to business/total government revenue
Y G T Total government revenue s g Government savings ratioGovernment savings/total government revenue
Y H G Government transfers to residents μ g i Proportion of government consumption of product iGovernment consumption of product i/total consumption
S G Government Savings r a t e h g Proportion of government transfer payments to residentsGovernment transfer income to residents/total government revenue
G D Government consumption of product i
Y W G Government aid to foreign countries

4.4. Carbon Tax Module

Calculation of emissions.
Carbon emissions from sector i:
C O 2 , i = i E i , e f e
Carbon emissions from energy e:
C O 2 , e = ( H D e + G D e ) f e
where f e is the emission factor for the three fossil fuel energy sources (coal, oil, and gas).
Total energy consumption used by all sectors:
T C O 2 = i = 1 C O 2 , i + i = 1 C O 2 , e
T C O E I = T C O 2 G D P
C O E I i = C O i G D P i

4.5. Balanced Modules and Dynamic Recursion

(1) Equalization module
(i) Balance of Payments
The balance of payments can choose either an endogenous or exogenous closure rule for the exchange rate. In this paper, we chose a closure rule with the exchange rate as the endogenous variable and foreign savings as the exogenous variable in our modelling:
i P M i · Q M i , t + Y W K + Y W G = i P E i , t · Q E i , t + Y H W + G W Y + S F ¯
where S F ¯ is foreign savings and is an exogenous variable.
(ii) Savings Investment Equilibrium (Assuming Investment is Determined by Savings)
Total investment:
T I N V = i I N V i , t · P Q i , t
Total savings:
T S A V = S E + S G + S H + S F ¯
T I N V = T S A V + W A L A R S
where W A L R A S denotes the Walrasian dummy variable that tests whether savings and investment are equal.
(iii) Product Market Equilibrium (Aggregate Demand Equals Aggregate Supply)
H D i , t + G D i , t + I N V i , t + N D i , t = Q Q i , t
(iv) Labor Market Equilibrium (Assuming Full Employment in the Labor Market)
i L i = L S ¯
where L S ¯ denotes the total supply of labor.
(v) Capital Market Equilibrium (Assuming Capital Prices are the Endogenous Variable)
i K i = K S ¯
where K S ¯ denotes the total supply of capital.
(vi) Nominal GDP vs. Real GDP
R G D P = i H D i , t + i G D i , t + i I N V i , t + i ( Q E i , t ( 1 + t m i ) Q M i , t )
G D P i , t = r · K i , t + w · L i , t + t i n d i · P X i , t · Q X i , t
G D P = i G D P i , t
P G D P = G D P R G D P
where R G D P denotes real GDP; P G D P denotes the price index of GDP.
(vii) Social Welfare Module
The Hicks Equivalent Change is applied to analyze the impact on social welfare following the implementation of external policies [33], which measures whether the welfare of the population is improved or harmed by applying an expenditure function to calculate the level of utility before and after the policy change, based on the price of goods before the public policy is implemented. When E V > 0 is used, it means that the welfare of the population is improved; when E V < 0 is used, it means that the welfare of the population is harmed. The specific calculation formula is:
E V = E ( U S , P Q b ) E ( U b , P Q b ) = i P Q i , t b H D i , t s i P Q i , t b H D i , t b
Table 12. Description of dynamic recursive module variables and parameters.
VariablesMeaning
E V Hicks Equivalent Change in resident welfare
E ( U s , P Q b ) Level of utility after policy implementation
H D S Total residential consumption of goods in mid-i after policy implementation
E ( U b , P Q b ) Pre-policy utility levels
P Q i b Consumer price of commodity i before policy implementation
H D i b Amount of residential consumption of commodity i before the policy was implemented
(2) Dynamic recursion
Dynamic CGE models are mainly divided into “recursive and intertemporal dynamics”. Meanwhile, recursive dynamics are generally described by the inter-period changes in labor force growth, capital accumulation, and total factor productivity. In this paper, the dynamic recursive CGE model is described in terms of labor and capital.
Labor force growth:
L s , t + 1 = L s , t ( 1 + g )
Capital accumulation:
K t + 1 = K t ( 1 δ t ) + I t
where g indicates growth rate; δ indicates capital depreciation rate; I indicates investment.

5. Empirical Analysis

In this paper, we use the “Social Accounting Matrix” (SAM), which is compiled by the Chinese Academy of Social Sciences (CASS) and is based on the latest input-output tables released by the National Bureau of Statistics (NBS) in 2017, which is generally updated on a five-year cycle, as the supportive data for the CGE model. The SAM table describes the supply-and-balance relationships between macroeconomic accounts and reflects the linkages between social and economic agents [19]. The SAM table was leveled using the GMAS procedure by means of cross-entropy coefficient leveling and applied to the empirical analysis. In order to better explore the impact of a carbon tax policy on China’s national economy, data from representative sectors, such as agriculture, light industry, manufacturing, services, transportation, and energy industry, were selected and combined for simulation analysis. The simulation assumes three scenarios of carbon tax levy prices of RMB 20/tonne, RMB 40/tonne, and RMB 60/tonne CO2 equivalent, and carries out specific analysis in terms of both environmental and economic benefits.

5.1. Databases

The Social Accounting Matrix (SAM), also known as the Comprehensive National Economic Matrix (CNEM), is a two-dimensional matrix of national economic accounting constructed on the basis of a country’s input-output table for the current year, which can provide a comprehensive description of the economic flow relationship between macroeconomic variables in a region in a certain period [34]. The social accounting matrix is able to reflect economic processes that are not reflected in the input-output tables, such as those related to the redistribution of national income. A standard social accounting matrix contains activity, commodity, factor, government, firm, resident, capital, and foreign accounts, but the composition of the accounts is not static and can be subdivided or combined depending on the needs of the researcher. The SAM table’s data, which is the basis of the CGE model, contains the production and non-production accounts of the national accounts and provides a clear picture of the economic behavior of each account in the functioning of the economy.
In this paper, the SAM table is based on the input-output table of 2017 and the China Statistical Yearbook of 2019. Since the research direction of this paper is a carbon tax policy effect, twenty carbon emission-related sectors were selected from 149 industrial sectors after referring to the division of industrial sectors in Guo Zhengquan’s “Simulation Analysis of China’s Low Carbon Economic Development Policy Based on CGE Model”, as shown in Table 13. The coefficient cross-entropy leveling method was used to level the SAM table for a certain degree of imbalance that appeared in the SAM table. The databases for the SAM table are compiled in this paper, as shown in Table 14.

5.2. Analysis of Simulation Results

5.2.1. Impact on Environmental Benefits

(1) Impact on carbon emission reductions
As one of the taxes of the environmental tax, the first choice when considering the effect of its policy implementation is the effect on environmental pollution control. That is, whether the introduction of a carbon tax can effectively reduce carbon emissions and achieve the environmental benefits of the Double Dividend Effect. As can be seen from Figure 3, there is a significant increase in carbon dioxide emission reductions as the price of the carbon tax increases, which can be seen within a certain reasonable range. Thus, as the price of carbon tax increases, the more effective the carbon emission reduction will be.
As can be seen in the graph, trends in emission reductions are shown by the simulation of the year, except for 2020, due to the impact of the global new coronavirus pandemic on the economy. Domestic enterprises shut down their production, and an international unified trade slump was observed. Once it affected production and energy consumption, the coronavirus pandemic resulted in an overall decline in carbon emissions and little change in emissions reduction was observed compared to the same period. Overall, with the introduction of a carbon tax, the reduction of carbon emissions will also become more and more obvious to promote the role of significant environmental benefits. The carbon tax price of RMB/tonne can be reduced by 7.50%, RMB 40/tonne by 8.61%, and RMB 60/tonne by 9.20% by 2021 when taking 2017 as the base year for the introduction of a carbon tax which has a more obvious promotion effect on the reduction of carbon emissions. The imposition of a carbon tax raises the cost of emissions for enterprises, reducing their production output and the demand for energy that is highly energy intensive and polluting, further acting as a disincentive to carbon emissions.
(2) Impact on energy
The carbon tax is levied to reduce carbon dioxide emissions, and it is an ad valorem tax on fossil fuel energy. A carbon tax in China will have an impact on our energy sector, especially on the use of coal, oil, and natural gas, which in turn will have an impact on carbon emissions and will also have a degree of positive impact on the green and high-quality development of our country by promoting the green and healthy development of our environment and economy. Since the CO2 emission factors of different fossil fuel energy sources are not consistent, the carbon tax on fossil fuel energy sources, faces different ad valorem tax rates, and the impact on the consumption of fossil fuel energy sources is different. After the policy simulation analysis of the model, the results of the impact of a carbon tax implementation on China’s energy consumption and carbon emissions are shown in Table 15.
Through Table 15, we can analyze the changes in the consumption levels of different energy sources at different levels of the carbon tax levy in China. The consumption of coal, oil, and natural gas all show a decreasing trend at different levels of carbon taxation. Among them, coal consumption decreased the fastest, and oil and natural gas decreased at a lower rate. This suggests that the implementation of the carbon tax policy has effectively improved the consumption of coal. The main reason is that the imposition of a carbon tax will make the price of coal higher, and the increase of the carbon tax rate will raise the costs of business use and reduce the consumption of coal. The higher the level of a carbon tax, the less coal will be consumed, which undoubtedly reduces the carbon emissions generated by enterprises.
Meanwhile, through the simulation analysis of the carbon tax policy, it can be found that the carbon emissions generated by the three fossil fuel energy sources will show a decreasing trend under different levels of taxation. From the data in the table, a carbon tax will reduce China’s carbon dioxide emissions and contribute to China’s goal of achieving peak carbon neutrality. A carbon tax would have the greatest impact on coal, which is a high-energy-consuming sector and would significantly reduce CO2 emissions from coal use. The CO2 emissions from oil and natural gas would also be reduced, but the CO2 reductions from oil and natural gas are relatively less than those from coal. It can be concluded that levying a carbon tax and increasing the carbon tax rate is an important way to reduce greenhouse gas emissions, promote the improvement of China’s environment, and promote green and high-quality economic development.

5.2.2. Impact on Economic Benefits

While considering the environmental benefits of a carbon tax policy, the impact on economic development should not be overlooked. A carbon tax will raise the prices of energy-intensive and high-emission energy products, which in turn will change the prices of production factors and sectoral production [35]. Finally, it will have an impact on the income and expenditure of residents and enterprises, as well as on the overall economic development. Therefore, analyzing the impact of a carbon tax policy on macroeconomic development is conducive to balancing environmental with economic benefits and achieving an organic harmony between the two.
(1) The impact of a carbon tax policy on GDP
It is easy to see from Figure 4 that the implementation of carbon tax policy has a negative effect on GDP. This negative effect tends to be stronger as the price of the carbon tax increases, and GDP is affected downwards. For example, in 2019, the rate of decline in GDP for RMB 20/tonne, RMB 40/tonne, and RMB 60/tonne is 0.14, 0.19, and 0.32%, respectively. By and large, this negative impact tends to increase annually over time, except in 2020, when the overall decline in GDP due to the new coronavirus pandemic had a limited impact on the negative effect of carbon tax policy on GDP, with a lower rate of decline. As a result of carbon tax, production costs of energy-consuming products increase, and businesses spend more and save less. At the same time, with no change in transfer payments, the increase in costs leads to a decrease in total output and a decrease in consumption by the population and the government due to higher prices for domestically produced goods. At the international trade level, the higher prices of products produced by enterprises and the reduced competitiveness of export products will also further reduce net exports, finally leading to a decline in GDP.
(2) The impact of a carbon tax policy on residents’ income
The income of residents mainly contains labor, capital, and redistributed incomes through government transfers [19]. Through Figure 5, we can see that the effect on residents’ income under different carbon tax prices is positive and has a certain promotion effect. Overall, with the implementation of the carbon tax system, the income of residents will gradually increase as the level of a carbon tax continues to increase, especially when it is RMB 40/tonne CO2, where the promotion effect is most significant. In terms of production factor inputs, the rise in energy consumption prices will reduce the input of energy resources by enterprises to reduce production costs and increase the input of human capital and skilled and innovative talents needed to restructure and upgrade production, thus increasing the labor factor income of residents. At the same time, a carbon tax levy led to an increase in government tax revenue and higher redistribution income from transfer payments, thus increasing the overall income of residents.
(3) The impact of a carbon tax policy on the industrial structure of the economy
Domestic sectors are interconnected, and changes in price levels and production in one sector have a correlated effect on production and prices in other sectors. When the policy simulation of levying a carbon tax is carried out, the cost of fossil fuel energy increases and the production cost of each sector increases accordingly; however, each sector is affected by the increase of fossil fuel energy cost differently, and the price changes of each sector are also different. The existing practical experience shows that a reasonable industrial structure is an important guarantee to promote emission reduction, improve the environment and develop the economy, and the formation of low energy consumption and low pollution production methods is also an important measure to combat environmental pollution for energy saving and emission reductions in each country. The following is a discussion of the impact of a carbon tax policy implementation on the environment from the industrial-structure level.
The current industrial structure of China’s economy has a small proportion of primary industry structures and a large proportion of secondary and tertiary industry structures. In particular, the secondary industry contains more polluting industries, which are key factors in the loss of fossil fuel energy and an important component of carbon emissions, and also have a greater negative impact on the environment [36]. At the same time, industrial development is also an important pillar of China’s economic development and plays a key role in economic growth. The implementation of a carbon tax policy is also bound to bring a certain impact on the development of industries, so the implementation of a reasonable carbon tax must be levied in order to achieve the effect of emission reduction and optimize the existing environmental situation while not affecting economic development.
The analysis in Table 16 shows that, with the increase in the carbon tax price, the output of all sectors shows a decreasing trend, except for agriculture and services, where the overall sectoral output shows an increasing trend. The potential carbon consumption of agriculture and services as primary and tertiary sectors may have increased their output. For some industries that consume fossil fuel energy in their production activities, the imposition of a carbon tax leads to a gradual increase in energy prices, and companies can only reduce their energy consumption in order to control production costs, thus making the sectoral output decrease. Among them, the heavy industry and coal sector have the largest decline, which is due to their high-energy-consuming industry characteristics and their strong dependence on energy; therefore, the higher the price of carbon tax, the greater the impact and greater decline in output.
From the above analysis, we can see that the carbon tax policy has a greater impact mainly on the secondary industry sector, which has a greater impact on environmental pollution. These result in the secondary industry sector’s price increasing and its output decreasing at the same time, making capital, labor, and other factors flow to the tertiary industry, which drives its development. This results in an increased proportion of the tertiary industry and a reduced proportion of the secondary industry. The overall effect is the optimization of the industrial structure and the reduction of environmental pollution through factor reallocation. Therefore, to reduce carbon emissions and improve the environment, it is necessary to promote the rational transformation of the industrial structures and appropriately adjust the proportion of secondary and tertiary industries.

6. Conclusions and Policy Recommendations

This paper simulates the environmental and economic benefits of carbon tax policies when the carbon tax price is RMB 20/tonne, RMB 40/tonne, and RMB 60/tonne CO2 equivalent by constructing a CGE model for carbon taxes using the 2017 macro social accounting matrix as the database (with 2017 as the base year), and through a dynamic recursive simulation of capital accumulation and labor force growth into 2021. The impacts of a carbon tax policy on the environment and the economy are detailed. The focus is on whether a carbon tax can effectively achieve the Double Dividend Effect in terms of carbon dioxide emissions, economic development, and residents’ income.

6.1. Conclusions

(1) The carbon tax could help curb CO2 emissions
The impact of the introduction of a carbon tax on carbon emissions is shown by the fact that, on the one hand, as the price level of the carbon tax increases within a certain reasonable range, more carbon emission reductions are achieved. On the other hand, as a carbon tax policy is implemented for a longer period of time, the policy is perfected and becomes more effective, and the effect of carbon reduction becomes more significant than a policy implemented in a shorter period of time. Thus, the environmental dividend effect of the carbon tax can be effectively realized, helping to achieve the 2060 carbon neutrality target.
(2) Carbon tax policies have negative macroeconomic effects in the short term and positive effects in the long term
A carbon tax will raise the price of production and increase the costs for companies involved in energy consumption, which in turn will have a negative impact on the productive sector as well as on the national economy. The higher the price of a carbon tax, the greater the negative effects. Studies have shown that the introduction of a carbon tax will dampen economic growth in the short term, with a dampening effect on macroeconomic variables, such as GDP, consumption incomes of residents and businesses, and social welfare. However, in the long run, as the carbon tax policy is implemented and improved, it will have a boosting effect on the economy by guiding the restructuring of industries, subsidizing enterprise production, and increasing the residents’ income.
(3) The implementation of a carbon tax policy can effectively realize the Double Dividend Effect
The impact of carbon tax policies on the reduction of CO2 emissions is significant and effectively contributes to the realization of environmental benefits. However, in the short term, it will not be able to promote economic development and achieve better economic benefits. In the long run, the improvement of a carbon tax policy and the formation of an effective and compound carbon emission reduction mechanism with carbon trading can achieve the adjustment of the industrial structure of the macroeconomy and the transformation and upgrading of development in the future and thus produce a positive promotion effect.

6.2. Policy Recommendations

(1) Rationalizing a carbon tax system according to national conditions
According to previous research on international carbon tax practice, there are two main models for setting up a carbon tax system: independent and integrated tax. In view of the great urgency of achieving carbon neutrality in China, we can initially consider adopting the integrated tax model by adding a carbon dioxide tax item under the environmental protection tax system and take the carbon emissions converted from the consumption of fossil fuels (such as coal, oil, and natural gas) as the basis for taxation, and then consider the independent tax model to expand the scope of taxation when the tax system has matured [37]. In terms of taxation, the initial stage is to start from the production side and then move to the consumption side when the development stage is more mature. China’s environmental protection tax to control carbon emissions is essential in protecting and improving the environment, so it is more reasonable and feasible to place a carbon tax under the environmental protection tax at the initial stages.
(2) Setting a reasonable price standard for a carbon tax
The study shows that the introduction of a carbon tax can effectively achieve carbon emission reduction, which has a catalytic effect on the realization of China’s double carbon target; the higher the price of the carbon tax, the better the carbon reduction effect. However, at the same time, the higher the price of the carbon tax, the greater the inhibiting effect on the development of the economy. The design of a carbon tax rate is crucial. If the design of the tax rate is unreasonable and detached from reality, it will increase the resistance to a carbon tax implementation or reduce the carbon tax’s emission reduction effect. When designing carbon tax rates, countries usually implement a differentiated carbon tax rate mechanism, with a lower rate followed by a higher one. Overall, the international carbon tax rate shows an upward trend. In view of international practices, China should set a carbon tax rate to match its own development stage and implement a differentiated and gradual carbon tax rate based on combining the actual situation of regions and industries and fully considering the unbalanced regional economic development in China; thus, the tax rate should be set differently to ensure the principle of fairness.
At the same time, a lower tax rate can be adopted at the early stages of carbon taxation, and the tax rate will be gradually increased at a later stage and dynamically adjusted according to the completion of emission reduction targets and the economic situation. Therefore, it is easy for the relevant production enterprises to accept and implement a carbon tax at a lower price, and it is conducive to the better performance of a carbon tax policy by reducing the negative impact on economic development as much as possible while forming environmental benefits. At the same time, a carbon tax rate should be priced differently according to the situation of different industry sectors and should not be generalized.
(3) Improving the carbon tax policy regime and increasing the subsidy benefits for taxation
We insist on the principle of “tax neutrality” and improve the acceptance of a carbon tax by the relevant economic entities through tax rate preferences, tax rebates and subsidies, and other policies so as to reduce the additional burden of the relevant stakeholders and stimulate their transformation and upgrading and adjust the production and consumption structure. This will reduce the extra burden of the relevant stakeholders, and encourage them to transform and upgrade their production and consumption structures, thus promoting green and low-carbon economic development. At the same time, attention should be paid to avoiding the duplication and distortion of a carbon tax levy and reducing the duplication of levy in the establishment of the tax.
The levy of a carbon tax in different regions and industries will have different impacts. After the introduction of a carbon tax, it is necessary to establish the relevant tax rebate machine policies to dictate the dispatch of tax revenue at the national level in order to balance the economic development of various regions and industries. For economically underdeveloped regions, more tax compensation policies should be developed, and more of the collected tax revenue should be used to subsidize enterprises that purchase energy-saving and environmental protection equipment. For some high-tech enterprises or small- and medium-sized enterprises in need of key support, the government can formulate tax incentives related to carbon taxes; for low-income groups, since the introduction of a carbon tax will inevitably lead to an increase in energy prices and thus increase their tax burden, the government can give them direct subsidies to reduce the impact of a carbon tax. The government can also set up a carbon tax fund to subsidize some energy-saving and emission-reduction projects on the one hand and use it for the research and development of new and energy-saving, emission-reducing technologies on the other.
(4) Establishing a carbon reduction compound mechanism combining carbon tax and carbon trading
In order to better achieve the dual carbon goal, China has established a unified national carbon trading market since 2021. Both the carbon tax policy (which has not yet been implemented) and the carbon trading system (which has been implemented) are policy instruments to achieve lower carbon emissions and green, low-carbon development in China. China has already established a carbon emissions trading system. The carbon tax and trading policies are designed on different principles; the carbon tax is more suitable for developing countries, while the carbon trading system is more suitable for developed countries. However, in order to play a better carbon emission reduction effect, the two mechanisms can be used in combination; in fact, many countries have recognized that the combination of a carbon tax and trading can better help carbon emission reduction, and in practice, can be used at the same time. In fact, many countries have recognized that the combination of carbon tax and carbon emission reduction can help reduce carbon emissions, and in practice, both are used at the same time, but an important issue to be considered after the introduction of a carbon tax is the coordination between the carbon tax policy and carbon trading systems. Therefore, in China, we can promote the coordination between the carbon tax and carbon emission trading systems to promote the better achievement of China’s carbon emission reduction target. At the same time, attention should be paid to distinguishing the scope of carbon emissions trading and tax levy (to avoid increasing the burden on enterprises) and realize the combinations of social benefits and carbon emission reductions on the road to China’s emission reduction target.
The carbon trading systems and tax policies can complement and collaborate with each other and work together to achieve environmental and economic benefits. On the one hand, the carbon tax policy is a complement to the market mechanism of the carbon trading system at the national, macro-control level; on the other hand, carbon trading also provides complete institutional support for the implementation of a carbon tax, which is conducive to the reform and innovation of the carbon tax system. By establishing a compound mechanism for carbon emission reduction, China will definitely achieve high-quality economic development and lay the foundations for the early achievement of the carbon neutrality target.

Author Contributions

Conceptualization, Y.Z.; methodology, Y.Z.; software, Y.Z.; validation, Y.Z.; formal analysis, Y.Z.; investigation, Y.Z.; resources, Y.Z.; data curation, Y.Z.; writing—original draft preparation, Y.Z.; writing—review and editing, Y.Z. and X.G.; visualization, Y.Z.; supervision, X.G.; project administration, X.G. All authors have read and agreed to the published version of the manuscript.

Funding

This research received no external funding.

Institutional Review Board Statement

Not applicable.

Informed Consent Statement

Not applicable.

Data Availability Statement

The data used to support the findings of this study are available from the corresponding author upon request (e-mail: [email protected]).

Conflicts of Interest

The authors declare no conflict of interest.

References

  1. Zhu, L. China’s Carbon Emissions Report 2015; Sustainability Science Program and Energy Technology Innovation Policy Research Group, Belfer Center Discussion Paper; Belfer Center: Cambridge, MA, USA, 2015; Volume 2, p. 8. [Google Scholar]
  2. Xin, J.P. General Debate of the 75th Session of the United Nations General Assembly. Available online: http://www.xinhuanet.com/politics/leaders/2020-09/22/c_1126527652.htm (accessed on 6 June 2022).
  3. Dong, J.; Huang, W.P. The establishment of China’s carbon tax system:International experience and policy recommendations. Int. Tax. 2017, 11, 71–76. [Google Scholar]
  4. Liu, L.; Zhang, Y.Q. Research on carbon tax system based on carbon emission trading market. Tax Res. 2019, 2, 46–52. [Google Scholar]
  5. Schweizer, U. Externalities and the Coase Theorem: Hypothesis or result? J. Inst. Theor. Econ. (JITE)/Z. Für Die Gesamte Staatswiss. 1988, 144, 245–266. Available online: http://www.jstor.org/stable/40751071 (accessed on 21 December 2022).
  6. Zhang, Y. Exploring the feasibility of carbon tax construction from achieving carbon neutrality target. Hainan Financ. 2022, 2, 51–58. [Google Scholar]
  7. Weitzman, M.L. Prices vs. quantities. Rev. Econ. Stud. 1974, 41, 477–491. [Google Scholar] [CrossRef]
  8. Mandell, S. Optimal mix of emissions taxes and cap-and-trade. J. Environ. Econ. Manag. 2008, 56, 131–140. [Google Scholar] [CrossRef]
  9. Ni, J. Research on carbon tax and carbon emission trading mechanism. Tax Res. 2016, 4, 46–50. [Google Scholar]
  10. Jia, X.W.; Wang, Z. Using the introduction of carbon tax as an opportunity to build a compound mechanism for carbon emission reduction in China. Tax. Res. 2021, 8, 18–21. [Google Scholar]
  11. Su, C.Y.; Wang, Y. International experience and inspiration of environmental protection tax—Based on the perspective of double dividend. J. Henan High. Inst. Financ. Tax. 2019, 6, 12–17. [Google Scholar]
  12. Tullock, G. The welfare costs of tariffs, monopolies, and theft. Econ. Inq. 1967, 5, 224–232. [Google Scholar] [CrossRef]
  13. Pearce, D. The role of carbon taxes in adjusting to global warming. Econ. J. 1991, 101, 938–948. [Google Scholar] [CrossRef]
  14. Goulder, L.H. Environmental taxation and the double dividend: A reader’s guide. Int. Tax Public Financ. 1995, 2, 157–183. [Google Scholar] [CrossRef]
  15. Freire-González, J.; Puig-Ventosa, I. Reformulating taxes for an energy transition. Energy Econ. 2019, 78, 312–323. [Google Scholar] [CrossRef]
  16. Glomm, G.; Kawaguchi, D.; Sepulveda, F. Green taxes and double dividends in a dynamic economy. J. Policy Model. 2008, 30, 19–32. [Google Scholar] [CrossRef] [Green Version]
  17. Lou, F. A simulation study on the impact of carbon tax levy on China’s macro economy and carbon emission reduction. Res. Quant. Econ. Technol. Econ. 2014, 10, 84–96+109. [Google Scholar]
  18. Yun, X.P. Research on the synergistic impact effect of energy and environmental fiscal policies based on CGE model. Econ. Issues 2019, 7, 37–44. [Google Scholar]
  19. Li, Y.; Shi, W.Z.; Hu, Z.Y. Research on the double dividend effect of carbon tax policy based on CGE model. Financ. Theory Pract. 2021, 42, 82–89. [Google Scholar]
  20. Santikarn, M.; Churie Kallhauge, A.N.; Bozcaga, M.O.; Sattler, L.; Mccormick, M.S.; Ferran Torres, A.; Conway, D.; Mongendre, L.; Inclan, C.; Mikolajczyk, S.; et al. State and Trends of Carbon Pricing. 2021. Available online: https://policycommons.net/artifacts/1806796/state-and-trends-of-carbon-pricing-2021-english/2540378/ (accessed on 21 December 2022).
  21. Ge, Y. The international practice of carbon tax system and its inspiration. Financ. Vert. 2021, 4, 48–55. [Google Scholar]
  22. World Bank. World Bank Carbon Pricing Dashboard (2021-04-01). Available online: https://carbonpricingdashboard.worldbank.org/ (accessed on 15 August 2021).
  23. Lu, S.L.; Bai, Y.F. The international practice of carbon tax and its implications for China’s “carbon peak” target by 2030. Int. Tax. 2021, 12, 21–28. [Google Scholar]
  24. Dong, R.; Li, Y.S. The international practice and inspiration of carbon taxation. Financ. Vert. 2021, 12, 32–36. [Google Scholar]
  25. Chen, X.D.; Lu, H.Y.; Wang, H.H. The latest progress of carbon taxation abroad and its inspiration for China. Int. Tax. 2022, 2, 59–65. [Google Scholar]
  26. Wen, Z.C. Feasibility and policy research and impact of the carbon tax in China. Financ. Econ. 2022, 28, 30–32. [Google Scholar]
  27. Xie, H.X. Research on the Policy Effects of the Introduction of the Carbon Tax in China. Master’s Thesis, Shanghai University of Finance and Economics, Shanghai, China, 2021. [Google Scholar]
  28. He, J.H.; Shen, K.T.; Xu, S.L. A CGE model of carbon tax and CO2 emission reduction. Quant. Econ. Res. Technol. Econ. 2022, 10, 39–47. [Google Scholar]
  29. Cao, J. Towards a low-carbon development path: Design of China’s carbon tax policy and analysis of CGE model. Financ. Stud. 2009, 12, 19–29. [Google Scholar]
  30. Li, X.Q. Simulation Analysis of Carbon Tax Effect Based on CGE Model. Master’s Thesis, Hebei University of Economics and Business, Shijiazhuang, China, 2022. [Google Scholar]
  31. Li, C.Y. A Study on the Simulation of China’s Carbon Market Policy Based on CGE Model. Master’s Thesis, Nanjing Forestry University, Nanjing, China, 2020. [Google Scholar]
  32. Guo, Z.Q. Simulation Analysis of China’s Low Carbon Economic Development Policy Based on CGE Model. Ph.D. Thesis, China University of Mining and Technology, Beijing, China, 2011. [Google Scholar]
  33. Li, J.Q. Carbon emission and market-based emission reduction mechanism design based on CGE model. Coal Econ. Res. 2019, 8, 52–60. [Google Scholar]
  34. Shi, W.Z. Research on the Double Dividend Effect of Carbon Tax Policy Based on CGE Model. Master’s Thesis, Hunan University, Changsha, China, 2021. [Google Scholar]
  35. Tang, J.; Zhang, L.; Yu, L.A. A study on the impact of carbon tax policy based on CGE model. J. China Univ. Pet. 2020, 1, 11–17. [Google Scholar]
  36. Weng, Z.X.; Ma, Z.Y.; Cai, S.F. A study on the economic and environmental impacts of China’s carbon tax policy—Based on dynamic CGE model analysis. China Price 2018, 8, 10–13. [Google Scholar]
  37. Pang, S.Y. Research on Carbon Taxation in China in the Context of “Double Carbon”. Master’s Thesis, China Institute of Fiscal Science, Beijing, China, 2022. [Google Scholar]
Figure 1. Framework diagram of the CES production function for the production module.
Sustainability 15 01026 g001
Figure 2. Trade module domestic product and distribution framework.
Sustainability 15 01026 g002
Figure 3. Trends in CO2 emission reductions under different carbon tax prices.
Sustainability 15 01026 g003
Figure 4. Trends in GDP at different carbon tax prices.
Sustainability 15 01026 g004
Figure 5. Trends in residential income at different carbon tax prices.
Sustainability 15 01026 g005
Table 1. Countries and regions that have introduced carbon taxes.
YearCountry or Territory (Year of Introduction)
1990–2000Finland (1990), Poland (1990), Norway (1991), Sweden (1991)
Denmark (1992), Slovenia (1996), and Estonia (2000)
2000–2010United Kingdom (2001), New Zealand (2007), Switzerland (2008), Liechtenstein (2008), British Columbia, Canada (2008), Iceland (2010), and Ireland (2010)
2010PRESENTUkraine (2011), Japan (2012), Australia (2012–2014)
France (2014), Mexico (2014), Spain (2014), Portugal (2015)
Alberta, Canada (2017), Chile (2017), Colombia (2017)
Argentina (2018), Singapore (2019), South Africa (2019), Northwest Territories, Canada (2019), New Brunswick, Canada (2020), Luxembourg (2021), and Netherlands (2021)
Note: Latvia, Costa Rica, and the Canadian province of Prince Edward Island have also introduced a carbon tax, but no information is available on the year.
Table 2. Carbon tax rates in selected countries and regions.
Country and Region
(of Levy Commencement)
Carbon Tax Rate
(USD/Tonne CO2 e)
Emissions Covered as a
Proportion of Total
EuropeFinland (1990)62.3 (Fossil fuels)
72.8 (Transport fuels)
36%
Sweden (1991)137.240%
United Kingdom (2001)24.823%
Switzerland (2008)101.533%
France (2014)52.435%
Asia and AfricaJapan (2012)2.675%
Singapore (2019)3.780%
South Africa (2019)9.280%
AmericasMexico (2014)0.4–3.223%
Chile (2017)5.039%
Argentina (2018)5.520%
New Brunswick, Canada (2020)31.839%
Table 3. Carbon tax versus carbon trading.
Carbon TaxCarbon Trading
Top-level
design
SimilaritiesAll are market-based, low-carbon tools to combat climate change
DifferencesCharacteristicPrice-based policy instrumentsQuantitative policy instruments
Pricing criteriaMarket decisionGovernment decision
Carbon emission levelsGovernment decisionMarket decision
ImpactsGovernment
perspective
Cost of
carbon reduction
Relatively low cost of development and high cost of input in the subsequent collection and administration processHigh upfront investment costs and technical costs to set up the system, low maintenance costs later
Scope of
implementation
A wide range of applications suitable for most sources of CO2 emissionsA narrow range of applications suitable for large sources of CO2 emissions
Resistance to
implementation
Not easy to implement in the short term, increased tax costs and burden on businesses and residentsEasily accepted, based on voluntary, spontaneous market transactions
Fairness of
implementation
Relatively fair and transparentProne to administrative intervention, rent-seeking issues, and unfair carbon credits
Income use
effects
Effective in achieving both environmental and socio-economic dividendsDependent on whether the revenue generated is used to compensate for the negative externalities of carbon emissions
International trade and
investment
There is a risk of weakening the international competitiveness of enterprises, and subsidies and tax rebates for exporters can easily lead to international trade disputesInternational trading of carbon credits enriches international trade, increases the variety of transactions, and promotes international trade and investment
International
coordination of climate policy
Regional in scope and capable of becoming an international policy toolGlobal in nature and conducive to the international coordination of existing climate policies
Corporate
perspective
Cost of
carbon reduction
Carbon abatement costs are determined to facilitate companies in choosing the optimal abatement pathThe cost of carbon emission reduction fluctuates with the market and is uncertain, which is not conducive to the adjustment of enterprises’ production and management decisions
Technology
innovation
incentives
Under a single tax rate, the incentive effect is small; under a progressive tax rate, enterprises are incentivized to innovate in technology. Carbon tax revenue can also be used to promote energy efficiency and emission reduction project development and technological innovationSome incentive exists for carbon reduction technologies, but policy effects are affected by economic cycles
Table 4. Description of nested variables and parameters at the first level of the production module.
VariablesMeaningVariablesMeaning
Q A Total output P A a Sectoral production activity prices
Q V A Labor–energy–capital inputs P V A a Synthetic labor–capital–energy prices
Q I A Non-energy intermediate inputs P I A a Non-energy factor prices
α i A Transfer parameters of the CES production function for each sector’s output δ i A Output CES production function share parameters by sector
σ i A Elasticity of the substitution coefficient between intermediate and value-added inputs
Table 13. List of sub-sectors of industries.
IndustriesIndustriesIndustries
1. Agricultural products
2. Forest products
3. Livestock products
4. Fishery products
5. Coal mining and washing products
6. Oil and gas extraction products
7. Refined petroleum and processed nuclear fuel products
8. Processed coal products
9. Basic chemical materials
10. Fertilizers
11. Pesticides
12. Cement, lime, and gypsum
13. Gypsum, cement products, and similar goods
14. Building materials, such as masonry and stone
15. Glass and glassware
16. Ceramic products
17. Refractory products
18. Water production and supply
19. Electricity and heat production and supply
20. Gas production and supply
Table 14. Macro social accounting matrix (unit: billion).
Expenses
12345678Total
EventsCommoditiesKey elementsResidentsCompaniesGovernmentCapitalAbroad
Income1Events 3,329,722 3,329,722
2Commodities1,966,551 3,601,506 1,990,9108,584,25916,143,226
3Key elements1,205,169 1,205,169
4Residents 30,628 27,89731,164 89,689
5Companies 277,890 277,890
6Government1,580,014 11,96632,117 11,6461,635,743
7Capital 180,564169,07327,943 −13,120364,460
8Abroad 2,689,034−3549 399 2,685,884
Total4,751,7346,018,756304,9693,794,036229,08759,5061,990,9108,582,785
Table 15. Impact of the carbon tax on energy consumption and carbon emissions.
Carbon Tax Price (RMB/t)Consumption
of Coal
Consumption
of Oil
Consumption
of Gas
Coal Carbon EmissionsOil Carbon EmissionsGas Carbon
Emissions
20−7.12%−3.25%−6.31%−23.21%−12.21%−11.15%
40−10.21%−4.12%−7.28%−23.45%−12.45%−11.84%
6021.23%−7.21%−9.95%−24.08%−13.38%−12.21%
Table 16. Impact of a carbon tax on sectoral output.
Carbon Tax Price (RMB/t)204060
Agriculture2.21%2.24%2.28%
Heavy industry−8.22%−10.33%−14.90%
Light industry−3.21%−3.22%−3.23%
Service industry2.78%2.78%2.79%
Transportation−4.41%−5.36%−6.58%
Coal−6.98%−13.06%−19.43%
Oil−3.25%−3.81%−4.03%
Gas−3.43%−3.65%−3.91%
Disclaimer/Publisher’s Note: The statements, opinions and data contained in all publications are solely those of the individual author(s) and contributor(s) and not of MDPI and/or the editor(s). MDPI and/or the editor(s) disclaim responsibility for any injury to people or property resulting from any ideas, methods, instructions or products referred to in the content.

