Abstract
The study of the distribution form and calculation method of the earth pressure on the back wall of a pilot tunnel under a jacking reaction is very important to ensure the safety and smooth construction of the pipe jacking. Based on a metro station in Shenyang, this paper firstly investigates the effects of the changes in the jacking reaction parameters, such as the loading intensity, loading position, and loading area on the earth pressure and the displacement of the back wall in a pilot tunnel through numerical simulation, and then proposes a formula for calculating the soil reaction on the back wall and verifies it by comparison with the FEA (finite element method) results. The results show that the earth pressure distribution pattern of the back wall is similar to the normal distribution curve under the action of the jacking reaction. The horizontal displacement and earth pressure of the back wall will gradually increase with the increase in the jacking reaction. The horizontal displacement of the back wall is greatest when the load is applied to the middle wall, followed by the top wall and the bottom wall. The maximum horizontal displacement is reduced by approximately 24.25% when the loading position changes from the middle to the bottom. As the loading area increases, the maximum horizontal displacement of the back wall decreases, in the order of 11.8% and 14.45% relative to the previous level. The earth pressure of the back wall also decreases, in the order of 17.92% and 22.76% relative to the previous level. The equations presented are applicable to the calculation of the soil reaction in the limit state.
1. Introduction
In recent years, more and more metro stations have been built in China, and the pipe roofing method is an effective way of constructing metro stations, significantly reducing the ground settlement caused by excavation [1,2,3]. The method consists of jacking in steel pipes to form a pipe-roofing structure and then excavating under the support of the pipe-roofing structure. At present, many metro stations have adopted the pipe-roofing method, such as Xinle Site station of Shenyang Metro Line 2 [4], Dongbeidamalu station of Shenyang Metro Line 10, and Olympic Sports Centre Station on Line 9 [5,6,7]. Pipe jacking is one of the key stages of the pipe-roofing method [8,9,10] and is mainly divided into longitudinal pipe roof, which is jacked longitudinally along the station, and transverse pipe roof, which is jacked transversely along the station, according to the jacking direction. Compared to longitudinal pipe roof, transverse pipe roof is increasingly used because of its small pipe-jacking length and the ease of precision control [11]. Transverse pipe roof needs to set a reaction frame in the pilot tunnel, and the back wall of the pilot tunnel bears the jacking reaction. If the strength and stability of the back wall are insufficient, it will lead to engineering problems. Therefore, an in-depth study of the distribution pattern and calculation method of the earth pressure at the back wall under the reaction of pipe jacking is very important to ensure the safety and smooth construction.
As for the stress and deformation of the back wall under the reaction of pipe jacking, some scholars studied the relationship between the earth pressure and jacking force in the process of pipe jacking [12,13]. Sun et al. [14,15] studied the influence of the thickness of the reaction wall, the elastic modulus of the soil, and the position of the reaction on the soil deformation. Gong et al. [16] considered the friction resistance of the bottom and side walls of the caisson and calculated the soil reaction based on the relationship between the displacement and earth pressure. Yan et al. [17] obtained the effect on the stability of the back wall when jacking the pipe in two directions simultaneously based on 3D numerical simulations. Chen et al. [18] and Wei et al. [19] proposed the formula for calculating the maximum soil reaction that can be borne by the soil behind the back wall of a rectangular working shaft constructed by the SMW method. Zhao et al. [20], Huang et al. [21], and Yang et al. [22] studied the stress and deformation of tunnels caused by excavation. In the above literature, the jacking reaction mainly acts on rectangular or circular working shafts, while the cross-sectional shape of the pilot tunnel is generally a horseshoe shape, and the distribution state and calculation method of the earth pressure under different shapes are different. Therefore, an in-depth study of the earth pressure caused by the jacking reaction in the pilot tunnel is needed.
In view of this, based on a metro station in Shenyang, this paper firstly investigates the distribution of the earth pressure on the back wall of the pilot tunnel under the action of the jacking reaction through numerical simulation, then analyzes the influence of the variation of parameters such as the loading intensity, loading position, and loading area on the earth pressure, and, finally, proposes a calculation method of the soil reaction on the back wall under the jacking reaction in the pilot tunnel of the sandy soil stratum.
2. Engineering Background
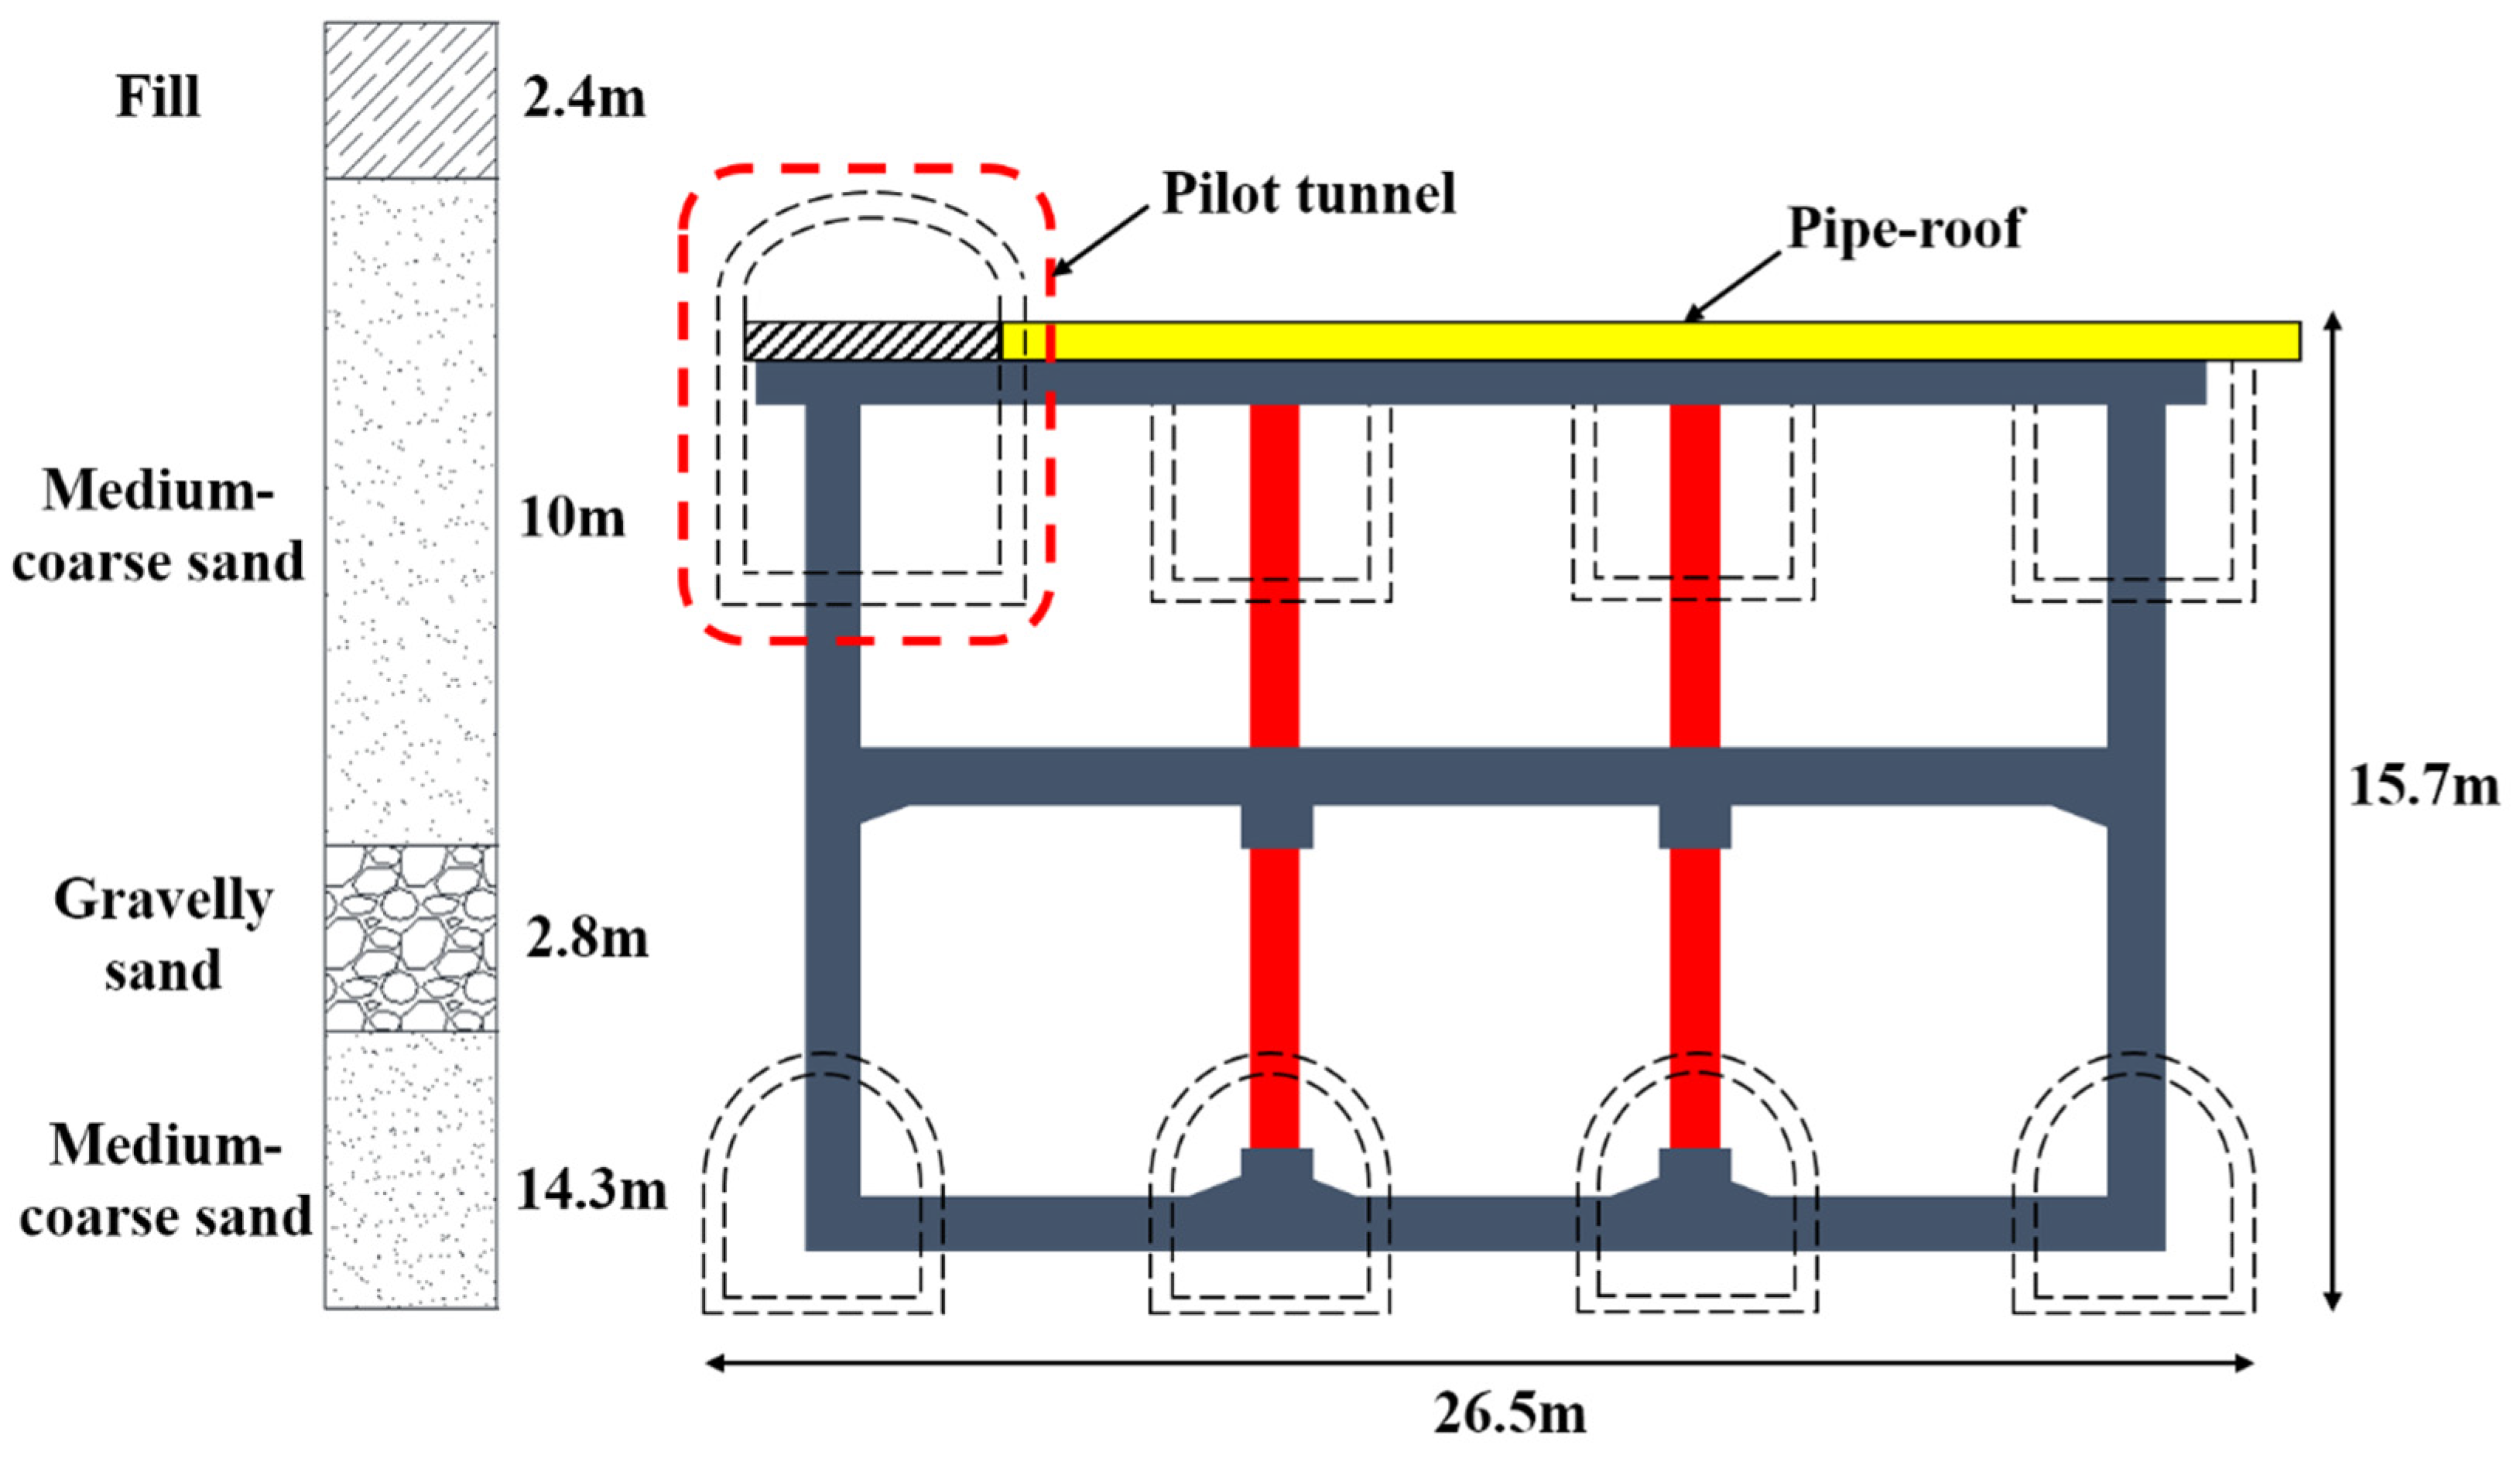
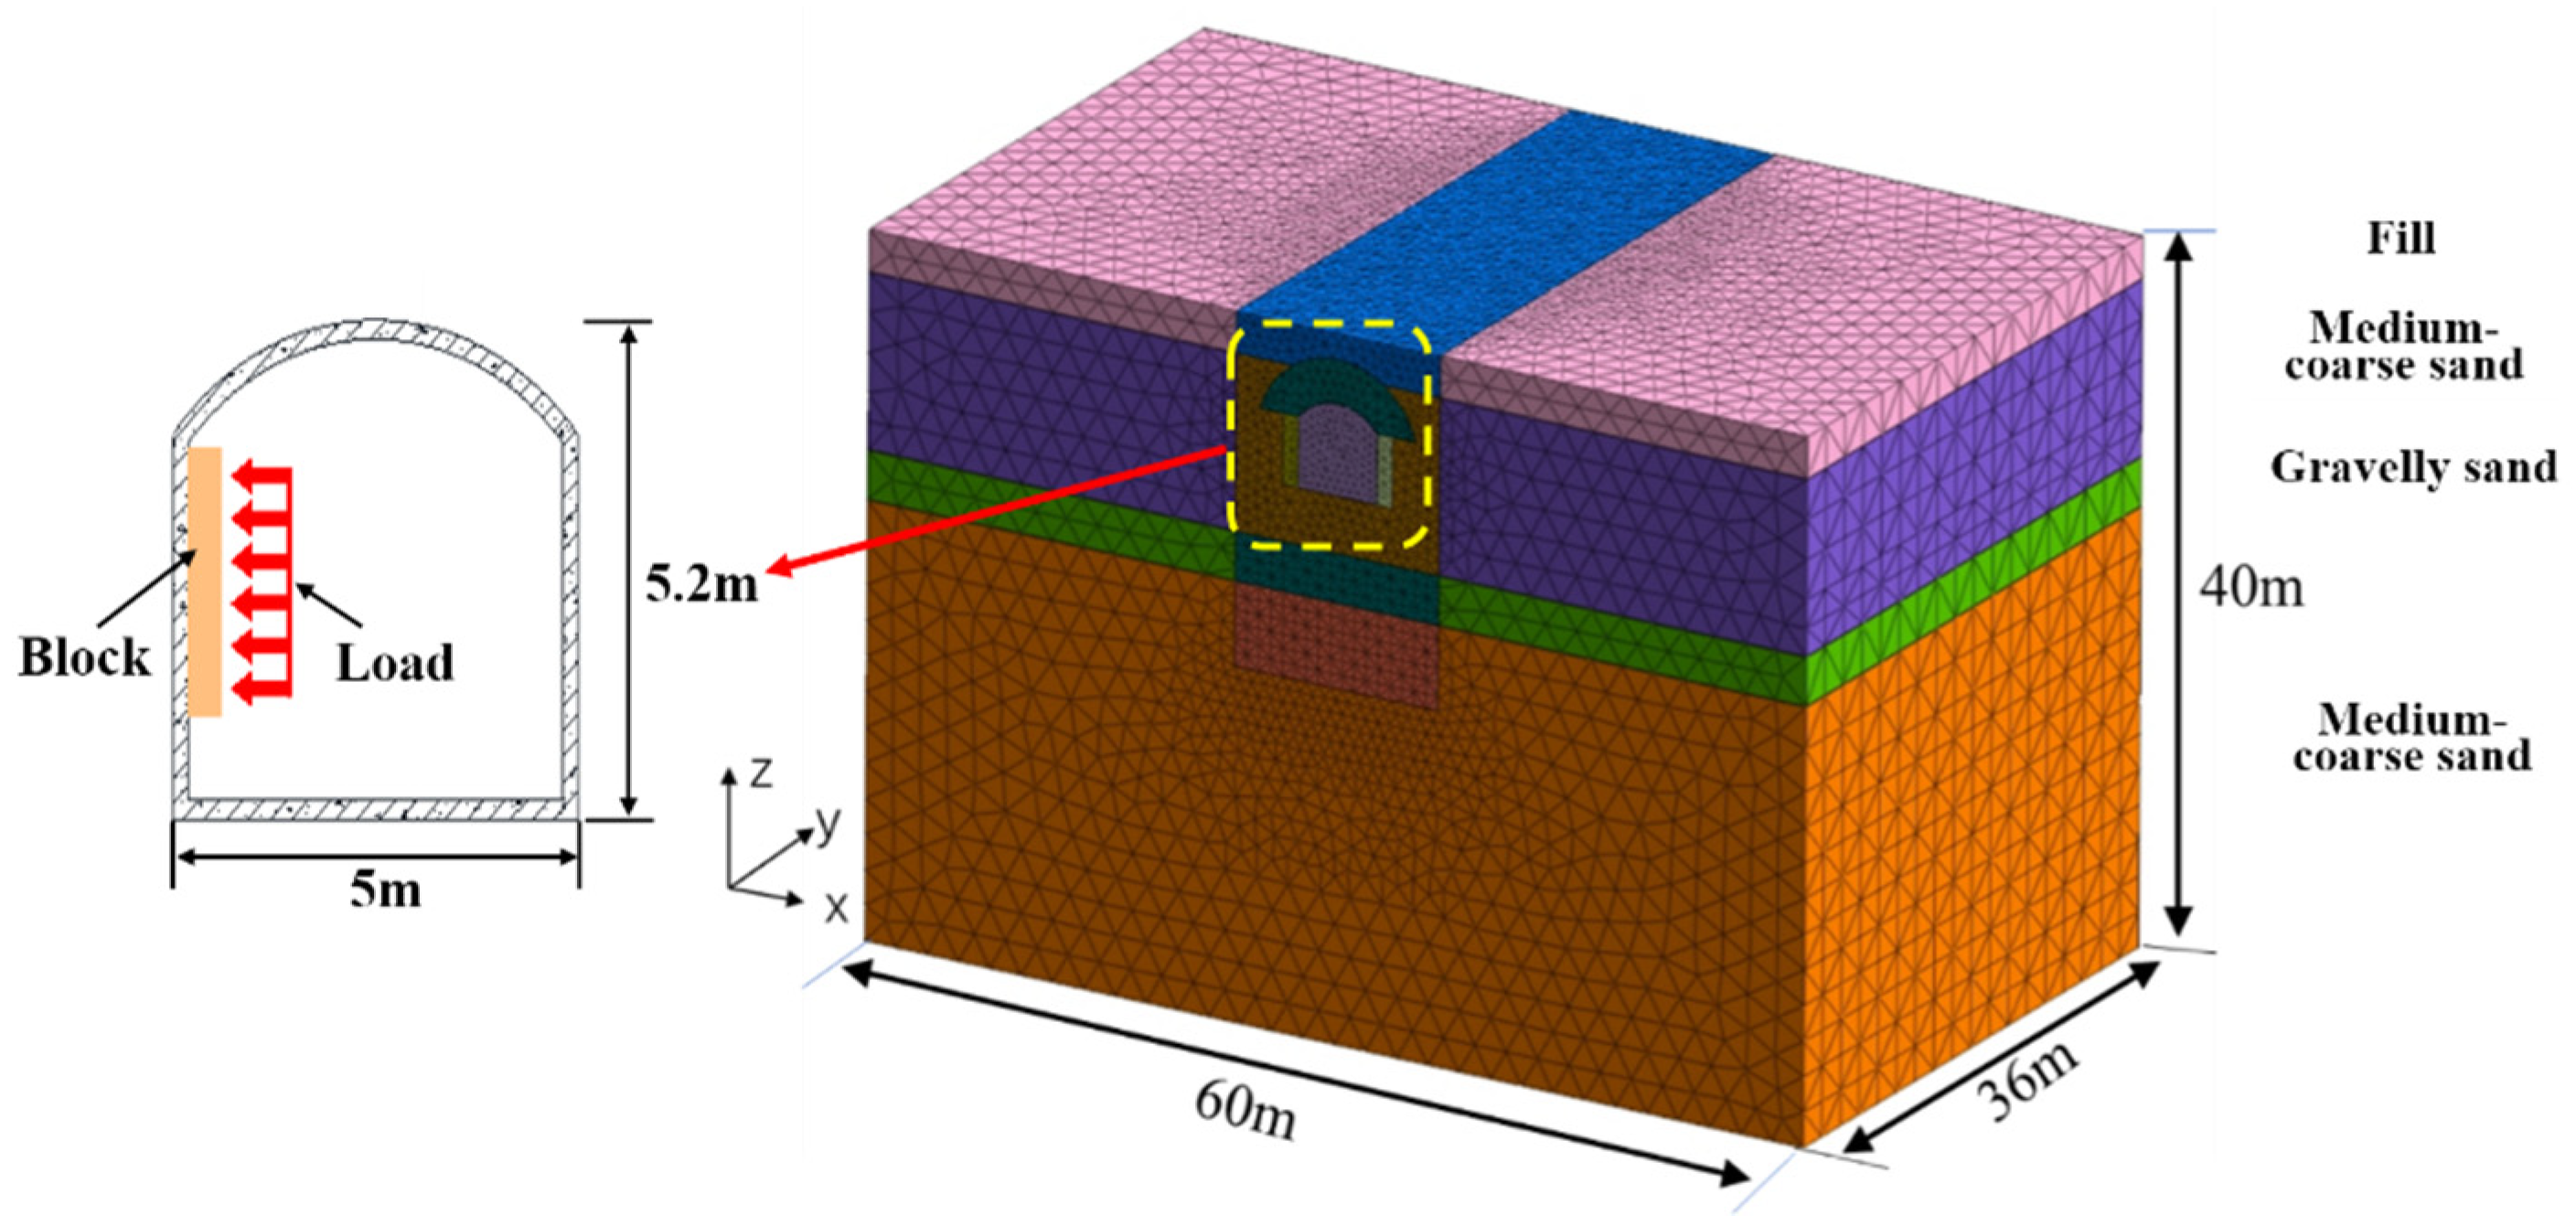
This paper relies on a subway station project in Shenyang, and the section of the station is shown in Figure 1. The section size of the station is 26.5 × 15.7 m, the length is 47.5 m, and the roof is covered with soil of 4.2~5.6 m. The transverse pipe roof combined with PBA is adopted for construction, and the soil layers from top to bottom are, respectively, miscellaneous fill, medium coarse sand, gravel sand, and medium coarse sand. The pilot tunnel is shown in Figure 2, with a size of 5 × 5.2 m. The steel pipes are jacked into the pilot tunnel in sections. The total length of the steel pipes is 21 m, the diameter is 402 mm, and the thickness is 16 mm. In total, 108 pipes are jacked. Precipitation treatment was carried out prior to construction and the construction process was not affected by groundwater.
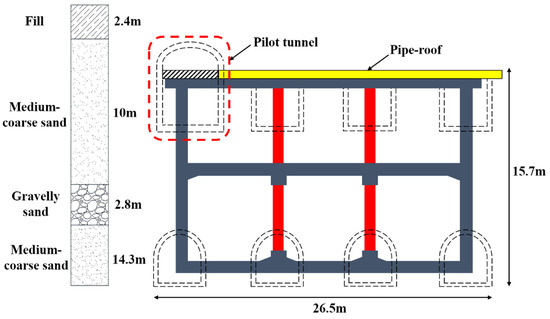
Figure 1.
Section view of the station.

Figure 2.
Pipe jacking in pilot tunnel.
3. Numerical Simulation
3.1. Finite Element Model
In this section, Midas GTS NX is used to establish a three-dimensional model to study the distribution state of the earth pressure on the back wall of the pilot tunnel under the effect of the jacking reaction and the influence of the different parameters of the jacking reaction on the earth pressure. The calculation model is shown in Figure 3. The model is 60 m long, 36 m wide, and 40 m high, with vertical and horizontal constraints applied to the bottom boundary of the model, a free surface at the top of the model, and horizontal constraints on the rest of the boundary. The model size meets the boundary conditions [23]. In order to better simulate the initial stress state, the excavation process of the pilot tunnel is simulated in the numerical model, and then the surface load is applied inside the pilot tunnel to simulate the pipe-jacking reaction. The depth of the pilot tunnel is 4 m, and a block is set on the inner wall, through which the load acts on the pilot tunnel. The size of the block is 36 m × 3 m × 0.5 m. The stiffness of the block is large enough to have an elastic modulus of 1000 GPa. A uniform load of 20 kPa was added at the top of the model to simulate the traffic load.
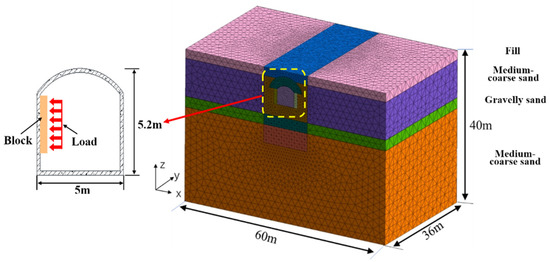
Figure 3.
Calculation model.
Modified Mohr–Coulomb elastoplastic constitutive is adopted for the soil; compared with the Mohr–Coulomb constitutive, the modified Mohr–Coulomb constitutive has three more parameters, which are the tangent modulus (), secant modulus (), and unloading and reloading modulus (). According to construction experience, the relationship between these three parameters and the compression modulus () meets for typical sandy strata in Shenyang. Elastic constitutive is adopted for the initial support of the pilot tunnel, and solid elements are used to simulate both the soil and initial support. Before the excavation of the pilot tunnel, it is necessary to set up the advanced small pipe to form a reinforcement zone, which is simulated by solid units. The physical and mechanical parameters of the model are shown in Table 1.

Table 1.
Physical and mechanical parameters of the model.
3.2. Loading Area of Jacking Reaction and Monitoring Section Layout
To eliminate the boundary effects, the load was applied in the middle of the pilot tunnel axially (Y = 18 m) with a loading area of 2 m × 2 m. Under normal pipe-jacking conditions, the measured jacking force on site is approximately 1000 kN to 2000 kN. Considering that the jacking force will increase significantly when unknown obstacles are encountered in the jacking process, the maximum jacking force is set to 4000 kN in this section of the simulation, with eight loading stages of 500 kN each. Figure 4 shows the layout of the monitoring sections. Two monitoring sections are laid out, where section V1 is monitored from Z = 0 m to Z = 18 m. Section H1 is monitored from Y = 0 m to Y = 36 m.

Figure 4.
Monitoring section diagram.
3.3. Distribution of Earth Pressure on the Back Wall of Pilot Tunnel
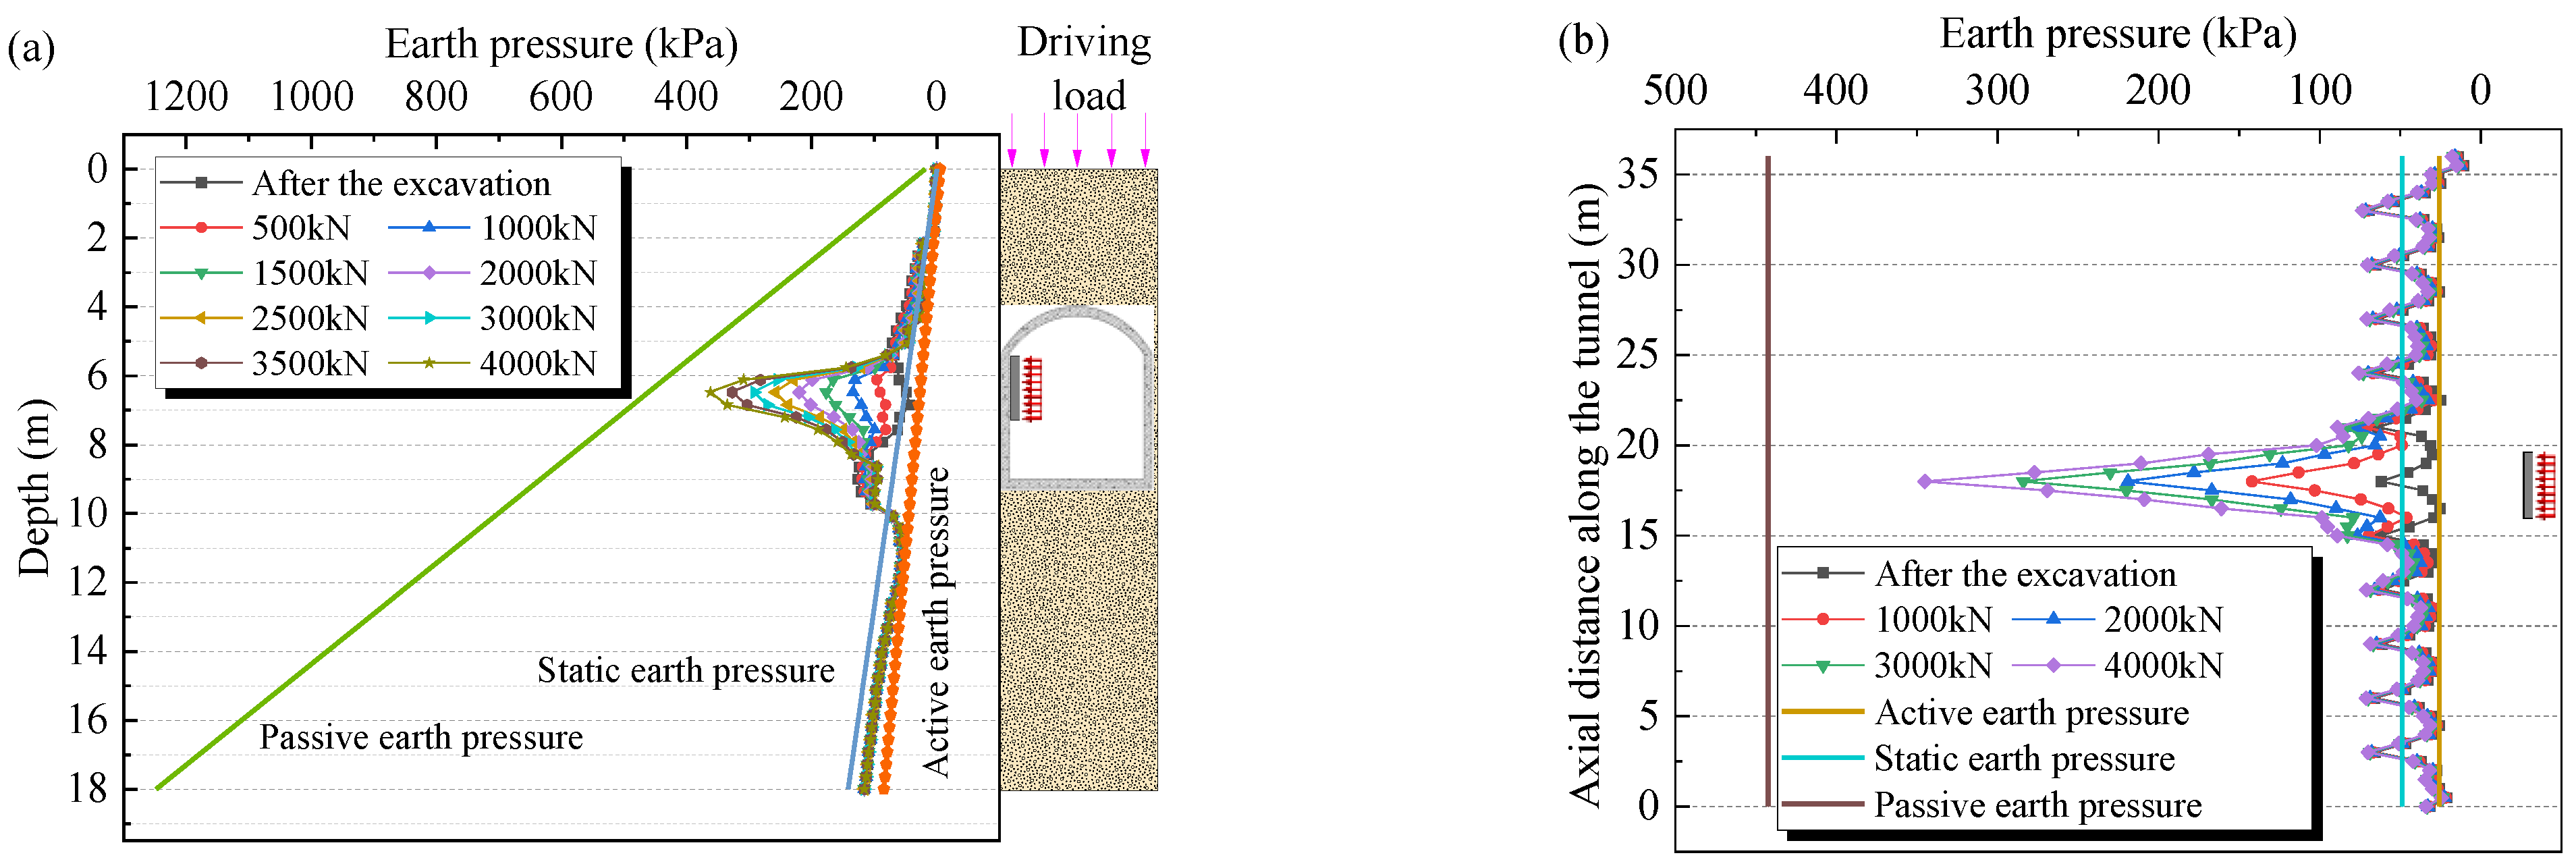
Figure 5 shows the variation of the earth pressure in sections V1 and H1 during the loading process. As the load is applied step by step, the earth pressure at section V1 exhibits significant local variations. The earth pressure increases significantly in the loading area, decreases slightly in the area from the top of the straight wall to the vault and at the bottom of the straight wall, and remains constant in the other areas. Under the action of the load, the main influence area of the earth pressure is the straight wall part. After loading, the earth pressure shows a large distribution in the middle part and small distribution in other parts, with a distribution pattern between “U” and “V” shapes, similar to the normal distribution curve. The earth pressure is between the static earth pressure and the passive earth pressure, indicating that the soil has not reached the passive limit state and is in a stable condition under this load condition. As the load is applied step by step, the earth pressure at section H1 shows the feature of local drastic changes. The earth pressure in the loading area increases significantly and remains basically unchanged in other areas. Along the axial direction of the tunnel, the main influence area of the load on the earth pressure of section H1 is about 5 m, about 2.5 times of the load width. The position of the maximum earth pressure coincides with the load center. The distribution form of the earth pressure is large in the middle and small on both sides, approximately in the shape of a “V”. After loading, the earth pressure in the main impact area of section H1 is between the static earth pressure and the passive earth pressure.
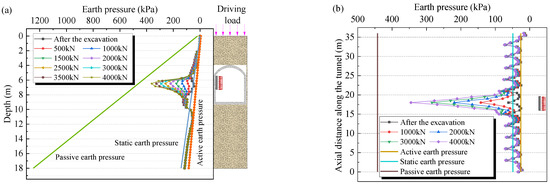
Figure 5.
Variation of back wall earth pressure during different loading stages: (a) Section V1; (b) Section H1.
4. Effect of Jacking Reaction Parameters on the Back Wall
4.1. Loading Intensity
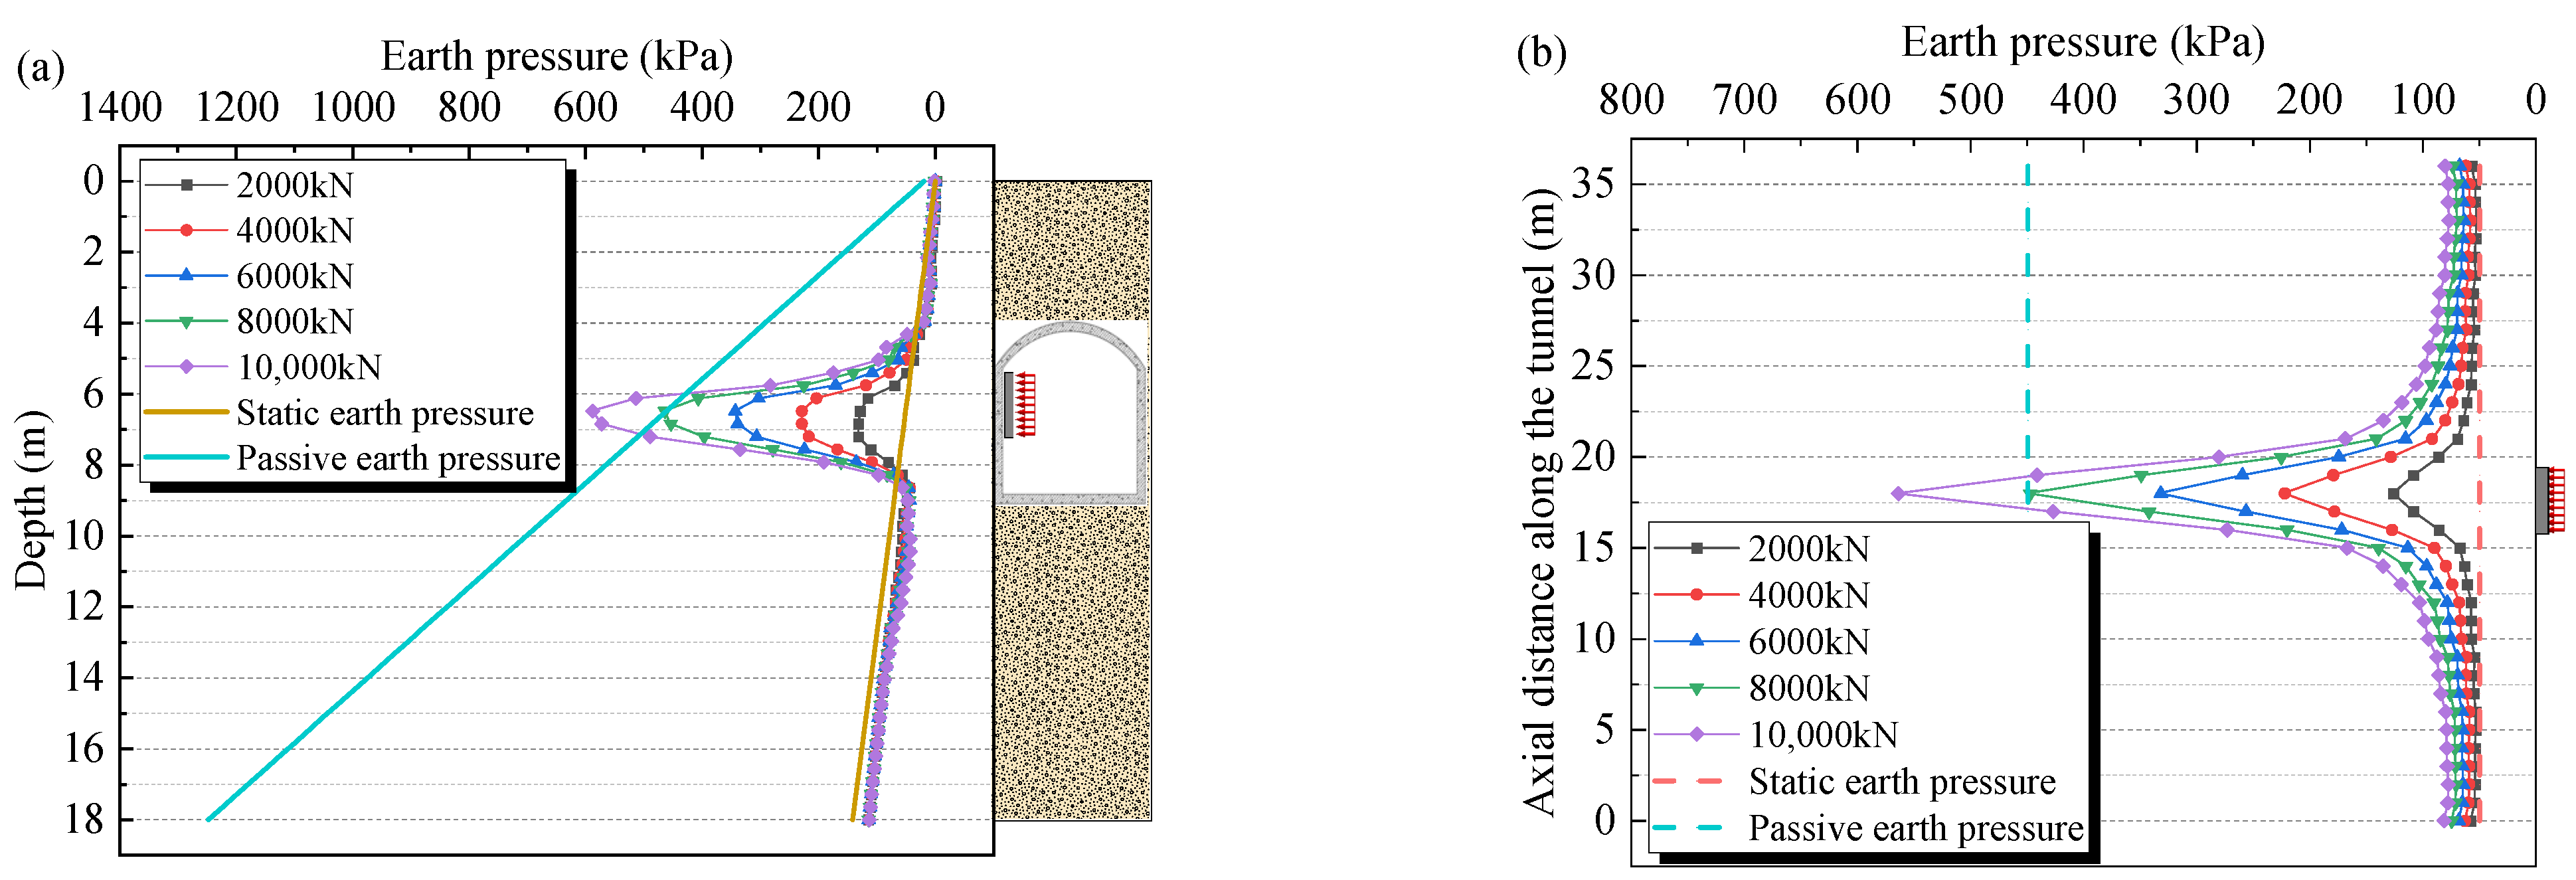
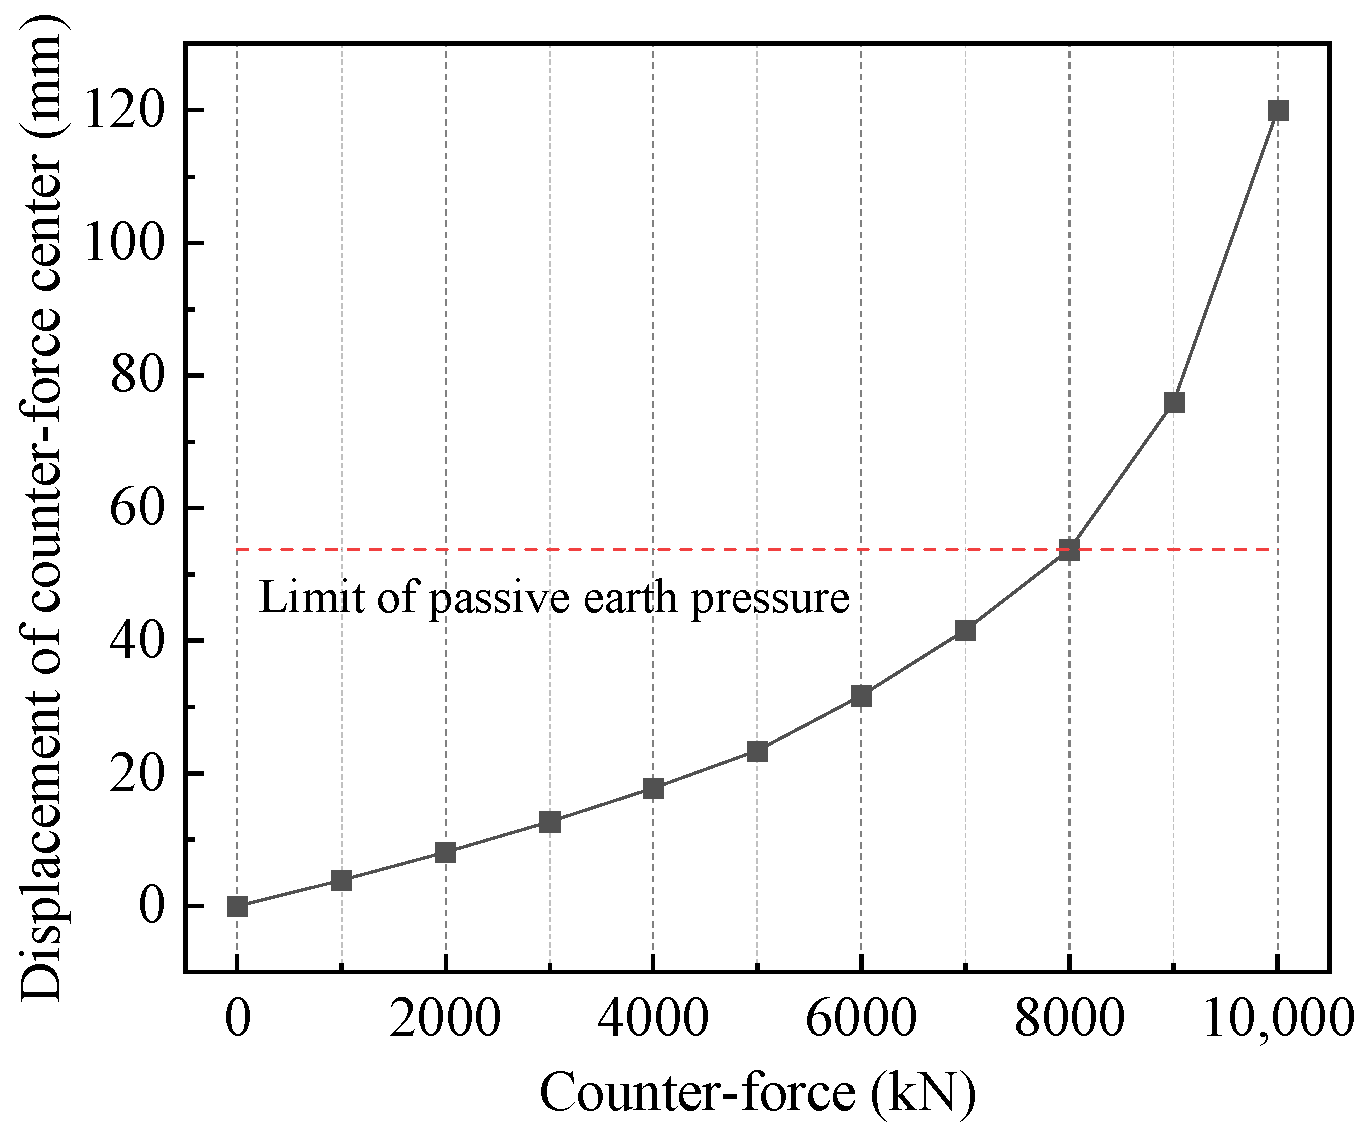
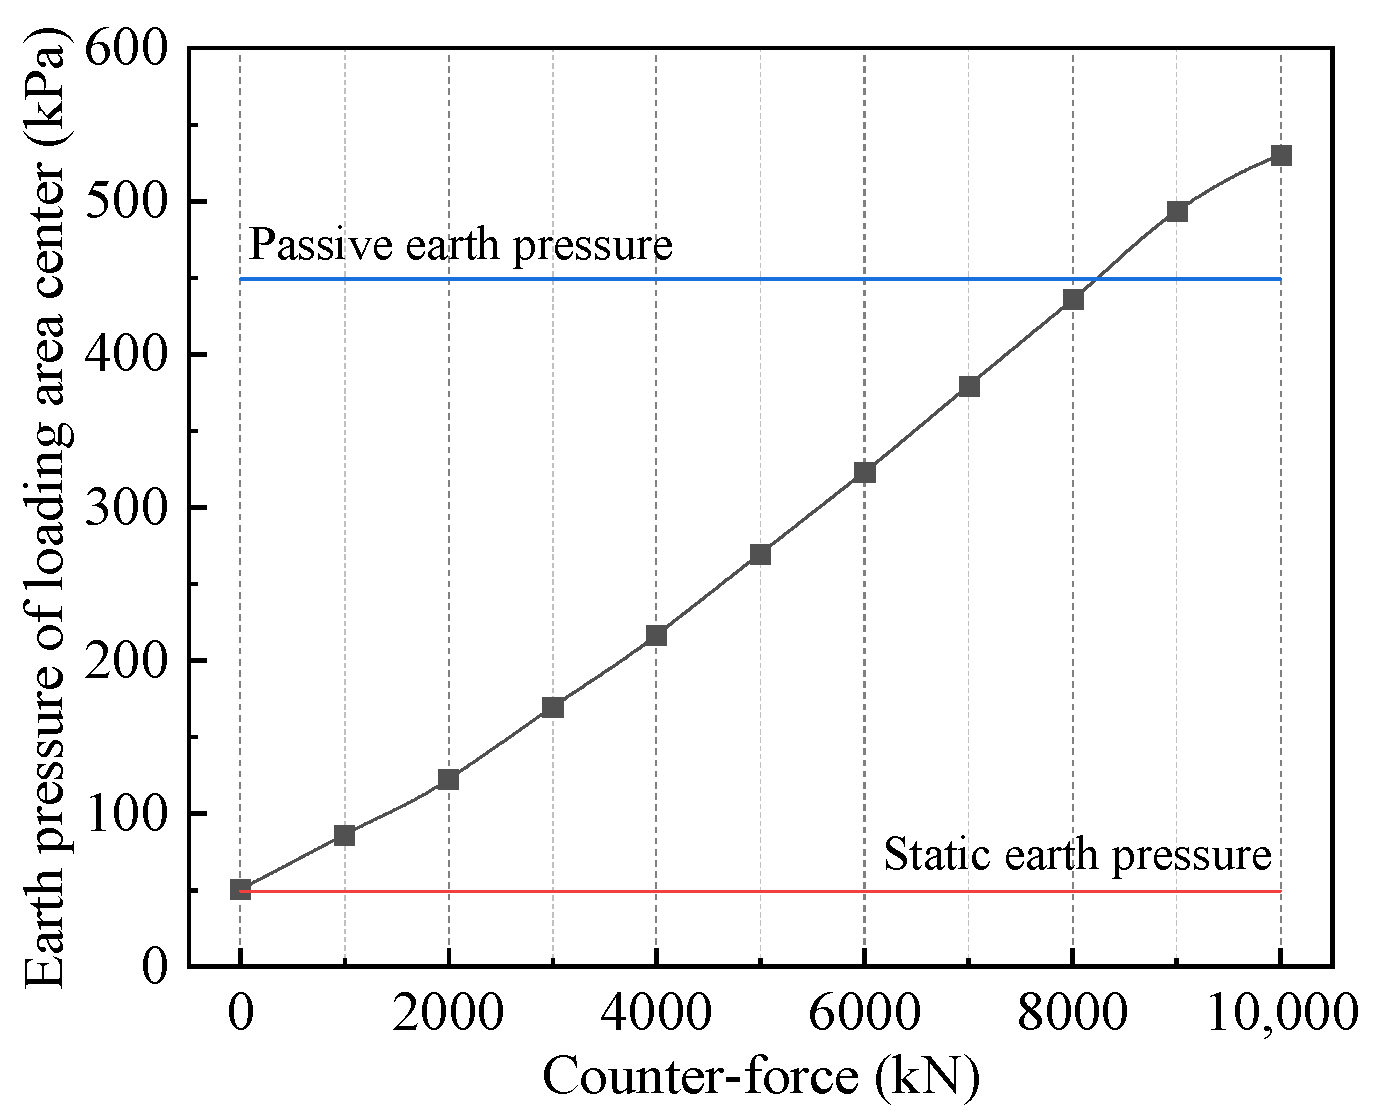
Changes in the loading intensity will change the distribution of the earth pressure in the back wall of the pilot tunnel. In this section, the jacking reaction is increased from 2000 kN to 10,000 kN to study the influence of the pipe-jacking reaction on the back wall. The variation of the earth pressure at section V1 and section H1 is shown in Figure 6. When the jacking reaction is less than 8000 kN, the earth pressure of section V1 and section H1 are between the static earth pressure and passive earth pressure, and the back wall is stable. When the jacking reaction reaches 8000 kN, the reaction center (the intersection of section V1 and section H1) first reaches the passive state, and the soil reaches the critical state. Then, with the increase in the jacking reaction, the area reaching the passive state gradually increases, which indicates that the back wall is unstable.
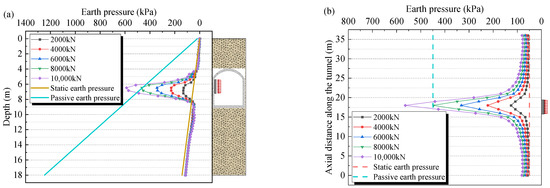
Figure 6.
Variation of earth pressure: (a) Section V1; (b) Section H1.
Figure 7 and Figure 8 show the displacement and earth pressure change curves of the reaction center, respectively. The displacement of the reaction center increases with the increase in the load, and the growth rate increases gradually. When the jacking reaction approaches 8000 kN, the soil at the reaction center has reached the passive limit state, at which point the jacking reaction continues to increase and the horizontal displacement increases sharply. The earth pressure at the reaction center increases as the load increases, with the slope of the curve increasing slightly at first and then decreasing significantly. The inflection point of the curve occurs after the earth pressure reaches the passive earth pressure. The rate of the increase in the earth pressure first becomes slightly faster because the lateral pressure coefficient increases as the soil is compacted, and then slows down significantly because the soil enters a state of passive limit failure after the earth pressure at the reaction center reaches the passive earth pressure. When the jacking reaction is 8000 kN, the earth pressure at this point reaches a passive state, but with the increase in the load, the earth pressure can continue to increase, which means that only one point reaches a passive state at this time. The entire soil behind the back wall has not yet been damaged; only when the load continues to increase can the entire soil reach a passive state.
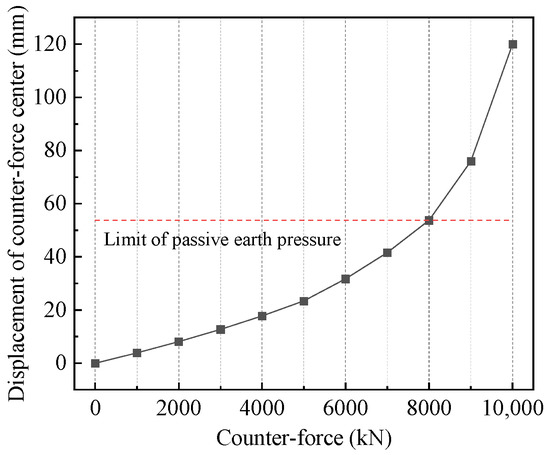
Figure 7.
Variation of horizontal earth displacement at reaction center.
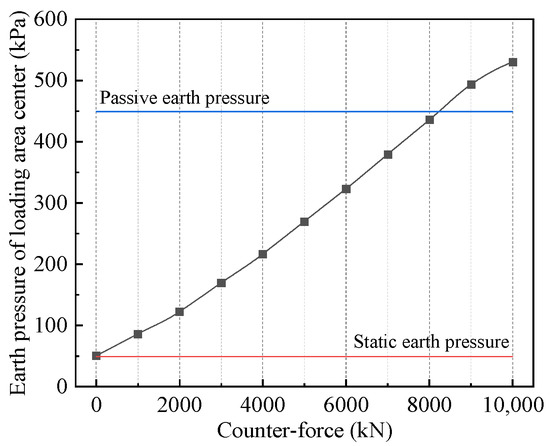
Figure 8.
Variation of horizontal earth pressure at reaction center.
4.2. Loading Position
Under the action of the jacking reaction, the force and deformation of the back wall show obvious local changes, and the center of the load action is the most significant place affected by the local effect. Therefore, three sets of numerical models are established in this section to study the influence of the loading position on the back wall. The jacking reaction is set at 1000 kN, and the loading area is 2 m × 2 m. The action position is shown in Figure 9.

Figure 9.
Schematic diagram of loading position: (a) Loading at top wall; (b) Loading at middle wall; (c) Loading at bottom wall.
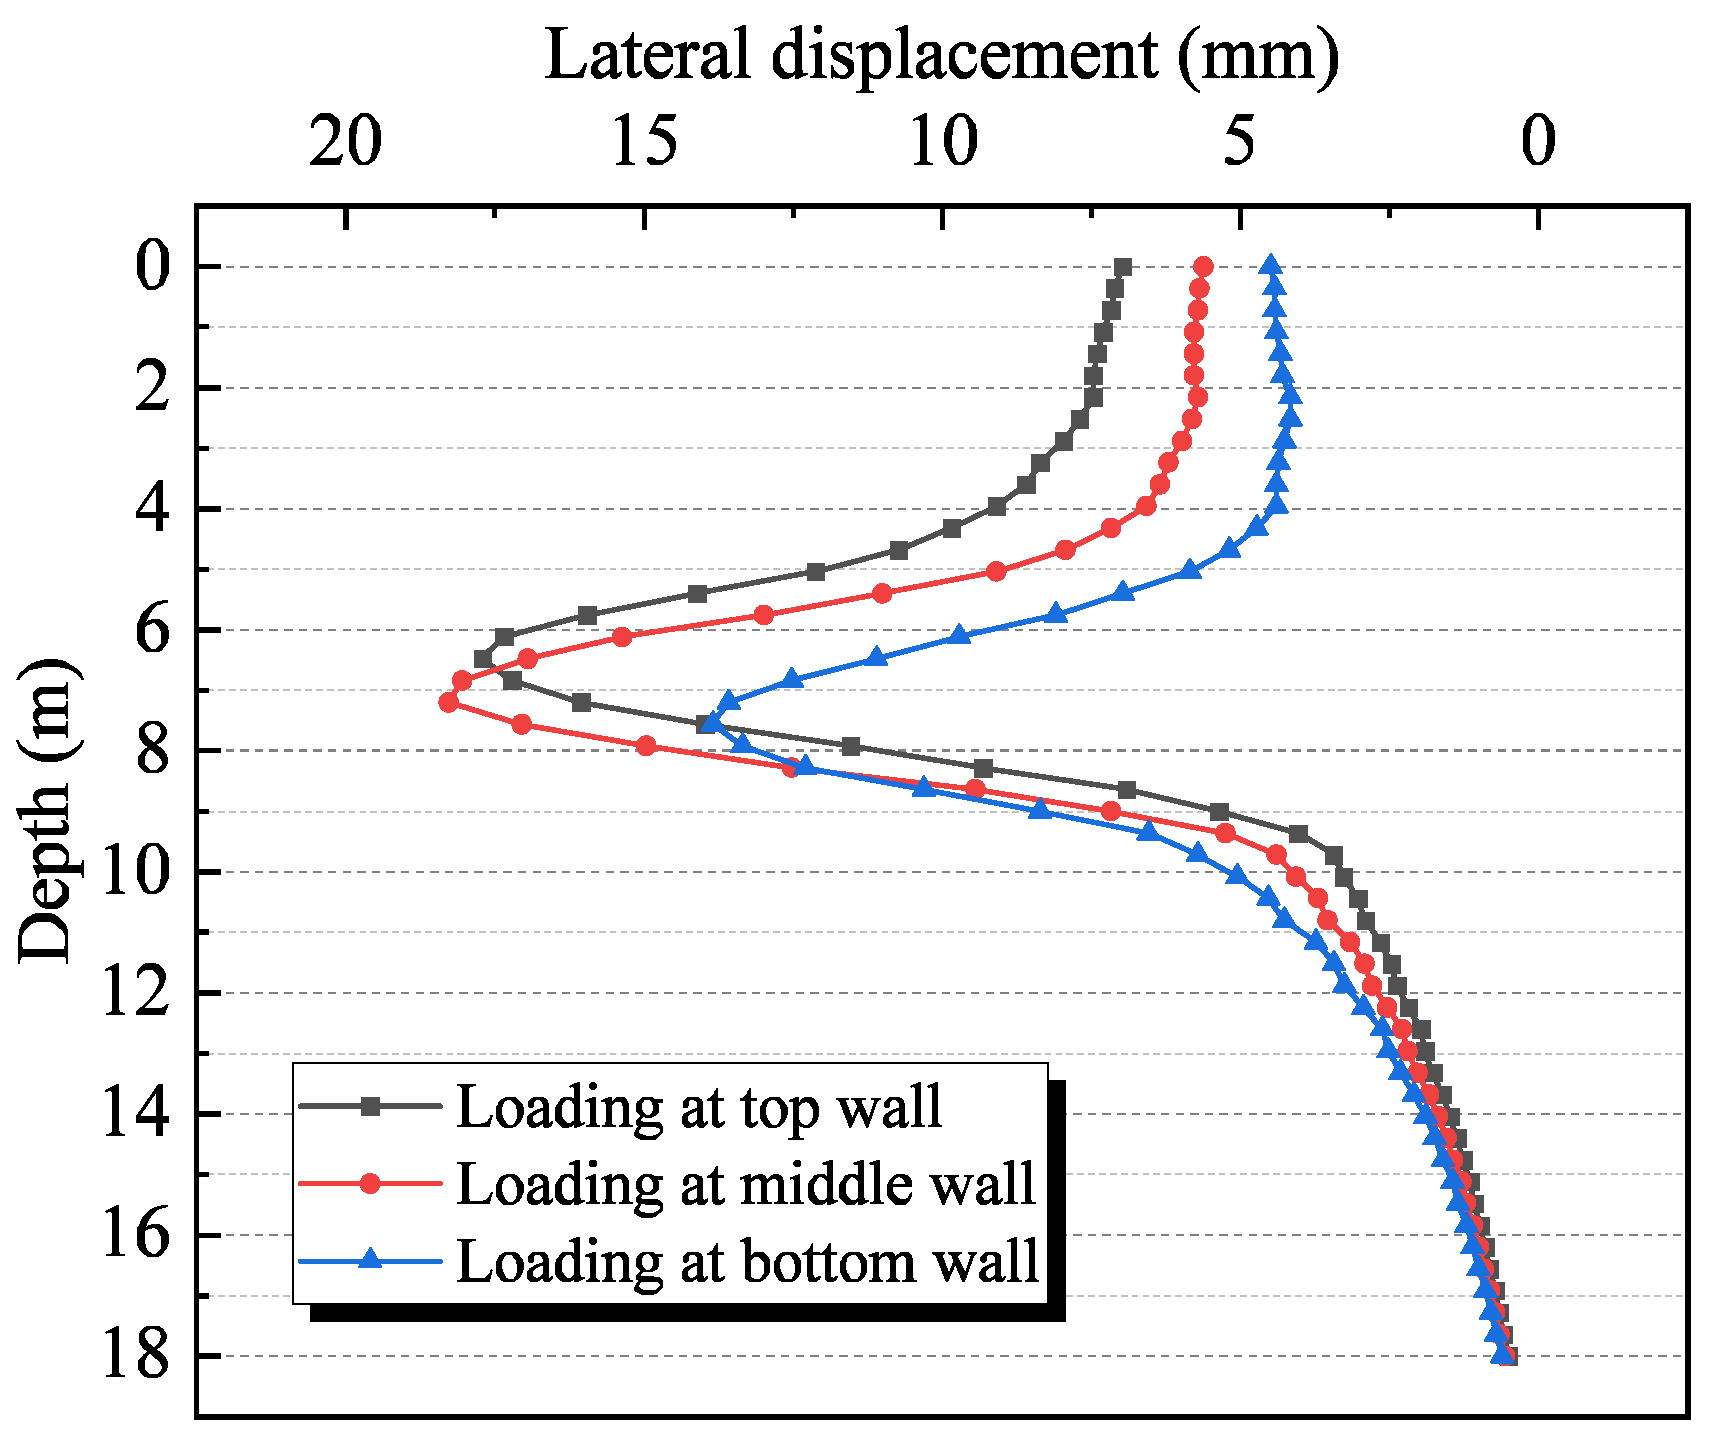
Figure 10 shows the horizontal displacement change curves of section V1 under different loading positions. When the load acts at different positions, the displacement curve pattern of the back wall is basically the same, i.e., the displacement of the center of the load action is the largest and gradually decreases to both sides. However, the maximum horizontal displacement and the disturbance to the surrounding soil have obvious changes with the change in the loading position. In terms of the maximum horizontal displacement, the load acts on the top wall with a maximum horizontal displacement of 17.71 mm, on the middle wall with a maximum horizontal displacement of 18.27 mm, and on the bottom wall with a maximum horizontal displacement of 13.84 mm. It can be seen that the maximum horizontal displacement is greatest when the load is applied to the middle wall, followed by the top wall, and then, the bottom wall. In particular, when the loading position is changed from the middle to the bottom, the maximum horizontal displacement is reduced by approximately 24.25%. This is because, when the load acts on the top wall, the earth pressure at the center of the load action is minimal and, therefore, the back wall deformation is not significant. When the load acts on the middle wall, if the back wall is simplified to a simply supported beam along the vertical direction, the load acting in the middle produces the largest bending moment and the largest disturbance, so the maximum horizontal displacement is the largest. When the load acts on the bottom wall, the earth pressure at the center of the load action is higher and the deformation constraint on the structure is large, so the maximum horizontal displacement is minimal. As for the disturbance of the jacking reaction on the soil around the pilot tunnel, the upper soil (depth 0–4 m) and the lower soil (depth 9.2–18 m) showed different influence laws when the load acted on different positions. For the upper soil, the disturbance is the largest when the load is applied to the top wall, followed by the middle wall, and then, the bottom wall. For the lower soil, the law is just the opposite, i.e., the bottom wall is the largest, the middle wall is the second, and the top wall is the smallest.
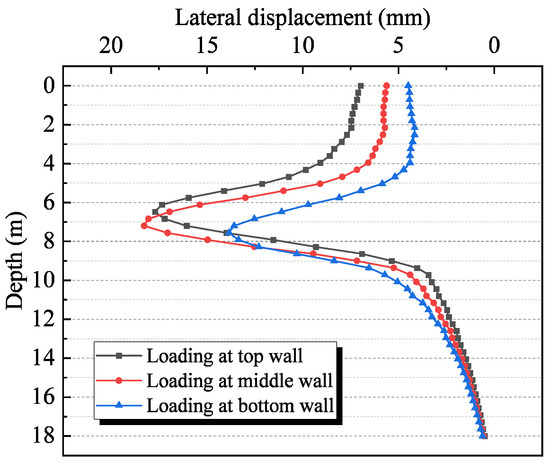
Figure 10.
Horizontal displacement at section V1.
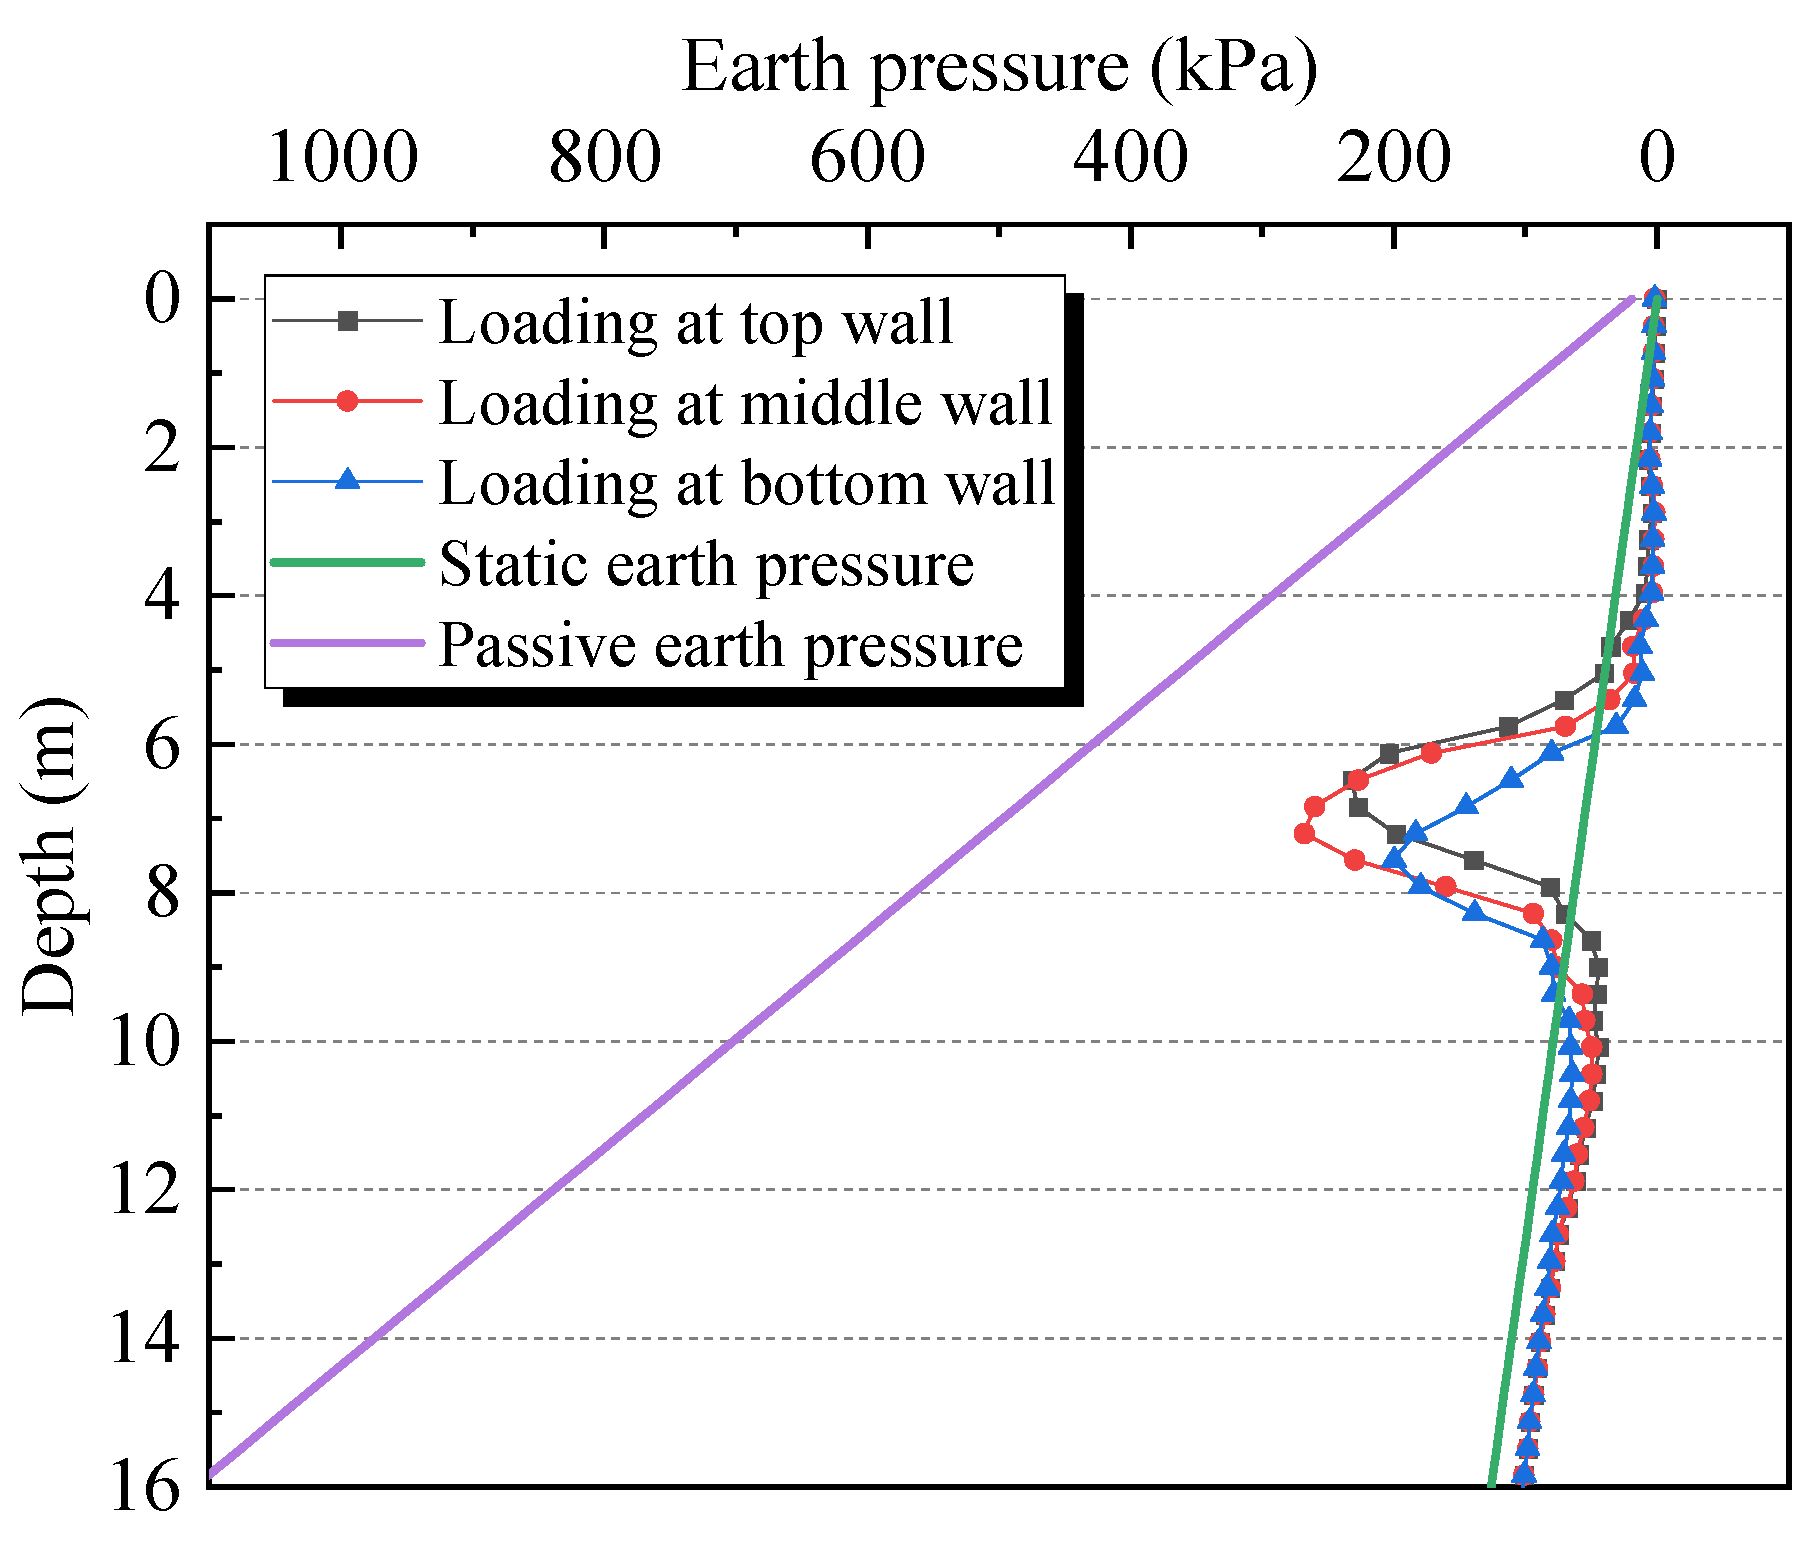
Figure 11 shows the variation curve of the earth pressure in section V1. When the load is applied at different positions, the earth pressure curve at the back wall has essentially the same pattern, i.e., the earth pressure is greatest at the center of the load action and decreases gradually to the sides. However, the maximum earth pressure varies significantly with the position of the load action. In terms of the maximum earth pressure, the load acts on the top wall with a maximum earth pressure of 232 kPa, on the middle wall with a maximum earth pressure of 268 kPa, and on the bottom wall with a maximum earth pressure of 183.5 kPa. It can be seen that the maximum earth pressure is greatest when the load is applied in the middle wall, followed by the top wall and then, the bottom wall. In particular, the maximum earth pressure decreases by approximately 31.53% when the position of the load changes from the middle to the bottom part. It is worth noting that the variation law of the earth pressure is closely related to the variation pattern of the horizontal displacement of the back wall. This is because, under the current load, the back wall is between the static state and the passive state, where the greater the soil displacement, the greater the corresponding earth pressure, which will provide useful hints for subsequent calculations of the soil reaction.
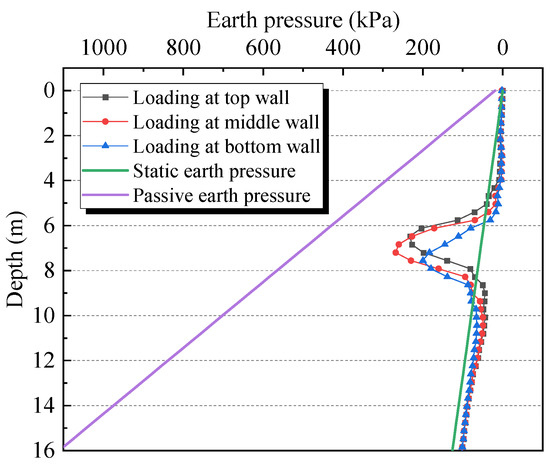
Figure 11.
Variation of earth pressure at section V1 under different loading positions.
4.3. Loading Area
In order to investigate the influence law of the loading area on the soil mass, the loading area was set as 1 × 1 m, 2 × 2 m, and 3 × 3 in this section. The jacking reaction is set at 4000 kN. The reaction center position is the same under the three working conditions, and the loading area is shown in Figure 12.

Figure 12.
Schematic diagram of load range: (a) Loading area (1 m × 1 m); (b) Loading area (2 m × 2 m); (c) Loading area (3 m × 3 m).
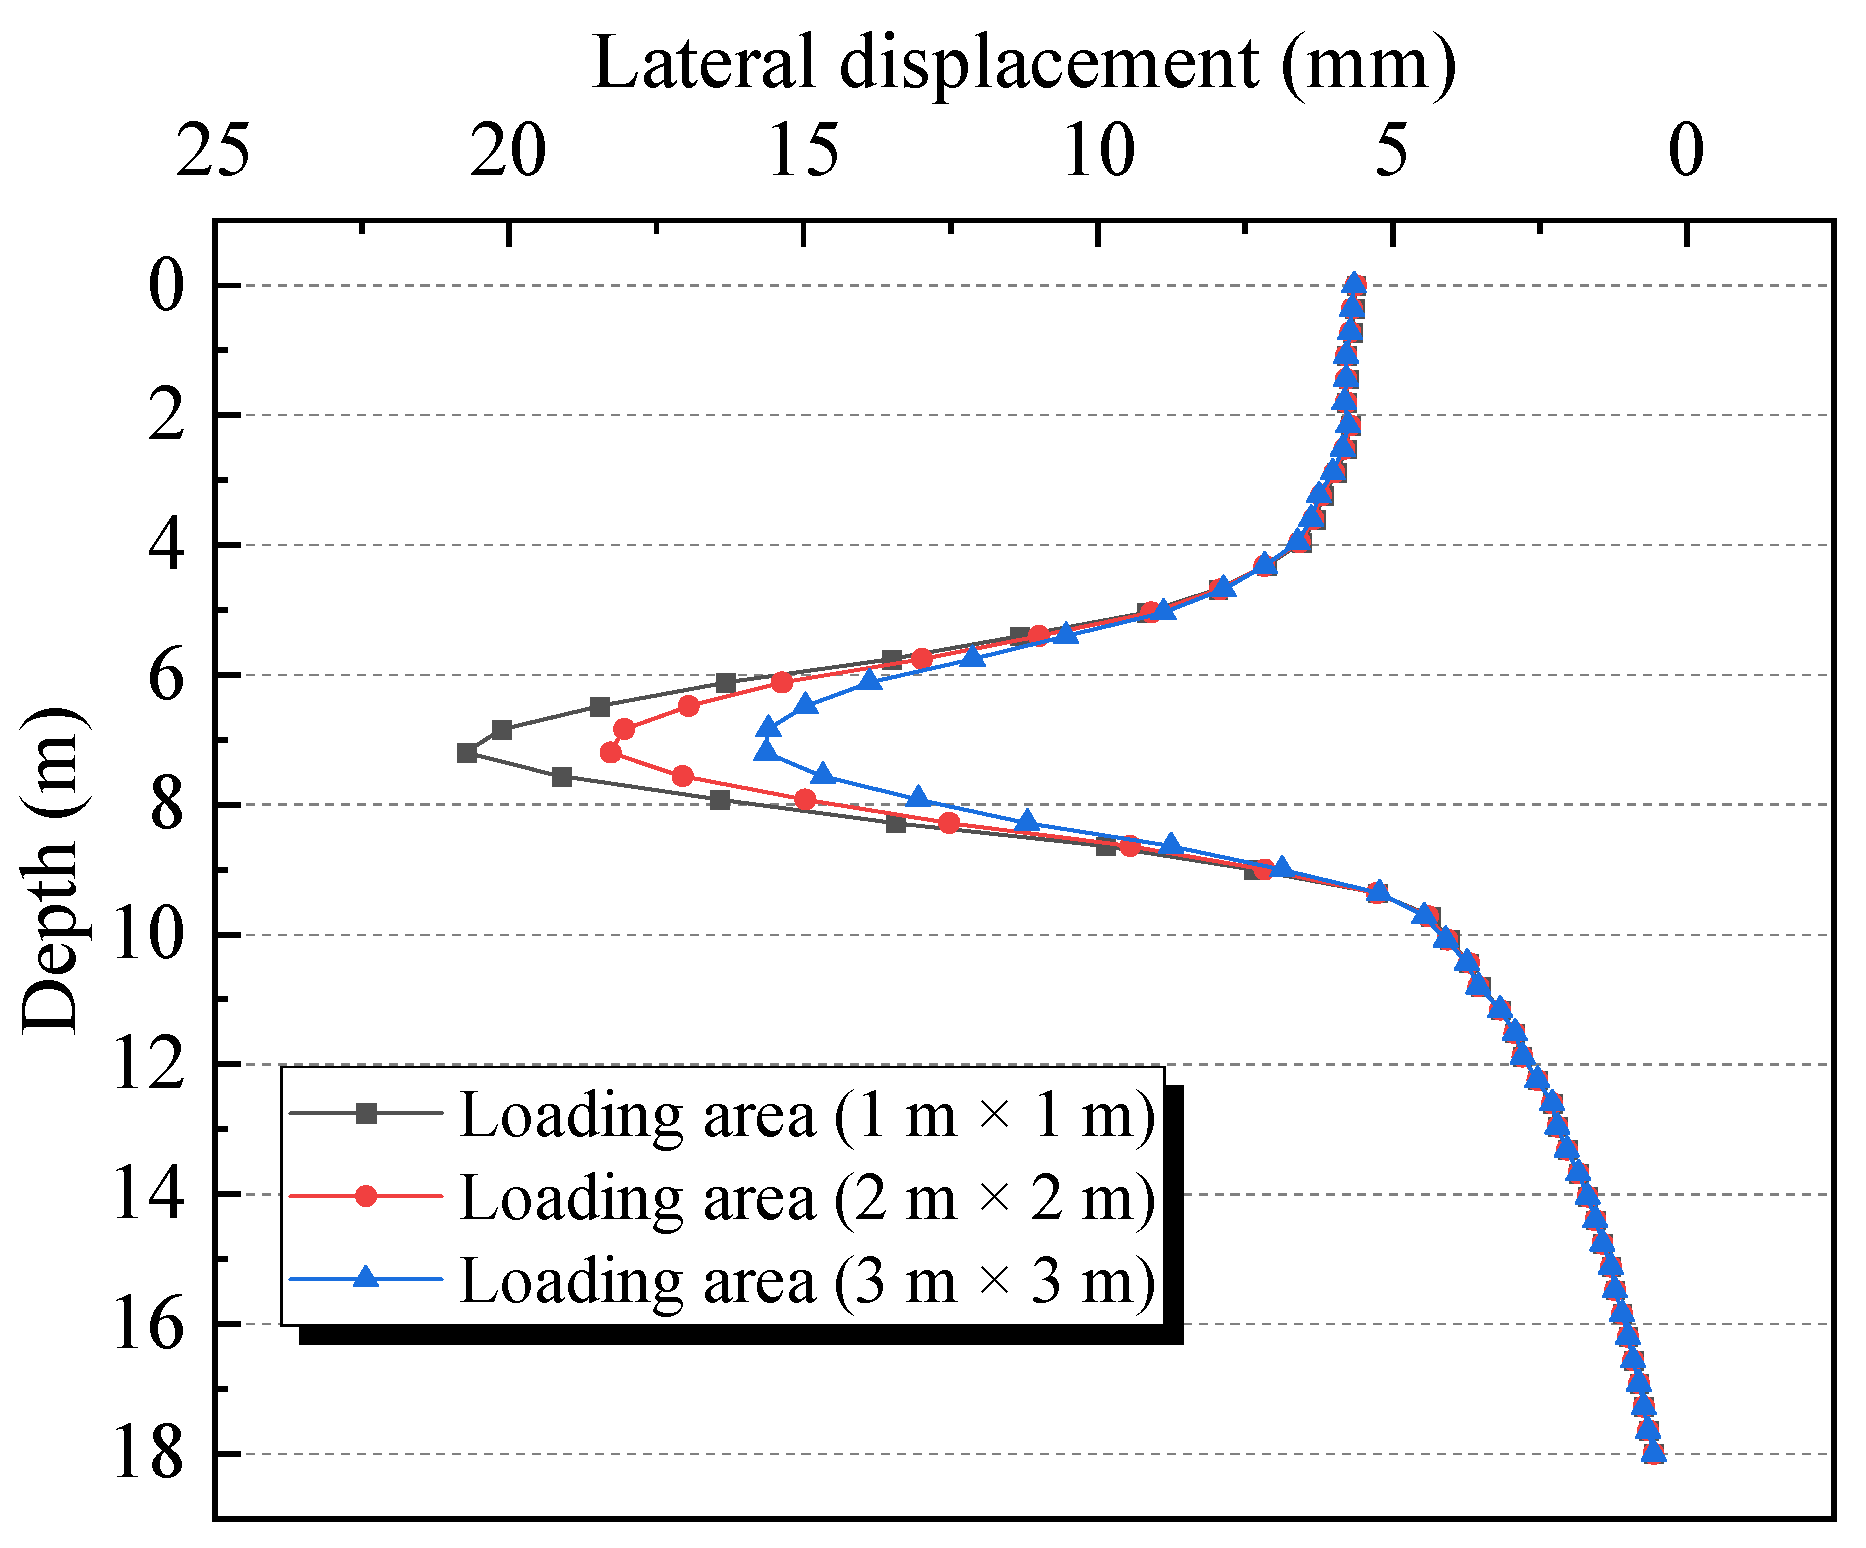
Figure 13 shows the horizontal displacement change curve of section V1 under different loading areas. When the loading area is different, the displacement curve of the back wall is basically the same. When the loading area changes, the horizontal displacement of the straight wall of the back wall changes obviously, but the horizontal displacement above the top and below the bottom of the straight wall basically remains unchanged. It shows that, under the condition that the jacking reaction is applied to the middle of the back wall and the jacking reaction remains unchanged, the influence of the change in the loading range on the horizontal displacement of the back wall is mainly reflected in the range of the straight wall. In terms of the maximum horizontal displacement, the maximum horizontal displacement is 20.72 mm for a loading area of 1 × 1 , 18.27 mm for a loading area of 2 × 2 , and 15.63 mm for a loading area of 3 × 3 . It can be seen that, as the loading area increases, the maximum horizontal displacement of the back wall decreases, in the order of 11.8% and 14.45% relative to the previous level.
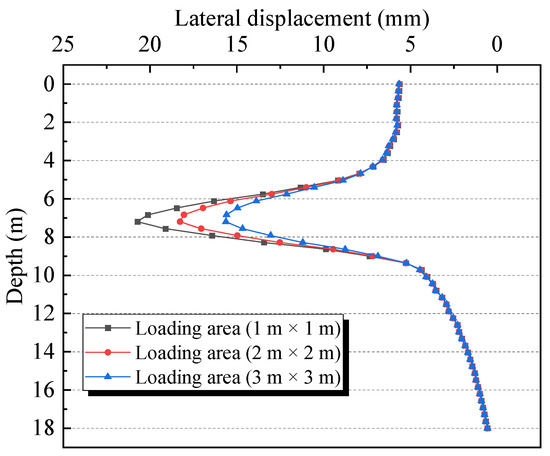
Figure 13.
Lateral displacement at section V1.
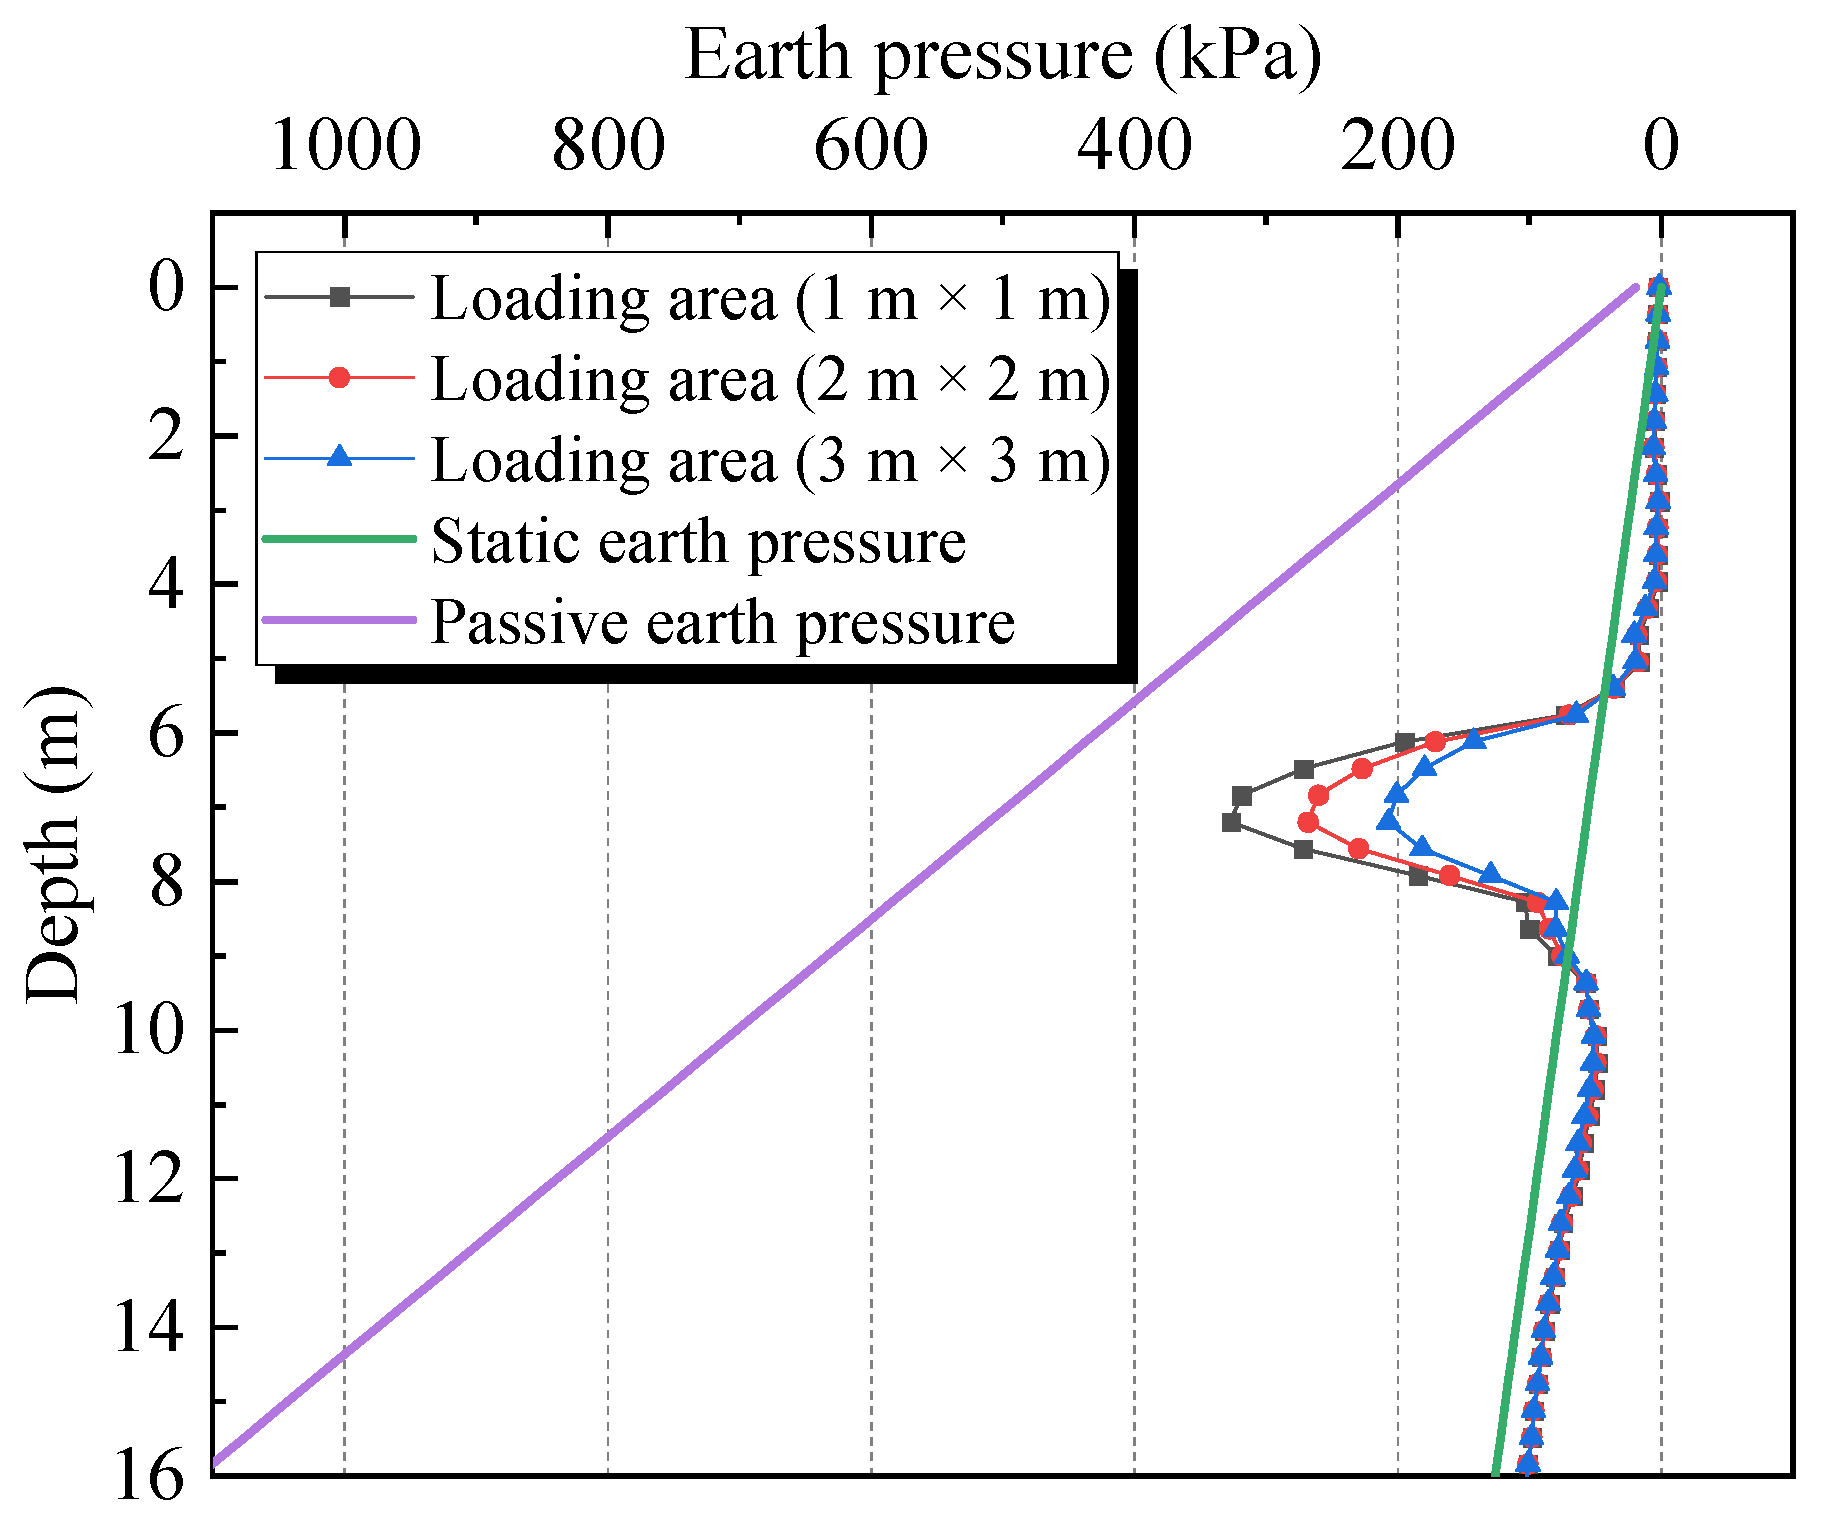
Figure 14 shows the variation curves of the earth pressure at section V1 under different loading areas. When the loading area changes, the variation law of the earth pressure is basically the same as that of the horizontal displacement mentioned above. That is, the earth pressure of the straight wall of the back wall changes obviously, but the earth pressure above the top and below the bottom of the straight wall basically remains unchanged. It shows that, under the condition that the jacking reaction is applied to the middle of the back wall and the jacking reaction remains unchanged, the influence of the change in the loading range on the earth pressure of the back wall is mainly reflected in the range of the straight wall. In terms of the maximum earth pressure, the maximum earth pressure is 326.5 kPa for a loading area of 1 × 1 , 268 kPa for a loading area of 2 × 2 , and 207 kPa for a loading area of 3 × 3 . It can be seen that, as the loading area increases, the earth pressure of the back wall decreases, in the order of 17.92% and 22.76% relative to the previous level.
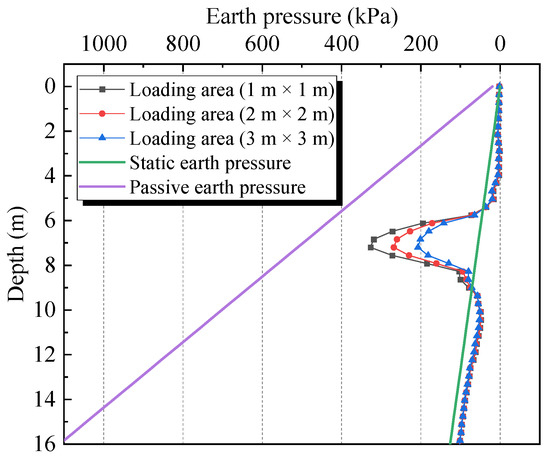
Figure 14.
Variation of earth pressure at section V1 under different loading areas.
5. Calculation of Soil Reaction on the Back Wall
5.1. Relationship between Earth Pressure and Displacement in Limit State
According to the above analysis, the main reason for the failure of the pilot tunnel is that the earth pressure of the reaction center exceeds the passive earth pressure. Therefore, the limit state of the failure of the pilot tunnel is that the earth pressure of the reaction center reaches the passive earth pressure. The loading position and loading area have some influence on the magnitude and distribution of the earth pressure on the back wall, but the distribution pattern is generally similar. This paper takes the jacking reaction applied to the middle wall and the loading area is 2 m × 2 m as an example to carry out the analysis and research. Under the action of the jacking reaction, the back wall will be displaced, causing the whole soil to expand and stretch or be compressed in the horizontal direction, which will relax or increase the stress of the soil in the horizontal direction. This section analyzes the earth pressure and displacement of the back wall in the limit state and investigates the relationship between them to provide a basis for calculating the soil reaction later on.
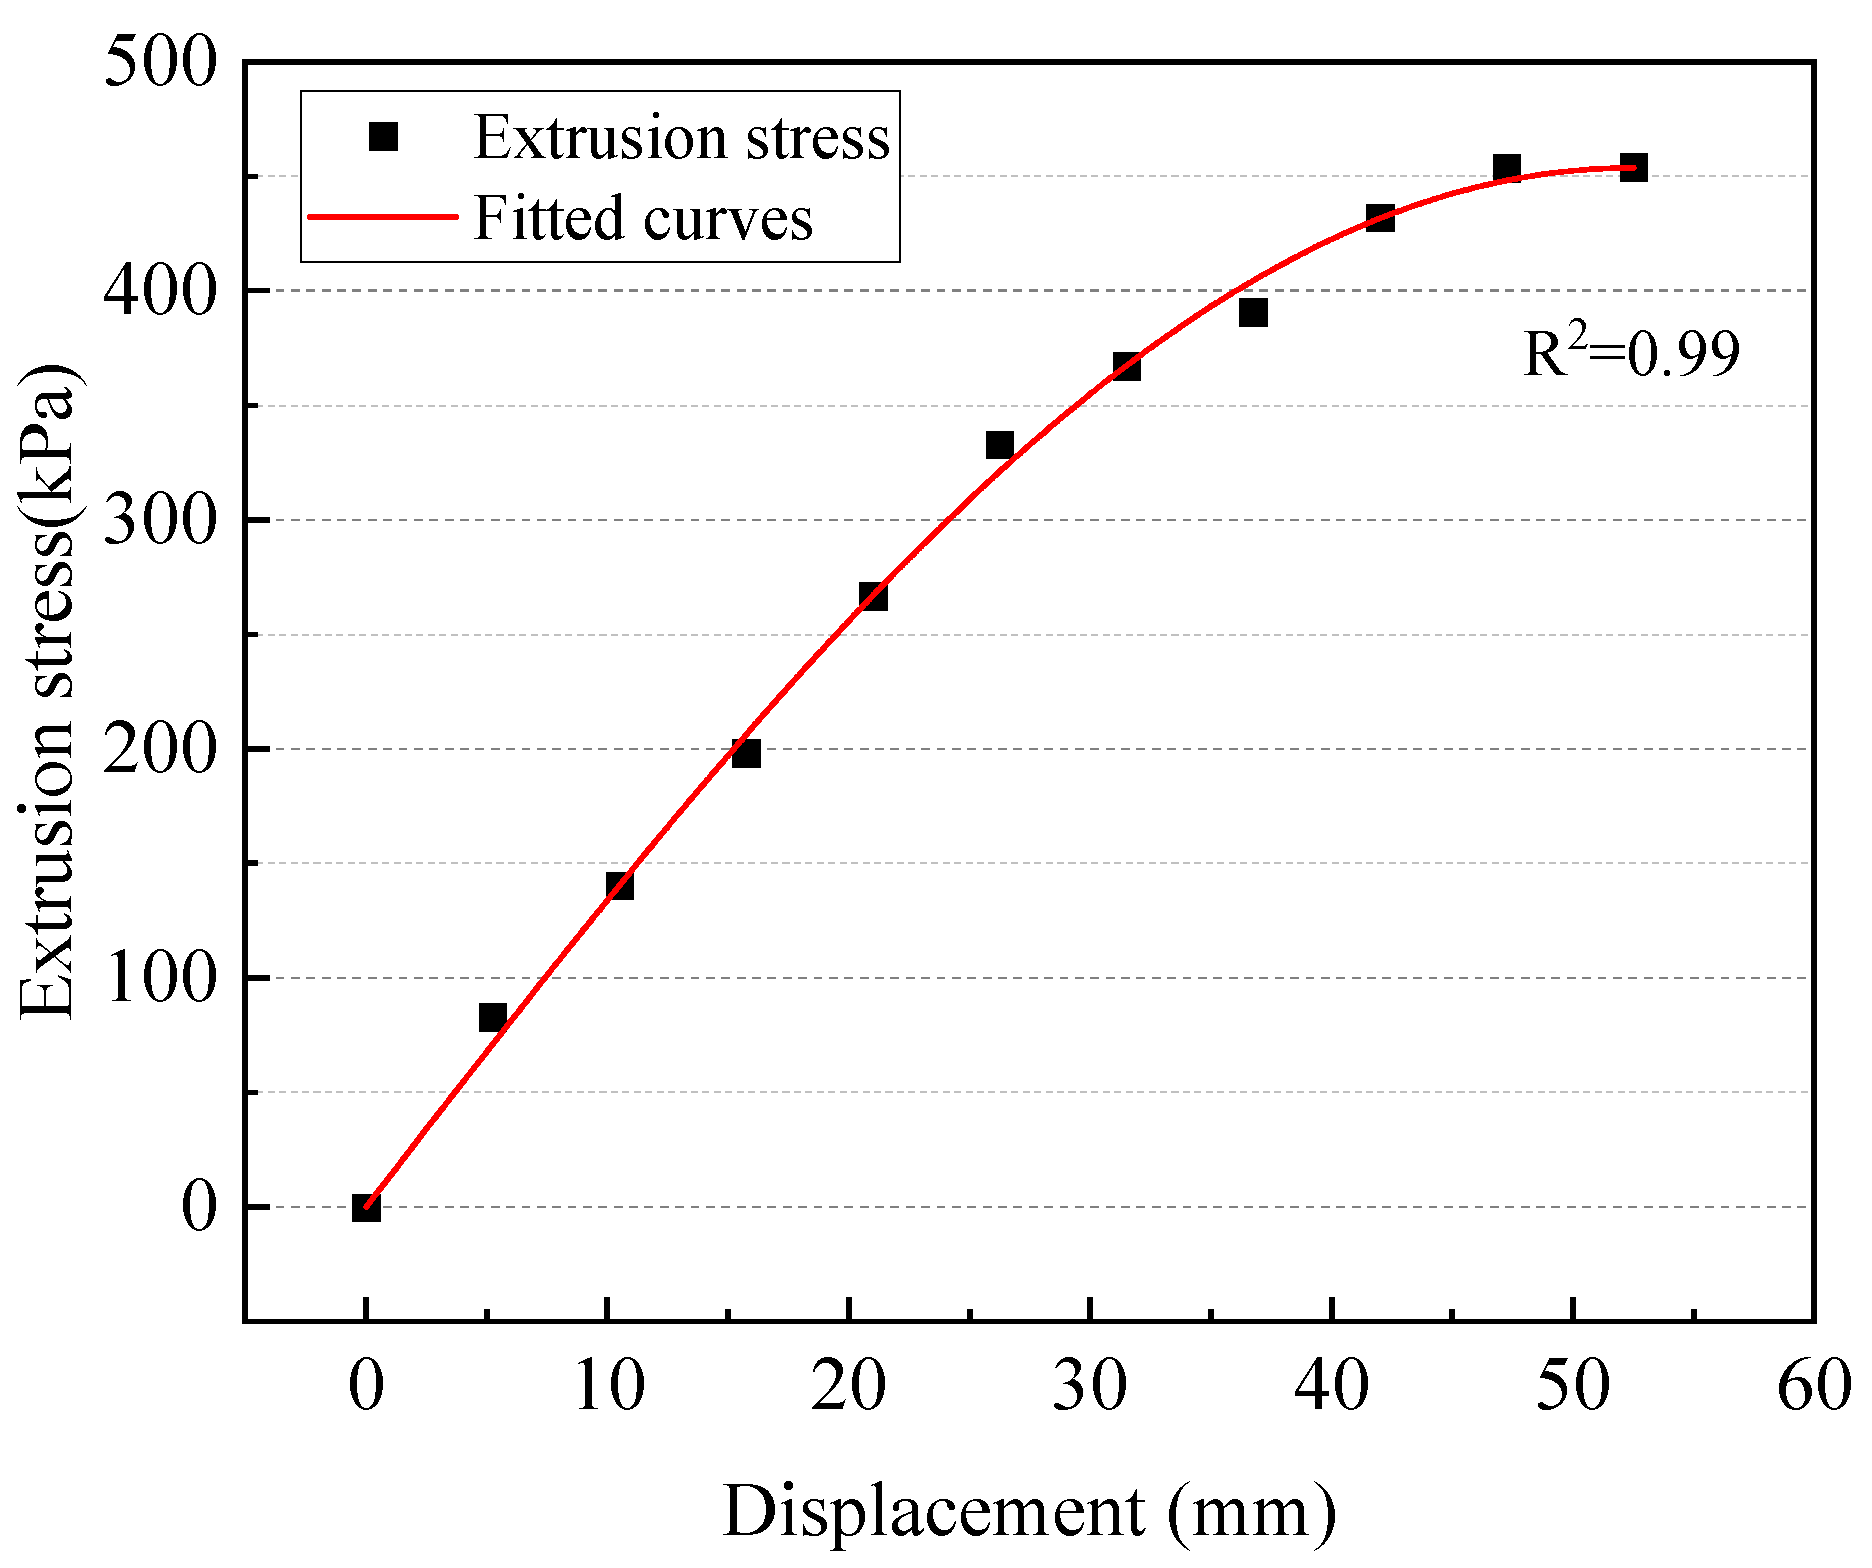
Xu et al. [24] defined the increase in soil horizontal stress caused by soil displacement as extrusion stress and used the sine function to simulate the relationship between extrusion stress and displacement. The extrusion stress versus displacement of the reaction center under the working conditions of this paper is plotted according to the method proposed by Xu, as shown in Figure 15. The sine function was used to fit the data and the fitting effect was good, so the sine function was used to represent the relationship between the extrusion stress and displacement in the subsequent analysis of this paper.
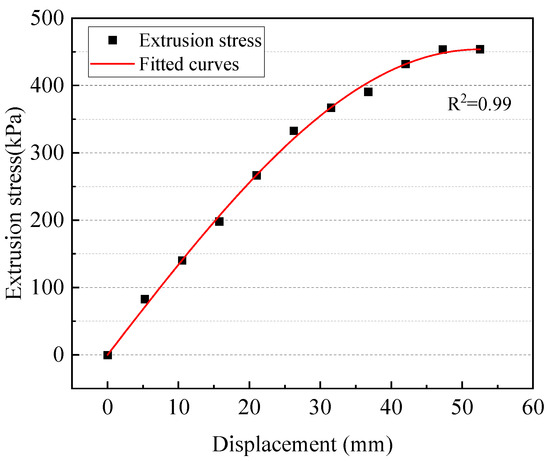
Figure 15.
Relationship curve of extrusion stress and displacement.
The passive earth pressure formula is shown in Equation (1), where ep, e0, and es represent the passive earth pressure, static earth pressure, and compressive stress (kPa), respectively.
When the soil is in the passive limit state, the maximum extrusion stress is shown in Equation (2), where epcr represents the passive ultimate earth pressure (kPa).
To consider the relationship between the displacement and extrusion stress, kpw is introduced as a function of the displacement, as shown in Equation (3).
A sine function is used to describe the relationship between the extrusion stress and displacement, see Equation (4), where Wpcr and W represent the ultimate displacement of the passive soil and soil displacement (mm), respectively.
Equations (2)–(4) are substituted into Equation (1) to obtain the calculation formula of the passive earth pressure considering the displacement, as shown in Equation (5).
5.2. Calculation of Soil Reaction
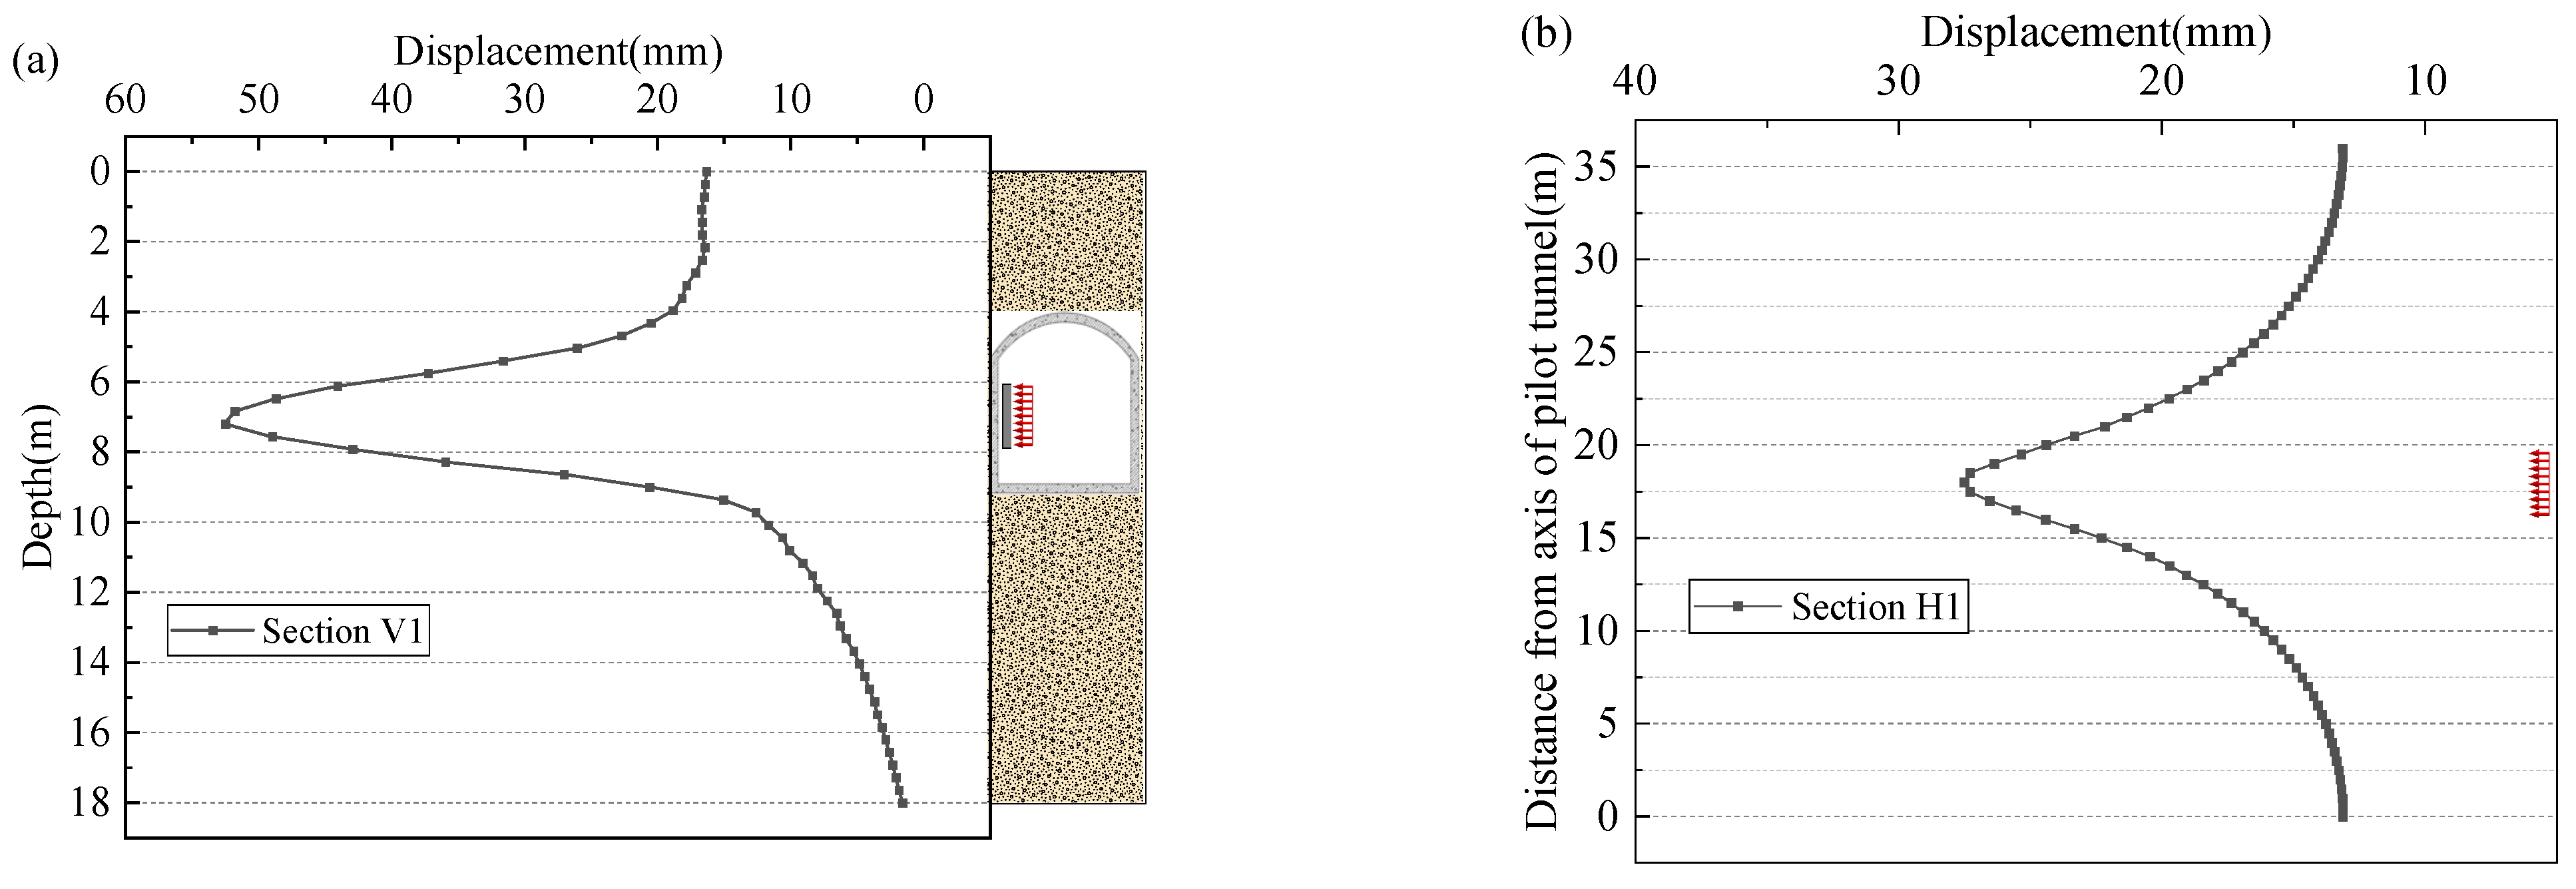
Under the action of the jacking reaction, the earth pressure of the back wall shows a spatially curved form. If the function relation of the earth pressure surface of the back wall is found and integrated, the soil reaction of the back wall can be obtained. Therefore, as long as the displacement function is found and substituted into Equation (5), the calculation formula of the soil reaction can be obtained. Figure 16 shows the horizontal displacement curves of section V1 and section H1 in the limit state. Corresponding to the earth pressure variation law of the back wall, the horizontal displacement also shows the spatial characteristics of the prominent local displacement. The displacement curve is smoother than the earth pressure curve due to the stiffness of the back wall. The main influence area of the jacking reaction in the vertical direction is the whole back wall, including the straight wall and the arch. It is about five times the load width in the horizontal direction. In the main influence area, the distribution pattern of the displacement curve in the horizontal and vertical directions is similar to the normal distribution curve.
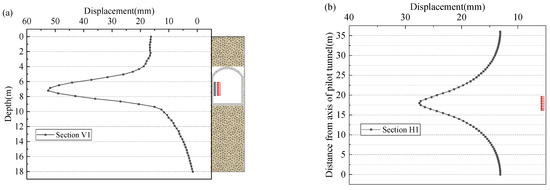
Figure 16.
Variation of displacement: (a) Section V1; (b) Section H1.
Based on the previous conclusions, the equation for calculating the soil displacement at the reaction center in the vertical direction is given in Equation (6), where z represents the soil depth (m) and downward is positive, Wz represents the soil displacement at the depth z (m), Wmax represents the horizontal displacement at the depth h (m) when the soil reaches the passive limit state, m indicates the distance of the inflection point of the horizontal displacement curve in the vertical direction from the peak of the horizontal displacement of the soil, which can be taken as 1.5 to 1.8 times the burial depth of the pilot tunnel, λ1 represents the displacement influence coefficient, and the value is 0.3 in this paper.
The equation for calculating the soil displacement at the reaction center in the horizontal direction is given in Equation (7), where y (m) is the horizontal distance from the reaction center, Wy indicates the soil displacement at a horizontal distance of y (m) from the reaction center, n (m) represents the distance between the inflection point of the soil displacement curve in the horizontal direction and the peak of the soil horizontal displacement, which can be 1.0~1.2 times the width of the loading area, λ2 represents the displacement influence coefficient, and the value is 0.3 in this paper.
By substituting Equations (6) and (7) into Equation (5), the calculation formula of the vertical and horizontal soil reaction can be obtained, as shown in Equations (8) and (9), where σz (kPa) represents the soil reaction value at the depth z (m), σy indicates the soil reaction at a horizontal distance of y (m) from the reaction center, σz0 (kPa) represents the static earth pressure at the depth z (m), σz(pcr) (kPa) represents the passive earth pressure at the depth z (m), σ0 (kPa) represents the static earth pressure at the depth h (m), and σpcr (kPa) represents the passive earth pressure at the depth h (m).
The total soil reaction of the back wall in the pilot tunnel can be obtained by the double integration of Equations (8) and (9), as shown in Equation (10), where H is the distance of the bottom of the pilot tunnel from the surface, h1 is the distance of the top of the pilot tunnel from the surface, and L is the longitudinal length of the pilot tunnel.
5.3. Compared with FEA Results
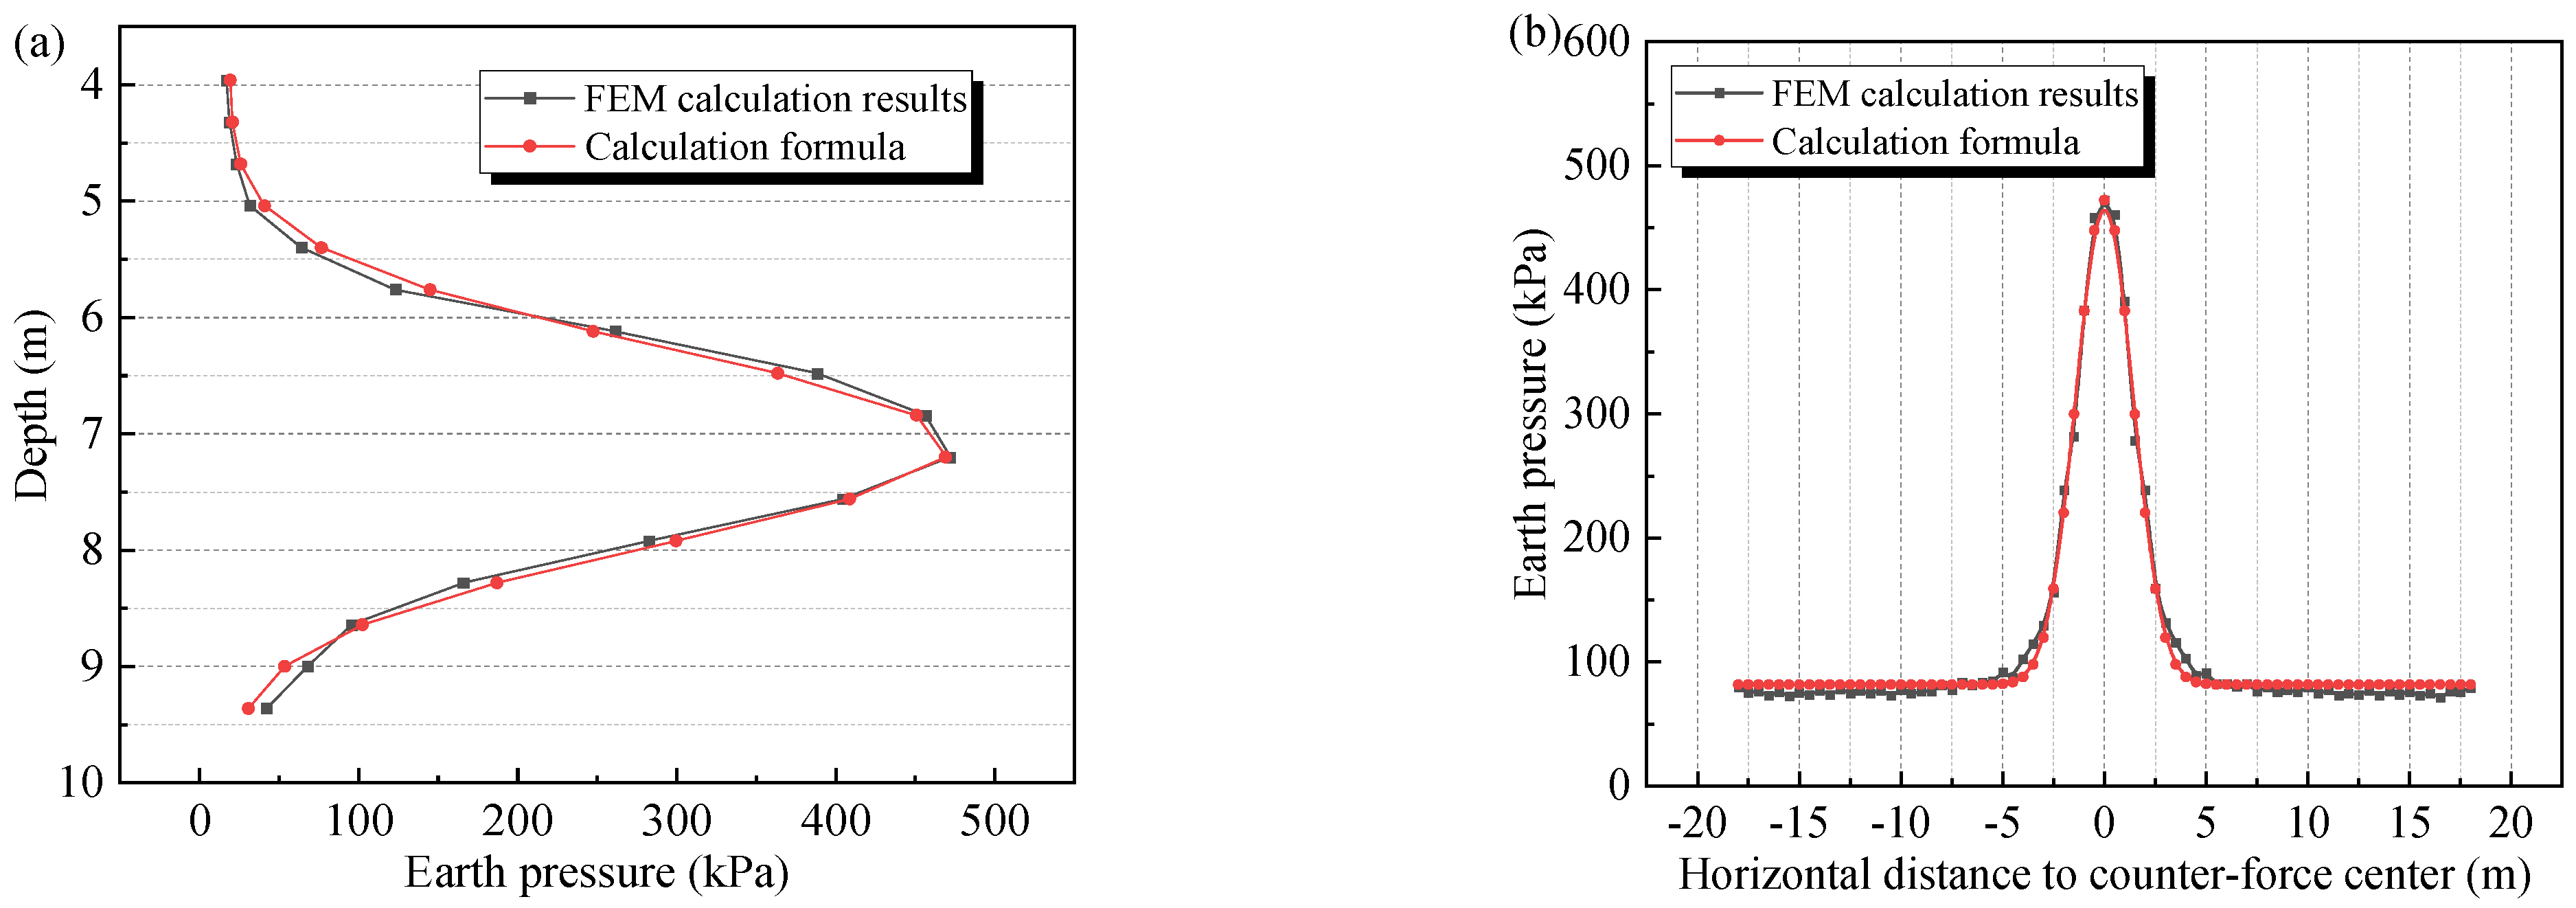
In order to verify the accuracy of the calculation formula of the soil reaction, a comparative analysis is made with the FEA results. Figure 17 shows the distribution curve of the earth pressure on the reaction center line in the horizontal and vertical direction of the back wall. Table 2 shows the maximum difference between the theoretical and simulated values of the earth pressure. It can be seen that the calculated results using the formula in this paper have a good agreement with the FEA results. The formula proposed in this paper only needs to give the displacement value and can be used to calculate the corresponding earth pressure with the help of the relationship between the displacement and earth pressure. It can not only be used to calculate the earth pressure in the ultimate state, but also can be used to calculate the earth pressure in various non-ultimate states, such as some conditions where the displacement control is strict, and the back wall of the pilot tunnel is not allowed to reach the ultimate state.
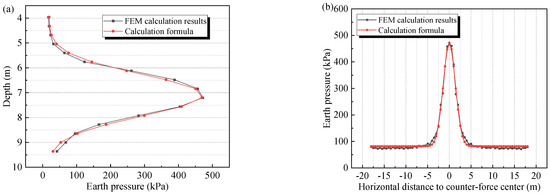
Figure 17.
Comparison of formula results and finite element results: (a) vertical direction; (b) horizontal direction.

Table 2.
The maximum difference between the theoretical and simulated values of earth pressure.
6. Conclusions
In this paper, based on a metro station in Shenyang, the earth pressure distribution and displacement change in the back wall of the pilot tunnel under the action of the jacking reaction are studied by numerical simulation, and the calculation method of the soil reaction on the back wall is proposed. The conclusion is as follows.
- (1)
- Under the action of the jacking reaction, the earth pressure at section V1 shows a large distribution in the middle part and small distribution in other parts, with a distribution pattern between “U” and “V” shapes, similar to the normal distribution curve.
- (2)
- With the increase in the load, the horizontal displacement and earth pressure of the back wall increases, and the rate of the horizontal displacement increases with the increase in the load. The maximum horizontal displacement of the back wall is greatest when the load is applied to the middle wall, followed by the top wall and then, the bottom wall. In particular, when the loading position is changed from the middle to the bottom, the maximum horizontal displacement is reduced by approximately 24.25%.
- (3)
- As the loading area increases, the maximum horizontal displacement of the back wall decreases, in the order of 11.8% and 14.45% relative to the previous level. The earth pressure of the back wall also decreases, in the order of 17.92% and 22.76% relative to the previous level.
- (4)
- Based on the function relation between the earth pressure and horizontal displacement, a calculation method of the soil reaction considering the displacement is presented. The accuracy of the formula is verified by comparing it with the FEA results.
Author Contributions
Conceptualization, Q.B.; Data curation, H.M.; Funding acquisition, W.Z.; Investigation, X.W.; Methodology, Q.B. and W.Z.; Software, H.M.; Writing—original draft, Q.B.; Writing—review and editing, W.Z., X.W. and Z.Z. All authors have read and agreed to the published version of the manuscript.
Funding
The research described in this paper was supported by the National Natural Science Foundation of China (51878127).
Institutional Review Board Statement
Not applicable.
Informed Consent Statement
Not applicable.
Data Availability Statement
Not applicable.
Conflicts of Interest
The authors declare no conflict of interest.
References
- Jia, P.J.; Nie, Y.T.; Shi, P.X.; Jiang, X.; Lu, B.; Zhao, W. Flexural performance of a novel pipe-roof structure and optimization of key parameters. J. Constr. Steel Res. 2022, 199, 107594. [Google Scholar] [CrossRef]
- Lu, B.; Dong, J.C.; Zhao, W.; Du, X.; Cheng, C.; Bai, Q.; Wang, Z.G.; Zhao, M.C.; Han, J.Y. Novel pipe-roof method for a super shallow buried and large-span metro underground station. Undergr. Space 2022, 7, 134–150. [Google Scholar] [CrossRef]
- Bai, Q.; Zhao, W.; Cao, W.X.; Jia, P.J.; Cheng, C.; Lu, B. Test and numerical simulation of excavation of subway stations using the small pipe-roof-beam method. Int. J. Geomech. 2022. [Google Scholar] [CrossRef]
- Yang, X.; Li, Y.S. Research of surface settlement for a single arch long-span subway station using the Pipe-roof Pre-construction Method. Tunn. Undergr. Space Technol. 2018, 72, 210–217. [Google Scholar] [CrossRef]
- Jia, P.J.; Zhao, W.; Chen, Y.; Li, S.G.; Han, J.Y.; Dong, J.C. A case study on the application of the steel tube slab structure in construction of a subway station. Appl. Sci. 2018, 8, 1437. [Google Scholar] [CrossRef]
- Jia, P.J.; Zhao, W.; Du, X.; Chen, Y.; Zhang, C.Z.; Bai, Q.; Wang, Z.G. Study on ground settlement and structural deformation for large span subway station using a new pre-supporting system. R. Soc. Open Sci. 2019, 6, 181035. [Google Scholar] [CrossRef]
- Jia, P.J.; Zhao, W.; Guan, Y.P.; Dong, J.C.; Wang, Q.H.; Cheng, C. Experimental study on the flexural behavior of steel tube slab composite beams and key parameters optimization. Adv. Struct. Eng. 2019, 22, 2476–2489. [Google Scholar] [CrossRef]
- Jia, P.J.; Zhao, W.; Khoshghalb, A.; Ni, P.P.; Jiang, B.F.; Chen, Y.; Li, S.G. A new model to predict ground surface settlement induced by jacked pipes with flanges. Tunn. Undergr. Space Technol. 2020, 98, 103330. [Google Scholar] [CrossRef]
- Wang, Z.G.; Zhao, W.; Wang, H.; Chen, Y.; Bai, Q.; Li, S.G. Analysis of the influence of geometrical parameters of circular steel pipe with flange plate on the jacking force. Undergr. Space 2022, 7, 324–336. [Google Scholar] [CrossRef]
- Li, Y.S.; Zhang, K.N.; Huang, C.B.; Li, Z.; Deng, M.L. Analysis of surface subsidence of tunnel built by pipe-roof pre-construction method. Rock Soil Mech. 2011, 32, 3701–3707. [Google Scholar]
- Zhang, Y.; Tao, L.J.; Dong, L.P.; Zhao, X.; Bian, J.; An, S.; Chen, X.H. Theoretical analysis and research on the tight row horizontal pipe curtain. Chin. J. Geotech. Eng. 2021, 43, 365–374. [Google Scholar]
- Sofianos, A.I.; Loukas, P.; Chantzakos, C. Pipe jacking a sewer under Athens. Tunn. Undergr. Space Technol. 2004, 19, 193–203. [Google Scholar] [CrossRef]
- Milligan, G.W.E.; Norris, P. Site-based research in pipe jacking-objectives, procedures and a case history. Tunn. Undergr. Space Technol. 1996, 11, 3–24. [Google Scholar] [CrossRef]
- Sun, Y.; Shen, S.L.; Xu, Z.L.; Xia, X.H. Prediction of lateral displacement of soil behind the reaction wall caused by pipe jacking operation. Tunn. Undergr. Space Technol. 2014, 40, 210–217. [Google Scholar] [CrossRef]
- Sun, Y.; Su, J.B.; Xia, X.H.; Xu, Z.L. Numerical analysis of soil deformation behind the reaction wall of an open caisson induced by horizontal parallel pipe-jacking construction. Can. Geotech. J. 2015, 52, 2008–2016. [Google Scholar] [CrossRef]
- Gong, C.; Wei, G.; Xu, R.Q. Permissible counterforce calculation in rectangular open caisson working well during pipe jacking. Rock Soil Mech. 2005, 7, 1127–1131. [Google Scholar]
- Yan, Z.G.; Zhu, H.H.; Li, X.Y.; Liu, X.Z.; Xu, Z.H. 3D-FEM analysis on stability of shaft with conduit jacked synchronously in two directions. Chin. J. Geotech. Eng. 2005, 8, 891–896. [Google Scholar]
- Chen, C.L.; Wei, G.; Chen, H.H. Study on calculating methods of earth counterforce in rectangular working shaft by SMW methods. Rock Soil Mech. 2007, 28, 769–773. [Google Scholar]
- Wei, G.; Xu, R.Q.; Song, J.L. Researches on earth counterforce calculation in circular working shaft by SMW methods. J. Zhejiang Univ. Eng. Sci. 2005, 39, 99–103. [Google Scholar]
- Zhao, C.X.; Li, Y.M.; Liu, G.; Meng, X.R. Mechanism analysis and control technology of surrounding rock failure in deep soft rock roadway. Eng. Fail. Anal. 2020, 115, 104611. [Google Scholar] [CrossRef]
- Huang, Z.K.; Zhang, D.M.; Pitilakis, K.; Tsinidis, G.; Huang, H.W.; Zhang, D.M.; Argyroudis, S. Resilience assessment of tunnels: Framework and application for tunnels in alluvial deposits exposed to seismic hazard. Soil Dyn. Earthq. Eng. 2022, 162, 107456. [Google Scholar] [CrossRef]
- Yang, S.Q.; Chen, M.; Jing, H.W.; Chen, K.F.; Meng, B. A case study on large deformation failure mechanism of deep soft rock roadway in Xin’An coal mine, China. Eng. Geol. 2017, 217, 89–101. [Google Scholar] [CrossRef]
- Guo, X.Y.; Wang, Z.Z.; Geng, P.; Chen, C.J.; Zhang, J. Ground surface settlement response to subway station construction activities using pile–beam–arch method. Tunn. Undergr. Space Technol. 2021, 108, 103729. [Google Scholar] [CrossRef]
- Xu, R.Q. Methods of earth pressure calculation for excavation. J. Zhejiang Univ. Eng. Sci. 2000, 4, 22–27. [Google Scholar]
Disclaimer/Publisher’s Note: The statements, opinions and data contained in all publications are solely those of the individual author(s) and contributor(s) and not of MDPI and/or the editor(s). MDPI and/or the editor(s) disclaim responsibility for any injury to people or property resulting from any ideas, methods, instructions or products referred to in the content. |
© 2023 by the authors. Licensee MDPI, Basel, Switzerland. This article is an open access article distributed under the terms and conditions of the Creative Commons Attribution (CC BY) license (https://creativecommons.org/licenses/by/4.0/).

