Abstract
The spillover effect of technological innovation has a huge role in promoting the development of the regional economy. In the process of economic development, financial agglomeration is becoming increasingly common. Based on the back-propagation neural network, this paper analyzed the spatial spillover effect of technological innovation driven by digital finance. This paper proposed the use of Matlab for the training analysis of back-propagation neural networks. Results show that the previous warning analysis results are reasonable. Conclusion analysis was then conducted. The mechanism and influence of digital finance in promoting regional technological innovation were analyzed in terms of supply and demand. The supply side mainly alleviated the problem of financing constraints, while the demand side mainly affected the consumption behavior of residents, and both sides jointly promoted regional technological innovation. Among the regional differences in the degree of financial agglomeration, the differences within and between groups were calculated and compared, and they comprehensively reflected the development status of financial agglomeration. The results show that the total number of patents in city D was less than that in city C in the past four years, but the annual growth rate was very fast, especially in 2020, reaching 40%. Therefore, the innovation environment of City D was continuously improving, and the innovation activities are becoming increasingly active. Moreover, data and financial innovation technology have a strong spatial spillover effect. This paper aimed to study the spatial spillover effect of digital-finance-driven technological innovation based on BP neural network, which contributes to the spatial spillover effect of digital-finance-driven technological innovation.
1. Introduction
Spatial spillover effect refers to the indirect or neighborhood effect, which is mainly used to analyze the indirect influencing mechanism of a region’s digital financial development on its technological innovation level in regions with similar economic strength. In the context of globalization, technology plays an important role in the process of economic development and is even a key factor in promoting regional economic growth. Therefore, when emphasizing economic development, relevant innovation factors need to be focused on. Technological innovation is inseparable from the support of finance. Enterprises need the support of financial funds to improve the efficiency of technological innovation. Therefore, the level of regional financial development has a direct relationship with the level of regional technological innovation. Therefore, the spatial spillover effect of studying the level of technological innovation driven by digital finance is very necessary. The increase in carbon dioxide would lead to global warming, rising sea levels, abnormal weather, and an increased degree of desertification. If the surface temperature rises, it will continue at the current rate. The global temperature is expected to increase by 2–4 °C in 2050. The Arctic and Arctic glaciers would melt in large quantities, resulting in a sharp rise in sea level. Coastal cities would be submerged in sea water. Agriculture and animal husbandry would also be affected. Agricultural production has increased unstably. The high temperature and drought in some areas are very serious disasters. Considering the increase in temperature, the growth cycle of crops is introduced, leading to frost damage in early spring. The yield and quality of grassland are decreasing. The loss of agriculture and animal husbandry caused by climate disasters has increased. The rise in sea level leads to the salinization of soil. If this condition is allowed to develop, it would cause irreparable damage to mankind. Therefore, greenhouse gas emissions in indoor air need to be reduced. Based on BP neural network, this paper analyzed the spatial spillover effect of digital-finance-driven technological innovation to make some contributions to digital financial technological innovation.
Spatial spillover effects directly affect the development of regionally related economies. Seif mainly aimed to evaluate the scope spillover effects of a selected nation’s industrial expansion. Accordingly, he estimated a spatial Durbin model in the framework of panel data on its dynamics. The spatial diagnostic test confirmed the existence of positive spatial autocorrelation in real per capita income. Results showed a positive spatial spillover effect on the country’s economic growth, and the spatial elasticity of GDP per capita was approximately 0.39%. According to the visualization, the country is consistently surrounded by countries with higher per capita income [1]. Meng proposed a spatial structural decomposition analysis based on alternative inputs and outputs to briefly describe the role of carbon emissions. Changes in production technology and investment preferences may occur throughout the supply chain. These findings can contribute to the understanding of CO2 [2]. Increased connectivity between regions affects productivity and economic growth in each region. Furthermore, the effects of connectivity on surrounding areas are often referred to as indirect effects (spillover effects). Karim used spatial models to estimate the effect of transport infrastructure on the economy of region A. According to the estimation results, the SAC hybrid model is the best spatial model, and the coefficients of the ρ (rho) and λ parameters are significant [3]. Hong combined the MRIO model, complex network approach, and spatial autocorrelation analysis to systematically analyze inter-regional spatial spillover effects. The inter-regional energy connections are spatially dependent, while urban-rural income ratios and population structure are statistically significant in country-level spatial econometric analyses [4]. Zheng aimed to accurately measure the spatial spillover effects of high-speed railway stations in China by using high-precision calibrated satellite images of night-time lighting. By using difference-in-difference methods, an average increase of 27% in the intensity of night-time light images was found for the areas surrounding the HSR stations. The study also documented some of the heterogeneity of these spillover effects across Chinese cities and provided an in-depth analysis of the possible influences on the behavior of the new HSR towns [5]. While these theories addressed spatial spillovers, they were not integrated with digital finance.
Financial innovation facilitates the growth of the e-commerce industry. Tang aimed to use WeChat as a case study to identify the factors that influence consumers’ willingness to adopt WeChat as a digital payment method. Results showed that, except for age, all identified factors remarkably affect consumers’ willingness to use digital payments [6]. In the digital age, established players in the financial services industry are increasingly forging alliances with start-ups to meet customer demand for rapid innovation and respond to growing market dynamics. However, technology-driven innovation poses a challenge to a unified business model. In response to these issues, Klus employed an exploratory research design approach. The findings suggested that banks want to benefit from rapid innovation without being involved in their development, while financial firms need the resources and expertise to scale in a highly regulated financial sector [7]. Chaveesuk empirically studied marketing perspectives on behavioral intent. The study used raw data collected from respondents who use digital payment systems as a means of payment for retail purchases. Behavioral intent (BI) significantly affects the actual usage (AU) of digital payment systems [8]. Although these theories have elaborated on digital finance, they are less related to spatial spillover effects and are not practical.
Finance is an important part of social development and plays a positive role in promoting regional technological innovation. Based on the specific situation of each region, the innovation capability of the eastern region is generally stable at more than 50. The innovation capacity of ICT in DC is 29, while that in the western region is 19, and that in digital finance technology is 37. Based on the overall situation of the four regions, the data and financial innovation capabilities of each region are slowly rising. Considering the total effect of the overall data, the effect coefficients of variables such as technological innovation, capital, technology, and personnel input are all greater than zero, indicating that the variables have positive spillover effects on innovation output. However, the total effect of foreign investment is −1.2, indicating that its innovation investment shows an inhibitory effect on innovation output.
The innovation points of this paper are as follows: (1) The mechanism in which digital finance drives technology innovation was analyzed, and the BP neural network algorithm was proposed, and (2) an experiment was conducted on the level of technological innovation driven by digital finance.
2. Digital-Finance-Driven Technological Innovation Method of BP Neural Network
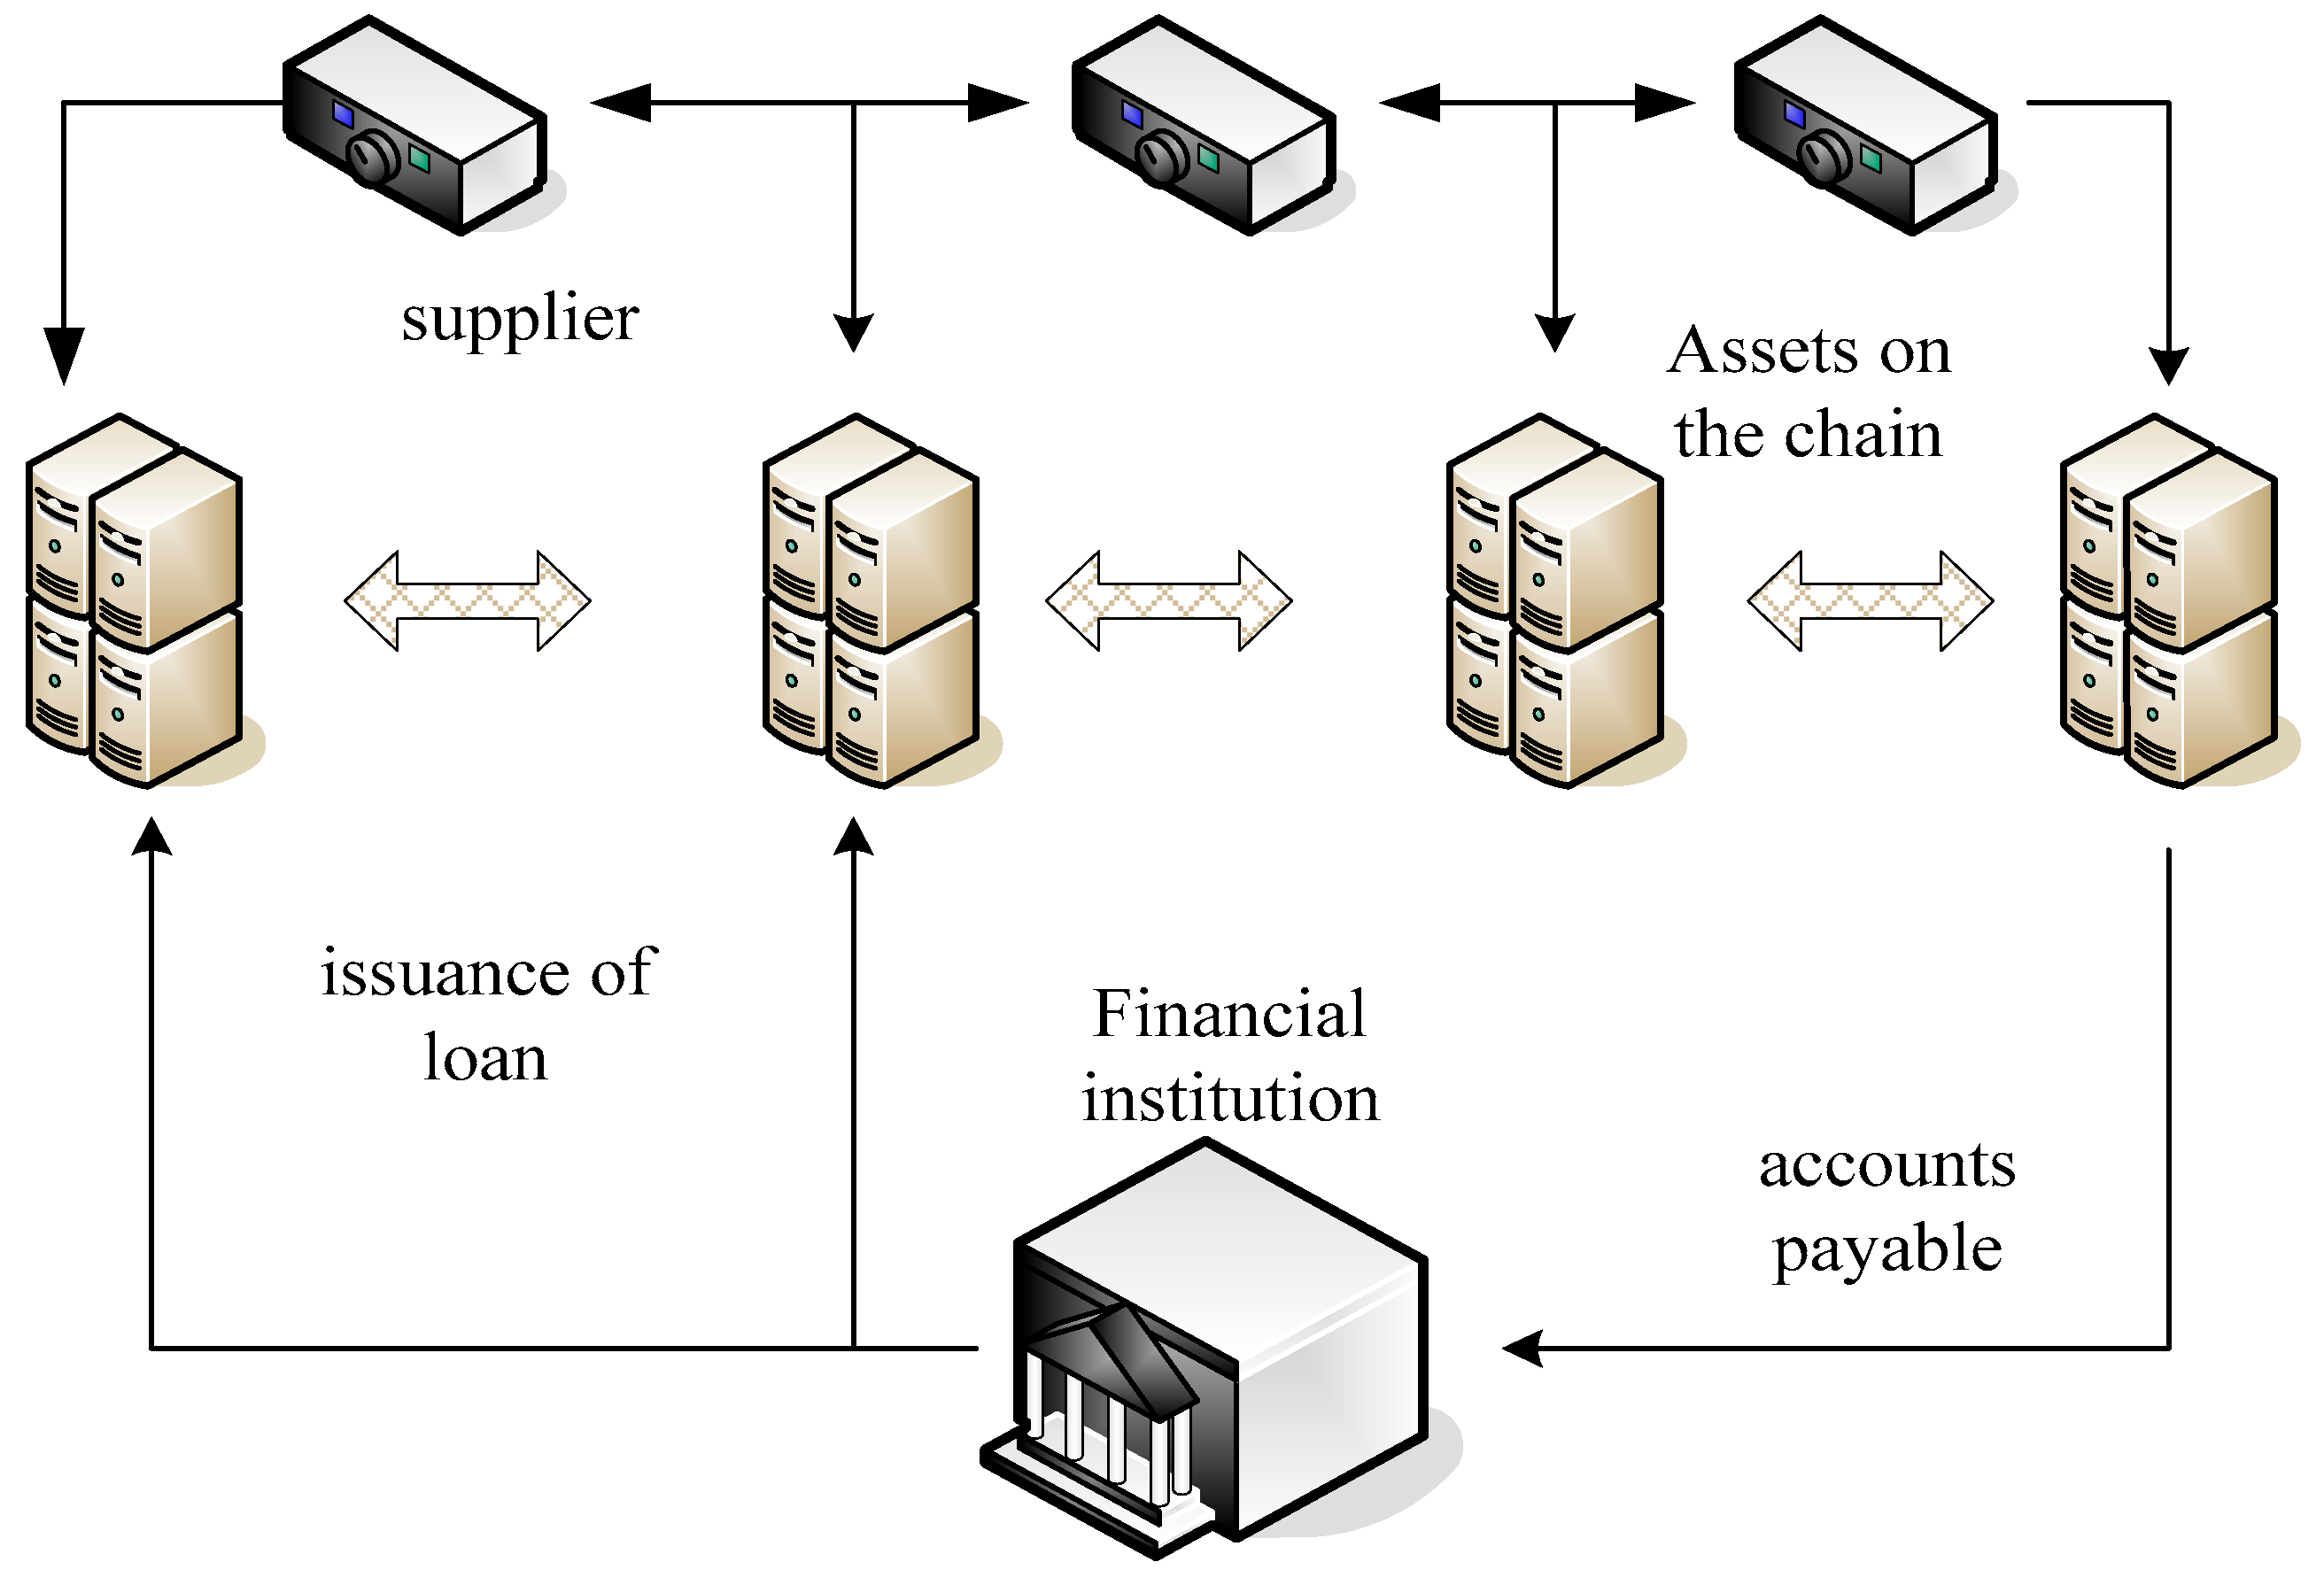
Digital finance refers to a new financial field that combines finance and technology. It is very different from traditional finance in terms of operation mode. While digital finance improved the efficiency of the financial industry, it also affected the financial industry [9,10]. With the development of science and technology, the connotation of digital finance is constantly changing. Hence, the connotation of digital finance is dynamic. In different fields, everyone has a different emphasis on digital finance [11]. Scholars who focus on financial attributes believe that it can provide new financial services supported by the Internet. Scholars who focus on the attributes of science and technology believe that modern technologies, such as artificial intelligence, can be used to change the financial service model and solve the imperfect side of the traditional financial model [12,13]. Figure 1 shows the application scenarios of digital finance. Digital finance refers to the use of big technology platforms, big data, cloud computing, and other scientific and technological methods to innovate financial products, business models, technology applications, and business processes.
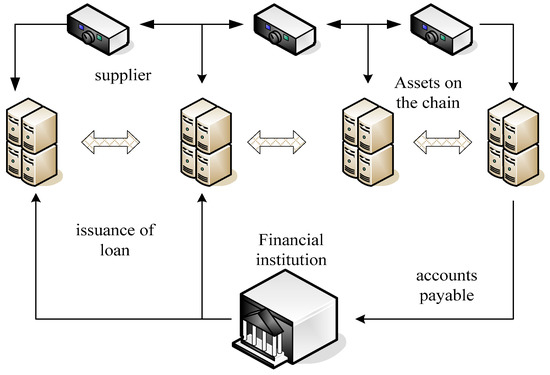
Figure 1.
Application scenarios of digital finance.
From a global perspective, the combination of finance and technology has different characteristics at different stages. The earliest integration was the emergence of ATMs, which transitioned financial simulation to digital technology. Then, the Internet technology in the traditional financial field carried out online business processing, which promoted the emergence of electronic banking. Currently, the use of artificial intelligence, blockchain, and other technologies to create financial businesses has promoted the emergence of financial technology companies [14,15]. Digital finance has brought great changes to the entire economy and society by virtue of digital technology, breaking the service model of traditional finance. It improved work efficiency and reduced service costs.
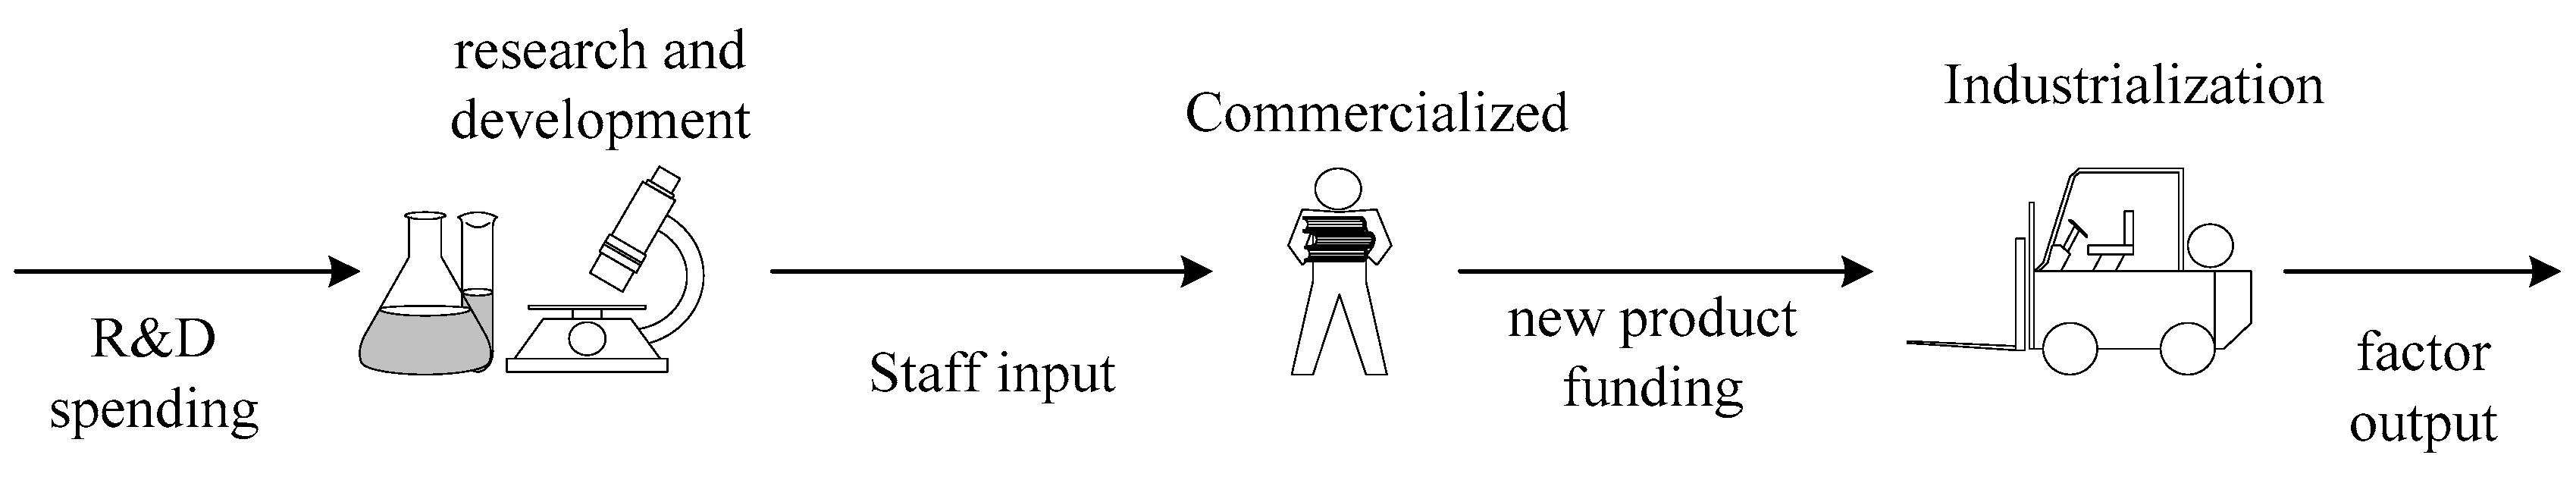
Technological innovation is a key factor to promote regional economic growth. Regional technological innovation is the general process of creating new technologies with existing knowledge and applying new technologies in a specific region, which is affected by relevant factors, such as funding and opening-up policies [16]. Technological innovation is a complex process, from the initial element input to the final product output, and each stage is accompanied by different forms of technological innovation [17]. Figure 2 shows the process structure of technological innovation activities. Technological innovation refers to technical activities that aim to improve existing or create new products, production processes, or service modes.

Figure 2.
Process structure of technological innovation activities.
From the perspective of the relationship between technological innovation and data finance, digital finance employs digital technology to innovate financial services, and the depth and breadth of services have changed qualitatively, which is conducive to solving the funding problems faced by innovation themes. In addition, the incentive effect of digital finance on regional innovation has a spatial spillover effect. Considering the effect of the input of regional talents, development policies, and the degree of opening to the outside world, the incentive effect of digital finance on the level of regional technological innovation presents a non-linear relationship [18].
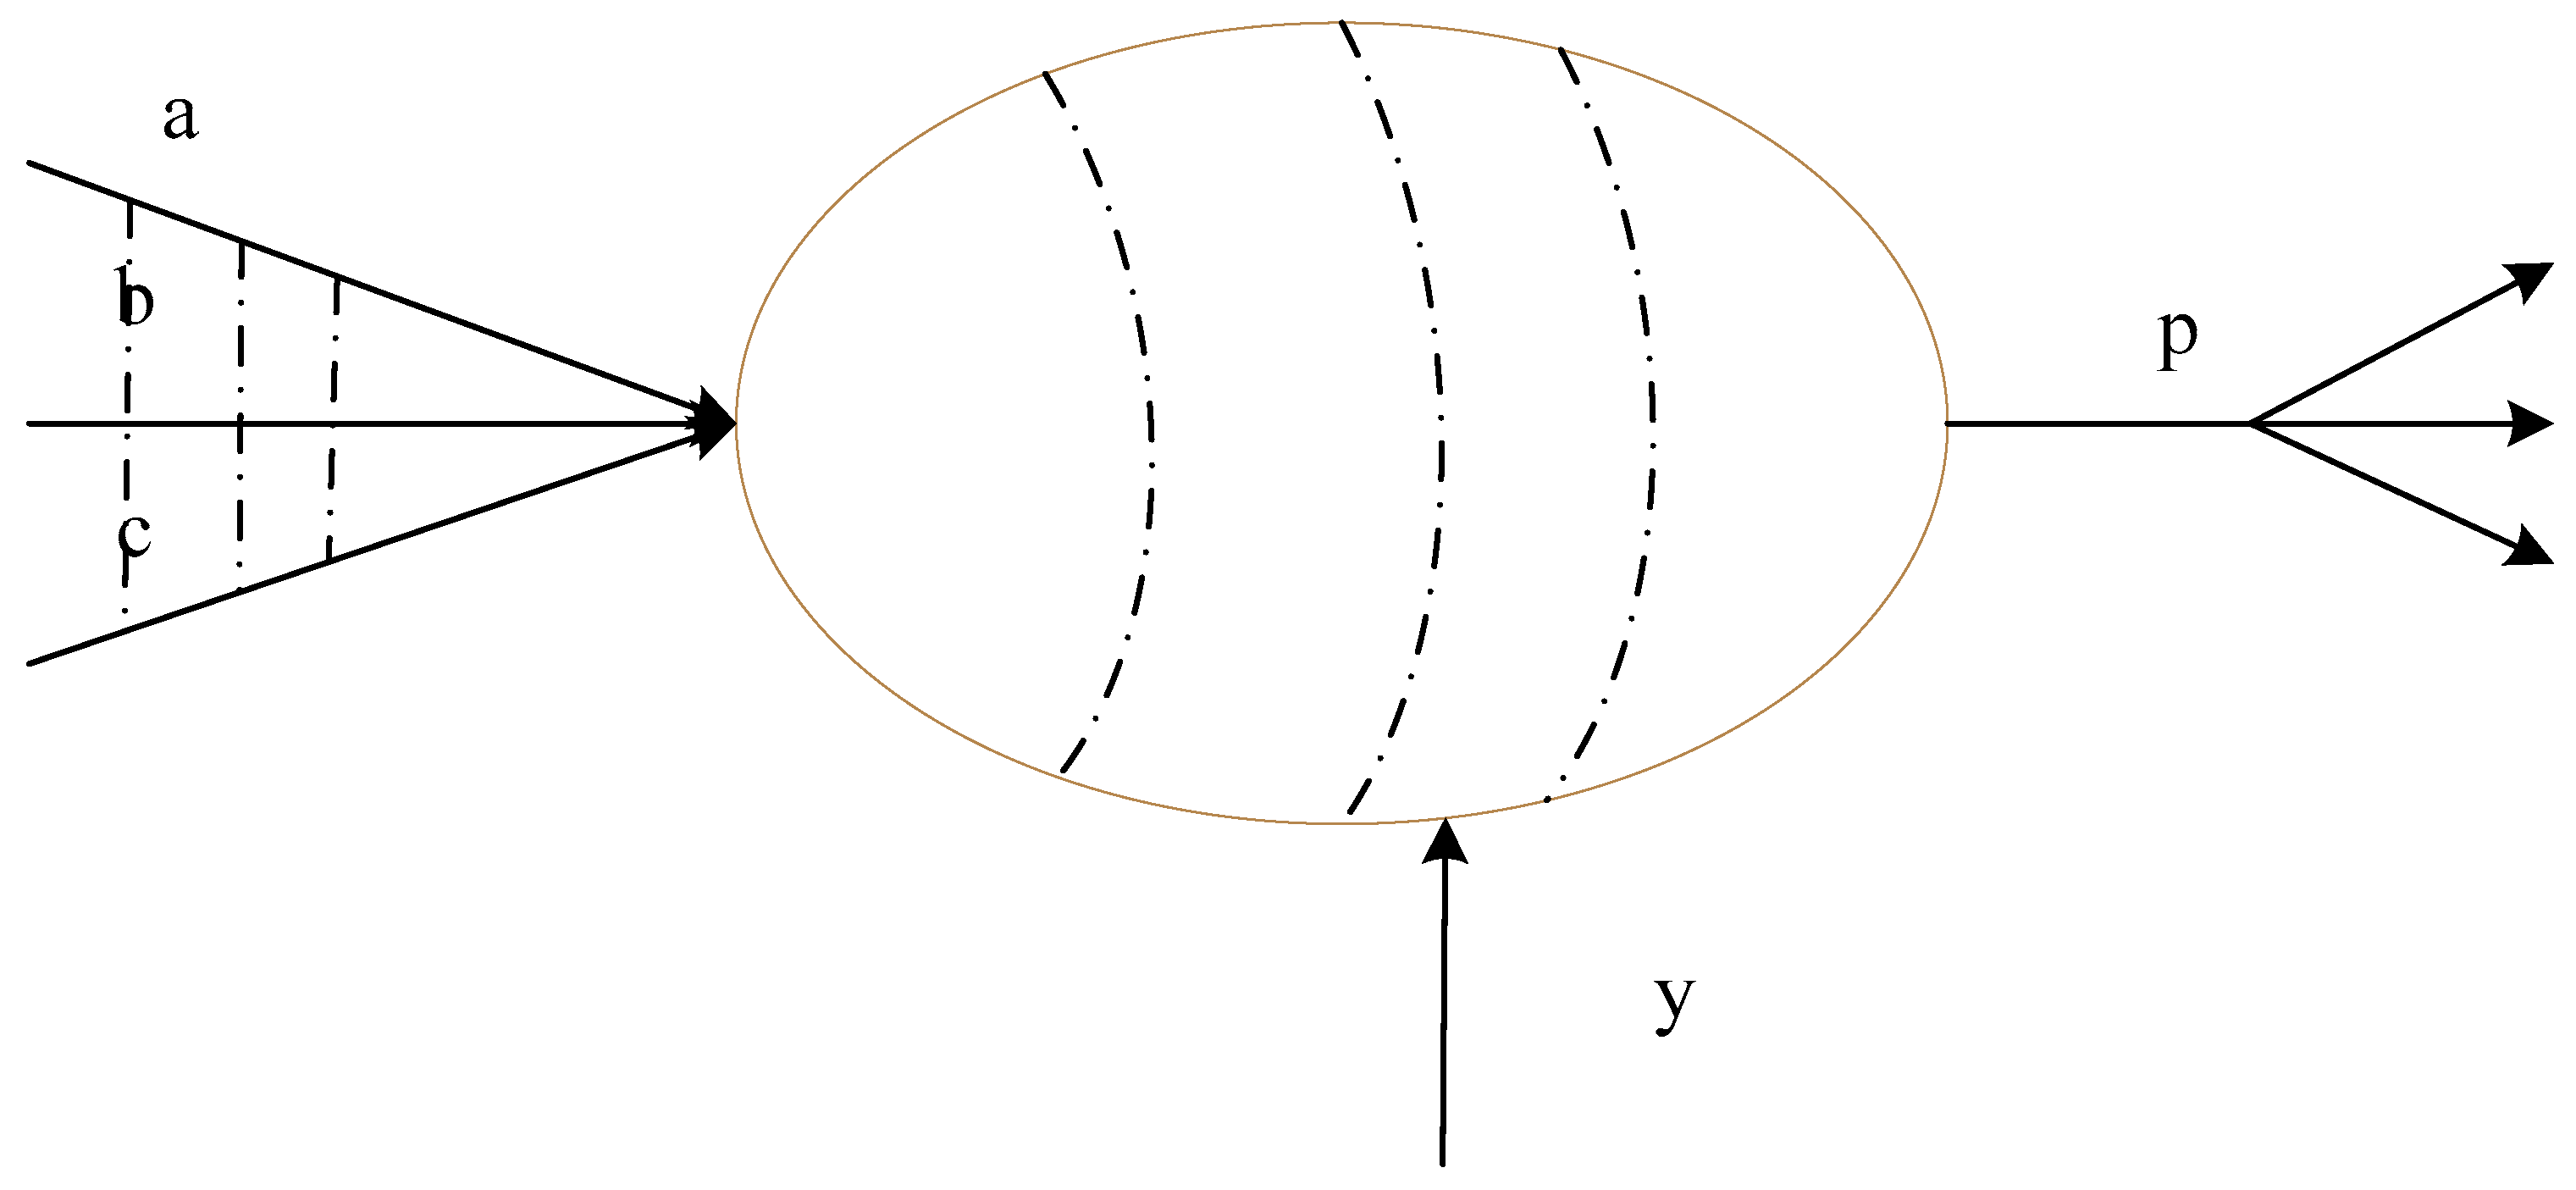
Financial and digital technology are important means for major financial institutions at home and abroad to gain advantages in competition. BP neural network is a multilayer feedforward neural network which can map the input data non-linearly, allowing it to adapt automatically to the data information. BP neural network is a multilayer feedforward neural network that uses a simple non-linear function. This algorithm is used to solve some practical problems, including the prediction of a student’s academic performance and the determination of the teaching scheme that can maximize the student’s progress in a certain period of time. In recent years, BP neural network has been widely used in the field of machine learning. The human brain is interconnected through countless neurons, and the construction of the entire neural network is closely related to the neurons. They cooperate with each other to form a complete information processing system. The neural network is abstracted and simplified from the biological neural network, which is a mathematical algorithm model that can intelligently learn and train input and output data by adjusting the parameters between a large number of internal neurons [19,20]. Figure 3 shows the structure of biological neurons.

Figure 3.
Structure of biological neurons.
Formula (1) represents the input vector of the neuron, and represents the input data.
In Formula (2), represents the weight vector.
In the function expression, represents the bias value of the neuron, which is the weighted accumulation of all inputs and finally forms . The value represents its matrix form, and represents the output of the neuron. In the process of building a neural network model, the transfer function is the most important part. Figure 4 shows a common neural network transfer function.
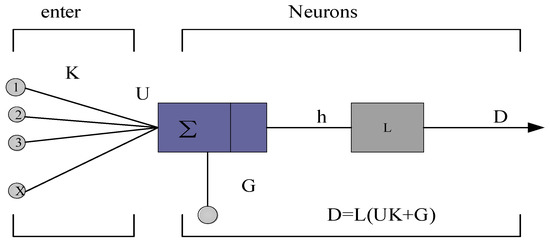
Figure 4.
Common neural network transfer functions.
The artificial neural network cannot be compared with real neurons. It only imitates neurons when building the system, and other neural structures in neurons are simplified. Figure 5 shows the principal structure of the neural network.
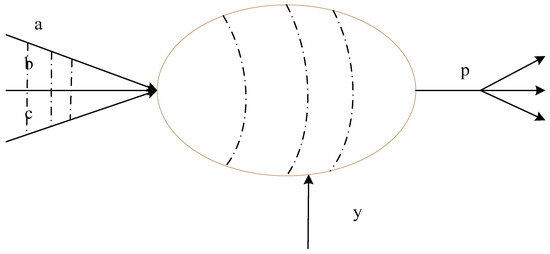
Figure 5.
Principal structure of the neural network.
The data represented in Formula (5) are all signals sent by cells. These data can be selected in various ways, and they can continue to transmit information in different functions.
The BP neural network belongs to a three-layer network, and it can only propagate in one direction. In the BP neural network, the nodes of each layer need to be set before the system runs. By setting the nodes, the error can be reduced, and the precise output can be achieved.
Formula (7) represents the linear basis function of BP neural network.
In the BP neural network, the function is usually differentiable and monotonically increasing, and the nodes are modified during operation. The value represents the transfer form of BP network data, and is the transfer derivative function.
During the introduction, the BP neural network can only propagate forward, and Formula (10) represents the relevant transfer function from the input layer to the hidden layer.
Formula (12) represents the relevant transfer function from the hidden layer to the output layer.
Formula (14) represents the mean squared error function, representing the total sample size.
Based on the function expression, the error of the network is the sum of the weights of each layer, and all adjustment weights can change the error.
3. Experiment on the Innovation Level of Digital-Finance-Driven Technology
Digital finance generally refers to financial institutions. Financial institutions cooperate with financial technology companies, use digital technology to dig deep into financial data, innovate financial products, and business models, and introduce new forms of financial businesses such as payment, financing, investment, and wealth management. This paper explored the technological innovation of digital finance.
The main element of the financial market is capital. Hence, the level of financial development is related to the financial aggregate and structure. Financial development refers to the change of the financial structure, including both short- and long-term change. Financial transaction flows in each continuous period and comparative change of financial structure at different time points. From the perspective of financing in the financial market, it mainly includes direct and indirect financing. The difficulty of financing is related to the existing achievements of the market and the development prospects of the market. With the continuous upgrading of the economy, the financial financing model has also undergone tremendous changes. From the traditional point of view, bank borrowing is the most important financing mode. However, with the transformation of the economic development model, the stock market has grown very fast, and the bond and stock markets have provided new targets for financing. In the financial market, capital is similar to a commodity whose price is determined by the funds in the market. When funds are tight and financing is difficult, financing costs increase. When the breadth of the financial market is insufficient, capital operations become limited.
A neural network is a complex network system formed by a large number of simple processing units that are widely interconnected. It reflects many basic features of human brain function and is a highly complex non-linear dynamic learning system. Based on the basic framework of the neural network model, the indicators of financial development level are obtained. According to the data in Table 1, the indicators of financial development level are briefly explained. Since the reform and opening up in China, it has not implemented interest rate liberalization, and the real interest rate has been fluctuating at a low level. Therefore, the real interest rate is not suitable for China’s financial development indicators. Therefore, the indicators to measure China’s financial development generally refer to the indicators of intermediary financial development and the indicators to measure the stock market. According to relevant data, the development indicators of different regions differ quite substantially. Based on the overall situation, the largest indicator is 2.6 in the east, whereas the smallest indicator is 0.5 in the west. The development difference between the two regions is large, indicating that the regional financial development is unbalanced. In terms of the indicators of a single area, the largest indicator in the east is 2.6, whereas the smallest indicator is 0.6, and the difference between the two is 2. The largest indicator in the middle is 1.4, whereas the smallest indicator is 0.9, and the difference between the two is 0.5. The data show that the differences within the eastern region are very large, which is related to the financial system of the developed regions. Notably, although the level of financial development in the west is generally low, the differences between them are very small.

Table 1.
Statistical description of financial intermediary development indicators.
According to the data in Table 2, the relevant development indicators of the stock market were introduced. According to the overall data, the stock market in each region is relatively active. When the stock market value reaches 7.2 times the GDP, its minimum value is only 0.3 times the GDP. The volatility of the stock market is very large. Based on the stock development indicators of a single region, the largest indicator in the east is 7.2 times, the smallest indicator is 1.4 times, the difference between the two is 5.8 times. The largest indicator in the middle is 2.3 times, whereas the smallest indicator is 1.2 times, and the difference between the two is 1.1 times. The minimum indicator is 0.09 times, and the difference between the two is 1.01 times. Therefore, the internal differences of the eastern stock market are relatively large, and the development of the central and western regions is relatively small. The average value of the stock market value in the eastern region is 5.3 times that in the western region.
Table 2.
Statistical description of stock market development indicators.
Cities can attract production factors through the agglomeration effect of urban agglomerations, generate economies of scale, form industrial cluster effects, and drive the rapid development of regional economies. At the same time, the development of high-tech industries in cities would promote economic transformation and drive regional innovation. The evaluation of digital financial technology innovation involves multiple elements. Therefore, multiple indicators need to be considered in the evaluation of digital financial innovation.
The so-called evaluation index refers to the quality of the evaluation index. The above formula shows the specific calculation method. Among the variables, represents the average value of each indicator, and represents its standard deviation. When is larger, its discriminating ability is better.
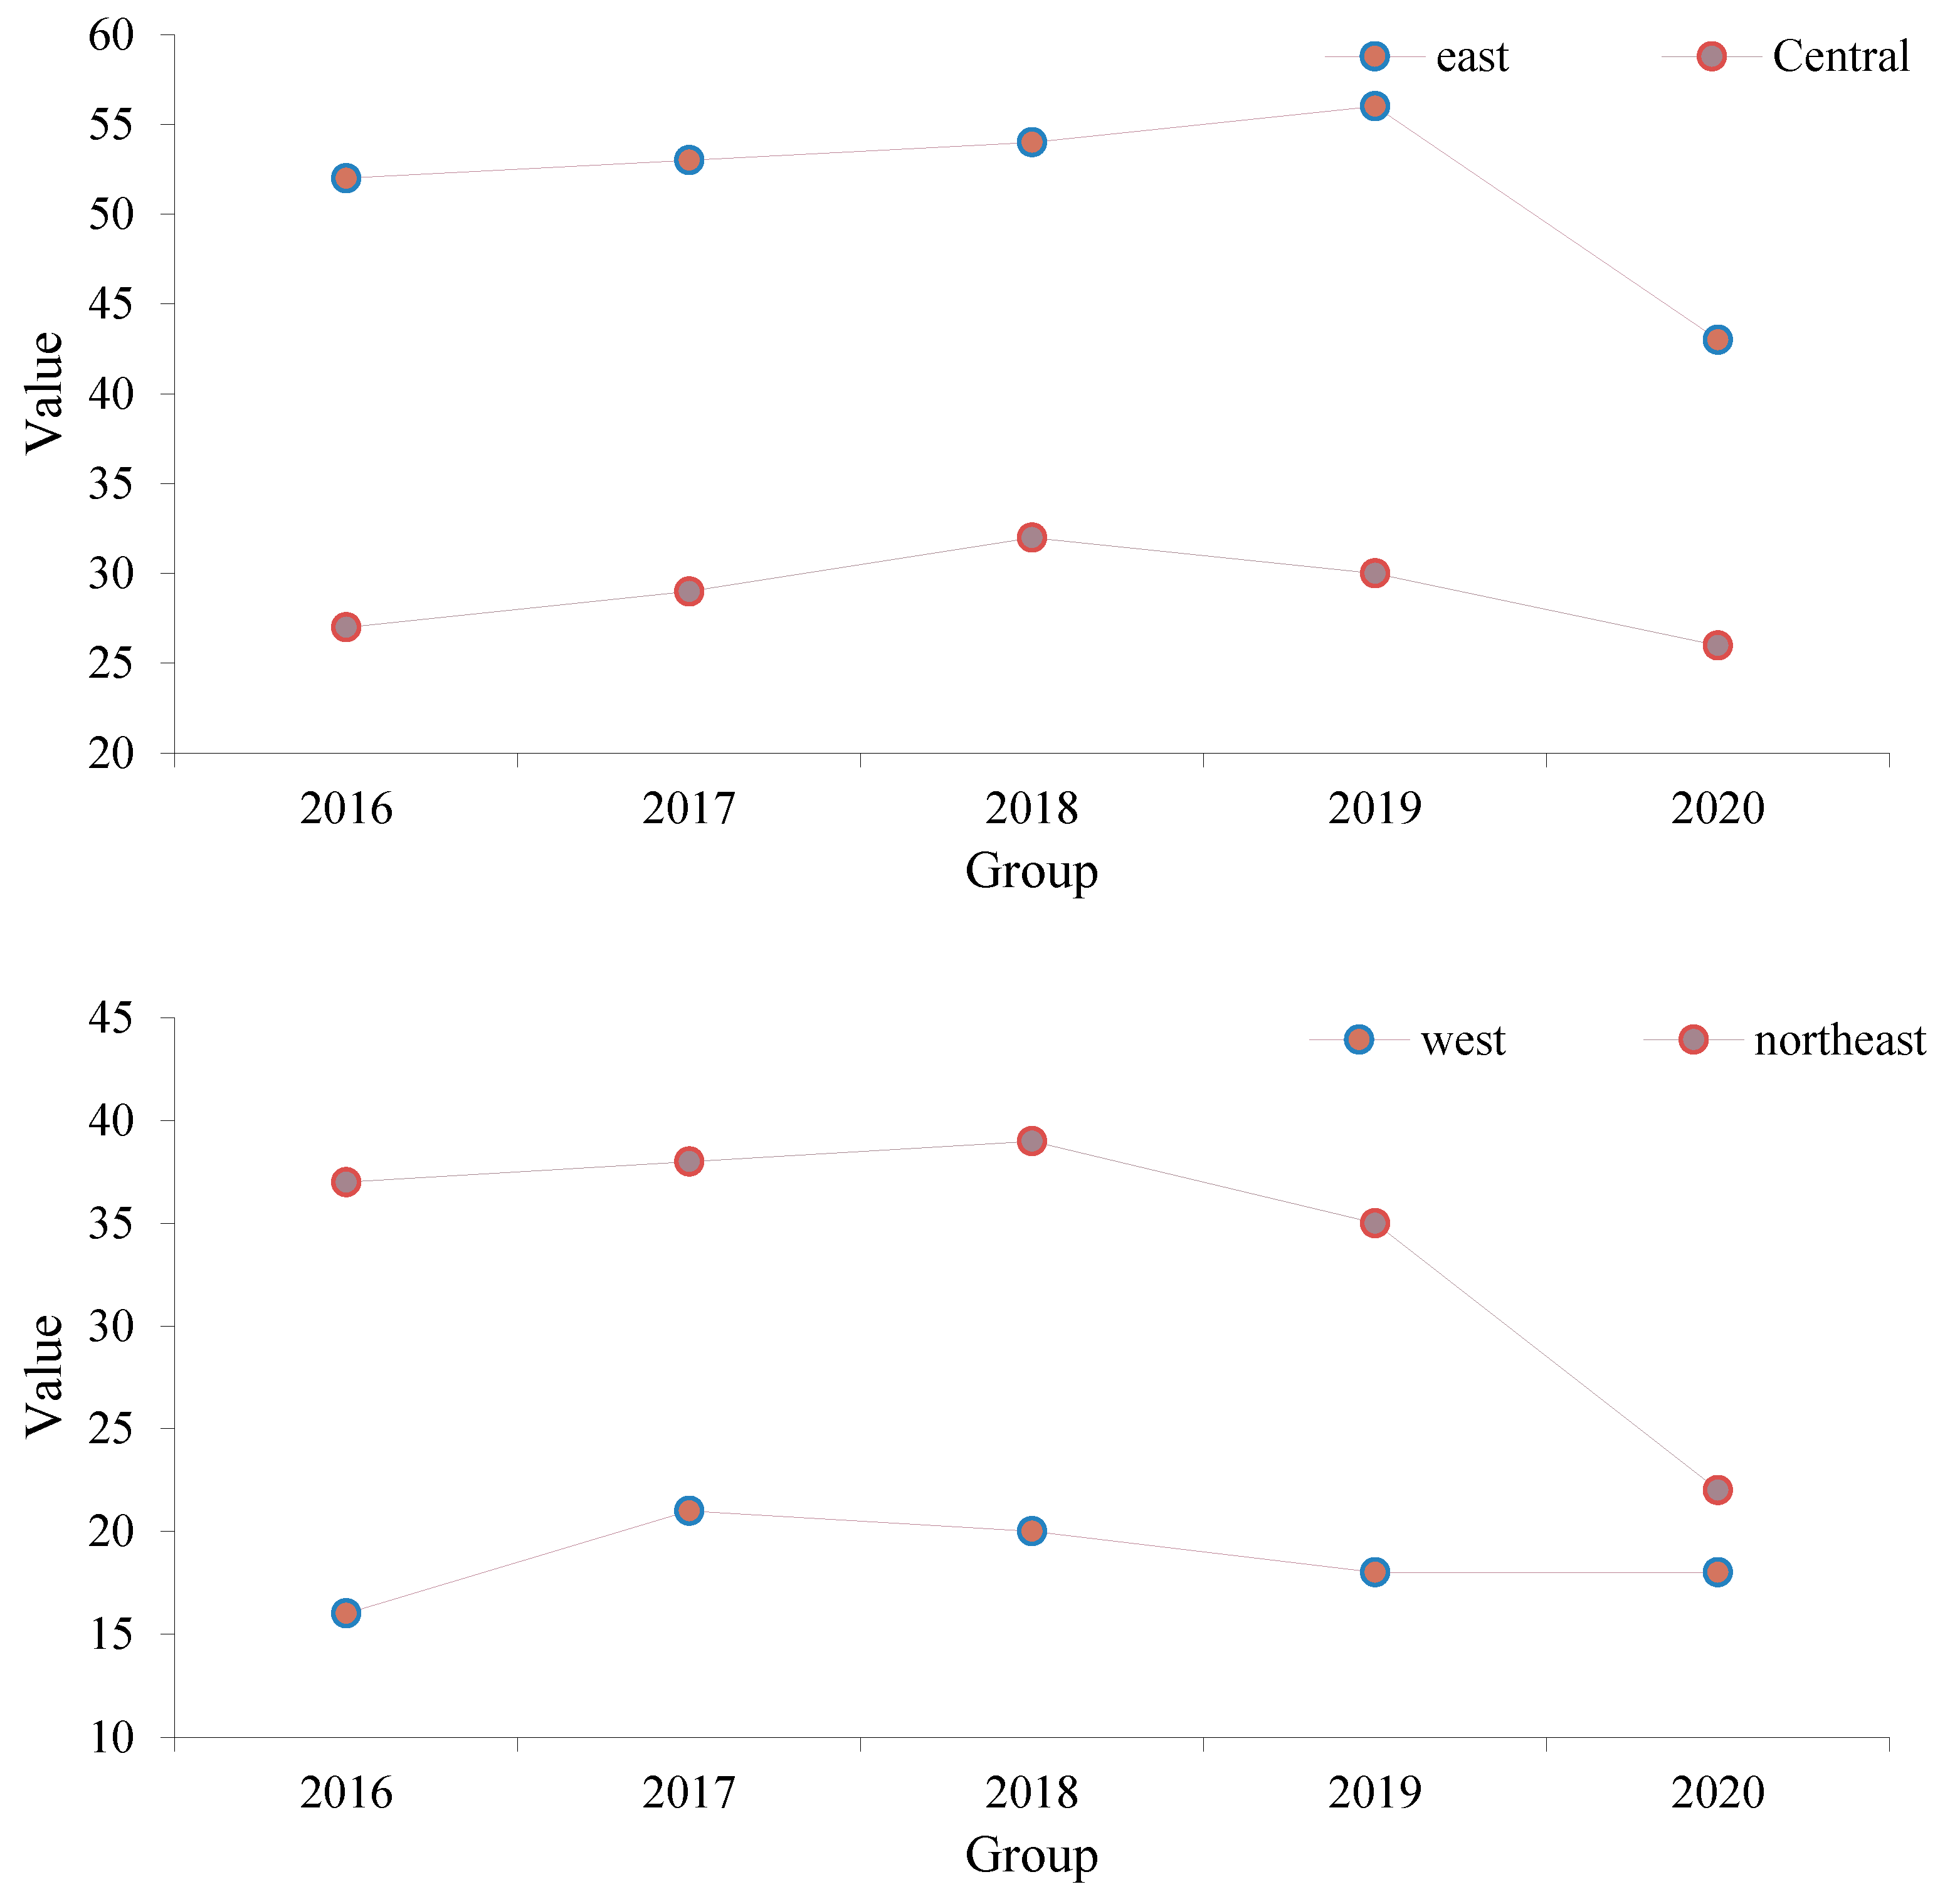
According to the data in Figure 6, the financial data innovation capabilities of various regions were compared. According to the data, the eastern region has the highest digital financial technology innovation capability. The innovation capacity of digital financial technology in the central, western, and north-eastern regions is relatively low. Based on the specific situation of each region, the innovation capability of the eastern region is generally stable at more than 50. The innovation capabilities of digital financial technology in the central region are 27, 29, 32, 30, and 26, while those in the western region are 16, 21, 20, and 18. The digital financial technology innovation capabilities of the northeast region are 37, 38, 39, 35, and 22. Based on the overall situation of the four regions, the innovation capabilities of data finance in all regions are slowly rising. Except for 2020, digital finance in all regions has experienced a sharp decline, which is closely related to COVID-19 at that time. Considering the outbreak of COVID-19, the economic development of agriculture, industry, and service industry in various regions is not smooth, resulting in a sharp decline in digital finance. Based on the individual situation of each region, the western region has the weakest innovation ability of data amount, and the improvement of the market system and the degree of economic development are important factors that affect the innovation ability of regional data finance. According to the relevant economic policies, the reform of the market economy system was initially carried out on a trial basis in the eastern region. Therefore, relevant preferential policies differ across different regions, making the development of each region very different. Benefiting from various policies, the eastern region had a relatively high degree of marketization, which provided a foundation for regional data and financial innovation technologies. In comparison with the eastern coastal areas, the economic development level of the central, western, and north-eastern regions is relatively backward, and the innovation of financial data technology is relatively less affected by geographical location and policy orientation. With the continuous development of the market, the economic development gap between different regions increases, resulting in an increasingly obvious level of digital financial innovation technology in different regions.
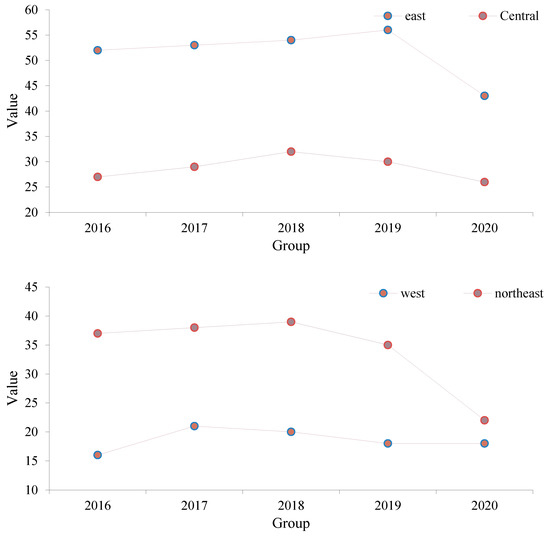
Figure 6.
Comparison of digital financial innovation capabilities in various regions.
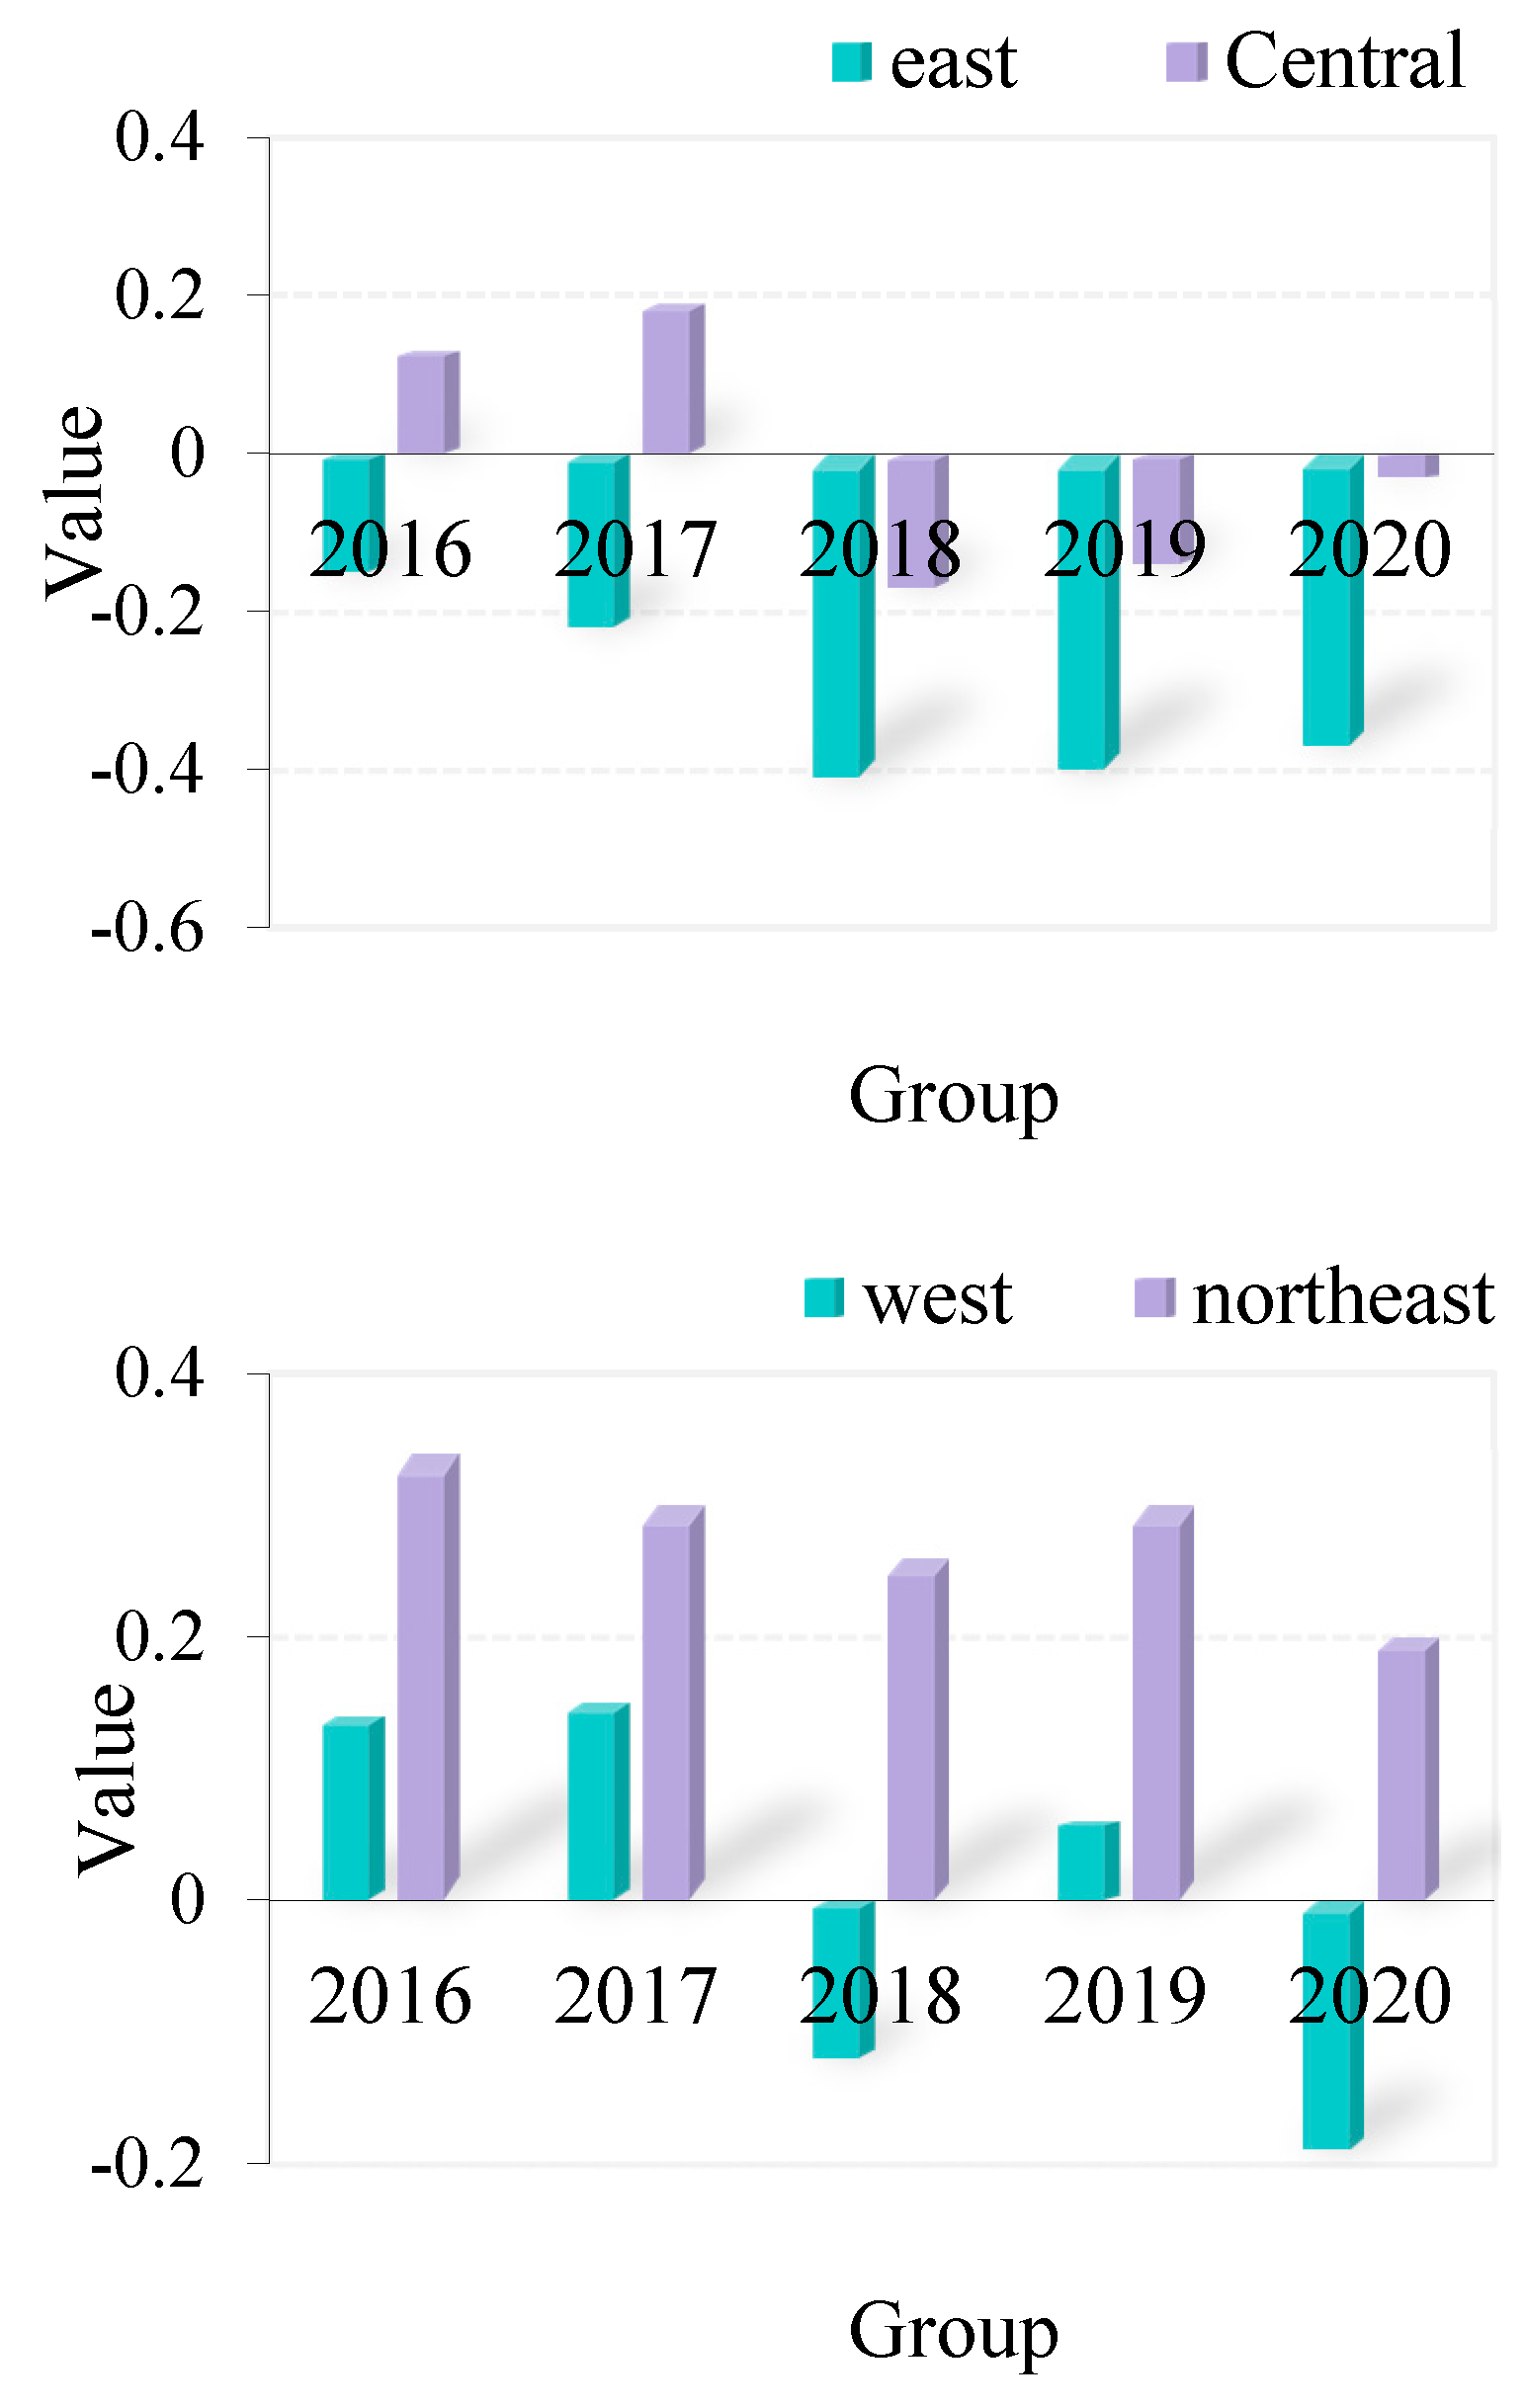
According to the data in Figure 7, a comparative analysis of the spatial spillover effects of digital financial technology innovation in different regions was carried out. According to the specific data, among the financial data technology innovation spillover effects of the survey, the eastern region had a minimum value in 2018 and 2019. Although China’s economy has been on the rise in the past two years, the overall situation has shown a downward trend of varying degrees, mainly because of the effect of the cyclical financial crisis. Based on the innovation capabilities of the four regions, only the western region’s spatial spillover index in five years is positive all throughout, and the eastern region’s spatial spillover index in five years is negative all throughout. Overall, the space spillover effect of digital financial technology innovation needs to be improved urgently.
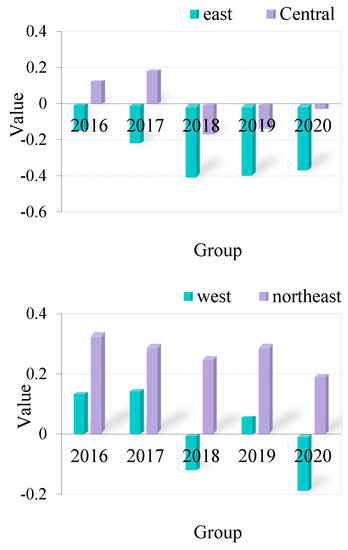
Figure 7.
Comparison of spatial spillover effects of digital financial technology innovation in different regions.
Based on the specific comparison of the four regions, the spatial spillover benefit indexes of the eastern region are −0.15, −0.22, −0.41, −0.4, and −0.37, while those of the central region are 0.13, 0.19, −0.17, −0.14, and −0.03, those of the eastern region are 0.14, 0.15, −0.12, 0.06, and −0.19, and those of the north-eastern region are 0.34, 0.3, 0.26, 0.3, and 0.2. The troughs of technological innovation spillovers in the eastern and central regions appeared at the same time and were mainly affected by the degree of economic openness. The financial crisis hit the eastern and north-eastern regions with a high degree of marketization first, and the central and western regions were relatively late. Based on the specific situation in the past five years, the northeast region has the best digital financial technology innovation spillover advantage. Followed by the central and western regions, the eastern region has the lowest digital financial technology innovation spillover effect among the four regions.
4. Spatial Spillover Effect of Digital-Finance-Driven Technological Innovation Level
With the advancement of the globalized economy, the technological revolution is still going on, and innovation has become an important engine that drives regional economic growth and improves the country’s comprehensive strength. The optimization of the financial environment is conducive to the development of science and technology. The business of the financial industry and technological innovation overlaps, and financial elements gradually expand from the field of innovative investment and finance to the field of technological innovation risk prevention. Before data analysis, a brief analysis of each data is required, and the specific conditions are as follows:
According to the data in Table 3, a brief analysis of the relevant data involved in the spatial spillover effect of digital finance and technological innovation output was carried out. The data included technological innovation, financial level, technological investment, and personnel investment.
Table 3.
Variable descriptive statistics table.
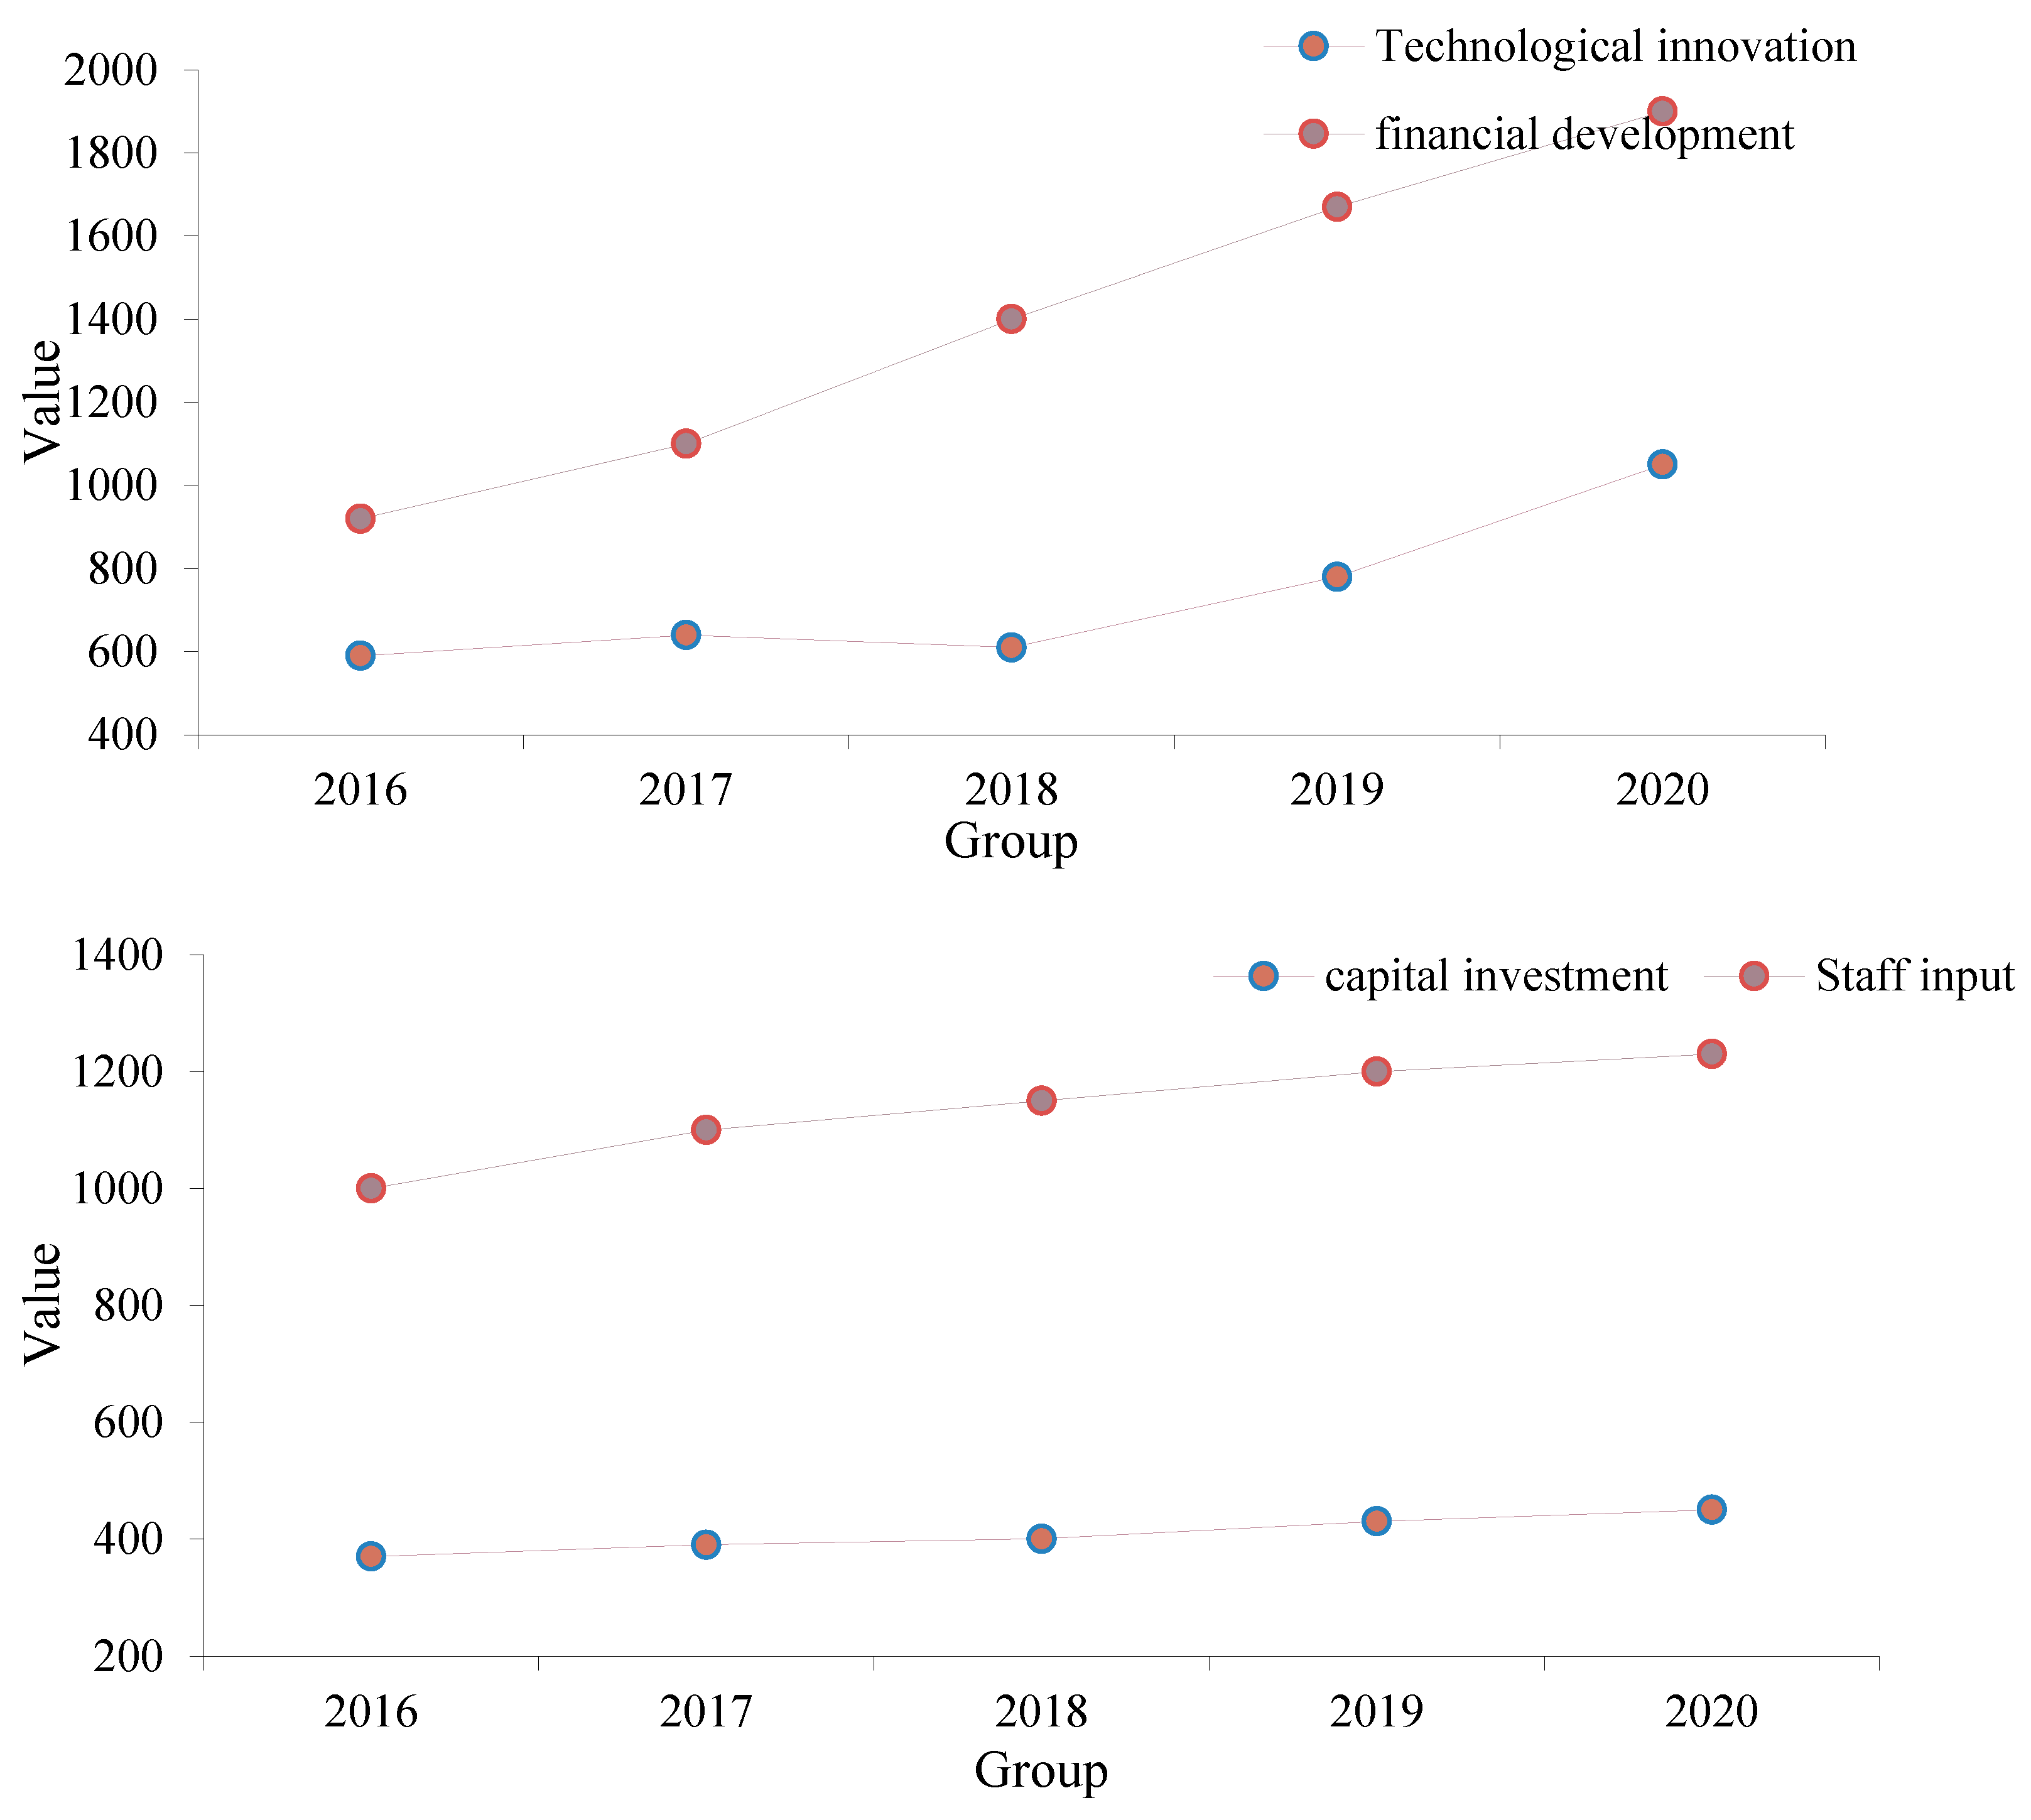
According to the data in Figure 8, the time series characteristics of technological innovation, financial level, technological input, and personnel input level were analyzed. Based on the overall situation, the four sets of data are in an upward trend during this period, and the financial development level has the fastest growth trend. In terms of technological innovation output, it has increased from 590 to 1050, and its annual growth rate has continued to increase. Financial development has increased from 92 billion to 190 billion. From the growth rate of the two sets of data, the level of financial development far exceeds that of technological innovation output projects. From the perspective of capital investment, the technological innovation output has increased from 37 billion to 45 billion, and personnel input has increased from 1000 to 1230 per year. Therefore, although both are in the rising stage, the growth rate of both is relatively slow.
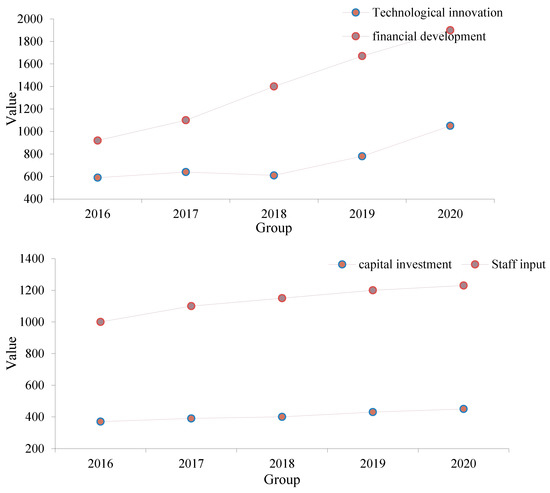
Figure 8.
Synthesized timing characteristics diagram.
According to the data in Table 4, based on the perspective of the total effect of the overall data, the effect coefficients of variables such as technological innovation, capital, technology, and personnel input are all greater than zero, indicating that the variables have positive spillover effects on innovation output. However, the total effect of foreign investment is −1.2, indicating that its innovation investment has an inhibitory effect on innovation output. According to the indirect spillover effect of innovation investment, its spillover index is −0.001, indicating that it has an inhibitory effect on surrounding cities. The direct and total effects of the investment of innovators are very obvious, indicating that the spillover effect of innovators is relatively large, and the promotion effect on neighboring cities is greater than that on the local area.
Table 4.
Decomposition of urban innovation space spillover effects.
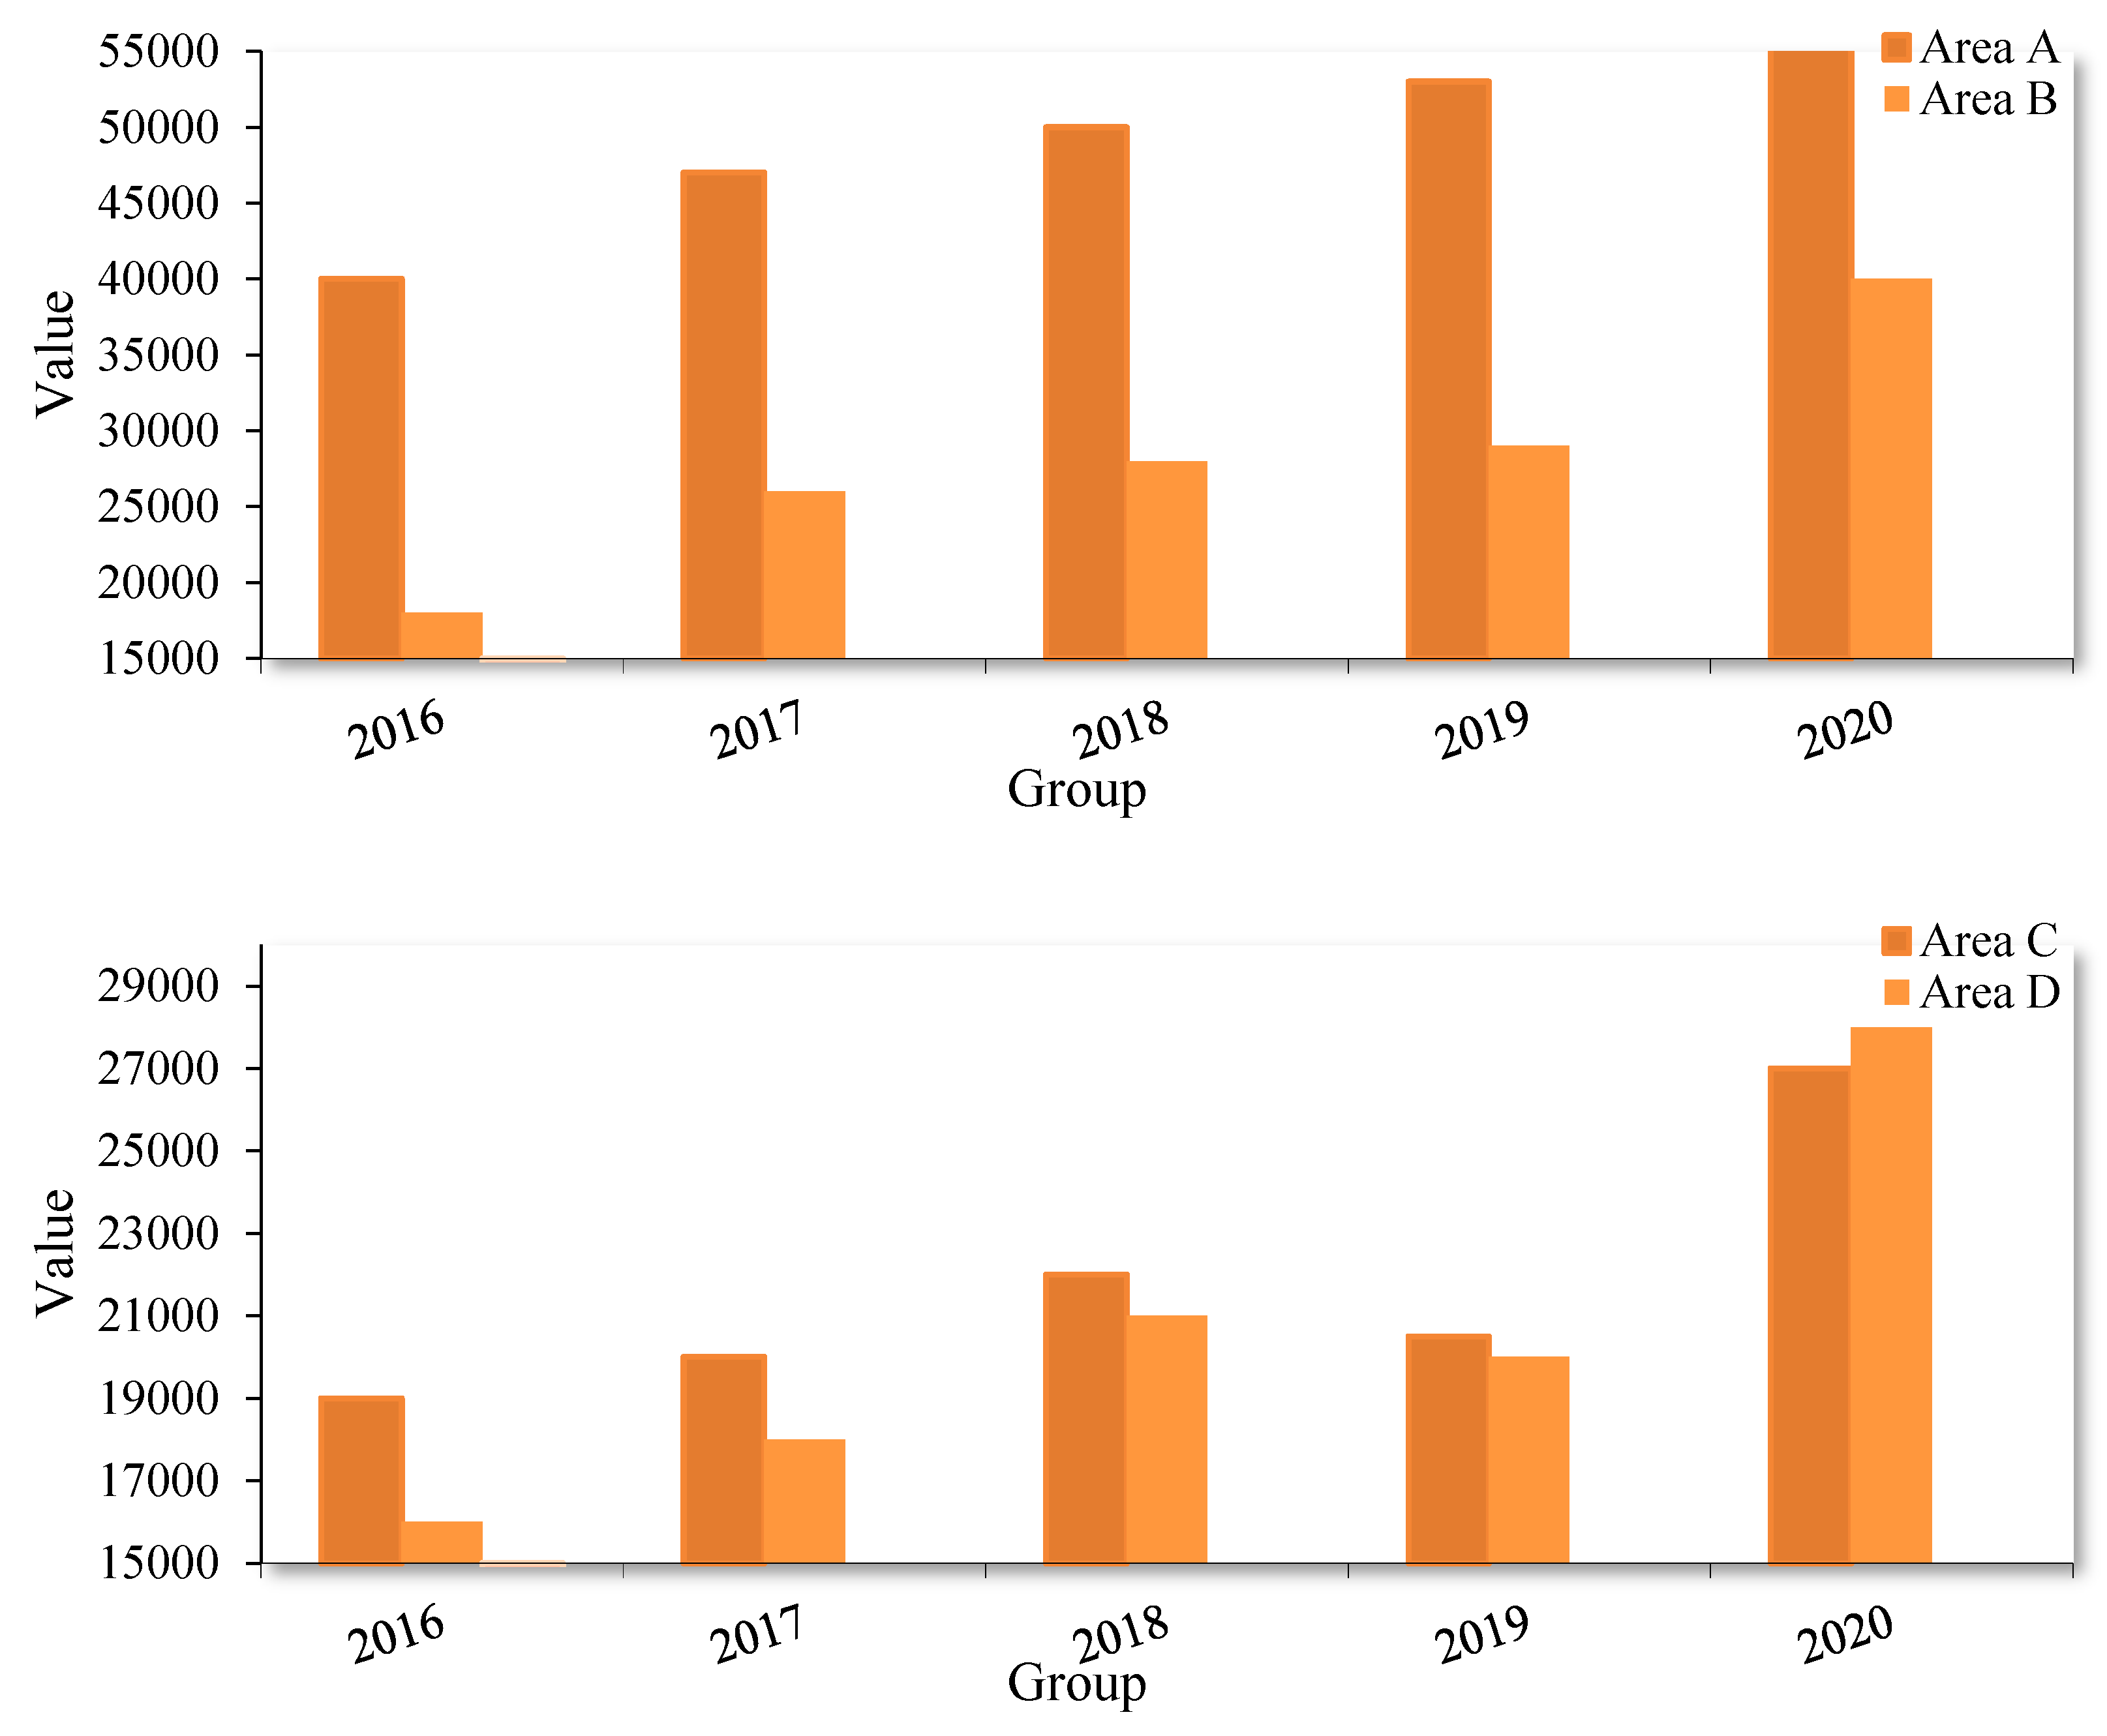
According to the data in Figure 9, the relevant situation of patent innovation output in the four cities in a certain place on the eastern coast was described. First, based on the overall situation, the number of patent authorizations in the four cities is increasing, but the speed of increase is very different. From the point of view of city A, its patent authorization volume is in a leading position among the four cities, indicating that its innovation ability is strong, and the economic spillover effect is the highest. In 2016, the number of patent authorizations in city A reached 40,000, and in 2020, the number of patent authorizations reached 71,000. The average annual growth rate of patent authorization in city A is 6200. In 2016, the number of patent authorizations in city B reached 18,000. The number of patents granted annually reached 40,000. The average annual growth rate of patent grants in city B is 2400. From these data, both the total number of patents and the average annual growth rate of city A are much higher than that of city B. Notably, the patent growth of city B in 2020 has increased significantly, with a growth rate of 37.9%. Therefore, the innovation level of city B has increased significantly in 2020, which may be related to the surrounding universities and scientific research. Institutions are related, indicating that the spatial spillover effect of the local data and financial innovation technology is strong.
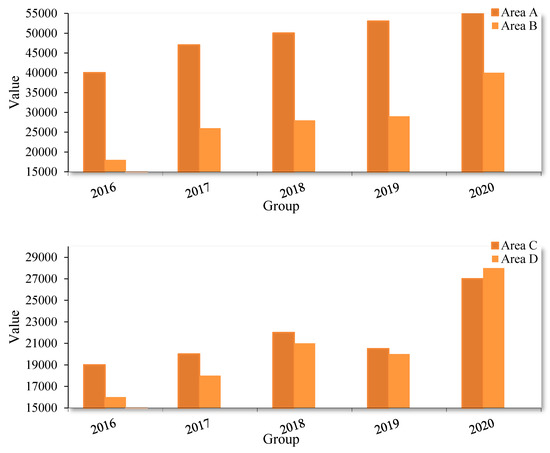
Figure 9.
Description of urban patent innovation output.
In 2016, the number of patent authorizations in city C reached 19,000, and in 2020, the number of patent authorizations reached 27,000. The average annual growth rate of patent authorization in city A is 1600. In 2016, the number of patent authorizations in city D reached 16,000, and the number of patent authorizations reached 28,000. The average annual growth rate of patent authorization in city D is 2400, and although the overall number of patents in city D is less than that in city C in the first four years, its annual growth rate is relatively high, especially in 2020, when its growth rate reached 40%, making it the highest patent in 2020. The total amount is higher than that of city C. Therefore, the innovation environment of city D is constantly improving, innovation activities are very active, and the spatial spillover effect of data and financial innovation technology in this place is strong.
5. Conclusions
As a new financial service mode, digital finance changes the traditional financial service mode and relies on the deep integration of various emerging technologies and financial fields. It involves the optimization of the allocation of resources and promotes regional technological innovation activities. Research on financial and information systems has begun to analyze the effect of these changes and digital advances on the financial sector. Gomber reviewed the research status of these novel and innovative business functions in digital finance [21]. The digital finance issues discussed by Ozili are related to the ongoing debate and national-level projects aimed at promoting financial inclusion in developing countries and emerging economies through digital finance [22]. The present study aimed to examine the spatial spillover effect of digital-finance-driven technological innovation based on BP neural network. It is expected to use the fitting ability of the BP neural network for the analysis of relevant information on digital finance, predict the trend of the financial market, and improve the spatial spillover effect of financial technology in innovation. Results show that the technological innovation level of digital finance at various stages has different spatial situations. In the research and development stage, its effect on the level of technological innovation does not have a spatial spillover effect. In the stage of productization, digital finance in this region can promote the improvement of the level of technological innovation in the productization and industrialization stages of other surrounding regions. The improvement of technological innovation can promote the development of green economy and strengthen the belief in sustainable development. Although this paper has drawn some conclusions, some shortcomings are involved. This paper mainly studied the spatial spillover effect of innovation from the urban level without further studying the spatial spillover effect of innovation from technical innovation, digital finance, and BP neural network. Therefore, in the future, starting from the county level and different regions, this paper will use qualitative and quantitative methods for more scientific research.
Author Contributions
Data curation, X.G.; Writing—original draft, L.Y.; Writing—review & editing, Y.C. All authors have read and agreed to the published version of the manuscript.
Funding
This research was funded by 2022 Social Science Development Research Project of Hebei Province (No. 20220505017).
Data Availability Statement
The data that support the findings of this study are available from the corresponding author upon reasonable request.
Conflicts of Interest
The authors declare no conflict of interest.
References
- Seif, A.M.; Panahi, H.; Hamidi Razi, D. Regional economic growth and spatial spillover effects in mena area. Iran. Econ. Rev. 2017, 21, 765–787. [Google Scholar]
- Meng, B.; Wang, J.; Andrew, R. Spatial spillover effects in determining China’s regional CO2 emissions growth: 2007–2010. Energy Econ. 2017, 63, 161–173. [Google Scholar] [CrossRef]
- Karim, A.; Suhartono, S.; Prastyo, D.D. Spatial Spillover Effect of Transportation Infrastructure on Regional Growth. Econ. Reg. 2020, 78, 911–920. [Google Scholar] [CrossRef]
- Hong, J.; Gu, J.; He, R. Unfolding the spatial spillover effects of urbanization on interregional energy connectivity: Evidence from province-level data. Energy 2020, 196, 116990.1–116990.12. [Google Scholar] [CrossRef]
- Zheng, L.; Long, F.; Chang, Z. Ghost town or city of hope? The spatial spillover effects of high-speed railway stations in China. Transp. Policy 2019, 81, 230–241. [Google Scholar] [CrossRef]
- Tang, Y.M.; Chau, K.Y.; Hong, L. Financial Innovation in Digital Payment with WeChat towards Electronic Business Success. J. Theor. Appl. Electron. Commer. Res. 2021, 16, 1844–1861. [Google Scholar] [CrossRef]
- Klus, M.F. Strategic Alliances between Banks and Fintechs for Digital Innovation: Motives to Collaborate and Types of Interaction. J. Entrep. Financ. 2019, 21, 1–23. [Google Scholar] [CrossRef]
- Chaveesuk, S.; Khalid, B.; Wornchanok, C. Digital payment system innovations: A marketing perspective on intention and actual use in the retail sector. Innov. Mark. 2021, 17, 109–123. [Google Scholar] [CrossRef]
- Dubey, V. Fintech-Digital way of ID Verification and Biometric Verification in 2020. Int. J. Innov. Appl. Stud. 2020, 27, 896–901. [Google Scholar]
- Alabbasi, Y. Governance and Legal Framework of Blockchain Technology as a Digital Economic Finance. Int. J. Innov. Digit. Econ. 2020, 11, 52–62. [Google Scholar] [CrossRef]
- Tsindeliani, I. Public financial law in digital economy Javno financijsko pravo u digitalnoj ekonomiji. Informatologia 2019, 52, 185–193. [Google Scholar] [CrossRef]
- Vives, X. Digital Disruption in Banking. Annu. Rev. Financ. Econ. 2019, 11, 243–272. [Google Scholar] [CrossRef]
- Bean, R.; Townsend, C.; Ray, R. Breaking the Digital Ceiling: Research Reactors Driving Innovation. Trans. Am. Nucl. Soc. 2018, 118, 321–323. [Google Scholar]
- Kolodiziev, O.; Krupka, M.; Shulga, N. The level of digital transformation affecting the competitiveness of banks. Banks Bank Syst. 2021, 16, 81–91. [Google Scholar] [CrossRef]
- Stanciu, A.; Ifrim, A.M. The Role of Benchmarking in Managerial Performance. Int. J. Innov. Digit. Econ. 2018, 9, 37–47. [Google Scholar] [CrossRef]
- Wang, Y.; Li, J. Spatial spillover effect of non-fossil fuel power generation on carbon dioxide emissions across China’s provinces. Renew. Energy 2019, 136, 317–330. [Google Scholar] [CrossRef]
- Zhu, B.; He, J.; Zhai, S. Does Financial Inclusion Create a Spatial Spillover Effect between Regions? Evidence from China. Emerg. Mark. Financ. Trade 2019, 55, 980–997. [Google Scholar] [CrossRef]
- Elebiolu, F. Spatial Spillover Effects of Mega-City Lockdown Due to COVID-19 Outbreak. Eurasian J. Bus. Econ. 2020, 13, 93–108. [Google Scholar]
- Nguyen, T.T.; Nguyen, H.T.; Hong, T.M. Determinants of Digital Banking Services in Vietnam: Applying UTAUT2 Model. Asian Econ. Financ. Rev. 2020, 10, 680–697. [Google Scholar] [CrossRef]
- Acolin, A.; Walter, R.J.; Tillyer, M.S. Spatial spillover effects of crime on private investment at nearby micro-places. Urban Stud. 2022, 59, 834–850. [Google Scholar] [CrossRef]
- Gomber, P.; Koch, J.A.; Siering, M. Digital Finance and FinTech: Current research and future research directions. J. Bus. Econ. 2017, 87, 537–580. [Google Scholar] [CrossRef]
- Ozili, P.K. Impact of digital finance on financial inclusion and stability. Borsa Istanb. Rev. 2018, 18, 329–340. [Google Scholar] [CrossRef]


Disclaimer/Publisher’s Note: The statements, opinions and data contained in all publications are solely those of the individual author(s) and contributor(s) and not of MDPI and/or the editor(s). MDPI and/or the editor(s) disclaim responsibility for any injury to people or property resulting from any ideas, methods, instructions or products referred to in the content. |
© 2023 by the authors. Licensee MDPI, Basel, Switzerland. This article is an open access article distributed under the terms and conditions of the Creative Commons Attribution (CC BY) license (https://creativecommons.org/licenses/by/4.0/).