Article

Fault Prediction Recommender Model for IoT Enabled Sensors Based Workplace

1
Chitkara University Institute of Engineering and Technology, Chitkara University, Chandigarh 140401, India
2
Department of Computer Science, Faculty of Computers and Information, Kafrelsheikh University, Kafr El-Sheikh 33516, Egypt
3
Department of Network and Communication Engineering, College of Computer Science and Information Systems, Najran University, Najran 61441, Saudi Arabia
4
Department of Computer Science, College of Computer Science and Information Systems, Najran University, Najran 61441, Saudi Arabia
5
Department of Information Systems, College of Computer Science and Information Systems, Najran University, Najran 61441, Saudi Arabia
6
KIET Group of Institutions, Delhi NCR, Ghaziabad 201206, India
*
Authors to whom correspondence should be addressed.
Sustainability 2023, 15(2), 1060; https://doi.org/10.3390/su15021060
Submission received: 25 November 2022 / Revised: 31 December 2022 / Accepted: 1 January 2023 / Published: 6 January 2023
(This article belongs to the Special Issue Artificial Intelligence Applications for Sustainable Urban Living)

Abstract

:
Industry 5.0 benefits from advancements being made in the field of machine learning and the Internet of Things. Different sensors have been installed in a variety of IoT devices present in different industries such as transportation, healthcare, manufacturing, agriculture, etc. The sensors present in these devices should automatically predict errors due to the extensive use of sensors in urban living. To ensure the integrity, precision, security, dependability and fidelity of sensor nodes, it is, therefore, necessary to foresee faults before they occur. Additionally, as more data is being collected by these devices every day, cloud computing becomes more necessary for sustainable urban living. The proposed model emphasizes solution recommendations for faults that occurred in real-life smart devices to mitigate faults at an early stage, which is a key requirement in today’s smart offices. The proposed model monitors the real-time health of IoT devices through an ML algorithm to make devices more efficient and increase the quality of life. Through the use of K-Nearest Neighbor, Decision Tree, Gaussian Naive Bayes and Random Forest approach, the proposed fault prediction recommender model has been evaluated and Random Forest shows the highest accuracy compared to other classifiers. Several performance indicators such as recall, accuracy, F1 score and precision were utilized to examine the performance of the model. The results have demonstrated the effectiveness of ML techniques applied to sensors in predicting faults in smart offices with Random Forest being observed as the best technique with a maximum accuracy of 94.27%. In future, deep learning can also be applied to bigger datasets to provide more accurate results.

1. Introduction

Internet of Things (IoT) is a network of physical and digital things that can be uniquely identified online. It is equipped with software, sensors and other technologies that connect to other appliances and exchange information with them. It analyses data and develops methods utilizing smart technology, Radio-frequency identification (RFID) [1], sensing apparatus and other technological breakthroughs. RFID tags track automation systems via radio frequency to search, identify, track and communicate with people. IoT can be enhanced by using some additional complementary technology advancements to close the gap between the real and virtual worlds [2,3]. Figure 1 depicts the cloud-based IoT architecture with four different layers. This architecture consists of a physical layer, a gateway layer, a process layer and cloud services layer. RFID, sensors, actuators and IoT enabled devices are used in the physical layer that collects data from the devices that are linked to the system. The process layer attempts to analyze the data obtained. The gateway layer connects sensors and IoT devices to cloud and manages network data through 4G, WiFi, etc. The most significant aspect of architecture based on cloud is a feature of cloud computing. It is in charge of carrying out the data gathered from users and industries for utilizing data algorithms for data analysis.
Automation is a key factor in economic growth of this golden age that has a positive impact on the progress of developing and developed nations [4,5]. The extensive use of sensors in the IoT environment has demanded automating the prediction of sensor faults in IoT devices. The automation sector uses cutting-edge technologies to boost the sector’s overall economic competitiveness. A crucial component of the automation sector, monitoring systems aid in increasing productivity, reducing costs, providing an early warning system, diagnosing diseases and many other things [6,7,8,9]. New technologies such as internet of things, cloud computing, artificial intelligence, etc. are deployed to enhance the performance of monitoring systems. The use of smart sensors in the monitoring process has many advantages, including improving working conditions, avoiding errors, problem diagnostics, quality prediction and assisting managers in making better decisions [10,11,12]. Since there are many IoT sensing devices every day, the volume of data produced by these devices is also increasing tremendously.
IoT is the combination of numerous technologies including real-time analytics and machine learning. Machine Learning (ML) is an important aspect of fault prediction that aids in obtaining more precise outcomes. Many algorithms and techniques in ML such as Genetic Algorithms (GA), Artificial Neural Networks (ANN), Multi-Layer Perceptrons (MLP), and Naive Bayes (NB) can be used to predict faults and save time [13]. To achieve better results, ML examines heterogeneous data automatically by employing smart models and algorithms in urban living. The techniques and algorithms used in ML differ in terms of how they work, their properties, precision, disadvantages, advantages and problem categories. If faults are not addressed in advance, the results can be disastrous and the process may be disrupted [14]. Due to the learning mechanism of classifiers, ML techniques have been regarded as the most promising approach. Predicting a fault before it occurs lowers the overall time and cost of the project. In addition, there is a requirement for a dependable and refined method for sustainable urban living. It has been employed in numerous applications over the past few years, including disaster prediction, remote application monitoring and home and office automation [15,16].
Office automation, which has been on the rise recently, is one of the IoT’s possible application areas. Office automation, commonly referred to as an intelligent office system, offers users a supported working environment that improves the caliber of their work [17,18]. By enhancing comfort and offering real-time monitoring and remote surveillance, office automation uses micro/nanoelectronic technology in the office setting to support and improve the quality of work as well as the life of its employees in smart urban living [19,20,21]. In research by World Environment and Social Outlook, 33.3% of those in employment, or 59.0% of the population, work more than forty-eight hours each week [22,23]. The number of individuals working and the number of hours they work both have an immediate and long-term impact on health. As lifestyle is evolving in this digital age, so it has an impact on employees’ personal health. However, multiple studies have demonstrated that spending so much time at the office is detrimental to one’s health. A survey found that long tenure in office was the cause of 51.9% of reported health problems [24]. In the automation sector, smart devices produce a lot of data and ML approaches are needed to address problems related to diagnosis [25]. This work’s fundamental breakthrough is the ability to foresee failures in any smart device in an office environment. Thus, the motivation behind this research is the early prediction of sensor faults in IoT devices that helps in achieving high reliability; thereby, increasing the life of IoT devices. The following list of research questions were answered in this study:
  • RQ 1: What are the main ML methods for fault prediction?
  • RQ 2: What various performance indicators are employed by the proposed ML algorithm?
  • RQ 3: What impact does the proposed work have on the well-being of office workers?
The major innovation of this research work is to demonstrate a real-time fault prediction recommender model for smart sensors using machine learning, and its application to an office environment with ubiquitous smart sensors. A prototype has been developed to create a real time scenario of an office environment that monitors IoT sensor nodes, predicts faults and recommend solutions. The cloud holds a tremendous amount of data that has been fetched by sensors present in smart office environment and a Random Forest classification technique is applied to fetched dataset to predict faults in an office environment. It also emphasizes solution recommendations for faults that occurred in real-life IoT-enabled devices to mitigate faults at an early stage; a key requirement in smart offices. Thus, the proposed work contributes in the following way:
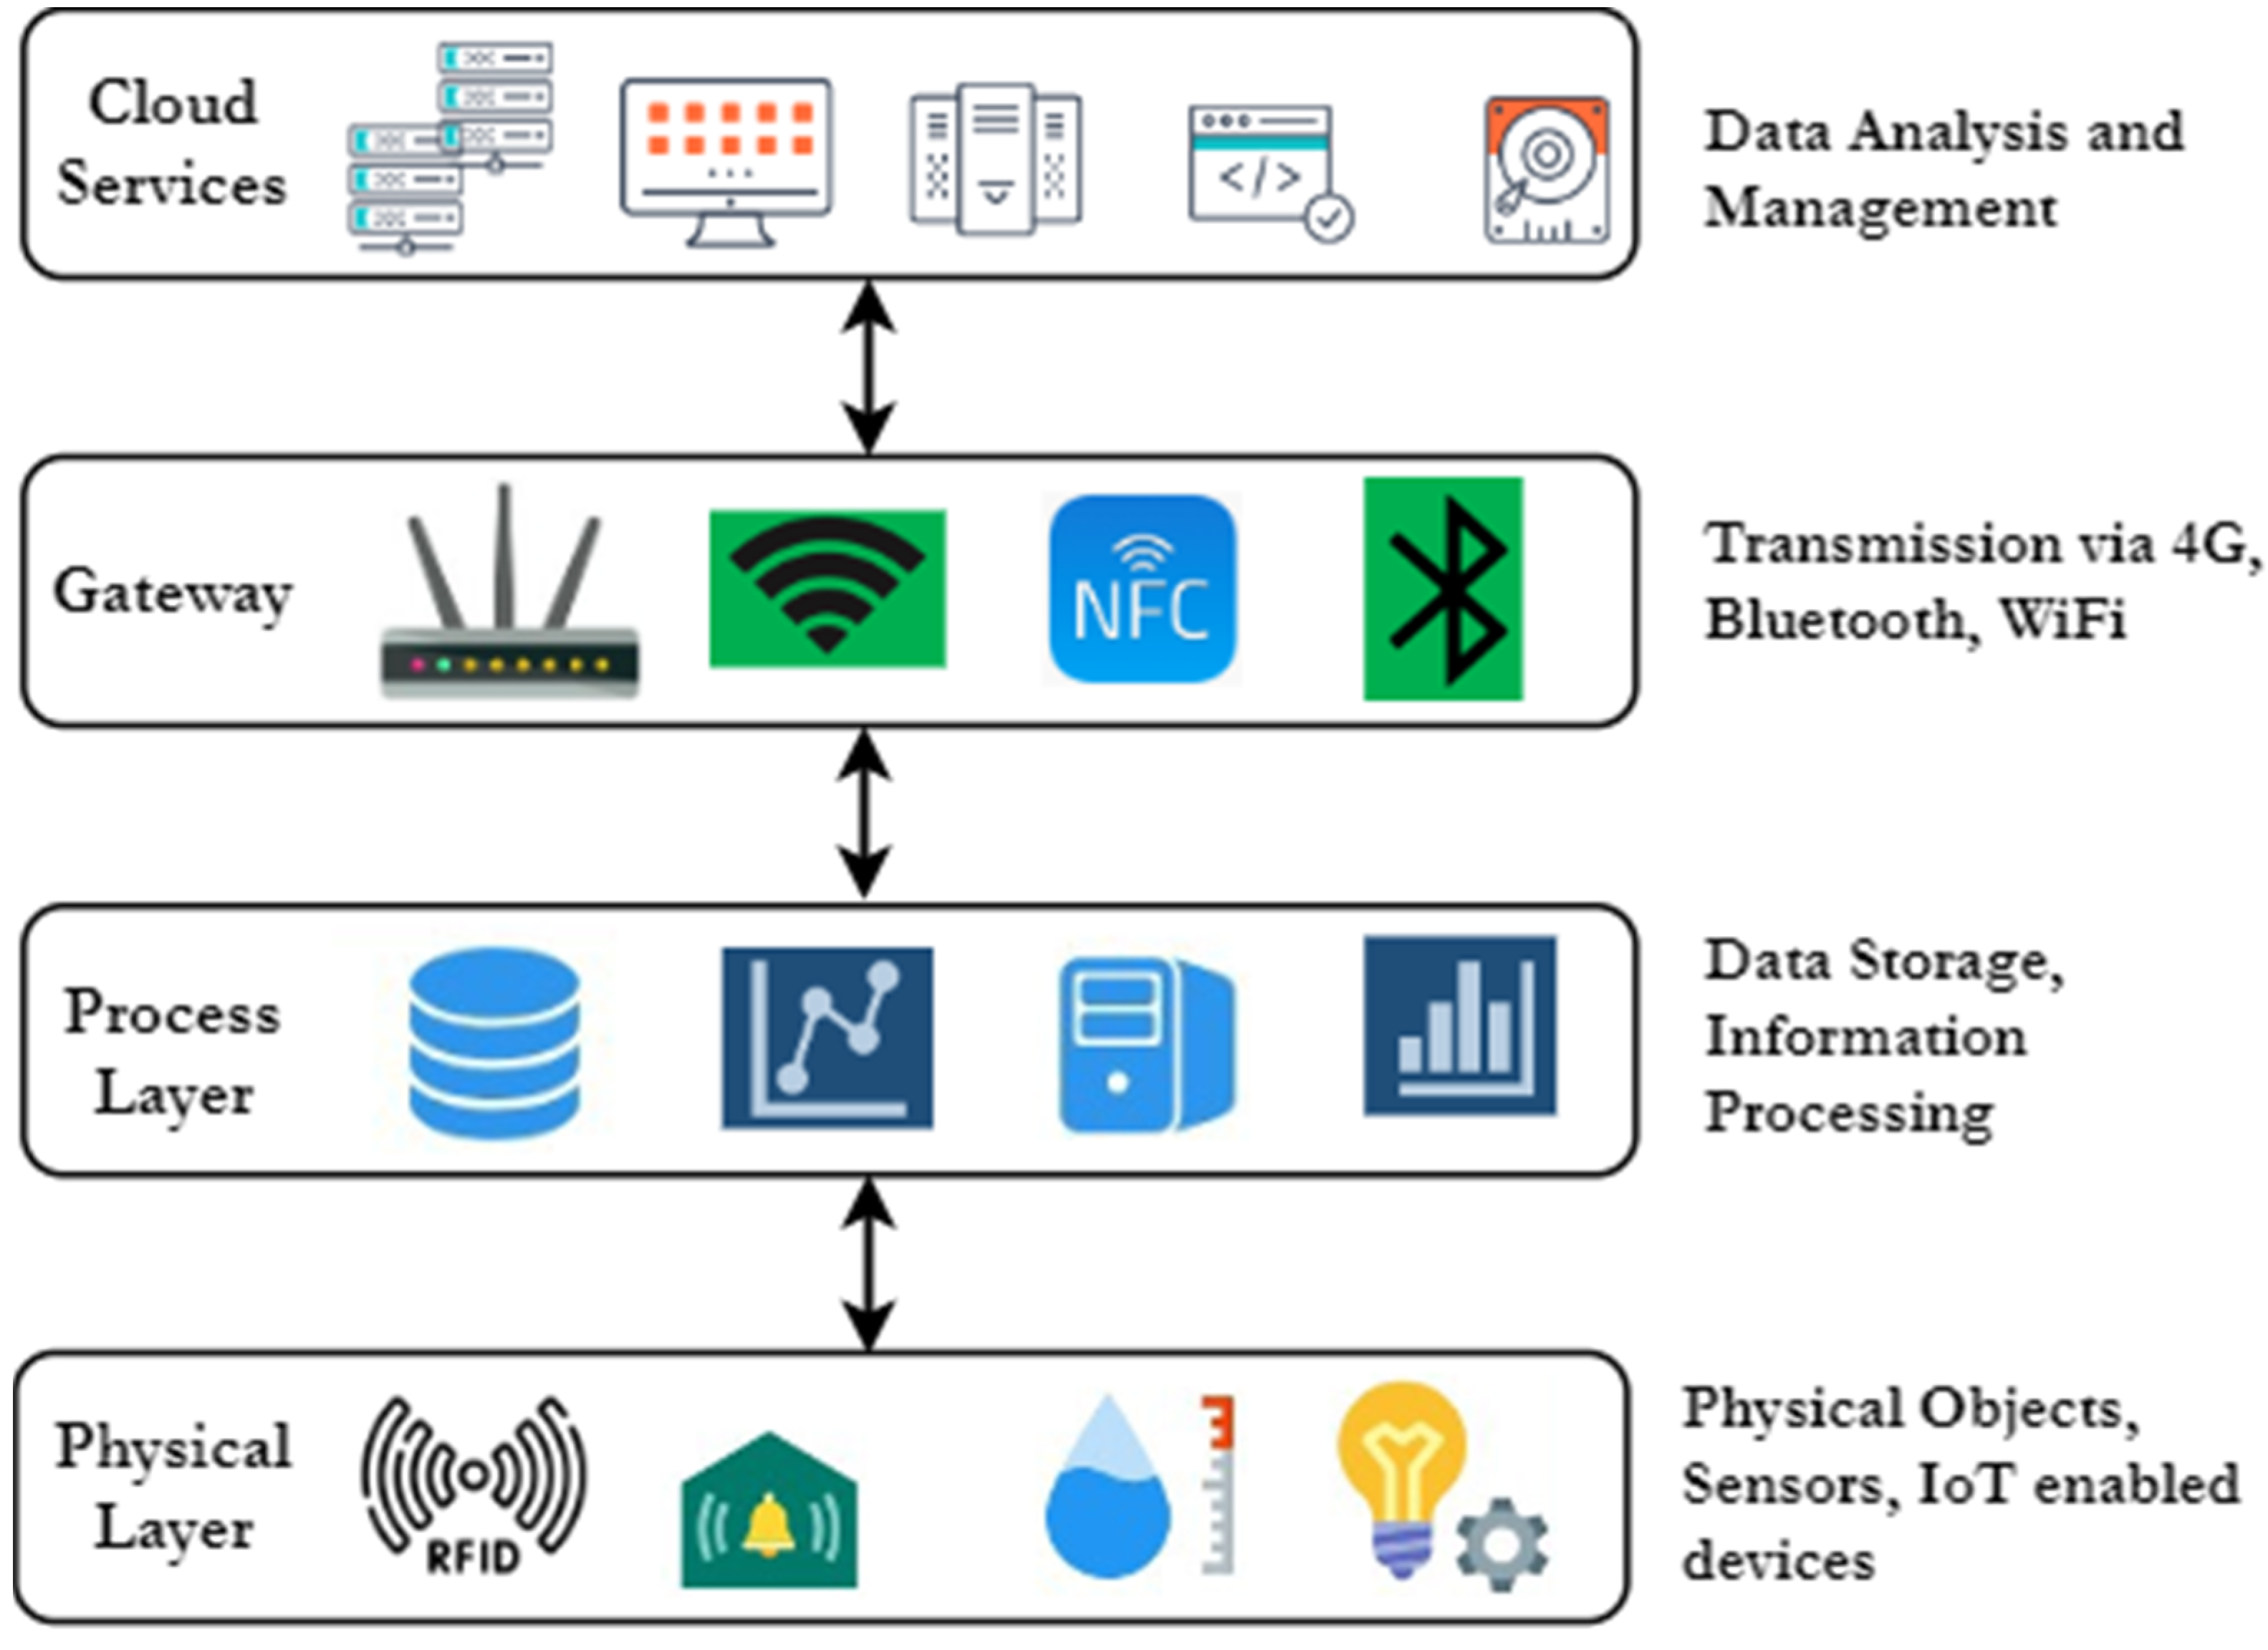
  • A detailed explanation of Cloud-based IoT architecture is given which focuses on different layers and their services.
  • Various sensors along with their range and distribution in the proposed model’s 3D design will also be depicted.
  • This paper also discusses detailed design of a prototype of the proposed smart office along with a circuit diagram.
  • A machine learning algorithm is implemented for a Fault Prediction Recommender Model (FPRM) which focuses on early prediction of faults after monitoring real-time sensor data present in an office environment.
  • A web application is developed to monitor the status of sensors and devices in real-time and display the faults with recommended solutions.
The remainder of the paper is structured as follows: The background and related work is elucidated in Section 2. Section 3 depicts a system design with a setup for the hardware platform. Section 4 describes the research methodology and Section 5 contains experiments and results. Section 6 contains discussions and recommendations for the FPRM for smart offices. Section 7 illustrates the conclusions and future scope.

2. Background and Related Works

Office automation has been in high demand in recent years. As a result, there are numerous commercial systems and research projects available in this domain. Sensors, machine learning and IoT are emerging technologies that are used to predict faults, minimize costs, provide early warnings and assist in making better choices. The following research work is closely related to the current study.
Jabbar et al. [26] created an IoT@HoMe system for monitoring home devices in real-time. Many actuators and sensors were linked to the NodeMCU controller for data updates on servers. The data from the sensors was viewed using the MQTT Dash phone app and the Adafruit IO web on a laptop. For security reasons, the end-user receives phone messages from the If This Then That (IFTTT) server regarding the abnormal condition of any device in their home. Oke et al. [27] demonstrated a low-complexity, low-cost microcontroller-based security door system that allows and denies access to the building using a smart card. A real-life prototype was also created with minimum cost. Verma and Tripathi [28] made a digital security system which proposes a door lock system via RFID technology. A centralized system was implemented to manage and transact operations. This system operates in real-time, so when a person places a tag in the reader, the door unlocks and check-in details are saved on the server. Mudita and Gupta [29] discussed the effectiveness of using recommender systems in IoT and discussed various IoT-based recommendation techniques which recommend solutions in the future [30]. Darianian and Michael [31] proposed an automated energy-saving system that tracks people entering and exiting the room and turns off the fan and light automatically. The fan’s speed was adjusted based on the temperature of the room. If the temperature does not drop, another AC or fan is turned on. The light intensity was reduced or increased based on the amount of sunlight. On the basis of human activity, a microcontroller was used to save electricity.
Gladence et al. [32] comprehended the advancements in automation field and examined the abilities of smart environments that detect user-end actions and motions to provide self-utilized assistance that increase the user’s convenience. Controlling electrical loads in the office requires the use of the internet, WiFi, and Android. This paper [33] proposes an intelligent fault prediction model based on an investigation of recent research in the domain of fault prediction. A technique called fall curve was identified to recognize a sensor fault via ACS712 current sensor value. They also summarized the various types of faults and their causes [34]. Katuk et al. [35] developed an automation system for the smart home comprised of smart appliances, one mobile phone and some firmware that are connected to a cloud server for data storage. Sarkar et al. [36] developed an embedded framework through RFID to provide a more effective and efficient innovation for metro rail that motivates an integrated ticket system. Using IoT and AI, Gobinath et al. [37] presented an automation system for turning on and off household appliances such as fridge, washing machine or an air conditioner. Harsha et al. [38] created an architecture of home/office automation system which links with clients through the use of various gestures based on easily accessible parameters. Ashraf et al. [39] created and deployed an automation system with user and administrator modes. The appliances were controlled by a smartphone app built into Android Studio. The user can control the devices both locally and remotely [40,41]. All home appliances have access to the Microsoft Azure cloud database server. Data logging is used to recover sensor data in the event of an electrical outage. Furthermore, the user’s preferences can be set, and those requirements can be met [42]. Users are notified if any device runs for more than 2 h. This system is simple, inexpensive, and dependable [43].

3. System Design

The fault prediction recommender model (FPRM) monitors real-time data retrieved from various devices and sensors and predicts faults at an early stage [44]. The model’s layout includes three office rooms, one washroom, one waiting lounge, and one pantry. A 3D layout of office environment created with the Planner 5D tool having sensor distribution is depicted in Figure 2.

Setup for Hardware Platform

In this paper, Table 1 lists the digital sensors used in the proposed model, along with their specifications and snapshots.
The ACS712 current sensor has an output sensitivity of 66 to mV/A 185 mV/A, 2.1 kVRMS voltage isolation, and an 80 kHz bandwidth. Table 2 displays the current sensors used in the various devices implemented in the proposed model. Different devices necessitate a different current range (in Ampere).

4. Research Methodology

The proposed methodology for a smart office environment integrates cloud, IoT and ML into a revolutionary paradigm for sustainable urban living [45]. In order to increase the performance and reliability of smart appliances, faults are anticipated. Monitoring changes in values that potentially result in a fault can be controlled at an earlier stage and the fault dataset and current status of devices can also be preserved. Hence, to improve the performance of every device, the proposed architecture retrieves information from all office appliances. Then, the sensor data are analyzed with a machine learning algorithm to predict potential future faults. The cloud server is linked to the database containing this data. An ML algorithm is used for the identification, categorization and prediction of faults in smart urban living [46]. Different operations performed during fault classification using a machine learning algorithm includes preprocessing, exploratory data analysis, classification and calculating results for the fetched data [47]. The end user will be informed of this information and given recommendations for solutions via a web application. The user-friendly web application monitors all appliances and notifies the user when any one of them deviates from a regular operation [48].
Figure 3 depicts a flowchart of the operations carried out in the proposed system step by step. To start, all of the smart devices in the office are activated and their data is sent to the Arduino platform, an open-source electronics platform based on easy-to-use hardware and software able to read inputs as light on a sensor, a finger on a button and turn it into an output such as activating a motor. Arduino controls both the analog and digital sensors used to collect data, by retrieving data and transmitting it to a cloud server [49] via a Wi-229 Fi unit. If data from an analog sensor is received at the server end, it will be processed by a machine learning algorithm to predict faults [50]. If a fault occurs, the fault classification process is initiated; otherwise, the data is saved in a cloud database. Digital sensor data is also checked for errors and if one is found, an error message is displayed on the web application [51,52]. After inspecting analog and digital sensors for faults [53], a final accumulated dataset is saved on the cloud database and data is sent to a web application that recommends solutions [54].

5. Experiments and Results

The proposed model keeps track of the condition of the electrical equipment and sensors used in smart offices in case of any early faults. The proposed model has utilized an Arduino Mega 2560 Rev 3 microcontroller for failure prediction. ACS712 sensor, MQ 135 air quality sensor, DHT11 temperature and humidity sensor, flame sensor, HC-SR04 ultrasonic sensor, ESP 8266 Wi-Fi module and a smartphone are some of the additional components used. The 16 × 2 LCD panel on the model displays the actual time and the status of all the sensors. The Wi-Fi module transmits all the information on the mobile application to suggest solutions to the user for hardware issues.
The prototype is constructed using the board and assembled using glue in accordance with the arrangement of sensor distribution in the form of a 3D design placed in a smart office (as shown in Figure 2). Following the prototype design, the model is filled with electrical devices, sensors and furnishings. On the model, there are a few switches that can induce a device error. A sliding door equipped with an ultrasonic motion sensor is used to open and close the main entrance door. This motion sensor, which is located on the door, recognizes human motion. The complete model and circuit diagram for the proposed model, which is used in a smart office to continuously check device status and performance, is shown in Figure 4.
To track the real-time values of sensor data, the JavaScript framework is used for data visualization. With the help of the proposed system, users may keep an eye on the status of their appliances and get a warning when something is wrong as shown in Figure 5. The colors shown in the figure define the status of the device. The green color symbolizes working fine, blue means need to repair and red means need to replace. In this, the recommendations are also given according to the values received by the sensors and devices. The values of temperature, humidity, air quality, fire and motion sensors are represented in the application. A total of four cases are there, namely, working fine, can be repaired, needs replacement and main power supply off. If the values remain out of bounds for less than 20 iterations, then it comes under a repair case, otherwise, a replace case. The values are recorded to send the output in one of the above cases which are represented by the application and the user is informed regarding the same. IoT-based sensors transmit information to a cloud server where a machine learning algorithm is used for forecasting errors. The errors are immediately sent to the monitoring system which notifies the user via a web application. In a smart office, IoT-based sensors and appliances are placed and their data is sent to the server every second. Figure 6 depicts the image of the dataset created to determine the state of devices at each and every instance.
The classification models for the fetched dataset were run in Python. The collected dataset was classified into four classes: working fine, power supply off, need repair, or need replacement during the process. The data collection was assessed using several metrics utilizing four machine learning classification models, namely, Random Forest (RF), Decision tree (DT), Gaussian Naïve Bayes (GNB) and K-Nearest Neighbor (KNN).
Recall, accuracy, precision and F1 score were the performance metrics used by the proposed machine learning classification model to determine which was the model that better classified faulty devices. Accuracy indicates how many instances were correctly predicted. The precision metric determines the likelihood that among the devices labeled as fault-prone, a device is actually faulty or not. A less amount of accurately predicting faulty devices or a larger amount of inaccurately labeling fault-free devices will result in a lower precision rate. The recall indicating the amount of accurate hits discovered is represented by the recall and the F1 Score, which is the weighted average of accuracy and recall. The various metrics used to assess the performance of ML models are shown in the equations below. Precision and recall are represented by Equations (1) and (2), respectively. Equations (3) and (4) represent accuracy and the F1-score, respectively (4).
Precision = (True Positive)/(True Positive + False Positive)
Recall = (True Positive)/(True Positive + False Positive)
Accuracy = (True Negative + True Positive)/(True Positive + False Positive + True Negative + False Negative)
F1 score = (2 True Positive)/(2 True Positive + False Positive + False Negative)
There are two categories: positive and negative, such as survived/not survived, fraud/not fraud, spam/not spam, etc. Whether you view one as a good or a negative depends on the study’s goal and is arbitrary. It has neither a good (positive) nor a poor (negative) aspect. An IoT-based algorithm is proposed for office conditions monitoring and assessing the status of devices and sensors locally and remotely for fault prediction. In order to update the status of the sensors and appliances on the cloud server, the values are fetched from the ACS712 sensor and uploaded to the Arduino IoT Cloud Server using Wi-Fi. The sensor data is fetched from the cloud server, processed using Decision Trees, Random Forest, k-Nearest Neighbors, and Naive Bayes to anticipate faults, and then synced to the web application. In order to provide recommendations, the predicted data from the machine learning algorithm can be divided into cases. By using a web application that offers recommendations for solutions, the user can remotely monitor the data from sensors and appliances.
An accuracy of 92.3% and 92.8% was obtained using Gaussian Naive Bayes (GNB) and K-Nearest Neighbor (KNN), respectively. The accuracy decreased (92.1%) using a Decision tree (DT), while the RF algorithm showed the highest accuracy (94.27%). The RF algorithm yields also showed the highest F1 score (93.54%), recall (94.327%) and precision (92.82%). The models’ performance metrics such as recall, precision, accuracy and F1 score for the four models GNB, KNN, RF and DT are presented in Table 3.
The metric values of various machine learning models are shown in Figure 7. When compared to other technologies, RF has the highest accuracy (94.27%) and recall (94.27%).
A confusion matrix, also called an error matrix, is used in machine learning to display the statistical categorization of a problem. This matrix assists in visualizing how well a machine learning algorithm is performing when applied to supervised learning. Every column in the matrix exhibits instances of a predicted label, whereas every row exhibits instances of an actual label. It is simple to determine whether a system is confused between two classes or not using the confusion matrix. The confusion matrix for DT, GNB, KNN, and RF are shown in Figure 8.
In our dataset there was a significant class imbalance as the non-faulty cases were much greater than the faulty cases and that the precision and the recall metrics were calculated using true and false positive values. The Precision-Recall (PR) curve was used to visually compare the classification models whereas a ROC curve was unable to show the differences between several methods. In a PR curve, precision is represented on the y-axis and recall is represented on the x-axis and the accuracy is maximized and said to be the most if the precision as well as the recall values are closest to ‘1’. The PR curves for RF, KNN, DT and GNB are shown in Figure 9, respectively.
A standard graph for showing how well the classification model performs across all of its thresholds is the Receiver Operating Characteristic (ROC) curve. The false positive rate and true positive rate are the two metrics that this curve plots. To determine how well a classifier model will function, the ROC curve is examined. The classifier’s ability to accurately identify the faulty and non-faulty appliance is visually compared via the ROC curve. The Area Under the ROC (AUC) curve, which is closely connected to the ROC curve, serves as a numerical indication for assessing the effectiveness of multiple classification models based on the same dataset. The AUC curve aids in separating the effectiveness of various ML classification algorithms on the same dataset. The classifier that produces the ROC curve closer to the top-left corner performs better as compared to the curve along with the diagonal. The closer the curve is to the 45-degree diagonal, the less accurate is the classifier. The plots shown in the graph, that is closest to the top-left corner, shows its best accuracy in detecting faulty and non-faulty devices. ROC curves for various classes of RF classifiers are shown in Figure 10.

6. Discussions and Recommendations

The proposed fault prediction recommender model recommends solutions for incorrect values on sensors and devices. Brown indicates that the device is turned off, green indicates that it is operationally sound, blue indicates that maintenance is required and wine indicates that it needs to be replaced. Table 4 lists solutions and suggested recommendations for the various smart office appliances.
The fault injection mechanism purposefully inserts faults into the devices before testing the efficiency of its fault management in a prototype. A problem can be caused by a variety of events in various IoT ecosystem scenarios. Therefore, when a failure arises, fault injection determines whether it can be automatically fixed, whether it needs to be replaced, or whether it should check the state of other devices. In this research, smart devices are given problems to see if they need to be repaired or replaced.
Figure 11 shows the switches present in the model to inject a fault into a device. Figure 12 illustrates the best course of action for fault injection in sensors and devices. The printer, temperature and humidity sensors all have induced faults and the values of these sensors are well represented in the image.

7. Conclusions and Future Scope

The research work focuses on implementing a fault prediction recommender model for smart sensors using machine learning, and its application to an office environment having ubiquitous smart sensors. In this paper, the authors have created a smart office environment that uses the internet to monitor and operate appliances with sensors such as flame, ultrasonic, temperature, and humidity sensors as well as current, air quality, and temperature sensors. The model continuously monitors and assesses the device and sensor values to ensure proper operation for sustainable urban living. The data are then sent to the cloud, where an ML fault prediction algorithm uses intelligence to process it for fault prediction. Additionally, many appliances are listed together with their values, proposed recommendations and solutions. The effectiveness of the proposed model has been examined using a variety of metrics, namely, accuracy, recall, F1 score and precision. IoT-based sensors have provided an effective recommendation in every trial since they successfully gathered and disseminated data in a shorter amount of time and at a lower cost. The dataset’s description is also provided in JSON format. Through remote access with secure authentication and minimal cost, data is monitored in real time for smart urban living. This paper also includes the circuit design for the suggested office model and a functioning prototype. Out of the total of four prediction models, Random Forest performed best having the highest accuracy, precision and recall, followed by K-Nearest Neighbor which had an accuracy of 92.82%. In the retrieved dataset, the Decision Tree was found to be the least effective method for fault prediction in an office environment. The findings have demonstrated the effectiveness of the constructed model with the highest accuracy of 94.27%. In the future, more ML techniques shall be applied to enhance the research work. The security of sensor data can also be taken into consideration for future development because it is a difficult challenge to secure data kept on cloud storage when there are so many connected smart devices.

Author Contributions

Conceptualization, M.U., D.G., A.M. and M.A.E.; methodology, A.S. (Adel Sulaiman), M.S.A.R., S.J. and A.S. (Asadullah Shaikh); software, M.U., D.G. and A.S. (Adel Sulaiman); validation, A.M., M.S.A.R. and A.S. (Asadullah Shaikh); formal analysis, M.A.E. and S.J.; investigation, M.U. and A.S. (Asadullah Shaikh); resources, A.S. (Adel Sulaiman) and M.A.E.; data curation, D.G., A.M. and M.S.A.R.; writing—original draft preparation, M.U., D.G., A.M. and M.A.E.; writing—review and editing, A.S. (Adel Sulaiman)., M.S.A.R., S.J. and A.S. (Asadullah Shaikh); visualization, A.S. (Adel Sulaiman); supervision, A.S. (Asadullah Shaikh); project administration, M.U. and S.J.; funding acquisition, A.S. (Adel Sulaiman). All authors have read and agreed to the published version of the manuscript.

Funding

The authors are thankful to the Deanship of Scientific Research at Najran University for funding this work under the Research Collaboration Funding program grant code (NU/RC/SERC/11/7).

Conflicts of Interest

The authors declare no conflict of interest.

References

  1. Sunchu, R.; Palli, S.; Datta, V.S.R.; Shanmugasundaram, M. Intelligent system for office environment using internet of things. In Proceedings of the 2019 3rd International Conference on Trends in Electronics and Informatics (ICOEI), Tirunelveli, India, 23–25 April 2019; pp. 717–721. [Google Scholar]
  2. Plessis, A.d.; Theron, B. Virtual World—Physical World: What is the Real World? Int. J. Manag. Sci. Bus. Adm. 2016, 2, 42–54. [Google Scholar] [CrossRef] [Green Version]
  3. Rout, K.K.; Mallick, S.; Mishra, S. Design and implementation of an internet of things based prototype for smart home automation system. In Proceedings of the 2018 International Conference on Recent Innovations in Electrical, Electronics & Communication Engineering (ICRIEECE), Bhubaneswar, India, 27–28 July 2018; pp. 67–72. [Google Scholar]
  4. Prettner, K. A note on the implications of automation for economic growth and the labor share. Macroecon. Dyn. 2019, 23, 1294–1301. [Google Scholar] [CrossRef]
  5. Acemoglu, D.; Restrepo, P. Secular stagnation? The effect of aging on economic growth in the age of automation. Am. Econ. Rev. 2017, 107, 174-79. [Google Scholar] [CrossRef] [Green Version]
  6. Mora, H.; Gil, D.; Terol, R.M.; Azorín, J.; Szymanski, J. An IoT-based computational framework for healthcare monitoring in mobile environments. Sensors 2017, 17, 2302. [Google Scholar] [CrossRef] [PubMed] [Green Version]
  7. Zhang, X.; Zhang, J.; Li, L.; Zhang, Y.; Yang, G. Monitoring citrus soil moisture and nutrients using an IoT based system. Sensors 2017, 17, 447. [Google Scholar] [CrossRef]
  8. Manes, G.; Collodi, G.; Gelpi, L.; Fusco, R.; Ricci, G.; Manes, A.; Passafiume, M. Realtime gas emission monitoring at hazardous sites using a distributed point-source sensing infrastructure. Sensors 2016, 16, 121. [Google Scholar] [CrossRef] [PubMed] [Green Version]
  9. Cheung, W.F.; Lin, T.H.; Lin, Y.C. A real-time construction safety monitoring system for hazardous gas integrating wireless sensor network and building information modeling technologies. Sensors 2018, 18, 436. [Google Scholar] [CrossRef] [PubMed] [Green Version]
  10. Moon, Y.S.; Choi, H.R.; Kim, J.J.; Kim, D.W.; Cho, J.H.; Kim, J.W.; Jeong, J.W. Development of IoT-based sensor tag for smart factory. Int. Res. J. Electron. Comput. Eng. 2017, 3, 28–31. [Google Scholar] [CrossRef] [Green Version]
  11. Li, J.; Xie, J.; Yang, Z.; Li, J. Fault diagnosis method for a mine hoist in the internet of things environment. Sensors 2018, 18, 1920. [Google Scholar] [CrossRef] [Green Version]
  12. Lee, J.; Noh, S.D.; Kim, H.J.; Kang, Y.S. Implementation of cyber-physical production systems for quality prediction and operation control in metal casting. Sensors 2018, 18, 1428. [Google Scholar] [CrossRef]
  13. Bhatnagar, A.; Shukla, S.; Majumdar, N. Machine learning techniques to reduce error in the internet of things. In Proceedings of the 2019 9th International Conference on Cloud Computing, Data Science & Engineering (Confluence), Noida, India, 10–11 January 2019; pp. 403–408. [Google Scholar]
  14. Qian, B.; Su, J.; Wen, Z.; Jha, D.N.; Li, Y.; Guan, Y.; Puthal, D.; James, P.; Yang, R.; Zomaya, A.Y.; et al. Orchestrating the development lifecycle of machine learning-based IoT applications: A taxonomy and survey. ACM Comput. Surv. (CSUR) 2020, 53, 1–47. [Google Scholar] [CrossRef]
  15. Fahim, M.; Fatima, I.; Lee, S.; Lee, Y.K. Daily life activity tracking application for smart homes using android smartphone. In Proceedings of the 2012 14th International conference on advanced communication technology (ICACT), PyeongChang, Republic of Korea, 19–22 February 2012; pp. 241–245. [Google Scholar]
  16. Patchava, V.; Kandala, H.B.; Babu, P.R. A smart home automation technique with raspberry pi using iot. In Proceedings of the 2015 International conference on smart sensors and systems (IC-SSS), Bangalore, India, 21–23 December 2015; pp. 1–4. [Google Scholar]
  17. Abella, C.S.; Bonina, S.; Cucuccio, A.; D’Angelo, S.; Giustolisi, G.; Grasso, A.D.; Imbruglia, A.; Mauro, G.S.; Nastasi, G.A.; Palumbo, G.; et al. Autonomous energy-efficient wireless sensor network platform for home/office automation. IEEE Sens. J. 2019, 19, 3501–3512. [Google Scholar] [CrossRef]
  18. Byun, J.; Jeon, B.; Noh, J.; Kim, Y.; Park, S. An intelligent self-adjusting sensor for smart home services based on ZigBee communications. IEEE Trans. Consum. Electron. 2012, 58, 794–802. [Google Scholar] [CrossRef]
  19. Foster, T.W.; Bhatt, D.V.; Hancke, G.P.; Silva, B. A web-based office climate control system using wireless sensors. IEEE Sens. J. 2016, 16, 6104–6113. [Google Scholar] [CrossRef] [Green Version]
  20. Kelly, S.D.T.; Suryadevara, N.K.; Mukhopadhyay, S.C. Towards the implementation of IoT for environmental condition monitoring in homes. IEEE Sens. J. 2013, 13, 3846–3853. [Google Scholar] [CrossRef]
  21. He, C.; Fan, X.; Li, Y. Toward ubiquitous healthcare services with a novel efficient cloud platform. IEEE Trans. Biomed. Eng. 2012, 60, 230–234. [Google Scholar] [CrossRef] [PubMed]
  22. Hossain, M.S.; Muhammad, G. Cloud-assisted industrial internet of things (iiot)–enabled framework for health monitoring. Comput. Netw. 2016, 101, 192–202. [Google Scholar] [CrossRef]
  23. International Labour Office. World Employment and Social Outlook: Trends 2015; International Labour Organization: Geneva, Switzerland, 2015. [Google Scholar]
  24. Yu, W.; Lao, X.Q.; Pang, S.; Zhou, J.; Zhou, A.; Zou, J.; Mei, L.; Yu, I.T.S. A survey of occupational health hazards among 7610 female workers in China’s electronics industry. Arch. Environ. Occup. Health 2013, 68, 190–195. [Google Scholar] [CrossRef]
  25. Ademujimi, T.T.; Brundage, M.P.; Prabhu, V.V. A review of current machine learning techniques used in manufacturing diagnosis. In Proceedings of the IFIP International Conference on Advances in Production Management Systems, Hamburg, Germany, 3–7 September 2017; pp. 407–415. [Google Scholar]
  26. Jabbar, W.A.; Kian, T.K.; Ramli, R.M.; Zubir, S.N.; Zamrizaman, N.S.; Balfaqih, M.; Shepelev, V.; Alharbi, S. Design and fabrication of smart home with internet of things enabled automation system. IEEE Access 2019, 7, 144059–144074. [Google Scholar] [CrossRef]
  27. Oke, A.O.; Olaniyi, O.M.; Arulogun, O.T.; Olaniyan, O.M. Development of a microcontroller-controlled security door system. Pac. J. Sci. Technol. 2009, 10, 398–403. [Google Scholar]
  28. Verma, G.K.; Tripathi, P. A digital security system with door lock system using RFID technology. Int. J. Comput. Appl. 2010, 5, 6–8. [Google Scholar] [CrossRef]
  29. Mudita Gupta, D. A comprehensive study of recommender systems for the internet of things. In Journal of Physics: Conference Series; IOP Publishing: Bristol, UK, 2021; Volume 1969, p. 012045. [Google Scholar]
  30. Uppal, M.; Gupta, D.; Juneja, S.; Dhiman, G.; Kautish, S. Cloud-based fault prediction using IoT in office automation for improvisation of health of employees. J. Healthc. Eng. 2021, 2021, 8106467. [Google Scholar] [CrossRef] [PubMed]
  31. Darianian, M.; Michael, M.P. Smart home mobile RFID-based Internet-of-Things systems and services. In Proceedings of the 2008 International Conference on Advanced Computer Theory and Engineering, Phuket, Thailand, 20–22 December 2008; pp. 116–120. [Google Scholar]
  32. Gladence, L.M.; Karthi, M.; Anu, V.M. A statistical comparison of logistic regression and different Bayes classification methods for machine learning. ARPN J. Eng. Appl. Sci. 2015, 10, 5947–5953. [Google Scholar]
  33. Mudita; Gupta, D. Prediction of Sensor Faults and Outliers in IoT Devices. In Proceedings of the 2021 9th International Conference on Reliability, Infocom Technologies and Optimization (Trends and Future Directions) (ICRITO), Noida, India, 3–4 September 2021; pp. 1–5. [Google Scholar]
  34. Uppal, M.; Gupta, D.; Anand, D.; SAlharithi, F.; Almotiri, J.; Ortega-Mansilla, A.; Singh, D.; Goyal, N. Fault pattern diagnosis and classification in sensor nodes using fall curve. Comput. Mater. Contin. 2022, 72, 1799–1814. [Google Scholar] [CrossRef]
  35. Katuk, N.; Ku-Mahamud, K.R.; Zakaria, N.H.; Maarof, M.A. Implementation and recent progress in cloud-based smart home automation systems. In Proceedings of the 2018 IEEE Symposium on Computer Applications & Industrial Electronics (ISCAIE), Penang, Malaysia, 28–29 April 2018; pp. 71–77. [Google Scholar]
  36. Sarkar, D.; Patel, H.; Dave, B. Development of integrated cloud-based Internet of Things (IoT) platform for asset management of elevated metro rail projects. Int. J. Constr. Manag. 2022, 22, 1993–2002. [Google Scholar] [CrossRef]
  37. Gobinath, V.; Gladence, L.M.; Haran, S.H.; Sathiyavathi, R.; Anu, V.M. Home and office automation system-survey. In Proceedings of the 2017 Third International Conference on Science Technology Engineering & Management (ICONSTEM), Chennai, India, 23–24 March 2017; pp. 435–440. [Google Scholar]
  38. Harsha, S.S.; Reddy, S.C.; Mary, S.P. Enhanced home automation system using Internet of Things. In Proceedings of the 2017 International Conference on I-SMAC (IoT in Social, Mobile, Analytics and Cloud) (I-SMAC), Palladam, India, 10–11 February 2017; pp. 89–93. [Google Scholar]
  39. Ashraf, I.; Umer, M.; Majeed, R.; Mehmood, A.; Aslam, W.; Yasir, M.N.; Choi, G.S. Home automation using general purpose household electric appliances with Raspberry Pi and commercial smartphone. PLoS ONE 2020, 15, e0238480. [Google Scholar] [CrossRef]
  40. Lenka, R.K.; Rath, A.K.; Sharma, S. An Energy Efficient WSN Assisted IoT Platform for Home/Office Automation to enable Green IoT. Solid State Technol. 2020, 63, 16117–16131. [Google Scholar]
  41. Gladence, L.M.; Sivakumar, H.H.; Venkatesan, G.; Priya, S.S. Home and office automation system using human activity recognition. In Proceedings of the 2017 International conference on communication and signal processing (ICCSP), Chennai, India, 6–8 April 2017; pp. 0758–0762. [Google Scholar]
  42. Sharma, S.; Gupta, K.; Turabieh, H.; Sharma, S. SWOT: A Hybrid Hardware-Based Approach for Robust Fault-Tolerant Framework in a Smart Day Care. Secur. Commun. Netw. 2022, 2022, 2939469. [Google Scholar] [CrossRef]
  43. Uppal, M.; Sulaiman, A.; Rajab, K.; Rajab, A.; Elmagzoub, M.A.; Shaikh, A. Cloud-Based Fault Prediction for Real-Time Monitoring of Sensor Data in Hospital Environment Using Machine Learning. Sustainability 2022, 14, 11667. [Google Scholar] [CrossRef]
  44. Juneja, S.; Juneja, A.; Dhiman, G.; Behl, S.; Kautish, S. An approach for thoracic syndrome classification with convolutional neural networks. Comput. Math. Methods Med. 2021, 2021, 3900254 . [Google Scholar] [CrossRef] [PubMed]
  45. Sharma, S.; Gupta, S.; Gupta, D.; Singal, G.; Dhiman, G.; Kautish, S. Recognition of gurmukhi handwritten city names using deep learning and cloud computing. Sci. Program. 2022, 2022, 5945117 . [Google Scholar] [CrossRef]
  46. Dhiman, G.; Rashid, J.; Kim JViriyasitavat, W.; Gulati, K. Privacy for healthcare data using the byzantine consensus method. IETE J. Res. 2022, 1–12. [Google Scholar] [CrossRef]
  47. Kour, K.; Gupta, S.; Viriyasitavat, W.; Mohafez, H.; Islam, M.A. Smart-hydroponic-based framework for saffron cultivation: A precision smart agriculture perspective. Sustainability 2022, 14, 1120. [Google Scholar] [CrossRef]
  48. Dhall, A.; Upadhyay, H.K. Machine Learning Algorithms for Industry Using Image Sensing. In Healthcare Solutions Using Machine Learning and Informatics; Auerbach Publications: Boca Raton, FL, USA, 2022; pp. 75–97. [Google Scholar]
  49. Upadhyay, C.; Upadhyay, H.K. Plant Disease Detection Using Imaging Sensors, Deep Learning and Machine Learning for Smart Farming. In Healthcare Solutions Using Machine Learning and Informatics; Auerbach Publications: Boca Raton, FL, USA, 2022; pp. 173–185. [Google Scholar]
  50. Srinivasu, P.N.; Bhoi, A.K.; Jhaveri, R.H.; Reddy, G.T.; Bilal, M. Probabilistic deep Q network for real-time path planning in censorious robotic procedures using force sensors. J. Real-Time Image Process. 2021, 18, 1773–1785. [Google Scholar] [CrossRef]
  51. Wang, H.; Li, X.; Jhaveri, R.H.; Gadekallu, T.R.; Zhu, M.; Ahanger, T.A.; Khowaja, S.A. Sparse Bayesian learning based channel estimation in FBMC/OQAM industrial IoT networks. Comput. Commun. 2021, 176, 40–45. [Google Scholar] [CrossRef]
  52. Arikumar, K.S.; Prathiba, S.B.; Alazab, M.; Gadekallu, T.R.; Pandya, S.; Khan, J.M.; Moorthy, R.S. FL-PMI: Federated learning-based person movement identification through wearable devices in smart healthcare systems. Sensors 2022, 22, 1377. [Google Scholar] [CrossRef]
  53. Nafea, O.; Abdul, W.; Muhammad, G.; Alsulaiman, M. Sensor-based human activity recognition with spatio-temporal deep learning. Sensors 2021, 21, 2141. [Google Scholar] [CrossRef]
  54. Altaheri, H.; Muhammad, G.; Alsulaiman, M.; Amin, S.U.; Altuwaijri, G.A.; Abdul, W.; Bencherif, M.A.; Faisal, M. Deep learning techniques for classification of electroencephalogram (EEG) motor imagery (MI) signals: A review. Neural Comput. Appl. 2021, 1–42. [Google Scholar] [CrossRef]
Figure 1. Cloud-based IoT architecture.
Sustainability 15 01060 g001
Figure 2. Sensor distribution in the proposed model’s 3D design.
Sustainability 15 01060 g002
Figure 3. Flowchart of proposed system operations.
Sustainability 15 01060 g003
Figure 4. A prototype of the proposed smart office with circuit diagram.
Sustainability 15 01060 g004
Figure 5. Fault recommendations using web application.
Sustainability 15 01060 g005
Figure 6. Monitoring of sensor data in real-time for all classes.
Sustainability 15 01060 g006
Figure 7. Performance evaluation of the DT, GNB, KNN, and RF.
Sustainability 15 01060 g007
Figure 8. Representation of confusion matrix for the trained DT, GNB, KNN and RF models. (a) Confusion matrix of DT trained model; (b) Confusion matrix of GNB trained model; (c) Confusion matrix of KNN trained model; (d) Confusion matrix of RF trained model.
Sustainability 15 01060 g008aSustainability 15 01060 g008b
Figure 9. The PR curves for the classifiers KNN, DT, GNB and RF. (a) PR curve of KNN classifier; (b) PR curve of DT classifier; (c) PR curve of GNB classifier; (d) PR curve of RF classifier.
Sustainability 15 01060 g009aSustainability 15 01060 g009b
Figure 10. ROC curves for four different classes of Random Forest classifier. (a) “OFF” class-ROC curve; (b) “FINE” class-ROC curve; (c) “REPAIR” class-ROC curve; (d) “REPLACE” class-ROC curve.
Sustainability 15 01060 g010aSustainability 15 01060 g010b
Figure 11. Fault injection via switches.
Sustainability 15 01060 g011
Figure 12. Fault recommendations via fault injection.
Sustainability 15 01060 g012
Table 1. Different sensors used in the proposed model.
Sensor NameSpecificationsSnapshot
DHT11 Temperature and Humidity Sensor
  • 4 pins
  • 3V-5V input-output power
  • 2.5mA maximum current
  • Low cost
  • Size of body: 15.5 mm × 12 mm × 5.5 mm
Sustainability 15 01060 i001
MQ135 Air Quality Sensor
  • Detect a wide range of gases
  • High Sensitivity
  • Detection Range of 10–1000 ppm
  • Heater Voltage: 5.0 V
Sustainability 15 01060 i002
HC-SR04 Ultrasonic Sensor
  • 5 V voltage
  • 15 mA current
  • 40 KHz frequency
  • 2 cm–450 cm range
Sustainability 15 01060 i003
Fire/Flame Sensor
  • Operating voltage is 3.3 V to 5.2 V
  • Detection angle is 60
  • Detect infrared light having a wavelength in the range: 700 nm to 1000 nm
  • LM393 comparator used
Sustainability 15 01060 i004
Table 2. Current sensors used in proposed model.
Sensor NameRangeSnapshot
ACS712 Current Sensor
1:
AC—9 A TO 11 A
2:
COFFEE MACHINE—5 A TO 7 A
3:
CCTV—1 A TO 3 A
4:
TV—2 A TO 4 A
5:
LIGHT—0.5 A TO 1.5 A
6:
PRINTER—1 A TO 3 A
Sustainability 15 01060 i005
Table 3. Different performance metric values used for fault prediction by machine learning models.
ModelAccuracyPrecisionRecallF1 Score
Gaussian Naive Bayes92.343%91.755%92.343%92.048%
Random Forest94.274%92.821%94.274%93.542%
K-Nearest Neighbour92.829%92.016%92.829%92.421%
Decision Tree92.115%92.224%92.115%92.170%
Table 4. Fault recommendations with solutions of proposed system.
ApplianceValueRecommendationsSolutions
AC0Check for main supply (OFF).
  • Switch ON the main supply.
Check for loose wire connection.
  • Plug the appliance carefully or restart the appliance switch.
Check for cable wreckage.
  • Repair the wreckage in cable.
Check for discharged battery.
  • Replace with new battery.
(Value < min_range)
OR (Value > max_range)
If (value remain out of bound for 20 iteraions)
Repair is required.
  • Clean air filters or condenser coils.
  • Check gas leakage in pipe.
  • Check coolant levels.
  • Check thermostat.
  • Blower and fan lubrication.
  • Check AC unit wiring.
  • Clear drain line.
Otherwise
Replace the appliance.
  • Install a new AC.
Light0Check for main supply (OFF).
  • Switch ON the main supply.
Check for loose wire connection.
  • Plug the appliance carefully or restart the appliance switch.
Check for cable wreckage.
  • Repair the wreckage in cable.
Check for discharged battery.
  • Replace with new battery.
(Value < min_range)
OR (Value > max_range)
If (value remain out of bound for 20 iteraions)
Repair is required.
  • Check for non-functional led or led glass shell.
  • Check voltage supply.
  • Check led light driver.
  • Check led strip level.
  • Check led array after repairing.
Otherwise
Replace the appliance.
  • Install a new light.
Printer0Check for main supply (OFF).
  • Switch ON the main supply.
Appliance not responding.
  • Plug the appliance carefully.
Check for loose wire connection.
  • Restart the appliance switches.
Check for discharged battery.
  • Replace with new battery.
Check for cable wreckage.
  • Repair the cable wreckage.
(Value < min_range)
OR (Value > max_range)
If (value remain out of bound for 20 iteraions)
Repair is required.
  • Check for all necessary cables connected.
  • Check the printer ink or toner cartridges.
  • Check for damaged drum.
  • Replace the fuser.
  • Clean or replace the pickup rollers.
Otherwise
Replace the appliance.
  • Install a new printer.
CCTV0Check for main supply (OFF).
  • Switch ON the main supply.
Check for loose wire connection.
  • Plug the appliance carefully and restart the appliance switches.
Check for cable wreckage.
  • Repair wreckage in cable.
Check for discharged battery.
  • Replace the battery.
(Value < min_range)
OR (Value > max_range)
If (value remain out of bound for 20 iteraions)
Repair is required.
  • Check camera connection.
  • Check cabling.
  • Check DVR updates.
  • Update firmware and reboot camera.
  • Check ARP tables.
  • Check camera power.
  • Check the main board.
Otherwise
Replace the appliance.
  • Install a new CCTV.
LCD TV0Check for main supply (OFF).
  • Switch ON the main supply.
Check for loose wire connection.
  • Plug the appliance carefully and restart the appliance switches.
Check for cable wreckage.
  • Repair wreckage in cable.
Check for the discharged battery.
  • Replace battery.
(Value < min_range)
OR (Value > max_range)
If (value remain out of bound for 20 iteraions)
Repair is required.
  • Check display, sound and backlight.
  • Check A/V ports.
  • Check bus/link cable.
  • Check power board voltage or main board voltage.
Otherwise
Replace the appliance.
  • Install a new LCD.
Coffee Machine0Check for main supply (OFF).
  • Switch ON the main supply.
Check for loose wire connection.
  • Plug the appliance carefully and restart the appliance switches.
Check for cable wreckage.
  • Repair wreckage in cable.
Check for the discharged battery.
  • Replace with new battery.
(Value < min_range)
OR (Value > max_range)
If (value remain out of bound for 20 iteraions)
Repair is required.
  • Check accurate filter basket in filter holder.
  • Sometimes, filter basket needs replacement.
  • Lift off drip tray and clear out waste pipe and waste box.
  • On/off switch may be broken.
  • Check the safety thermostat.
  • Check the main circuit board.
Otherwise
Replace the appliance.
  • Install a new coffee machine.
Door Sensor0Sensor not responding.
  • Plug the appliance carefully.
Check for loose wire connection.
  • Restart the appliance switches.
Check for cable wreckage.
  • Repair the wreckage in the cable.
Otherwise
Replace the appliance.
  • Install a new door sensor.
Fire Sensor0Sensor not responding.
  • Plug the appliance carefully.
Check for loose wire connection.
  • Restart the appliance switches.
Otherwise
Replace the appliance.
  • Install a new fire sensor.
Humidity Sensor0Sensor not responding.
  • Plug the appliance carefully.
Check for loose wire connection.
  • Restart the appliance switches.
(Value < min_range)
OR (Value > max_range)
If (value remain out of bound for 20 iteraions)
Repair is required.
  • Check wiring.
  • Clean the air flux.
  • Check calibration.
  • Check sampling rate.
Otherwise
Replace the appliance.
  • Install a new humidity sensor.
Air QualitySensor0Check for loose wire connection.
  • Plug the appliance carefully and restart the appliance switches.
(Value < min_range)
OR (Value > max_range)
If (value remain out of bound for 20 iteraions)
Repair is required.
  • Check sensor placement.
  • Check Calibration.
  • Check filters.
  • Cleaning internal and external surfaces.
Otherwise
Replace the appliance.
  • Install a new air quality sensor.
TemperatureSensor0Check for loose wire connection.
  • Plug the appliance carefully and restart the appliance switches.
(Value < min_range)
OR (Value > max_range)
If (value remain out of bound for 20 iteraions)
Repair is required.
  • Check for air flux affecting the temperature.
  • Check for Misalignment of batteries.
  • Check cable wreckage.
  • Check faulty resistance thermometer.
  • Check Sensor Break/Open circuit errors.
  • Check for out-of-range errors.
  • Check for the local heat source.
  • Check Faulty thermocouple with a multimeter.
  • Check installation position.
Otherwise
Replace the appliance.
  • Install a new temperature sensor.
Motion Sensor0Check for loose wire connection.
  • Plug the appliance carefully and restart the appliance switches.
Check for cable wreckage.
  • Repair the wreckage in the cable.
Otherwise
Replace the appliance.
  • Install a new motion sensor.
Disclaimer/Publisher’s Note: The statements, opinions and data contained in all publications are solely those of the individual author(s) and contributor(s) and not of MDPI and/or the editor(s). MDPI and/or the editor(s) disclaim responsibility for any injury to people or property resulting from any ideas, methods, instructions or products referred to in the content.

