


Flash Flood Risk Assessment Due to a Possible Dam Break in Urban Arid Environment, the New Um Al-Khair Dam Case Study, Jeddah, Saudi Arabia


Abstract
1. Introduction
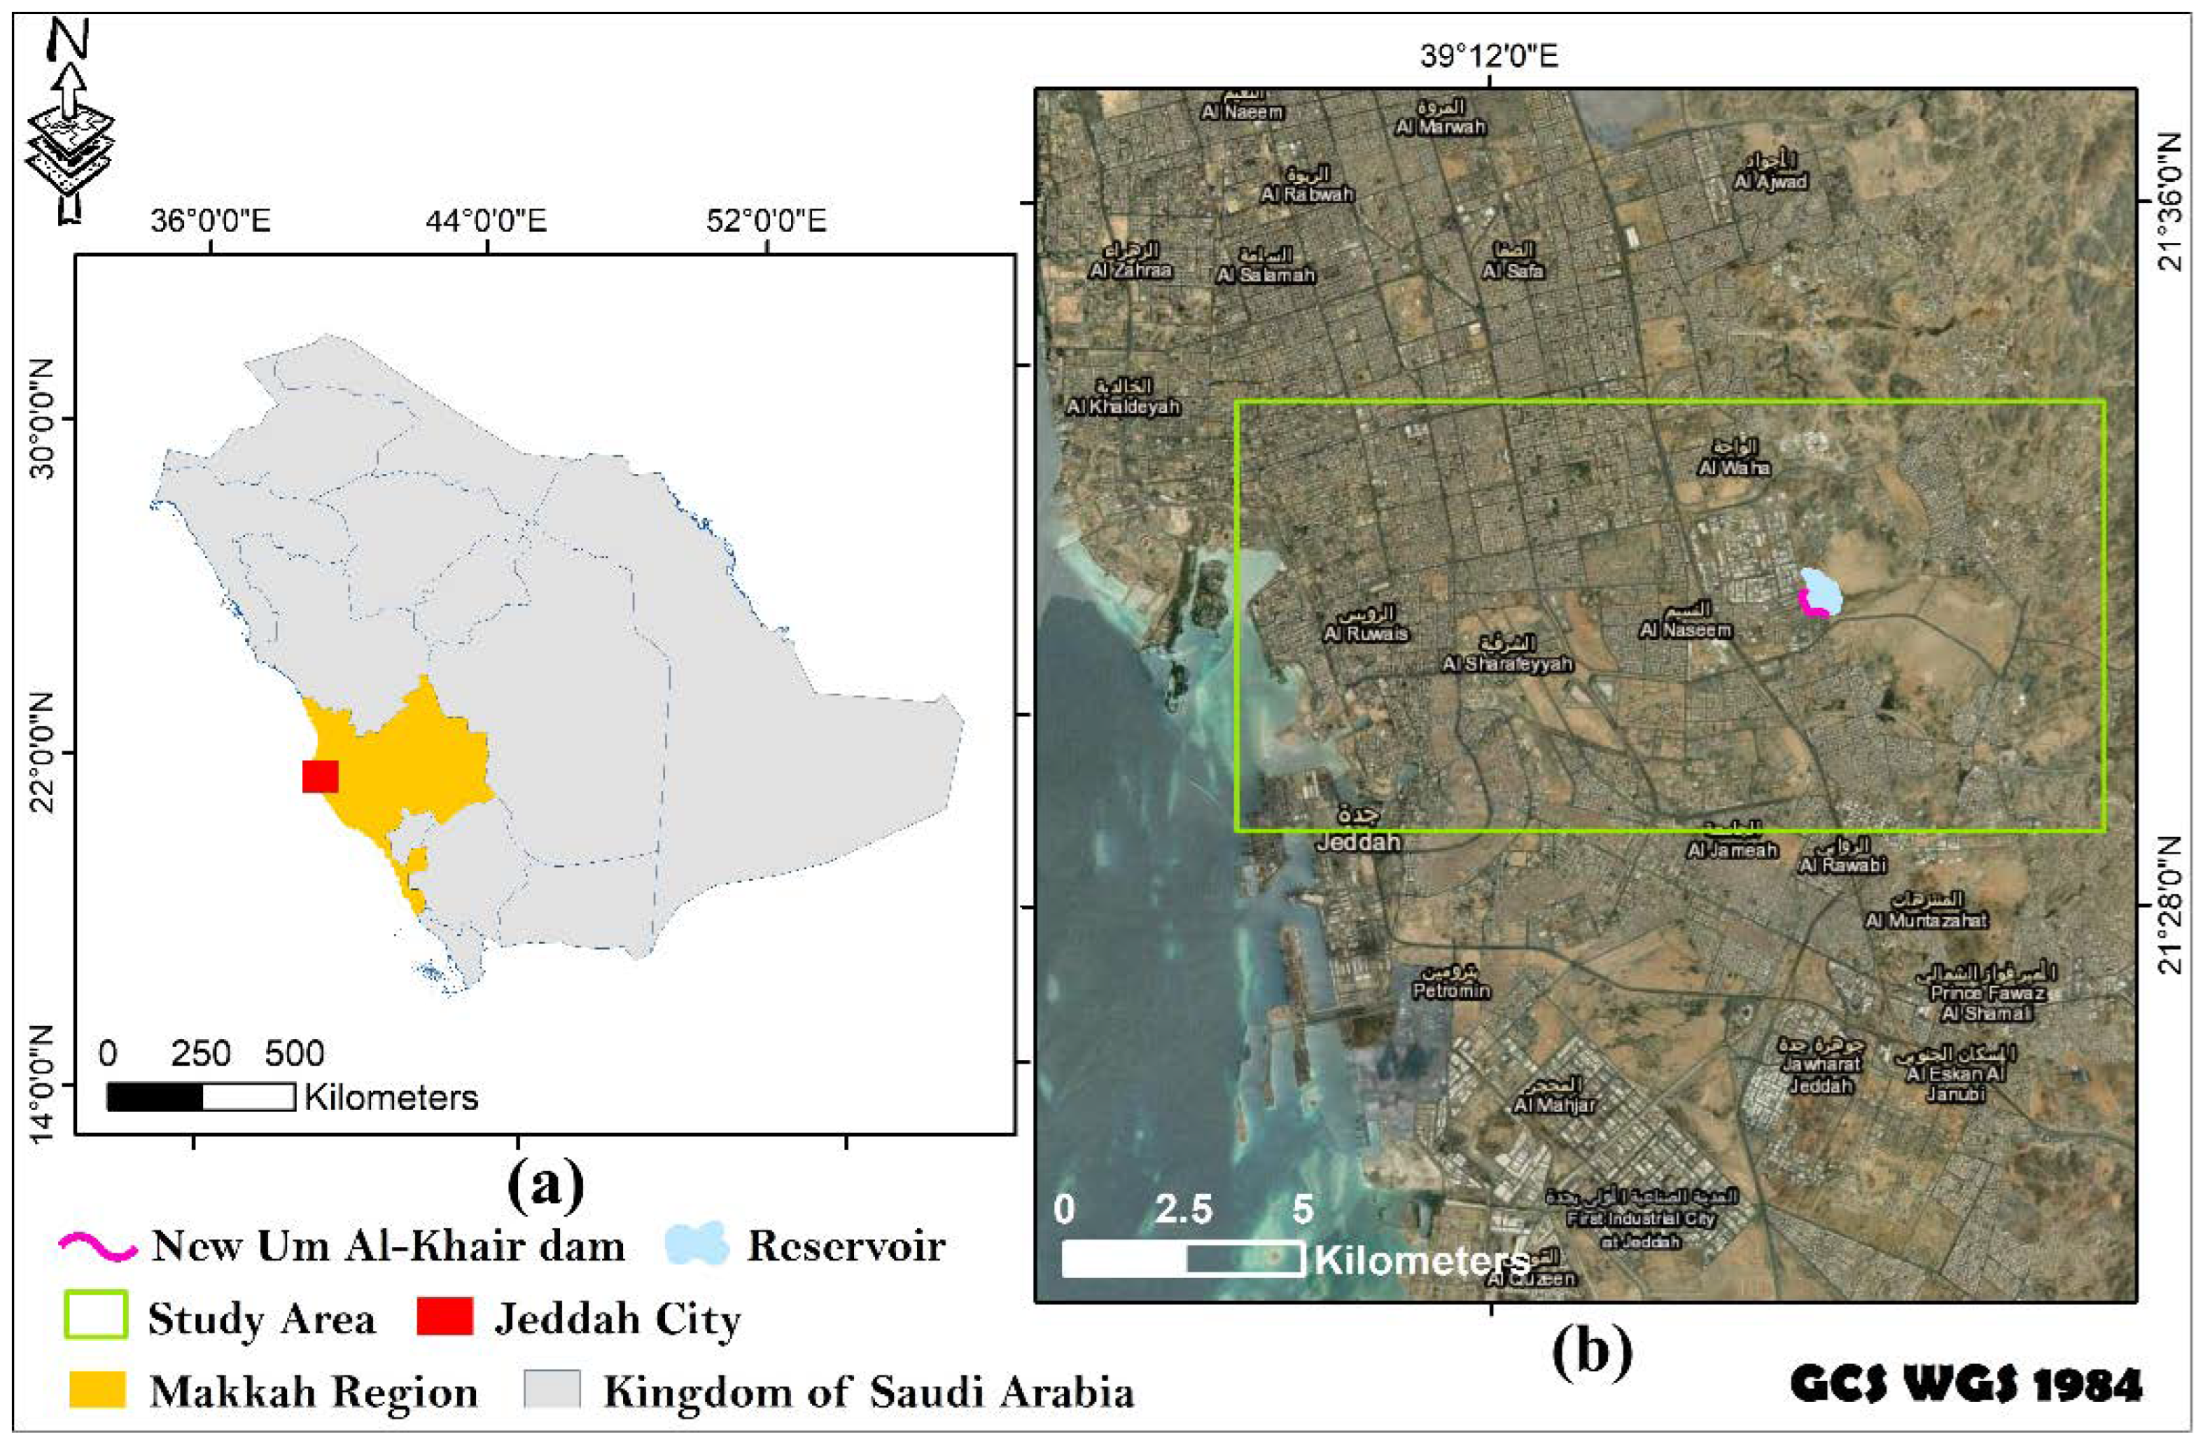
2. Study Area
2.1. Geographical Setting
2.2. Climate Conditions
3. Methodology
3.1. Watershed Delineation
3.2. Analysis of Land Use and Land Cover
3.3. Rainfall Analysis
3.4. Hydrological Modelling of the Dam Catchment (Watershed)
3.5. Dam Breach and Hydraulic Modelling
3.6. Flood Inundation and Flood Risk Assessment
4. Results and Discussion
4.1. Inundation Mapping Due to Dam Break
4.2. Flood Risk Assessment Based on the Developed Flood Risk Matrix
5. Summary and Conclusions
Author Contributions
Funding
Institutional Review Board Statement
Informed Consent Statement
Data Availability Statement
Conflicts of Interest
References
- Kundzewicz, Z.W.; Schellnhuber, H.J. Floods in the IPCC TAR Perspective. Nat. Hazards 2004, 31, 111–128. [Google Scholar] [CrossRef]
- Luo, P.; Mu, D.; Xue, H.; Ngo-Duc, T.; Dang-Dinh, K.; Takara, K.; Schladow, G. Flood inundation assessment for the Hanoi Central Area, Vietnam under historical and extreme rainfall conditions. Sci. Rep. 2018, 8, 12623. [Google Scholar] [CrossRef]
- Youssef, A.M.; Sefry, S.A.; Pradhan, B.; Alfadail, E.A. Analysis on Causes of Flash Flood in Jeddah City (Kingdom of Saudi Arabia) of 2009 and 2011 Using Multi-Sensor Remote Sensing Data and GIS. Geomatics. Nat. Hazards Risk 2016, 7, 1018–1042. [Google Scholar] [CrossRef]
- Marko, K. Urban Flood Hazards Modelling in Arid Zone, Case Study in Wadi Qows Jeddah. Master’s Thesis, King Abdulaziz University, Jeddah, Saudi Arabia, 2013. [Google Scholar]
- UNISDR (United Nations International Strategy for Disaster Reduction). UNISDR Annual Report 2017; UNISDR: Geneva, Switzerland, 2017. [Google Scholar]
- Duvail, S.; Hamerlynck, O. The Rufiji river flood: Plague or blessing? Int. J. Biometeorol. 2007, 52, 33–42. [Google Scholar] [CrossRef]
- Mei, X.; Dai, Z.; Darby, S.E.; Gao, S.; Wang, J.; Jiang, W. Modulation of extreme flood levels by impoundment significantly offset by floodplain loss downstream of the three Gorges dam. Geophys. Res. Lett. 2018, 45, 3147–3155. [Google Scholar] [CrossRef]
- Bharath, A.; Shivapur, A.V.; Hiremath, C.G.; Maddamsetty, R. Dam break analysis using HEC-RAS and HEC-GeoRAS: A case study of Hidkal dam, Karnataka state, India. Environ. Chall. 2021, 5, 100401. [Google Scholar] [CrossRef]
- Shi, H.; Chen, J.; Liu, S.; Sivakumar, B. The Role of Large Dams in Promoting Economic Development under the Pressure of Population Growth. Sustainability 2019, 11, 2965. [Google Scholar] [CrossRef]
- DeNeale, S.; Baecher, G.; Stewart, K.; Smith, E.; Watson, D. Current State-of-Practice in Dam Safety Risk Assessment; Oak Ridge National Lab.(ORNL): Oak Ridge, TN, USA, 2019. [Google Scholar] [CrossRef]
- Pueppke, S.G.; Zhang, Q.; Nurtazin, S.T. Irrigation in the Ili River Basin of Central Asia: From Ditches to Dams and Diversion. Water 2018, 10, 1650. [Google Scholar] [CrossRef]
- Fan, Q.; Tian, Z.; Wang, W. Study on Risk Assessment and Early Warning of Flood-Affected Areas when a Dam Break Occurs in a Mountain River. Water 2018, 10, 1369. [Google Scholar] [CrossRef]
- Tedla, M.G.; Cho, Y.; Jun, K. Flood Mapping from Dam Break Due to Peak Inflow: A Coupled Rainfall–Runoff and Hydraulic Models Approach. Hydrology 2021, 8, 89. [Google Scholar] [CrossRef]
- Haltas, I.; Tayfur, G.; Elci, S. Two-dimensional numerical modeling of flood wave propagation in an urban area due to Ürkmez dam-break, İzmir, Turkey. Nat. Hazards 2016, 81, 2103–2119. [Google Scholar] [CrossRef]
- Cuichao, P.; Dang, C.; Zhuang, J.-Q.; You, Y.; Chen, X.-Q.; Scott, K.M. Landslide-dammed lake at Tangjiashan, Sichuan province, China (triggered by the Wenchuan Earthquake, 12 May 2008): Risk assessment, mitigation strategy, and lessons learned. Environ. Earth Sci. 2012, 65, 1055–1065. [Google Scholar] [CrossRef]
- Bernard-Garcia, M.; Mahdi, T.F. Review and Updated Guidance for Embankment Overtopping Dam Breach Dimensions. In Proceedings of the Canadian Society of Civil Engineering Annual Conference 2021, CSCE 2021, Lecture Notes in Civil Engineering; Springer: Singapore, 2022; Volume 250. [Google Scholar] [CrossRef]
- Zhu, J.; Zhang, H.; Yang, X.; Yin, L.; Li, Y.; Hu, Y.; Zhang, X. A collaborative virtual geographic environment for emergency dam-break simulation and risk analysis. J. Spat. Sci. 2016, 61, 135–155. [Google Scholar] [CrossRef]
- Gernaat, D.E.H.J.; Bogaart, P.W.; van Vuuren, D.P.; Biemans, H.; Niessink, R. High-resolution assessment of global technical and economic hydropower potential. Nat. Energy 2017, 2, 821–828. [Google Scholar] [CrossRef]
- Azeez, O.; Elfeki, A.; Kamis, A.S.; Chaabani, A. Dam break analysis and flood disaster simulation in arid urban environment: The Um Al-Khair dam case study, Jeddah, Saudi Arabia. Nat. Hazards 2020, 100, 995–1011. [Google Scholar] [CrossRef]
- Al-Saikhan, M.M. Engineering Assessment of New Umm al Khair Dam, Jeddah, Saudi Arabia. Master’s Thesis, Faculty of Earth Science, King Abdulaziz University, Jeddah, Sauidi Arabia, 2014. [Google Scholar]
- Hamza, M.H.; Chmit, M. GIS-Based Planning and Web/3D Web GIS Applications for the Analysis and Management of MV/LV Electrical Networks (A Case Study in Tunisia). Appl. Sci. 2022, 12, 2554. [Google Scholar] [CrossRef]
- Khalfallah, C.B.; Saidi, S. Spatiotemporal Floodplain Mapping and Prediction Using HEC-RAS-GIS Tools: Case of the Mejerda River, Tunisia. J. Afr. Earth Sci. 2018, 142, 44–51. [Google Scholar] [CrossRef]
- Khattak, M.S.; Anwar, F.; Saeed, T.U.; Sharif, M.; Sheraz, K.; Ahmed, A. Floodplain Mapping Using HEC-RAS and ArcGIS: A Case Study of Kabul River. Arab. J. Sci. Eng. 2016, 41, 1375–1390. [Google Scholar] [CrossRef]
- Albu, L.-M.; Enea, A.; Iosub, M.; Breabăn, I.-G. Dam Breach Size Comparison for Flood Simulations. A HEC-RAS Based, GIS Approach for Drăcșani Lake, Sitna River, Romania. Water 2020, 12, 1090. [Google Scholar] [CrossRef]
- Ezz, H. Integrating GIS and HEC-RAS to Model Assiut Plateau Runoff. Egypt. J. Remote Sens. Space Sci. 2018, 21, 219–227. [Google Scholar] [CrossRef]
- Abdelkarim, A.; Gaber, A.F.D.; Youssef, A.M.; Pradhan, B. Flood Hazard Assessment of the Urban Area of Tabuk City, Kingdom of Saudi Arabia by Integrating Spatial-Based Hydrologic and Hydrodynamic Modeling. Sensors 2019, 19, 1024. [Google Scholar] [CrossRef]
- Abdelkarim, A.; Awawdeh, M.M.; Alogayell, H.M.; Al-Alola, S.S. Integration of remote sensing and hydrologic, hydraulic modelling on assessment flood risk and mitigation: Al-Lith city, KSA. GEOMATE J. 2020, 18, 252–280. [Google Scholar] [CrossRef]
- Bhusal, A.; Parajuli, U.; Regmi, S.; Kalra, A. Application of Machine Learning and Process-Based Models for Rainfall-Runoff Simulation in DuPage River Basin, Illinois. Hydrology 2022, 9, 117. [Google Scholar] [CrossRef]
- Nelson, E.J.; Jones, N.L.; Miller, A.W. An algorithm for precise drainage basin delineation. J. Hydraul. Eng. ASCE 1994, 120, 298–312. [Google Scholar] [CrossRef]
- Ogden, F.L.; Garbrecht, J.; DeBarry, P.A.; Johnson, L.E. GIS and distributed watershed models. II: Modules, interfaces, and models. J. Hydrol. Eng. 2001, 6, 515–523. [Google Scholar] [CrossRef]
- Seker, D.Z.; Kabdasli, S.; Rudvan, B. Risk assessment of a dam-break using GIS technology. Water Sci. Technol. 2003, 48, 89–95. [Google Scholar] [CrossRef]
- Elfadaly, A.; Shams eldein, A.; Lasaponara, R. Cultural Heritage Management Using Remote Sensing Data and GIS Techniques around the Archaeological Area of Ancient Jeddah in Jeddah City, Saudi Arabia. Sustainability 2020, 12, 240. [Google Scholar] [CrossRef]
- Al-Areeq, A.M.; Abba, S.I.; Yassin, M.A.; Benaaf, M.; Ghaleb, M.; Aljundi, I.H. Computational Machine Learning Approach for Flood Susceptibility Assessment Integrated with Remote Sensing and GIS Techniques from Jeddah, Saudi Arabia. Remote Sens. 2022, 14, 5515. [Google Scholar] [CrossRef]
- DeNicola, E.; Aburizaiza, O.S.; Siddique, A.; Khwaja, H.; Carpenter, D.O. Climate change and water scarcity: The case of Saudi Arabia. Ann. Glob. Health 2015, 81, 342–353. [Google Scholar] [CrossRef]
- Almazroui, M. Sensitivity of a regional climate model on the simulation of high intensity rainfall events over the Arabian Peninsula and around Jeddah (Saudi Arabia). Theor. Appl. Climatol. 2011, 104, 261–276. [Google Scholar] [CrossRef]
- Aboobacker, V.M.; Shanas, P.R.; Al-Ansari EM, A.S.; Sanil Kumar, V.; Vethamony, P. The maxima in northerly wind speeds and wave heights over the Arabian Sea, the Arabian/Persian Gulf and the Red Sea derived from 40 years of ERA5 data. Clim. Dyn. 2020, 56, 1037–1052. [Google Scholar] [CrossRef]
- Abdullah, M.M.A.; Youssef, A.M.; Nashar, F.; AlFadail, E.A. Statistical Analysis of Rainfall Patterns in Jeddah City, KSA: Future Impacts. In Rainfall—Extremes, Distribution and Properties; Abbot, J., Hammond, A., Eds.; IntechOpen: London, UK, 2019. [Google Scholar] [CrossRef]
- Subyani, A.M.; Hajjar, A.F. Rainfall analysis in the contest of climate change for Jeddah area, Western Saudi Arabia. Arab. J. Geosci. 2016, 9, 122. [Google Scholar] [CrossRef]
- Ammous, A.; Assaedi, A.; Al Ahdal, A.; Ammous, K. Energy efficiency of a novel low voltage direct current supply for the future building. Int. J. Energy Res. 2021, 45, 15360–15371. [Google Scholar] [CrossRef]
- Hidayatulloh, A.; Chaabani, A.; Zhang, L.; Elhag, M. DEM Study on Hydrological Response in Makkah City, Saudi Arabia. Sustainability 2022, 14, 13369. [Google Scholar] [CrossRef]
- Pandey, P.C.; Koutsias, N.; Petropoulos, G.P.; Srivastava, P.K.; Ben Dor, E. Land use/land cover in view of earth observation: Data sources, input dimensions, and classifiers-a review of the state of the art. Geocarto Int. 2019, 36, 957–988. [Google Scholar] [CrossRef]
- He, J.; Harris, J.R.; Sawada, M.; Behnia, P. A comparison of classification algorithms using Landsat-7 and Landsat-8 data for mapping lithology in Canada’s Arctic. Int. J. Remote Sens. 2015, 36, 2252–2276. [Google Scholar] [CrossRef]
- Gaubi, I.; Chaabani, A.; Ben Mammou, A.; Hamza, M.H. A GIS-based soil erosion prediction using the revised universal soil loss equation (RUSLE) (Lebna watershed, Cap Bon, Tunisia). Nat. Hazards 2017, 86, 219–239. [Google Scholar] [CrossRef]
- Kraemer, H.C. Kappa Coefficient. Wiley StatsRef: Statistics Reference Online. 2015. Available online: https://doi.org/10.1002/9781118445112.stat00365.pub2 (accessed on 26 December 2022).
- Spence, E.S. Theoretical Frequency Distributions for the Analysis of Plains Streamflow. Can. J. Earth Sci. 1973, 10, 130–139. [Google Scholar] [CrossRef]
- Bahrawi, J.; Alqarawy, A.; Chabaani, A.; Elfeki, A.; Elhag, M. Spatiotemporal analysis of the annual rainfall in the Kingdom of Saudi Arabia: Predictions to 2030 with different confidence levels. Theor. Appl. Climatol. 2021, 146, 1479–1499. [Google Scholar] [CrossRef]
- Bahrawi, J.A. Rainfall distribution and its characteristics in Makkah AlMukarrahmah Region, Saudi Arabia. Appl. Ecol. Environ. Res. 2018, 16, 4129–4144. [Google Scholar] [CrossRef]
- Satheeshkumar, S.; Venkateswaran, S.; Kannan, R. Rainfall–runoff estimation using SCS–CN and GIS approach in the Pappiredipatti watershed of the Vaniyar sub basin, South India. Model. Earth Syst. Environ. 2017, 3, 24. [Google Scholar] [CrossRef]
- USDA. Soil Conservation Service National Engineering Handbook; USDA: Washington, DC, USA, 1986. [Google Scholar]
- Mishra, S.K.; Singh, V.P. SCS-CN Method. In Soil Conservation Service Curve Number (SCS-CN) Methodology; Springer: Amsterdam, The Netherlands, 2003; pp. 84–146. [Google Scholar] [CrossRef]
- USACE. Using HEC-RAS for Dam Break Studies. TD-39. U.S. Army Coprs of Engineers, Hydrologic Engineering Center. 2014. Available online: http://www.hec.usace.army.mil/publications/TrainingDocuments/TD-39.pdf (accessed on 26 December 2022).
- Natarajan, S.; Radhakrishnan, N. An Integrated Hydrologic and Hydraulic Flood Modeling Study for a Medium-Sized Ungauged Urban Catchment Area: A Case Study of Tiruchirappalli City Using HEC-HMS and HEC-RAS. J. Inst. Eng. (India) Ser. A 2020, 101, 381–398. [Google Scholar] [CrossRef]
- Elfeki, A.; Masoud, M.; Niyazi, B. Integrated rainfall-runoff and flood inundation modeling for flash flood risk assessment under data scarcity in arid regions: Wadi Fatimah basin case study, Saudi Arabia. Nat. Hazards 2016, 85, 87–109. [Google Scholar] [CrossRef]
- HEC (Hydrologic Engineering Center). HEC-RAS 6.0, Hydraulic Reference Manual; HEC: Davis, CA, USA, 2021. [Google Scholar]
- Xiaosong, L.; Shushi, L.; Wenjun, C.; Songjiang, F. The Application of Risk Matrix to Software Project Risk Management. In Proceedings of the 2009 International Forum on Information Technology and Applications, Chengdu, China, 15–17 May 2009. [Google Scholar] [CrossRef]
- (Tony)Cox, L.A. What’s Wrong with Risk Matrices? Risk Anal. 2008, 28, 497–512. [Google Scholar] [CrossRef]
- Duijm, N.J. Recommendations on the use and design of risk matrices. Saf. Sci. 2015, 76, 21–31. [Google Scholar] [CrossRef]
- Garrote, J.; Díez-Herrero, A.; Escudero, C.; García, I. A Framework Proposal for Regional-Scale Flood-Risk Assessment of Cultural Heritage Sites and Application to the Castile and León Region (Central Spain). Water 2020, 12, 329. [Google Scholar] [CrossRef]
- Salinas-Rodriguez, C.; Gersonius, B.; Zevenbergen, C.; Serrano, D.; Ashley, R. A Semi Risk-Based Approach for Managing Urban Drainage Systems under Extreme Rainfall. Water 2018, 10, 384. [Google Scholar] [CrossRef]
- Abdulrazzak, M.; Elfeki, A.; Kamis, A.; Kassab, M.; Alamri, N.; Chaabani, A.; Noor, K. Flash flood risk assessment in urban arid environment: Case study of Taibah and Islamic universities’ campuses, Medina, Kingdom of Saudi Arabia. Geomat. Nat. Hazards Risk 2019, 10, 780–796. [Google Scholar] [CrossRef]
- Bai, Y.; Jin, W.-L. Risk Assessment Methodology. In Marine Structural Design; Elsevier: Amsterdam, The Netherlands, 2016; pp. 709–723. [Google Scholar] [CrossRef]
- Escuder-Bueno, I.; Castillo-Rodríguez, J.T.; Zechner, S.; Jöbstl, C.; Perales-Momparler, S.; Petaccia, G. A quantitative flood risk analysis methodology for urban areas with integration of social research data. Nat. Hazards Earth Syst. Sci. 2012, 12, 2843–2863. [Google Scholar] [CrossRef]
- Moser, D.A. The Use of Risk Analysis by the U.S. Army Corps of Engineers; Institute for Water Resources, USACE: Alexandria, VA, USA, 1997; p. 34. [Google Scholar]
- Tyler, J.; Sadiq, A.-A.; Noonan, D.S.; Entress, R.M. Decision Making for Managing Community Flood Risks: Perspectives of United States Floodplain Managers. Int. J. Disaster Risk Sci. 2021, 12, 649–660. [Google Scholar] [CrossRef]
- Tyler, J.; Sadiq, A.A.; Noonan, D.S. A review of the community flood risk management literature in the USA: Lessons for improving community resilience to floods. Nat. Hazards 2019, 96, 1223–1248. [Google Scholar] [CrossRef]


| Geomorphological Parameters | Value |
|---|---|
| Total Basin Area (km2) | 36.04 |
| Total Basin Surface Area (km2) | 36.42 |
| Total Basin Perimeter (km) | 40.04 |
| Basin Length (km) | 7.78 |
| Main Channel Length (km) | 10.92 |
| Stream Frequency (number/km2) | 1.08 |
| Total Basin Relief (m) | 195.0 |
| Relief Ratio | 0.02 |
| Slope Catchment Ratio | 0.00048 |
| Stream order 1 number | 30 |
| Stream order 2 number | 6 |
| Stream order 3 number | 2 |
| Stream order 4 number | 1 |
| Average Bifurcation Ratio | 3.33 |
| Land Cover Features | SCS-CN | Area (km2) | Composite CN |
|---|---|---|---|
| Vegetation | 60 | 4.85 | 80 |
| Bareland | 65 | 13.09 | |
| Rocks | 95 | 18.47 | |
| Urban | 98 | 0.23 |
| Distribution Type | RMSE (J134) | RMSE (41,024) |
|---|---|---|
| (mm) | (mm) | |
| Gumbel Type 1 | 12.87 | 4.03 |
| Generalized Extreme Value (GEV) | 5.97 | 5.31 |
| 2-Parameter Log-Normal | 10.76 | 7.82 |
| 3-Parameter Log-Normal | 5.51 | 4.5 |
| Pearson Type III | 9.61 | 4.01 |
| Log-Pearson Type III | 10 | 6.42 |
| Station No. | Coordinates | Rainfall (mm) at Different Return Periods (Years) | |||||||
|---|---|---|---|---|---|---|---|---|---|
| Lat. (N) | Long. (E) | 2 | 5 | 10 | 25 | 50 | 100 | 200 | |
| J134 | 21 30 00 | 39 12 00 | 23.6 | 44.5 | 57.7 | 73.5 | 84.9 | 95.8 | 106.4 |
| 41,024 | 21 40.8 00 | 39 09 00 | 22.2 | 45.6 | 64.7 | 93.1 | 117.3 | 144.0 | 173.5 |
| Average | 22.9 | 45.0 | 61.2 | 83.3 | 101.1 | 119.9 | 139.9 | ||
| Dam Break Parameters | Magnitude |
|---|---|
| Average Breach Width (Bave) (m) | 50 |
| Slope Break (horizontal:vertical) | 1:4 |
| Duration (hour) | 0.5 |
| Crest Elevation (m) | 57.31 |
| Consequences in terms of Flood Depth | ||||||
| <0.10 m | 0.1–0.5 m | 0.5–1.0 m | 1.0–2.0 m | >2.0 m | ||
| Low | Minor | Major | Severe | Catastrophic | ||
| Likelihood of occurrence | Almost Certain (every time) | |||||
| Very likely (1 in 5 years) | ||||||
| Possible (1 in 50 years) | ||||||
| Unlikely (1 in 100 years) | ||||||
| Rare (exceptional circumstances) | ||||||
| Legend | ||||||
| Very High Risk | ||||||
| High Risk | ||||||
| Moderate Risk | ||||||
| Low Risk | ||||||
| Negligible Risk | ||||||
| Return Period (years) | Peak Flow Qp (m3/s) | Flooded Area (sq km) | Maximum Water Depth (m) |
|---|---|---|---|
| 5 | 70.0 | 3.6 | 1.62 |
| 10 | 105.3 | 5.4 | 2.05 |
| 25 | 144.4 | 6.8 | 2.46 |
| 50 | 169.6 | 7.7 | 2.73 |
| 100 | 191.2 | 8.4 | 2.96 |
| 200 | 210.3 | 9.1 | 3.15 |
Disclaimer/Publisher’s Note: The statements, opinions and data contained in all publications are solely those of the individual author(s) and contributor(s) and not of MDPI and/or the editor(s). MDPI and/or the editor(s) disclaim responsibility for any injury to people or property resulting from any ideas, methods, instructions or products referred to in the content. |
© 2023 by the authors. Licensee MDPI, Basel, Switzerland. This article is an open access article distributed under the terms and conditions of the Creative Commons Attribution (CC BY) license (https://creativecommons.org/licenses/by/4.0/).
Share and Cite
Hamza, M.H.; Saegh, A.M. Flash Flood Risk Assessment Due to a Possible Dam Break in Urban Arid Environment, the New Um Al-Khair Dam Case Study, Jeddah, Saudi Arabia. Sustainability 2023, 15, 1074. https://doi.org/10.3390/su15021074
Hamza MH, Saegh AM. Flash Flood Risk Assessment Due to a Possible Dam Break in Urban Arid Environment, the New Um Al-Khair Dam Case Study, Jeddah, Saudi Arabia. Sustainability. 2023; 15(2):1074. https://doi.org/10.3390/su15021074
Chicago/Turabian StyleHamza, Mohamed Hafedh, and Afnan Mohammed Saegh. 2023. "Flash Flood Risk Assessment Due to a Possible Dam Break in Urban Arid Environment, the New Um Al-Khair Dam Case Study, Jeddah, Saudi Arabia" Sustainability 15, no. 2: 1074. https://doi.org/10.3390/su15021074
APA StyleHamza, M. H., & Saegh, A. M. (2023). Flash Flood Risk Assessment Due to a Possible Dam Break in Urban Arid Environment, the New Um Al-Khair Dam Case Study, Jeddah, Saudi Arabia. Sustainability, 15(2), 1074. https://doi.org/10.3390/su15021074