Abstract
Wearable devices such as smartwatches, wristbands, and GPS shoes are commonly employed for fitness and wellness as they enable people to observe their day-to-day health status. These gadgets encompass sensors to accumulate data related to user activities. Clinical act graph devices come under the class of wearables worn on the wrist to compute the sleep parameters by storing sleep movements. Sleep is very important for a healthy lifestyle. Inadequate sleep can obstruct physical, emotional, and mental health, and could result in several illnesses such as insulin resistance, high blood pressure, heart disease, stress, etc. Recently, deep learning (DL) models have been employed for predicting sleep quality depending upon the wearables data from the period of being awake. In this aspect, this study develops a new wearables-assisted smart health monitoring for sleep quality prediction using optimal deep learning (WSHMSQP-ODL) model. The presented WSHMSQP-ODL technique initially enables the wearables to gather sleep-activity-related data. Next, data pre-processing is performed to transform the data into a uniform format. For sleep quality prediction, the WSHMSQP-ODL model uses the deep belief network (DBN) model. To enhance the sleep quality prediction performance of the DBN model, the enhanced seagull optimization (ESGO) algorithm is used for hyperparameter tuning. The experimental results of the WSHMSQP-ODL method are examined under different measures. An extensive comparison study shows the significant performance of the WSHMSQP-ODL model over other models.
1. Introduction
Sleep plays an important role in assisting the body to rest, regenerate, and restore energy for proper functioning of the organs, particularly the brain. A biological clock regulates the human sleep–wake cycle in the brain that continuously balances the wake times and sleep of the human body [1]. Better sleep becomes an essential part of a healthy person and helps in enhancing all body functions and mental states. The adverse effects of sleep loss are even more profound whenever there is a poor quality of sleep or when shortened sleeping hours take place daily, rather than as a singular disturbance [2]. The golden standard for sleep measurement is the polysomnogram (PSG), which needs a sleep technician, sleep lab, and observing many physiological variables. As such, polysomnography was usually limited to the evaluation of sleep for a couple of nights [3]. Longitudinal, ambulatory sleep measurement could be an advantage for several people who are affected by suspected sleep disorders, workforces in jobs where any impairments in alertness are high risk (i.e., workers employed in the transportation sector), and healthy people who want better sleep for maximum cognitive and physical performance and good health [4].
As per the report of the National Institutes of Health (NIH), almost 30% of the population has sleep disruption. Of these, 10% face both sleep disturbance and daytime dysfunction consistent with a prognosis of insomnia [5]. Sleep disruption leads to numerous health issues, including depression, obesity, insomnia, diabetes, and many more, and even results in hypertension, acute myocardial infarction, and atherosclerosis. Physical exercise or workouts may decrease the stress level in health-based results (well-being, effectiveness, and sleep quality) [6]. Physical workouts are an effective feature for people who do not have adequate sleep quality or quantity. Physical exercises are regarded as non-pharmacological therapy for insomnia, which can be readily available. However, only limited research was conducted on how physical exercise enhances the quality of sleep, from either evaluation or prediction perspectives [7].
Recently, many studies became available concerning sleep quality as the key factor for sleep quality evaluation by various gadgets [8]. Certain studies are being conducted that examine the relationship between sleep health and elements such as illness, mental, and physical health, or novel research works forecasting the quality of sleep. At present, several deep learning (DL) techniques have been utilized in forecasting sleep quality through the data accumulated from the wearable devices [9]. This study used six NN techniques with wearables to forecast good sleep efficiency or poor sleep quality related to wearable data from awake periods. Additionally, this work demonstrates the feasibility of DL in forecasting the quality of sleep. The assessment outcomes of the research methods contain effective applications in e-health solutions for sleep, specifically with CNN attaining optimal outcomes [10], along with using wearable devices for extracting the projections.
This study develops a new wearables-assisted smart health monitoring for sleep quality prediction using optimal deep learning (WSHMSQP-ODL) model. The presented WSHMSQP-ODL technique initially enables the wearables to gather sleep-activity-related data. Next, data pre-processing is performed to transform the data into a uniform format. For sleep quality prediction, the WSHMSQP-ODL model a uses deep belief network (DBN) model. To enhance the sleep quality prediction performance of the DBN model, the enhanced seagull optimization (ESGO) algorithm is used for hyperparameter tuning. The experimental results of the WSHMSQP-ODL method are examined under different measures. In short, the key contributions of the paper are given as follows:
- An intelligent WSHMSQP-ODL technique composed of pre-processing, DBN-based sleep quality prediction, and ESGO algorithm is presented. To the best of our knowledge, the WSHMSQP-ODL model has never presented in the literature;
- A novel ESGO algorithm is introduced by incorporating the concepts of opposition-based learning (OBL) with a traditional SGO algorithm;
- Hyperparameter optimization of the DBN model using ESGO algorithm using cross-validation helps to boost the predictive outcome of the WSHMSQP-ODL model for unseen data.
2. Related Works
Arora et al. [11] intend to forecast sleep quality from wearable sensors by utilizing DL methods. Three sleep indicators were modelled that can be computed through the data accumulated from wearable gadgets automatically. Such sleep indicators are sleep consistency, daily sleep quality, and weekly sleep quality. Two DL techniques such as multilayer perceptron (MLP) and CNN were enforced for forecasting the quality of sleep based on the devised indicators. In [12], the authors use the cost-effective wearable multi-sensor mechanism to obtain the cardiorespiratory signal in the subject. Three new features were devised during the feature extraction process. The authors then implemented a bidirectional RNN structure including LSTM (BLSTM) for predicting the four-class sleep levels. John et al. [13] present a new technique for apnea identification (pause in breathing) from ECG signals acquired by wearable gadgets. The innovation arises from a high resolution of apnea recognition on a second-by-second basis, and this can be attained by utilizing a single-dimensional CNN for extracting features and recognition of sleep apnea events.
Hidayat et al. [14] modelled a technique of data pre-processing and ML by utilizing simple K-NN techniques to further empower the use of these data for forecasting changes in the quality of sleep on the basis of his/her present physical activity level. This methodology is challenged to forecast differences in five clinically approved sleep quality pointers, through data produced by existing consumer-grade wrist wearable gadgets. Khoa et al. [15] study manipulated federated multiple CNNs (FedMCRNNs) and multi-modal data gathered from wearables for predicting the quality of sleep. The authors compute the efficiency of FedMCRNN in many-to-many and many-to-one cases with the help of several metrics and make a comparison with conventional ML techniques.
Arora et al. [16] focused on assessing the quality of sleep and health from smartphones and wearables by utilizing adaptive neuro-fuzzy inference systems (ANFISs). The collection of real-time physical activities and sleep data can be performed through the user’s smartwatches. A smartphone application can be constituted for collecting real-time smartphone usage data. Sleep quality indicators (SleepQual) are used to evaluate the daily sleep quality with the help of sleep attributes that are gathered by smartwatches. Correlation of SleepQual was assessed with smartphone usage elements and physical activity elements utilizing Pearson’s correlation. Cho et al. [17] introduce an end-to-end DL structure utilizing wrist actigraphy, named Deep-ACTINet, for automated sleep–wake recognition, leveraging only noise-canceled raw activity signal recorded in the sleep and lacking a feature engineering technique. The modelled Deep-ACTINet was compared with two traditional fixed methods related to sleep–wake score approaches and four feature-engineering-related ML techniques.
Despite the availability of ML and DL approaches for sleep quality prediction, it is still required to boost the predictive outcomes. Due to the incessant deepening of the DL models, the number of parameters of DL models increases, resulting in model overfitting. At the same time, different hyperparameters have a significant impact on the efficiency of the CNN model. Particularly, the hyperparameters such as epoch count, batch size, and learning rate selection are essential to attain an effectual outcome. As the trial and error method for hyperparameter tuning is a tedious and erroneous task, metaheuristic algorithms can be applied. Therefore, in this work, we employ the ESGO algorithm for the parameter selection of the DBN model.
3. The Proposed Model
In this article, a novel WSHMSQP-ODL algorithm was formulated to assess sleep quality in a smart healthcare environment. The presented WSHMSQP-ODL technique initially enables the wearables to gather sleep-activity-related data. Next, data pre-processing is performed to transform the data into a uniform format. Moreover, the WSHMSQP-ODL method employs the ESGO with DBN model for sleep quality prediction. Figure 1 represents the overall working procedure of the WSHMSQP-ODL system. The figure shows that the training data are given as input to the proposed model, which initially undergo data pre-processing to make them suitable for prediction process. Next, the proposed model exploits the DBN model for sleep quality prediction and its hyperparameters can be optimally chosen by the ESGO algorithm.
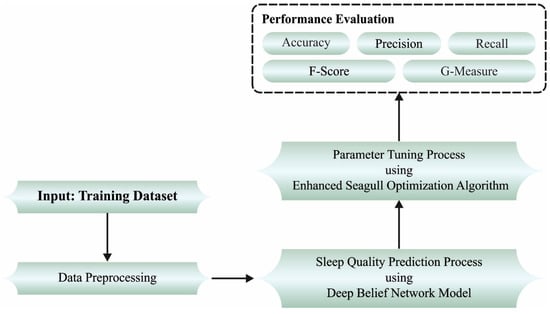
Figure 1.
Overall working procedure of WSHMSQP-ODL method.
3.1. Data Pre-Processing
At the preliminary level, the WSHMSQP-ODL technique applies data pre-processing. The data accumulated by smartwatches could not demonstrate sleep onset latency (time needed to decrease sleeping after in time bed). It comprises the entire time spent waking up in minutes that also contains sleep onset latency. Therefore, during this article, half of the time spent waking up was assumed to be sleep onset latency. For instance, one instance of waking up time is noted by a watch as 34 min, and the next sleep onset latency is assumed to be 17 min.
3.2. Sleep Quality Prediction Using DBN
In this paper, in order to mine the essential features of the sleep quality of the cross-section, the DBN network is used to extract the features of the sleep quality. At the top level of the model, the pre-processing is performed and the useful data are fed into the DBN model. The abstract features attained by the training and learning of the bottom model are used as the input, furthermore, the prediction results are output through the output layer fitting. At the same time, the DBN model is also required to fine-tune and optimize the obtained model parameters.
DBN is a multi-layer probabilistic generative model that can learn to extract a deep hierarchical depiction of the trained dataset. DBN is composed of different layers of RBM, and classification is added on the topmost layer [18]. DBN is trained quickly by training various RBM with a greedy layer-wise unsupervised training approach. After network pre-training, the network parameters with supervised learning are fine-tuned for achieving the best results of the classification. RBM is an energy mechanism where the hidden–hidden and visible–visible layers have no connection and the visible–hidden layer has full connections. RBM is more commonly employed in feature extraction, classification, dimension reduction, collaborative filtering, and topic modeling. An RBM contains Bernoulli random valued hidden and visible units, as well as maps of the sampling dataset from the input space of dimension to feature the space of dimension, whereas . The RBM is an energy-based generative model comprising a layer of visible nodes signifying the data and layer of hidden nodes learning to characterize features, with every and . Then, the bias of the visible node is determined as , and the bias of the hidden node is . The energy function of joint configuration can be described by the following expression:
According to the energy function , the joint likelihood distribution for hidden and visible units is determined in the following:
In Equation (2), indicates the partition function that can be the sum over each potential pair of hidden and visible units.
The probability allocated to visible unit can be provided by summing over each potential binary hidden vector in the following:
Meanwhile, there are no direct connections between similar layers in an RBM, and this hidden unit (HU) is an independently provided visible unit. Thus, assuming the visible unit, the conditional probability of the hidden vector is shown as:
Likewise, assuming the HU, the conditional probability of visible unit can be provided as following:
Assuming a visible vector, the activation state of every HU is conditionally independent. Currently, , and the activation probability of - HUs are defined in the following:
where refers to the logistic sigmoid function. Consequently, the activation probability of every visible vector can be conditionally independent when the HU is assumed:
RBM can be trained to minimalize energy in Equation (1) by determining the value of network parameter . Once the RBM is trained, the network energy is minimalized, and probability in Equation (1) is maximized. For maximizing log probability of , its gradient regarding network parameter is evaluated by the following equation:
In Equation (9), represents the expectation operator. The expectation on L.H.S was computed accurately, however, expectation on R.H.S is difficult to estimate. To resolve this problem, the contrastive divergence (CD) is used for approximating –likelihood gradient. The CD–k model estimates the expectation in Equation (10) by constraint () iteration of Gibbs sampling to upgrade the network parameter . The CD is a persistent contrastive divergence (PCD) model, making the training method very effective. The upgrade method of variable is given below:
After training an RBM, another RBM is stacked on topmost layer of the initial one. Consequently, numerous layers of RBMs are stacked to automatically extract distinct features that characterize complicated architecture in the dataset.
3.3. Parameter Adjustment Process
Finally, the WSHMSQP-ODL technique makes use of the ESGO algorithm for the parameter-tuning process. The SGO is a SI metaheuristics technique based on the seagull’s behavior in the colony [19], particularly the migration and attacking (hunting) approach. First, they assault other birds over the sea in the migration process. Then, they make spiral shape movements for attacking the prey effectively. Note that SGO illustrates the best performance in global bound–constrained optimization problems. Therefore, consider that it is implemented effectively in several real-time challenges. Nonetheless, the fundamental SGO accomplishes significant results for unconstrainted benchmarks; by performing more detailed examination on the CEC test suite, the convergence rate is improved.
Although the original SGO managed to discover the optimal searching area in all the runs, in a few runs, it does not satisfactorily converge, and, subsequently, the last produced outcome suffers from poor quality. For addressing these disadvantages, OBL technique was developed. According to the previous study, it is demonstrated that the OBL approach might significantly increase intensification and diversification. Following all the iterations, when the optimum solution is determined , the opposite solution can be produced using the succeeding equation for all the parameters :
In Equation (13), represent opposite -th parameter optimum solution, and represent the lower and upper bounds of -th variable, respectively. According to the fitness function, greedy selection can be utilized among opposite and primary optimum solutions, and the better is was conserved for the succeeding iteration. The presented method is named ESGO, and the pseudocode is demonstrated in Algorithm 1. Finally, from the perception of computational complexity, ESGO contributes somewhat towards the overall complexity, especially in further computation being added to each iteration [20]. OBL process choses among and via greedy selection. In other words, , whereas indicates individual amount whereby denotes the iterative amount.
| Algorithm 1: Pseudocode of ESGO algorithm |
| Input: Seagull population Output: Optimal search agent Initialize parameters: and Consider Consider Consider while do define fitness value of seagulls for to (all the dimensions), do Fitness_Function end for choose optimum fitness value* for to do if then end if end for choose fitness values for search agent/ Perform OBL technique Choose and through greedy selection end while return |
4. Performance Validation
This section inspects the sleep quality prediction results of the WSHMSQP-ODL model on a dataset comprising 400 samples as defined in Table 1. The dataset holds four classes with 100 samples under each class. The dataset was downloaded from the Kaggle repository (available at https://www.kaggle.com/code/jumpingmandt/sleep-data-study/data (accessed on 15 September 2022)). The original dataset holds sleep quality values ranging from 0–100%. In our study, we divided the dataset into four classes based on the sleep quality level.

Table 1.
Dataset details.
The confusion matrix presented by the WSHMSQP-ODL method on the entire dataset is shown in Figure 2. The WSHMSQP-ODL method sorts 87 samples into class 1, 96 samples into class 2, 93 samples into class 3, and 98 samples into class 4.
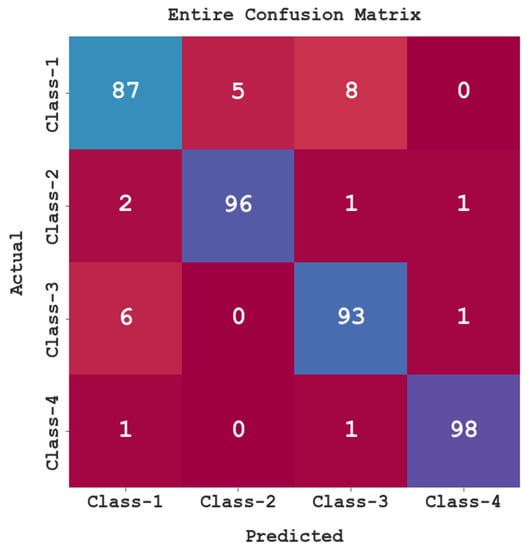
Figure 2.
Confusion matrix of WSHMSQP-ODL system for entire database.
Table 2 and Figure 3 report detailed sleep quality classification outcomes of the WSHMSQP-ODL method on the entire dataset. The simulation values show that the WSHMSQP-ODL method reaches enhanced classification results in all classes. It is observed that the WSHMSQP-ODL model obtains an average of 96.75%, of 93.49%, of 93.50%, of 93.48%, and of 93.49%.
Table 2.
Sleep quality classification outcome of WSHMSQP-ODL system for entire dataset with distinct classes.
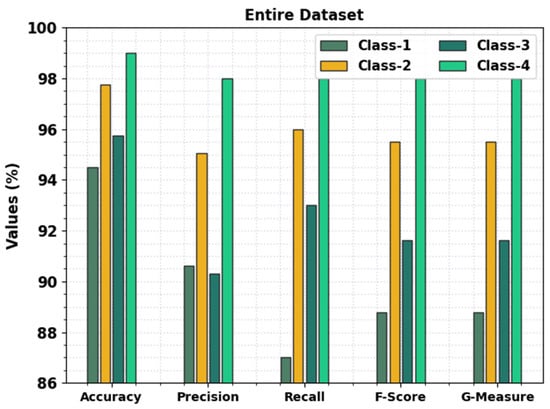
Figure 3.
Overall sleep quality classification outcome of WSHMSQP-ODL system for entire dataset.
The confusion matrix rendered by the WSHMSQP-ODL method under 70% of the TR database is exhibited in Figure 4. The WSHMSQP-ODL approach sorts 58 samples into class 1, 64 samples into class 2, 64 samples into class 3, and 74 samples into class 4.
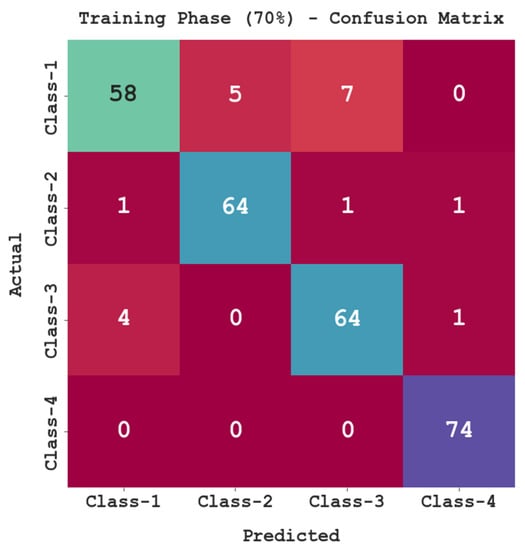
Figure 4.
Confusion matrix of WSHMSQP-ODL system for 70% of TR database.
Table 3 and Figure 5 exhibit brief sleep quality classification outcomes of the WSHMSQP-ODL method for 70% of the TR database. The simulation values manifested in the WSHMSQP-ODL methodology reaches enhanced classification results in all classes. It is notable that the WSHMSQP-ODL algorithm acquires an average of 96.43%, of 92.77%, of 92.78%, of 92.70%, and of 92.74%.
Table 3.
Sleep quality classification outcome of WSHMSQP-ODL system for 70% of TR database with distinct classes.
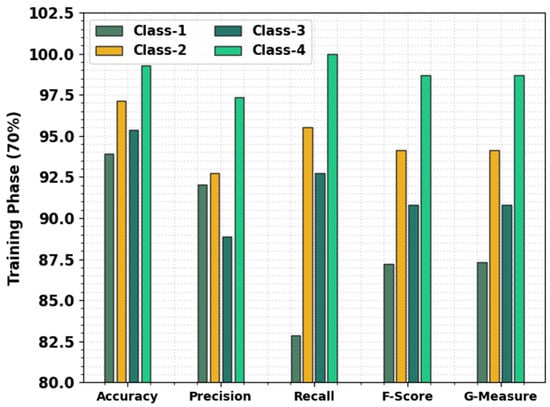
Figure 5.
Overall sleep quality classification outcome of WSHMSQP-ODL system for 70% of TR database.
The confusion matrix provided by the WSHMSQP-ODL technique for 30% of the TS database is demonstrated in Figure 6. The WSHMSQP-ODL algorithm sorts 29 samples into class 1, 32 samples into class 2, 29 samples into class 3, and 24 samples into class 4.
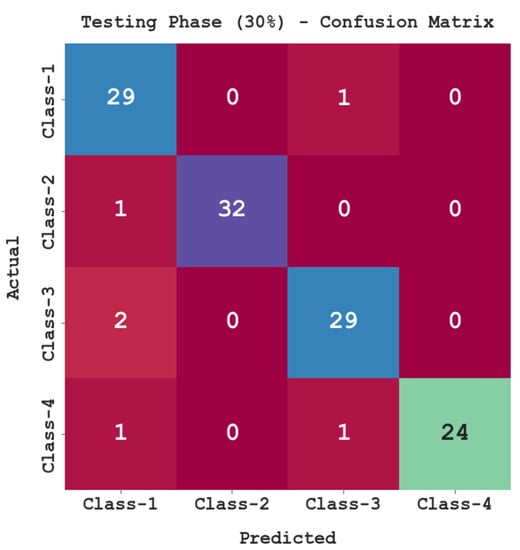
Figure 6.
Confusion matrix of WSHMSQP-ODL system for 30% of TS database.
Table 4 and Figure 7 illustrate comprehensive sleep quality classification results of the WSHMSQP-ODL method for 30% of the TS database. The simulation values show that the WSHMSQP-ODL approach realizes enhanced classification outcomes in every class label. It is notable that the WSHMSQP-ODL algorithm gains an average of 97.50%, of 95.36%, of 94.87%, of 95.02%, and of 95.07%.
Table 4.
Sleep quality classification outcome of WSHMSQP-ODL system for 30% of TS database with distinct classes.
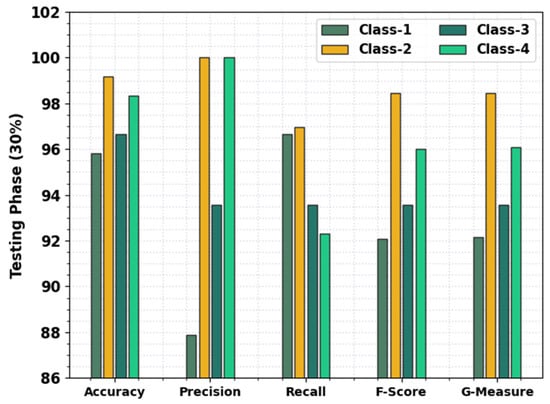
Figure 7.
Overall sleep quality classification outcome of WSHMSQP-ODL system for 30% of TS database.
Finally, a comparison study of the WSHMSQP-ODL model on sleep quality classification is given in Table 5 and Figure 8 [11,21]. The simulation values demonstrate that the LSTM model shows a poor performance with the lowest of 91.67%. Simultaneously, the MLP, CNN, and LR methods report moderately closer classification results. The WSHMSQP-ODL model outperforms the other models with a maximum of 97.50%. These results verify the improved sleep quality classification results of the WSHMSQP-ODL model over other models.
Table 5.
Comparative analysis of WSHMSQP-ODL system with other existing approaches [11,21].
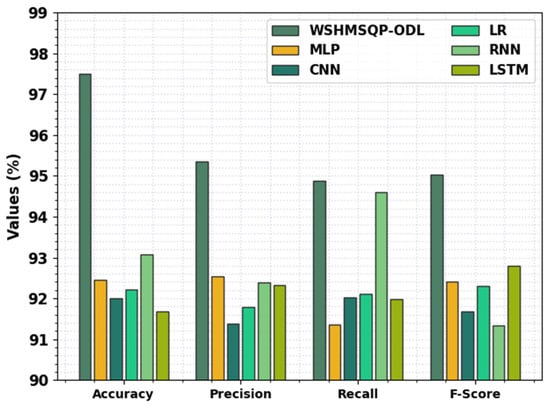
Figure 8.
Sleep quality prediction results of WSHMSQP-ODL with other existing approaches.
5. Conclusions
In this study, a novel WSHMSQP-ODL algorithm was projected to assess sleep quality in a smart healthcare environment. The presented WSHMSQP-ODL technique initially enables the wearables to gather sleep-activity-related data. Next, data pre-processing is performed to transform the data into a uniform format. Moreover, the WSHMSQP-ODL method employs the DBN model for sleep quality prediction. Finally, the ESGO algorithm is used to optimally tune the DBN hyperparameters, and thereby enhance the sleep quality prediction performance. The experimental results of the WSHMSQP-ODL model are examined under different measures. An extensive comparison shows the significant performance of the WSHMSQP-ODL model over other models, with a maximum accuracy of 97.50%. The enhanced performance of the proposed model is due to the optimal hyperparameter selection process using the ESGO algorithm. In addition, the inclusion of the OBL technique in the standard SGO algorithm helps to improve the overall characteristics of the SGO algorithm. In future, feature selection approaches can be included to extend the performance of the WSHMSQP-ODL model.
Author Contributions
Conceptualization, M.A.H.; Methodology, H.A.; Software, M.O. and I.Y.; Validation, M.R. and A.S.Z.; Formal analysis, A.H.A.H.; Investigation, H.A. and A.G.; Data curation, A.H.A.H.; Writing—original draft, M.A.H.; Writing—review & editing, M.O.; Visualization, M.R. and A.S.Z.; Supervision, M.O. and I.Y.; Project administration, M.A.H. and A.G.; Funding acquisition, M.A.H. All authors have read and agreed to the published version of the manuscript.
Funding
Princess Nourah bint Abdulrahman University Researchers Supporting Project number (PNURSP2022R303), Princess Nourah bint Abdulrahman University, Riyadh, Saudi Arabia. The authors would like to thank the Deanship of Scientific Research at Umm Al-Qura University for supporting this work by Grant Code: (22UQU4320484DSR11).
Institutional Review Board Statement
Not applicable.
Informed Consent Statement
Not applicable.
Data Availability Statement
Data sharing not applicable to this article as no datasets were generated during the current study.
Conflicts of Interest
The authors declare no conflict of interest. The manuscript was written through contributions of all authors. All authors have given approval to the final version of the manuscript.
Ethics Approval
This article does not contain any studies with human participants performed by any of the authors.
Consent to Participate
Not applicable.
References
- Pardamean, B.; Budiarto, A.; Mahesworo, B.; Hidayat, A.A.; Sudigyo, D. Sleep Stage Classification for Medical Purposes: Machine Learning Evaluation for Imbalanced Data; Research Square: Durham, NC, USA, 2022. [Google Scholar]
- Phan, D.V.; Chan, C.L.; Nguyen, D.K. Applying Deep Learning for Prediction Sleep Quality from Wearable Data. In Proceedings of the 4th International Conference on Medical and Health Informatics; Association for Computing Machinery: New York, NY, USA, 2020; pp. 51–55. [Google Scholar]
- Sadeghi, R.; Banerjee, T.; Hughes, J.C.; Lawhorne, L.W. Sleep quality prediction in caregivers using physiological signals. Comput. Biol. Med. 2019, 110, 276–288. [Google Scholar] [CrossRef] [PubMed]
- Shen, Q.; Yang, X.; Zou, L.; Wei, K.; Wang, C.; Liu, G. Multi-Task Multi-Attention Residual Shrinkage Convolutional Neural Network for Sleep Apnea Detection Based on Wearable Bracelet Photoplethysmography. IEEE Internet Things J. 2022, 9, 25207–25222. [Google Scholar] [CrossRef]
- Ramachandran, A.; Karuppiah, A. A survey on recent advances in machine learning based sleep apnea detection systems. Healthcare 2021, 9, 914. [Google Scholar] [CrossRef] [PubMed]
- Palotti, J.; Mall, R.; Aupetit, M.; Rueschman, M.; Singh, M.; Sathyanarayana, A.; Taheri, S.; Fernandez-Luque, L. Benchmark on a large cohort for sleep-wake classification with machine learning techniques. NPJ Digit. Med. 2019, 2, 50. [Google Scholar] [CrossRef] [PubMed]
- Liang, Z.; Chapa-Martell, M.A. A multi-Level classification approach for sleep stage prediction with processed data derived from consumer wearable activity trackers. Front. Digit. Health 2021, 3, 665946. [Google Scholar] [CrossRef] [PubMed]
- Gashi, S.; Alecci, L.; Di Lascio, E.; Debus, M.E.; Gasparini, F.; Santini, S. The Role of Model Personalization for Sleep Stage and Sleep Quality Recognition Using Wearables. IEEE Pervasive Comput. 2022, 21, 69–77. [Google Scholar] [CrossRef]
- Sadeghi, R.; Banerjee, T.; Hughes, J. Predicting sleep quality in osteoporosis patients using electronic health records and heart rate variability. In Proceedings of the 2020 42nd Annual International Conference of the IEEE Engineering in Medicine & Biology Society (EMBC), Montreal, QC, Canada, 20–24 July 2020; pp. 5571–5574. [Google Scholar]
- Bahrami, M.; Forouzanfar, M. Deep Learning Forecasts the Occurrence of Sleep Apnea from Single-Lead ECG. Cardiovasc. Eng. Technol. 2022, 13, 809–815. [Google Scholar] [CrossRef] [PubMed]
- Arora, A.; Chakraborty, P.; Bhatia, M.P.S. Analysis of Data from Wearable Sensors for Sleep Quality Estimation and Prediction Using Deep Learning. Arab. J. Sci. Eng. 2020, 45, 10793–10812. [Google Scholar] [CrossRef]
- Zhang, Y.; Yang, Z.; Lan, K.; Liu, X.; Zhang, Z.; Li, P.; Cao, D.; Zheng, J.; Pan, J. Sleep stage classification using bidirectional lstm in wearable multi-sensor systems. In Proceedings of the IEEE INFOCOM 2019-IEEE Conference on Computer Communications Workshops (INFOCOM WKSHPS), Paris, France, 29 April–2 May 2019; pp. 443–448. [Google Scholar]
- John, A.; Cardiff, B.; John, D. A 1D-CNN based deep learning technique for sleep apnea detection in iot sensors. In Proceedings of the 2021 IEEE International Symposium on Circuits and Systems (ISCAS), Daegu, Korea, 22–28 May 2021; pp. 1–5. [Google Scholar]
- Hidayat, W.; Tambunan, T.D.; Budiawan, R. Empowering wearable sensor generated data to predict changes in individual’s sleep quality. In Proceedings of the 2018 6th International Conference on Information and Communication Technology (ICoICT), Bandung, Indonesia, 3–5 May 2018; pp. 447–452. [Google Scholar]
- Khoa, T.A.; Nguyen, D.V.; Nguyen Thi, P.V.; Zettsu, K. FedMCRNN: Federated Learning using Multiple Convolutional Recurrent Neural Networks for Sleep Quality Prediction. In Proceedings of the 3rd ACM Workshop on Intelligent Cross-Data Analysis and Retrieval; Association for Computing Machinery: New York, NY, USA, 2022; pp. 63–69. [Google Scholar]
- Arora, A.; Chakraborty, P.; Bhatia, M.P.S. Intervention of wearables and smartphones in real time monitoring of sleep and behavioral health: An assessment using adaptive neuro-fuzzy technique. Arab. J. Sci. Eng. 2022, 47, 1999–2024. [Google Scholar] [CrossRef]
- Cho, T.; Sunarya, U.; Yeo, M.; Hwang, B.; Koo, Y.S.; Park, C. Deep-ACTINet: End-to-end deep learning architecture for automatic sleep-wake detection using wrist actigraphy. Electronics 2019, 8, 1461. [Google Scholar] [CrossRef]
- Almanaseer, W.; Alshraideh, M.; Alkadi, O. A deep belief network classification approach for automatic diacritization of arabic text. Appl. Sci. 2021, 11, 5228. [Google Scholar] [CrossRef]
- Dhiman, G.; Kumar, V. Seagull optimization algorithm: Theory and its applications for large-scale industrial engineering problems. Knowl.-Based Syst. 2019, 165, 169–196. [Google Scholar] [CrossRef]
- Asiri, Y.; Halawani, H.T.; Alghamdi, H.M.; Abdalaha Hamza, S.H.; Abdel-Khalek, S.; Mansour, R.F. Enhanced Seagull Optimization with Natural Language Processing Based Hate Speech Detection and Classification. Appl. Sci. 2022, 12, 8000. [Google Scholar] [CrossRef]
- Sathyanarayana, A.; Joty, S.; Fernandez-Luque, L.; Ofli, F.; Srivastava, J.; Elmagarmid, A.; Arora, T.; Taheri, S. Sleep quality prediction from wearable data using deep learning. JMIR mHealth uHealth 2016, 4, e6562. [Google Scholar]


Disclaimer/Publisher’s Note: The statements, opinions and data contained in all publications are solely those of the individual author(s) and contributor(s) and not of MDPI and/or the editor(s). MDPI and/or the editor(s) disclaim responsibility for any injury to people or property resulting from any ideas, methods, instructions or products referred to in the content. |
© 2023 by the authors. Licensee MDPI, Basel, Switzerland. This article is an open access article distributed under the terms and conditions of the Creative Commons Attribution (CC BY) license (https://creativecommons.org/licenses/by/4.0/).