Article

Assessing the Challenges and Opportunities of Agricultural Information Systems to Enhance Farmers’ Capacity and Target Rice Production in Indonesia

by
Agung Budi Santoso
1,
Setia Sari Girsang
2,*,
Budi Raharjo
3,
Arlyna Budi Pustika
2,
Yanter Hutapea
4,
Mahargono Kobarsih
5,
Agus Suprihatin
2,
Erpina Delina Manurung
2,
Deddy Romulo Siagian
6,
Sidiq Hanapi
7,
Tommy Purba
8,
Dorkas Parhusip
9,
Sri Wahyuni Budiarti
2,
Yeyen Prestyaning Wanita
5,
Retno Utami Hatmi
5,
Moral Abadi Girsang
8,
Lermansius Haloho
8,
Waluyo
2,
Suparwoto
2,
Yustisia
2 and
Sudarmaji
2
add Show full author list remove Hide full author list
1
Research Center for Macroeconomics and Finance, Indonesian National Research and Innovation Agency, Jakarta 12710, Indonesia
2
Research Center for Food Crops, Indonesian National Research and Innovation Agency, Bogor 16915, Indonesia
3
Research Center for Appropriate Technology, Indonesian National Research and Innovation Agency, Subang 41213, Indonesia
4
Research Center for Social Welfare, Village, and Connectivity, Indonesian National Research and Innovation Agency, Jakarta 13630, Indonesia
5
Research Center for Food Technology and Processing, Indonesian National Research and Innovation Agency, Gunung Kidul 55861, Indonesia
6
Research Center for Geospatial, Indonesian National Research and Innovation Agency, Bogor 16911, Indonesia
7
Research Center for Behavioral and Circular Economics, Indonesian National Research and Innovation Agency, Jakarta 12710, Indonesia
8
Research Center for Coorporative, Corporation, and People’s Economy, Indonesian National Research and Innovation Agency, Jakarta 12710, Indonesia
9
Research Center for Horticultural and Estate Crops, Indonesian National Research and Innovation Agency, Bogor 16915, Indonesia
*
Author to whom correspondence should be addressed.
Sustainability 2023, 15(2), 1114; https://doi.org/10.3390/su15021114
Submission received: 9 November 2022 / Revised: 12 December 2022 / Accepted: 21 December 2022 / Published: 6 January 2023

Abstract

:
Current technological developments make it easier for users to access the information needed in handling their farming. The study’s objectives are to determine the performance of the agricultural information system (AIS) service for rice commodities and the relationship of these service indicators to each other in increasing farmer capacity and rice production in Indonesia. The research was conducted in three rice center provinces, North Sumatra, South Sumatra, and Yogyakarta, from October to December 2021. The number of respondent farmers is 473 people who have obtained or applied for AIS for at least two years. Survey techniques using purposive sampling with a non-probability method with the criteria used are farmers or officials who have received information about AIS. Partial least square structural equation modeling (PLS-SEM) analysis with the help of SmartPLS v.3.2.9 software was performed to see multivariate relationships and continued by using importance performance analysis (IPA) to evaluate the performance of information system attributes. The results showed that the productive age, education level, and experience in rice farming were more than 10 years, enabling the application of AIS in Indonesia by strengthening the internet network and improving the attributes of security services, ease of application, accuracy, suitability, output interpretation, and accuracy, which will increase user loyalty.

1. Introduction

An information system collects and processes data in an organized environment between humans, computer hardware and software, data and knowledge, facilities, services, and telecommunications networks to produce important information needed for decision-making [1]. Information system technology has developed rapidly and is utilized in various sectors, including agriculture. The application of AIS technology as a tool in determining cropping patterns, fertilizer application, pest management, and marketing [2] is expected to have an impact on the social and economic development of farming communities either directly, by increasing productivity, or indirectly, by providing various options for profitable agricultural methods and activities [3]. In addition to increasing production, AIS based on more complex remote sensing techniques can inform agricultural inputs and techniques that are site-specific, more capital efficient, and environmentally friendly [4].
In addition to increasing production, AIS based on more complex remote sensing techniques can inform agricultural inputs and techniques that are site-specific, more capital efficient, and environmentally friendly. Socialization for users/farmers has also been implemented on a massive scale, resulting in the use level being moderate to high [5]. Nevertheless, the process of adopting AIS needs to consider the challenges related to the availability of technological infrastructure and the characteristics of farmers [6]. It is consistent with the statement [7] that the characteristics of farmers and agriculture, technological features, such as the interface or software used, and the external environment are factors that influence the adoption of AIS by farmers.
The challenge of adopting an AIS related to the availability of technological infrastructure in Indonesia has been pursued through a sustainable infrastructure development program from the government and all related parties. One of them is the construction of the Base Transceiver Station (BTS) network in Indonesia, which continues to be conducted to spread the internet to remote areas. Central Bureau of Statistics data for the last 10 years (2011–2020) show an increase in the total number of villages/wards with BTS towers by 39.86 and 92.02% for urban and rural areas [8,9]. The development has contributed to Indonesia’s position as one of of the countries with the largest internet users in Asia and globally. According to world statistics data, which can be accessed through https://www.internetworldstats.com/stats (accessed on 9 December 2022), Indonesia was previously ranked 4th and 8th [8], and has now risen to 3rd and 4th place as the country with the largest number and internet users in Asia and globally, respectively.
In contrast to the availability of technology infrastructure, adoption challenges related to farmer and agricultural characteristics are quite difficult to overcome. Information systems are dominated by young farmers accustomed to using the internet (engaging) [10]. Meanwhile, from the data of BPS [11], it is known that 61% of the total farmers are in the age range of 45 to 65 years, 61.84% of the total agricultural households have land tenure <0.5 Ha, 66% have an elementary level of education, and only 13% are internet users. For the characteristics mentioned above, the result show that the level of technology adoption is positively influenced by land area [12] and farmer education level [13] and negatively influenced by age [14,15]. In addition to the length of farming and the number of media ownership, each has a negative and positive correlation with farmers’ internet use [16]. Sumardjo et al. [17] detail attitudes, knowledge, skills, and social status as other significant factors affecting farmers’ accessibility to AIS.
Appart from that, the level of adoption and success of a developed agricultural system is also influenced by the characteristics of the AIS product. In order to assess and evaluate the success of the AIS, DeLone et al. [18] state that the model establishes the quality of information, systems, services, and benefits as factors that trigger the growth of interest, use, and user satisfaction in a sustainable manner [19]. In more detail, the technology features include interoperability issues, system complexity, such as insensitive interfaces, the number of features being too large and unnecessary, high technology costs [7], poor marketing, system inconsistency, unprofitability and lack of targeting, which can trigger the failure of an AIS [20]. Based on the description, research on the quality of AIS services, user experience, and loyal users needs to be performed on the characteristics of farmers or users in Indonesia. This aims to increase the level of adoption from the user stage to loyalty, ultimately realizing a sustainable AIS.
Service quality is assessed by comparing consumer perceptions of the actual service received with what is expected [21,22], which directly and significantly affects customer satisfaction and loyalty [23]. The Servqual model, which consists of five main dimensions, especially reliability, responsiveness, assurance, empathy, and tangibles, is considered the most reliable service quality test tool [24], the oldest, and applicable to various forms of services that serve as the basis for the development of other quality assessment models [25]. Furthermore, user experience assessment is needed to determine user experience, needs, and emotions when using software-based services [26], such as AIS. User experience evaluation using the user experience questionnaire (UEQ) method has six scale, attractiveness, efficiency, vividness, credibility, excitability, and novelty, with a total of 26 items, detailed in [27,28].
However, there have been limited studies about the AIS, specifically to seek the challenges and opportunities of this particular system. Two method approaches, PLS-SEM and IPA, are combined to identify the relationship between AIS variables and to generate strategy quidelines to improving AIS services. The objectives of the study is to determine the performance of rice commodity AIS services and the relationship between the service indicators to improving farmers’ production capacity and rice production in Indonesia.

2. Materials and Methods

2.1. Site Description

The research was implemented in 3 provinces, i.e. North Sumatra and Yogyakarta are lowland rice farmers, and South Sumatra is tidal swamp land farmers. North Sumatra consists of 6 sub-districts in 3 regencies: (1) Pantai Labu 3°39′3″ N and 98°55′9″ E, 150 masl; (2) Beringin 3°38′4″ N and 98°55′1″ E, 60 masl; (3) Siantar 2°58′16.3″ N and 99°5′55.3″ E, 410 masl; (4) Tanah Jawa 2°53′43″ N and 99°10′46″ E, 303 masl; (5) Panombean Panei 2°95′42″ N and 99°02′66″ E, 427 masl; (6) Perbaungan 3°31′54″ N and 99°9′9″ E, 145 masl. South Sumatra consists of 7 sub-districts in 3 regencies that were: (1) Rambutan 4°54′45.1″ S and 104°51′51.3″ E, 36.5 masl; (2) Talang Kelapa 2°54′7″ S and 104°50′47″ E, 2.7 masl; (3) Lempuing Jaya 3°46′29″ S and 104°51′54″ E, 36.2 masl; (4) Tanjung Lago 3°22′37.4″ S and 105°15′31.9″ E, 16.5 masl; (5) Muara Telang 2°39′56″ S and 104°54′4″ E, 13.1 masl; (6) Pemulutan 4°53′21.8″ S and 104°46′35.3″ E, 4.5 masl; and (7) Tungkal Ilir 3°25′56.2″ S and 104°11′48.1″ E, 21.1 masl. Yogyakarta consists of 5 sub-districts in 3 regencies that were: (1) Prambanan: 7°47′56″ S and 110°28′29″ E, 92.3 masl; (2) Imogiri: 7°55′38″ S and 110°22′16″ E, 61.4 masl; (3) Berbah: 7°48′45″ S and 110°27′54″ E, 84.2 masl; (4) Pathuk: 7°52′37″ S and 110°29′51″ E, 134.4 masl.; (5) Piyungan: 7°49′58.862″ S and 110°28′39.386″ E, 86.3 masl. The research was conducted from October to December 2021.

2.2. Data Collection and Statistical Analysis

The study collected the primary data from 473 respondents, which derive from three provinces: North Sumatra, South Sumatra, and Yogyakarta (Table 1). The respondents’ election was determined by using non-probability sampling method with the purposive sampling technique. The selected respondents must meet the requirement of having participated in the socialization of AIS, which was organized by the local government or the ministry of agriculture for at least 2 years. The questionnaire components used in this study can be seen in Table A1 (Appendix A).
Multivariate relationships in this model were performed using partial least square structural equation modeling (PLS-SEM) analysis method with the help of SmartPLS v.3.2.9 software. The latent variables in this model consist of service quality, user experience, consumer satisfaction, and loyalty. Service quality indicators consist of tangibles, reliability, responsiveness, assurance, and empathy [29]. User experience indicators include attractiveness, perspicuity, efficiency, dependability, stimulation, and novelty [27,30]. Indicators of customer satisfaction attributes consist of service features, customer emotions, attributions, perceptions, and other customers [31]. Loyalty indicators consist of repeat, retention, and referrals [32]. Several theories of satisfaction, service quality, and user experience were combined and used as attributes of the study. The explanation of the code and the meaning of each attribute is described in Table 2.
Two evaluation models in PLS were the outer model (measurement model) and the inner model (structural model) [33]. The outer model defines how each indicator block relates to its latent variable. The outer model is evaluated with reflexive indicators through convergent validity, discriminant validity, average variance extracted (AVE), and composite reliability. At the same time, the inner model describes the relationship between latent variables based on substantive theory. The inner model is evaluated based on the R-square values for each latent dependent variable [34]. Furthermore, after knowing the relationship between latent variables, we analyzed consumer interest and satisfaction using importance–performance analysis (IPA). IPA can be used to evaluate and improve customer satisfaction strategies by presenting gaps in the level of importance and satisfaction of each indicator in the service quality variable [35].

3. Results

3.1. Respondent Characteristics

Farmers have a crucial role within the household’s survival, especially as the head of the family who has several roles that must be undertaken at the same time, in the form of support for the family economy, farmers, and even ordinary people who live in an environment. Livelihoods as farmers can be categorized as heavy work, also regardless of gender. Table 3 shows that, out of 473 respondents, 78.86% were male, and 21.14% were female. Male and female responders are significantly underrepresented in the sample. This is due to the dominance of men who become the family backbone. Most of them also become more dominant in decision-making, especially in farming communities in tidal fields. Furthermore, age in terms of an indicator in socio-economic studies of agriculture in Indonesia is often categorized as productive and non-productive age, respectively, for the age range of 16–64 and 64 years. Other age-related categories discussed recently are young and old farmers aged 16–30 and >30 years, respectively.
On the other hand, the profession or main job is the main source of income to meet the family’s needs and takes up more time. The main professions of respondents are farmers: 84.78% and 13.96% as extension workers, 0.42% as traders, and 0.21%, respectively, as official officers, observers of plant pest controller (POPT), village secretaries, and entrepreneurs. Furthermore, the level of education affects the ability of the head of the household to absorb information. The more advanced the education of the head of the family, the better they are in absorbing information. This is related to rice farming technology, which is always developing. A person’s level of education makes it easier to understand the terms and application of the recommended new technological package innovations. Respondents have 0–6 years of education at the elementary school level at 30.23%, 7–9 years of education or junior high school level at 20.72%, and 10–12 years or the equivalent of high school at 31.93%. Among the respondents who took the tertiary level of 17.1%, they are generally agricultural extension workers.

3.1.1. Characteristics of the Respondent in Rice Farming

The land is a decisive factor in any farming. Farmers will produce high production if they have large land because there is an increase in plant populations. Fertile soil conditions with the availability of sufficient and controlled water will increase the production of the rice plant. Most respondents (57.93%) have a land area of fewer than 0.5 hectares, 0.51–1 ha as much as 23.47%, and an area of 1.1–5 ha as many as 17.76%. Some respondents have land above 5 ha, which is 0.84% (Table 4). Previous studies on the rice yield gap showed that the area of use of irrigated rice fields during the rainy season in Yogyakarta (Indonesia) was the lowest compared to several other regions in Southeast Asia, which was only 0.18 ha, while in Can Tho (Vietnam) it was 2.14 ha, in Nakhon Sawan (Thailand) it was 4.84 ha, and in Bago (Myanmar) it was 4.87 ha [36].
Farming experience, especially in rice commodities, can support the success of farming. This is related to rice cultivation techniques, such as selecting certified superior seeds, land management, use of fertilizers, pest control, harvesting, and post-harvest to manage production costs. The more experienced the respondent is as a farmer, the more successful he is in running his farm. Respondent farmers who have farming experience more than 10 times over are quite large, reaching 62.79%, while the remaining 37.21% have farming experience less than ten times over.

3.1.2. Respondents’ Attributes Based on the Use and Usability of Cell Phones

Appropriate use of mobile phones by farmers affects the ability of farmers to absorb information. The more the farmers use cell phones, the better they are in accessing and absorbing information. This is related to access to absorb innovation, and the application of rice farming technology will be better in 40% of respondents who use cell phones less than 2 h day−1, indicating that most of the respondents (84.8%) are farmers who work a lot in their fields from morning to evening and use them to rest at night. Respondents who use cell phones for 3–4 h day−1 represent 16.3%, and respondents who use cell phones for 5–6 h day−1, represent 15.6%. Meanwhile, those who use cell phones for more than 6 h day−1 represent 28.1%.
The level of respondents’ spending on pulse fees will affect the wise use of cell phones. As a farmer, it certainly affects his ability to absorb information. The higher the respondent’s expenditure on credit costs and using cell phones, the better they are in accessing and absorbing information. Most of the respondents spent the purchase of pulses in one month between IDR 50,000–IDR 100,000 by 38%, and farmers spent money to purchase credits of less than IDR 50,000 every month by 35%, while the rest of the respondents spent more than IDR 100,000 in credit months (Table 5).
Technological innovations that are applied are not only in the form of agricultural machines, but also in how agricultural products can be of high productivity through planting methods, cropping patterns, irrigation management, and so on, which are technological packages that have been recommended in rice cultivation in various agroecosystems. The level of adoption of respondents responding to information on agricultural technology innovations, especially rice cultivation through AIS varies, where most respondents (48.00%) have tried to apply the recommended technological innovation package, and 15.60% often use or apply it. As many as 25.40% have heard of the latest agricultural technology information and can increase production, and a small percentage (11%) have never heard of the AIS. The two reasons behind for those who never heard about AIS are due to their new membership status in the farmer group and their absence during socialization activity. Most respondents (60.67%) stated that they used AIS to look for the information about fertilizer recommendation for their rice land.

3.2. Relationship of Service Attributes, User Experience, Satisfaction, and Loyalty Based on PLS-SEM Analysis

The data analysis technique used quantitative descriptive analysis and partial least square structural equation modeling (PLS-SEM). PLS-SEM is a multivariate statistical analysis method to analyze the correlation between variables that combines the approaches of factor analysis, structural model, and path analysis. PLS-SEM is a structural equation model to develop or prognosticate being theory. The equation models analyzed are the outer, inner, and hypothesis testing.

3.2.1. Dimension Model (Outer Model)

Figure 1 displays the results of the analysis of AIS pointers conducted using an external model (measurement model).
The findings indicated that the Cronbach alpha value for service attributes (0.937), customer satisfaction (0.938), loyality (0.897), user experience (0.917), composite reliability of service attributes (0.945), customer satisfaction (0.949), loyality (0.924), and user experience (0.931) show a value >0.7. This means that the reliability of each indicator is consistent as a measuring tool (Table 6).

3.2.2. Structural Model Analysis (Inner Model)

The findings demonstrated a statistically significant association between service qualities and customer satisfaction in the causal relationship between indicators (t-stat = 2.505) and a very significant relationship between service attributes on user experience (16.392), customer satisfaction on loyalty (11.067), and user experience on customer satisfaction (25.596). At the same time, the relationship between service attributes on loyalty (1.680) and user experience on loyalty (1.307) is not significant (Figure 2).
In order to determine the size of the structural path coefficient, the structural model in PLS is calculated by examining the percentage of variance explained by R2 (R-square) (Table 7). When comparing changes in the independent variable to the dependent variable, R2 is utilized to measure the variety of such changes. The vaticination model of the suggested study model performs better the farther R2 means are advanced. As a result of the analysis, it was determined that the customer satisfaction indicator has a R2 value of 0.644, which indicates that 64.40% of the indicator’s variables may account for the accurately anticipated model. The R2 value of the loyalty indicator is 0.625, indicating that the loyalty indicator variable can explain the well predicted model of 62.50%, and variables outside the indicator explain the rest. The R2 user experience value of 0.309 indicates that the user experience indicator variable is unexplained in the predicted model well because it can only explain the dependent variable of 30.90%.
There are three causal relationships (direct influence), which are very real in relation to probability <0.01: service attributes to user experience, customer satisfaction to loyalty, and user experience variables to customer satisfaction, representing 0.556, 0.671, and 0.746 for the path coefficient, independently. The direct effect of the service attribute on customer satisfaction was represented by a path measure value of 0.095. As for service attributes on loyalty, the user experience variable on loyalty has an insignificant effect (Probability > 0.05) with path measure values of 0.073 and 0.096, independently (Table 8).

3.3. Evaluation of AIS Service Attributes Based on IPA Analysis

Management of agricultural information quickly, precisely, and accurately is an organization’s demand in providing services to users. The existence of various applications of agricultural information sources brings technological innovation closer not only to farmers, but also to other users, such as extension workers, traders, other agricultural officers, and even policymakers. For an application to be effective, efficient, and able to provide satisfaction to users, it must be able to provide opportunities for users to complete their activities on the application as well as possible. Based on the IPA approach, from the 12 attributes, there are five attributes in quadrant 1: ease of application, ease of interpreting output, accuracy of the information, security of personal data, suitability (convenient) of the information. These attributes have high importance for users, but their performance is still considered low. Thus, these attributes need to be improved because even though they are considered important for users, they are unsatisfied (Figure 3).
Attributes that are in quadrant 2 are the clarity of information presentation and easy-to-understand menus. For both attributes, the user feels that the importance is high and is appropriate so that they feel satisfied. This attribute must be preserved. The attributes in quadrant 3 are speed in service, current, and information layout. These three attributes are considered less important for users with low performance. The effect on the benefits felt by the user is small, so it has a low priority for improvement. Managers do not need to prioritize attributes in this quadrant. The attributes in quadrant 4 are language and conciseness of information, whereas, in this quadrant, the attributes are considered less important, and the user is satisfied. Thus, the attributes in this quadrant are considered redundant. Implementing attributes in quadrant 4 is not a priority in improving the performance of agricultural information applications where the resources for applying them can be allocated to other attributes that need to be improved and have more important priorities.

3.4. Correlation of Respondents Characteristic and the Satisfaction Level on AIS Services

Based on Table 9, it shows that the area of land tenure, the time of using a cell phone every day, and the cost of buying monthly pulse have a significant correlation with the level of AIS satisfaction. Meanwhile, age, length of education, and experience of farming have no statistically significant correlation with AIS satisfaction level.

4. Discussion

The results show that men dominate in the access and determination of their farming business. The same trend is found in other countries, such as Ghana, where men’s access to various production resources is greater and superior in access to credit than women’s [37]. Another study about the men’s title role and womankind’s in farming activities was done within four rice-producer countries: Indonesia, Thailand, Myanmar, and the Philippines. Across all research sites, there is a common division of labor between men and women when doing physical activities in the field, such as land preparation and spraying pesticides, which men dominantly handle. At the same time, food preparation for labor is predominantly handled by women. In another aspect, women’s decisions were made powerful, men listened to women’s opinions, and joint decisions occurred in households between husbands and wives.
In contrast, in Yogyakarta, the decisions related to rice farming are powered by the community of farmers’ groups in their place of household [38]. The presence of an AIS that is now freely accessible without time and location restrictions can be utilized by women who have limited mobility and time due to the burden of other household chores [39] by playing an active role in accessing the various agricultural information needed. Ownership of supporting facilities, such as mobile phones, is an important consideration that needs to be considered by various related parties when trying to empower women as accessors of agricultural information and services so that later they can participate more in household decision-making and agricultural production [40]. Akter et al. [38] found that credit decisions in Indonesia, Myanmar, the Philippines, and Thailand are mutual agreements between husband and wife, including purchasing agricultural inputs and daily household needs. In Yogyakarta, the women farmers’ group is the main credit source for borrowing money for agricultural input and daily needs. Women construct the greater part of household payment decisions independently, while men rarely have part in executing the house policy due to the most important expenses. Women had decisions regarding diet expense, saving, and domestic needs (such as medical and schooling expenses). The necessary expenses incorporate inputs for rice farming (such as labor cost, pesticides, fertilizer, seeds, and machinery) and education for children (including mobile phones during this two-year COVID-19 period). Other main concerns are the day-to-day household essentials and transportation. This result adds force to women’s essential position in coping with household finances and thus emphasizes their ability to perform as promoters to attain the security of food, children’s education, and family’s health.
Based on the farmer’s age category, of the total farmers in Indonesia, about 85% are of productive age (25–65 years), and >89% include old farmers [11]. Characteristics of respondents regarding age, almost 92% belong to the productive age group (16–64) and 12% belong to the group of young farmers (16–30). In contrast to the adoption of agricultural technology in general, which can be based on the categories of productive and non-productive age, specifically for the adoption of AIS technology, it should be distinguished into two forms of adoption capability, which are: (1) adoption related to the respondent’s ability to access and use the existing AIS and (2) adoption related to the respondent’s willingness to implement the recommendations of the AIS in the field. Findings in the field indicate that the level of application of technology recommendations sourced from AIS negatively correlates with respondents’ ability and frequency of access. Farmers actively act as adopters of technology recommendations from an AIS, while the acquisition of information is still implemented by facilitators, either from extension workers, researchers, or other related parties. Various factors, specifically low literacy skills, reluctance and lack of confidence, difficulties in operating cellphones/computers, and health declines, such as vision in older farmers, may not hinder their willingness and ability to apply AIS recommendations in the field, but will affect their ability to access and use AIS. Djuara and Sulistiawati [41] agree that older farmers use AIS less frequently because of the difficulties they experience in using digital information. Khan et al. [42], in their research on wheat farmer respondents in Pakistan, reported the same trend youth farmers who have an interest in the use of innovative technology, as well as skills and experience in using information media, which will be more active in adopting AIS. In Yogyakarta, agricultural labor was dominated by the productive age (25–65 years), including old farmers. Labor productivity was low regarding low use of machinery for planting, harvesting, and threshing. This discovery highlighted the relationship between labor use and mechanization adoption regarding farmers’ age [43]. Usually, youths will adopt technology (including machinery and technology information) faster than the old farmers. Therefore, establishing more young farmers who lead the usage of technology communication and information (ICT) is very important for developing the sustainability of agriculture [44]. Various government efforts are expected to encourage an increase in the interest and number of young Indonesian farmers by changing the youth’s perspective on the image of agriculture, which is considered less prestigious, and the lack of income in the agricultural sector, especially food crops [45].
Education level also influences technology adoption. A higher level of education affects the understanding of accessing information and absorbing the latest technological methods or innovations and government policies to increase rice farming. Research by Afful-Dadzie et al. [46] in rural Ghana introduced AIS through Agrocenta (https://agrocenta.com/, download on 9 December 2022). From 129 respondents who are small farmers, it is illustrated that the most affected age group is >55 years old (25.58%), wherein the male gender is 58.91%, whereas the most non-formal educational background is 55.81%. In Yogyakarta, most farmers own land, and the main source of income is rice farming. However, farm sizes are comparatively smaller than South Sumatera and North Sumatera. In many cases, even though they are the owner of their land, they work as laborers on other farms to obtain their wage as supplementary income, as well. It comprises a considerable portion of their earnings for several farmers either fulfill the need during the break period between rice harvests. Moreover, women cultivate horticulture, promote livestock and poultry, or develop small commerce. Men make supplementary proceeds by working in building construction. Farmers’ years of education are moderate (elementary school) to high school (10–12 years) [38].
Farming experience in general affects the level of success of farmers in their farming, especially in increasing rice productivity. The longest farming period for small farmers as research respondents on the use of AIS in rural Ghana is the highest at 20 years, which is 37.98% [46]. In Yogyakarta, the farm size is on average 0.1–0.15 ha. In this area, rice crops are grown as two and sometimes three crops every year: the crops of the wet season (December to March), as well as the crop of the dry season (April to July) [47]. Farming experience is 0–20 years, and most have more than 10 years of experience in rice farming. During their farming period, they have been announced for improving the varieties. An estimate of 97% described that they implemented a new variety and still cultivated the new improved variety. Farmers no longer planted a new variety, which stated that another variety exchanged the existing variety.
Furthermore, another reason to no longer cultivating the new varieties was less productivity, and the variety was not appropriate with the cropping pattern of farmers. Farmers were also led into emplying mechanical harvests, transplanter machines, alternate wetting and drying (AWD), direct seedlings using drum seeds, and the hermaetic bag of IRRI [48]. AWD encouraged farmers to not simultaneously flood the soil, as well as applying the drying condition for one or two days after the water is removed [49]. Rice productivity from irrigated paddy rice, tidal swamp rice, lebak swamp, and upland rice is calculated per unit area of land, i.e., tons per hectare. Most of the farmers with a total of 200 people, or 42.30%, obtained harvested dry rice productivity in the range of 3–6 t ha−1, and farmers who obtained dry-harvested rice productivity of 6–9 tons totaled 138 people, or 29.20%. There are eight farmers, or 1.7 percent, which obtain dry grain rice productivity above 9 t ha−1.
Meanwhile, the number of farmers who get dry grain rice productivity lower than three t ha−1 is 127 people, or 26.8%. Looking at the rice productivity trend data from the calculation of the Central Statistics Agency’s figures, the rice productivity in 2019 was only 5.11 t ha−1, then, in 2020, it was 5.13 t ha−1, and, in 2021, it was 5.23 t ha−1 [50]. According to Devkota et al.’s [43] study, rice production in wet season was less compared to the dry season in most rice producing countries in Asian countries. Moreover, the dry season had a 16% (0.8 t ha−1) higher yield than the rainy season. The study found that the variation of grain yield among farmers was high in Yogyakarta. It is suggested that farming experiences and technology adoption affected the gained yield.
Technological innovations that are applied are not only in the form of agricultural machines, but also related to how agricultural products can be of high productivity through planting methods, cropping patterns, irrigation management, and so on, which are technological packages that have been recommended in rice cultivation in various agroecosystems. The level of adoption of respondents responding to information on agricultural technology innovations, especially rice cultivation through AIS varies, as investigated, where most respondents (48.00%) have tried to apply the recommended technological innovation package and 15.60% often use or apply it. As many as 25.40% have heard of the latest agricultural technology information and can increase production, and a small percentage (11%) have never heard of the AIS.
This research result is similar to other research results where farmers prefer adopting the applicable technologies, which can be implemented easily. [48,51]. Other findings showed which field trials and demo plots could effectively adopt improved farming practices. Knowledge acquisition about technology will be necessitated to impact changes. According to Connor et al. [52], farmers observe changes in society and community wealth, representing that they obtained information that they succeeded in spreading among farming group members. Community capital is the main condition in considering farmers’ deeds in adopting technology adoption [53,54]. However, it must be noted that the familiarized technologies and the implementation at farmers’ levels did not straightforwardly encourage social and community capital [52].
The internet is a network to ease communication and to connect information between particular electronic media to another in precise and quick ways. The information will be sent via a transmission of particular signal frequency named internet network. According to James and George [55], the internet is a computer network growing rapidly. The use of the internet can bring benefits and positive impacts to the world of agriculture, education, business, and government. The condition of the internet network at the research location is very diverse, with a weak to strong internet signal. The distribution of internet network conditions is dominated by the moderately strong category (41.44%), followed by the strong category at 24.52%, the weak category at 19.66%, and more often at the weak category at 14.38%. Such conditions will certainly greatly affect the level of access of farmers/communities to media information that utilizes the internet network. Based on Harahap [56], the utilization of ICT by agricultural business households is not yet optimal due to household education, which is mostly at the low level, low ICT submission, and the absence of broadband interconnection support, making it difficult to access the internet. Therefore, it is necessary to make extension officer (PPL) effective, as well as the acceleration of telecommunications infrastructure development as a way in strengthening the signal of telecommunications. Burhan [57] conveyed that ICT services that were affordable to agricultural communities resulted a significant role to enlighten community economic level.
AIS benefits can increase rice production, reduce the risk of harvest failure, optimize farmers’ profits, and increase farming efficiency. In addition, finding information about the latest agricultural cultivation can also be a means of exchanging information between farmers and related stakeholders so that the marketing function of agricultural products goes well and farmers get a decent profit. Furthermore, ICT in developing countries plays a quite supportive role in decision-making by farmers regarding planting and harvesting times [56]. The results showed that, from the AIS that users often access, fertilization recommendations reach 60.67%, determining planting time and variety recommendations, respectively, reach 43.76% and 36.57%, and other information reaches 5.70%, such as the potential for attack by plant-disturbing organisms and the presence of agricultural equipment and machinery. Research by Tadesse and Bahiigwa [58] stated that very few farmers have admittance to some information relating to agricultural price of products compared to traders. Likewise, in traditional markets, there is also asymmetric information between farmers and traders on the prices of agricultural products in regional/central markets.
According to Abdillah et al. [59], PLS is a variant-based SEM statistical model created to overcome the problem of involved variable structure or constructs the small size of research sample, missing data, and multicollinearity. PLS explains the latent variable as a linear cumulative of its indicators. Estimating the weight of latent variables is done by creating an inner model (a structural model which links among variables) and an outer model (a model of measurement to providethe specified). According to Abdillah et al. [59], the PLS specification model in path analysis consists of three types of relationships, which are inner model, outer model, and weight relation. The inner model specifies the contributory connection among latent variables (structural model). Meanwhile, specified connection between estimated indicators and the variables of latent can be resulted by the outer model (measurement model). The weight relation shows the connection among values of variance between indicators and latent variables. This research aimed to explain the connection between user experience and user loyalty in AIS technology.
PLS-SEM usage has sharply enlarged within the last few years [60], and it is related to strategic management [61], marketing [62], accountancy [63], information systems [64,65], family business [66], and tourism [67]. In general, PLS-SEM is more widely used in many aspects of research due to its high prediction rate compared to multiple regression [63].
Based on Abdillah et al. [59], the connection amid the latent variable and the indicator block is described by the outer model. This model is applied to assess the reliability of the model validity. In addition, the dominant indicators in forming latent variables are known. Furthermore, the impact of each variable is either exogenously latent or endogenously latent, and it can be described as such. After knowing both variable, the model of conceptual can be tested. The PLS approach to test modelling results of the structural equation was performed on the outcome, which is either the model of measurement (outer model) or the structural model (inner model) [68].
The stages in testing the model of measurement include testing of composite reliability, validity of discriminant, and validity of convergent. If all the indicators in the PLS model are fulfilled by the three requirements, then the analysis results of PLS are feasible to be implemented to assess the hypothesis of a research [69]. The convergent validity test was performed based on the value of loading factor from every indicator to the construct. Factor weights of a minimum of 0.5 are declared to have very high validation to describe the latent construct [70]. In several studies, the base limit of loading factor is 0.5, with the requirement for the excreted variance of average (AVE) for every construct more than 0.5 [71]. Validity of discriminant ensures that every concept of every variable of latent is dissimilar from the other variables. If the AVE squared value of every exogenous construct (diagonal value) is more than the connection between particular construct and the other (value below the diagonal), then the model is declared to have respectable discriminant validity [72]. In addition to validity testing, PLS also performs reliability tests to measure the internal consistency of the measurement tool. Measurement of composite reliability can be use to define the real value of the reliability of a construct. The rule of thumb for composite reliability should be more than 0.7, however, the 0.6 value is still tolerable (59).
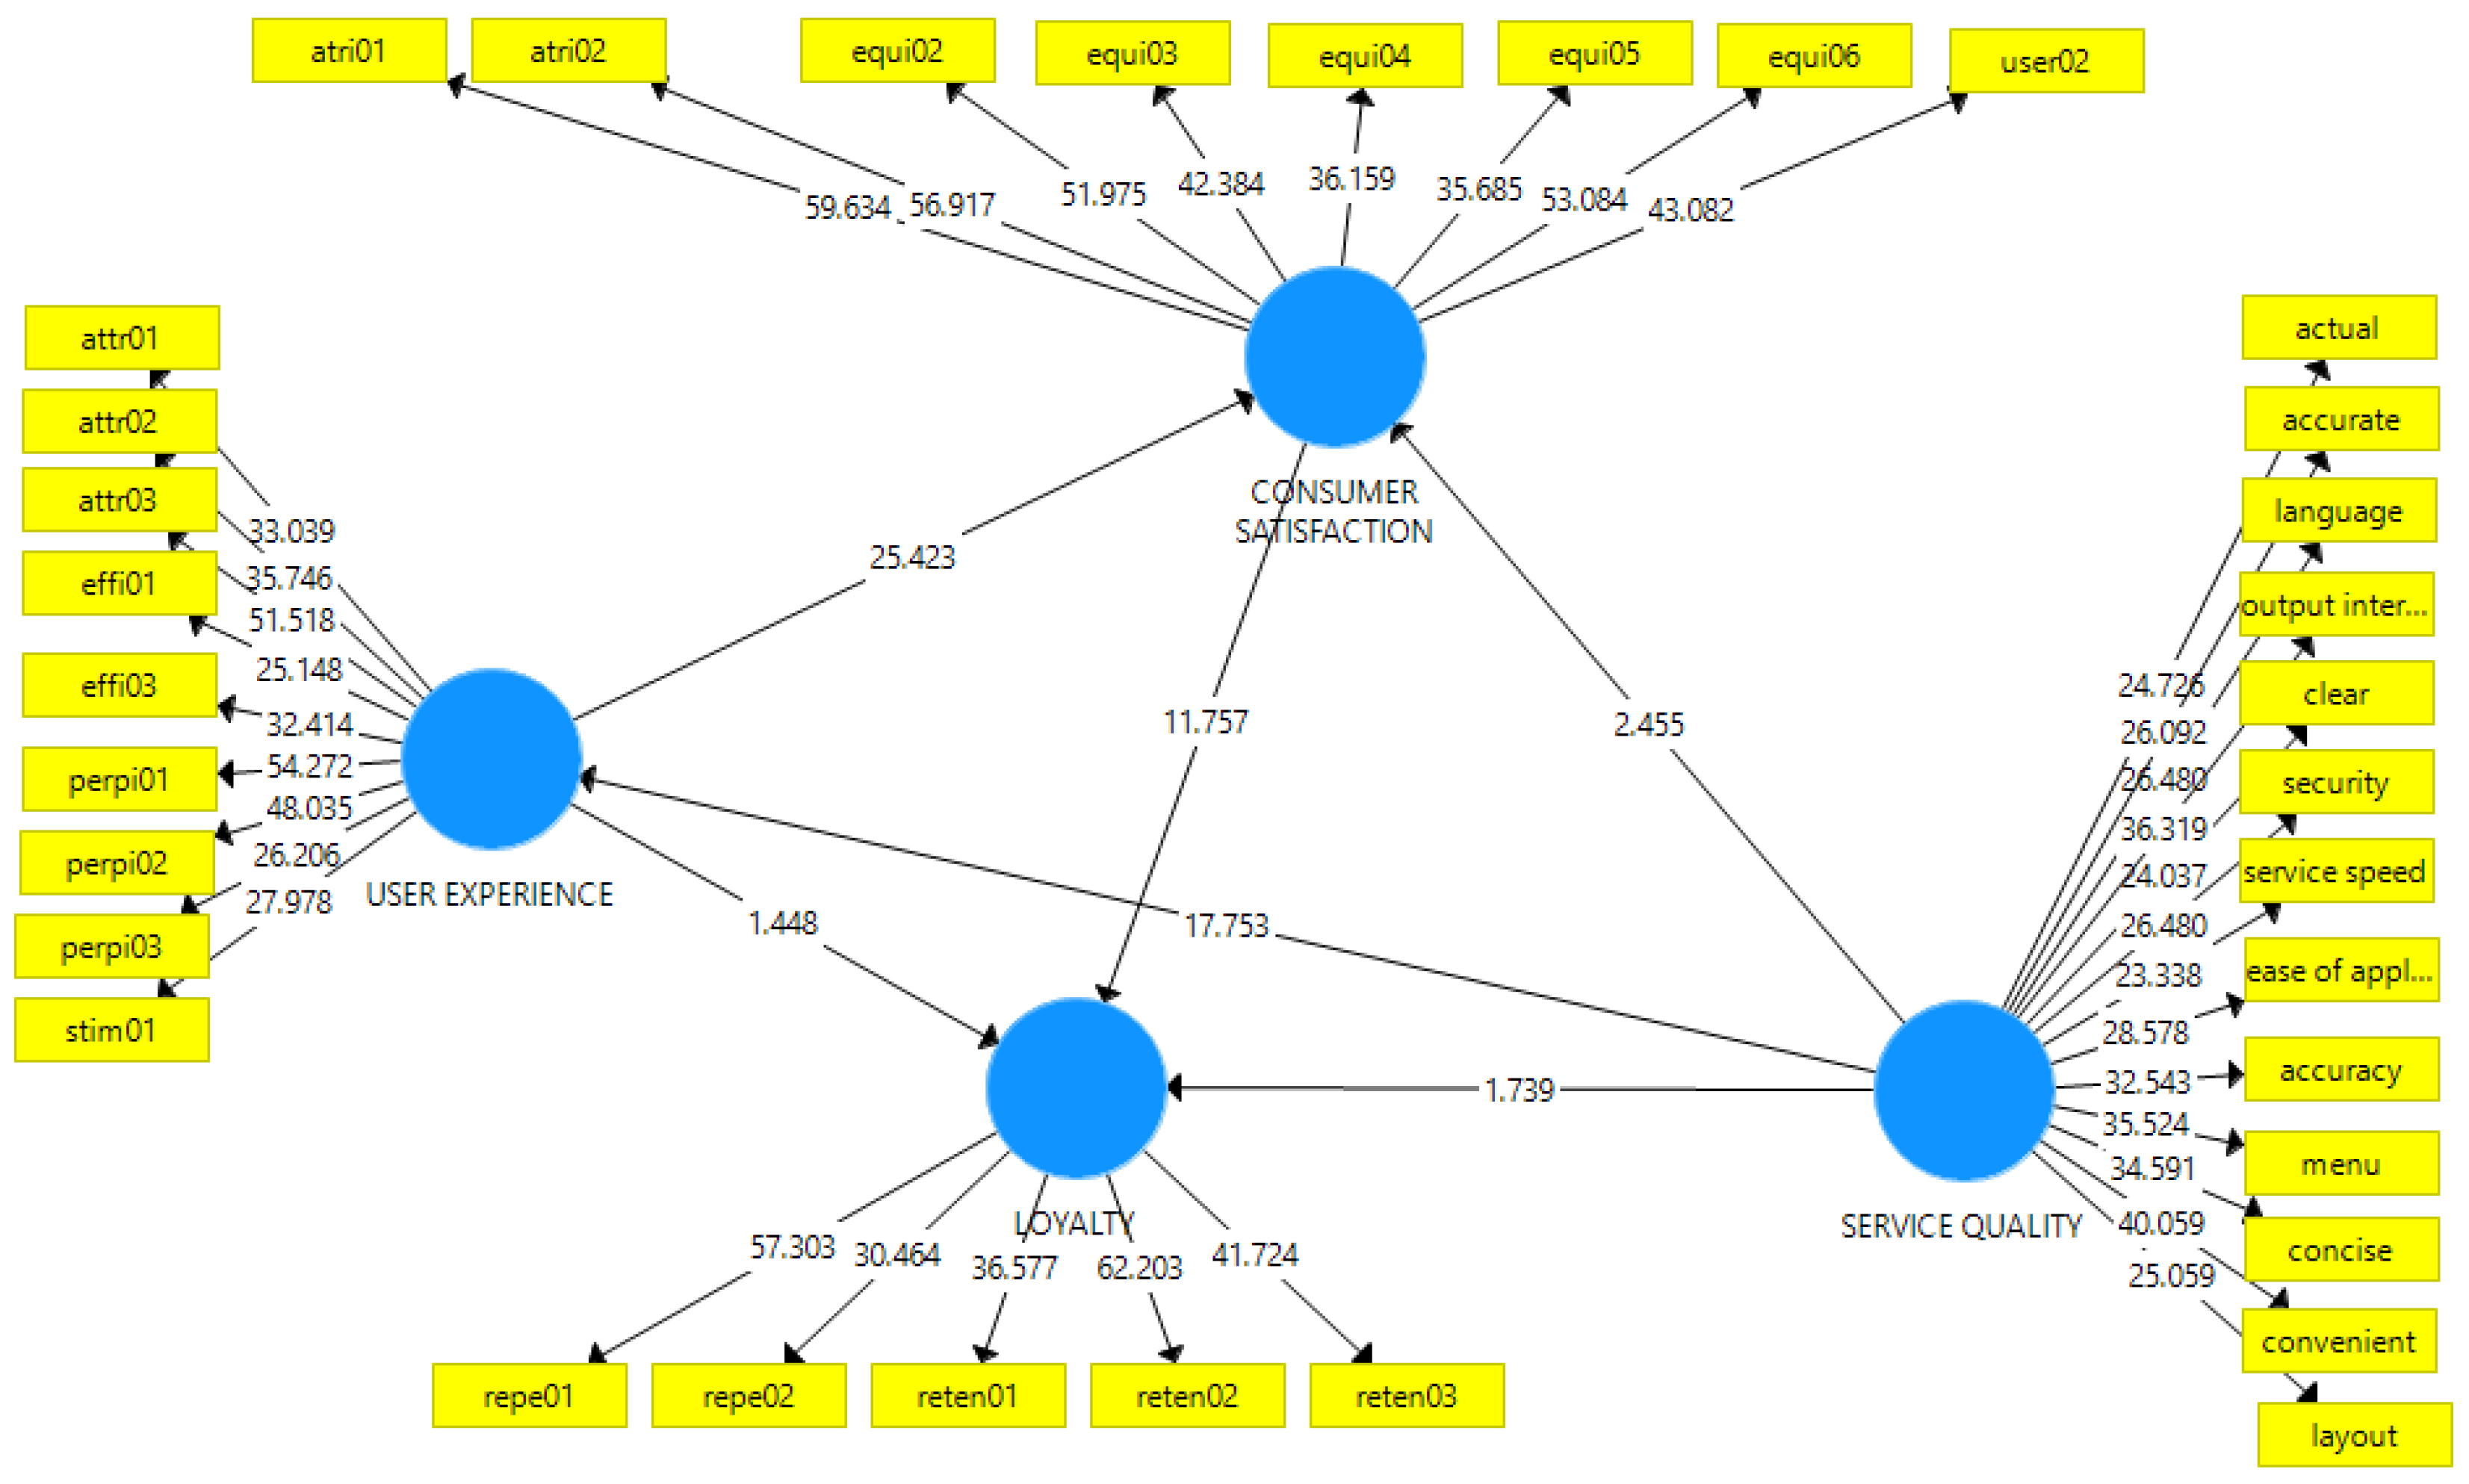
The inner model describes the contributory relationship among the variable of latent created based on the theory element [59]. Based on this, the service attributes affect the user experience and satisfaction of customer, and then that satisfaction affects the loyalty of information system users. According to Abdillah et al. [59], when the T-table value is lower than the T-statistic value, it represents that the hypothesis is supported. The T-table value for the level of confidence is 95% (with 5% alpha) for the two-tailed hypothesis, which should be 1.96.
Furthermore, Laurett et al. [73] state that the inhibiting factor for agricultural growth and change in Brazil is information shortage and low knowledge, while the beneficial social aspect and subjective feelings of welfare are considered consequences of agricultural sustainable development. Research in the North Terengganu area on the sustainability of rice farming shows that, although institutional factors are not significant, government support and marketing assistance are considered very important in creating a synergy of farmer responses given the low level of education of these farmers [74]. Studies on sustainable agriculture in Bangladesh reveal that there are significant and positive correlations between the indicator of economic and the indicator of environment, as well as social indicators, which represent a good relationship [75].
Research by Sholiha and Salamah [76], who examined the modeling of health degrees in districts/cities in East Java using the SEM-PLS approach showed that the bootstrap estimation results for hypothesis testing also concluded that environmental variables, health behavior, health services, and genetics influenced health status. The SEM-PLS approach is also implemented in hotel services in Bali. The result is that there is a significant effect on the quality of service on the hotel’s image, and there is no substantial effect of hotel image on the loyalty of tourists who stay on Melati hotel in Seminyak Village [77]. The results showed that the development of AIS technology for users must further improve regarding the service quality on the aspect of AIS socialization to improve user experience in aspects of design, menus, information, clarity, and benefits of information seen by users are to increase customer satisfaction. Furthermore, it can increase user loyalty and positively impact proving results in the field according to the recommendations of technological innovations that are applied.
Several previous studies have analyzed user satisfaction in the health, tourism, transportation, licensing of food processing, education, and hospitality industries. In the health sector, for example, a study in six hospitals in Qazvin, Iran, in 2012 used the perceptions of 360 patients. The results showed the need for quality improvement in all dimensions. This interest and performance analysis helps hospital managers plan for improving service quality and achieving long-term goals [78]. A survey through an online e-questionnaire application collecting the opinions of nurses was conducted in Iran. In the use of this newly developed hospital information system application, there were two attributes which were easy to used and easy to learn that must be continuously sustained. The attributes are: realiability of the system, time of response, and suitability of features for the work of nurses, which must be improved in the hospital information system [79].
In the field of tourism, based on the perspective of the population, in the old city area of Makassar, which contains attractive tourist destinations with neat street views and approachable residents, visitor numbers can rise, which has an impact on improving the regional economy. However, if visitor number is excessive, the area can become congested and have a negative impact on the daily lives of residents [80]. In a case study in the field of transportation that examines bus services in Tehran, Iran, the results of the analysis showed that transport agencies and policymakers should have more concern in improving passenger comfort regarding bus service features, such as ventilation, bus hygiene, and conveniences for both elderly and disabled [81].
The IPA method is also used in licensing services for production certificates in the household–scale food industry, where the Ponorogo Health Office 2016 granted permits for food processing, including processed dried fish, dried poultry, coconut, wheat flour, oil, jam, jelly, flowers, sugar, honey, soft drinks or powder, spices, and fruit preparations. It is stated that this IPA is effectively used in licensing food products produced by the home industry since it places important points that should be upgraded by officers, including accuracy in providing services and the ability to answer questions [82].
The scientific method is used in education to identify strengths and weaknesses in the faculty of technology and management (ESTiG) at the Polytechnic Institute of Braganca (Portugal). From the student’s point of view, the attributes considered important are the quality of the undergraduate program, external relationship quality, general aspect, teaching aspect, and also the library. The feature with the lowermost performance is the quality of academic services [83].
The important performance analysis approach was also implemented in hotel services during the pandemic of COVID-19. The data collection in this research was conducted on 3 June 2020, from Ctrip.com, the major travel site in China, with a wide-ranging network of over 1.2 million hotels in 200 countries and regions. The results show that the hotel industry is highly vulnerable to the pandemic of COVID-19. There has been a change in consumer evaluation, which puts requirements beyond hygiene requirements and set priorities for improvement during a pandemic to adapt to changes that may last for a long time [84].
Analysis of farmer satisfaction was conducted in China (Jining, Huainan, and Yongxia) to evaluate the impact of ecological restoration in coal mining areas. Based on the IPA quadrant, it was revealed that the attributes of biodiversity, land productivity, and farmers’ income are in the quadrant of high importance–low satisfaction, representing three attributes, which were needed to be majorly upgraded to promote farmer’s fulfillment [85]. Still, the agricultural sector, in terms of pesticide use in Indonesia, which was studied in five provinces (West Java, Central Java, Banten, Lampung, and North Sumatra), shows that the correct application does not follow an increase in farmer’s knowledge. The existence of human healthiness complications due to bad pesticide use application are still common. Thus, good agricultural practice for the use of pesticides has not been implemented properly [86].
The Spearman correlation between the farmers’ characteristics and the attribute of AIS services was limited in quadrant 1. At this specific quadrant, the respondents determined the attributes that were important, but the respondents were still unsatisfied, thus, some improvement efforts are important for implementation.
The length of the respondent’s area will affect how satisfied they are with the AIS services, as there is a negative association between the variable of land tenure area and the level of AIS service satisfaction. Because they would be working more on land cultivation, the responders will not have as much time to use their cell phones. The characteristic of appropriateness and the qualities of ease of application and interpretation have a strong negative connection with the land tenure area (=0.01 and 0.05, respectively). The amount of time spent using a cellphone and how satisfied users are with AIS services are significantly correlated (suitability, ease of application, interpretation, and security). Accordingly, the respondents’ pleasure will rise the more time they spend using their phones.

5. Conclusions

An agricultural information system (AIS) is an application that makes it easier for farmers to solve their rice farming problems easily. Research institutes have produced several products, such as rice consulting services (LKP), integrated cropping calender (katam), digital paktani, and others, using Android and other electronic media. The study results concluded that rice farmers in Indonesia are at a productive age with a high school education level and above farming experience of >10 years. This condition, plus the support of a fairly strong internet network in each rice farming area, make it easier for farmers/users to utilize AIS by strengthening service attributes, such as security, ease of application, accuracy, suitability, output interpretation, and accuracy will increase user loyalty.

Author Contributions

Research idea, S.S.G.; conceptualization, methodology, A.B.S.; formal analysis, A.B.S., Y.H. and S.H.; supervision, S.S.G., B.R. and A.B.P.; writing—original draft preparation, S.S.G., B.R. and A.B.P.; writing—review and editing, S.S.G., B.R., A.B.P., Y.H., M.K., A.S., E.D.M., D.R.S., S.H., T.P., D.P. and S. (Sudarmaji); data collection, M.K., A.S., E.D.M., D.R.S., T.P., D.P., S.W.B., Y.P.W., R.U.H., M.A.G., L.H., W., S. (Suparwoto), Y. and S. (Sudarmaji). All authors have read and agreed to the published version of the manuscript.

Funding

This research was funded by the Swiss Agency for Development and Cooperation through funding to IRRI for the CORIGAP project phase 3 (Grant no. A-2019-166).

Institutional Review Board Statement

Not applicable.

Informed Consent Statement

Not applicable.

Data Availability Statement

Not applicable.

Acknowledgments

The authors thank Grant Singleton, Alexander M. Stuart, Hasil Sembiring, and Nuning Argo Subekti for their support; Sinung Rustijarno, Eko Srihartanto, Agung Iswadi, and Siti Khodijah for the data collection assistance.

Conflicts of Interest

The authors declare no conflict of interest.

Appendix A

Table A1. The questionnaire used in the study.
ConstructMeasurement Items
AttractivenessI am interested in using agricultural information system (AIS) applications.
I feel that the agricultural information system (AIS) has an attractive design. It is simple and easy to understand.
PerspicuityI easily understand how to use the agricultural information system.
It is very easy to understand the menu and information in the agricultural information system (AIS).
It is easy to learn the agricultural information system (AIS).
EfficiencyI feel that the information provided in the agricultural information system (AIS) is clear.
I feel that the agricultural information system (AIS) can be accessed quickly.
I feel that the agricultural information system (AIS) helps improve farm efficiency.
I feel that the information in the agricultural information system (AIS) is presented sequentially and structured.
StimulationI think that agricultural information systems (AIS) has different levels of use for farmers.
I think that the information contained in the agricultural information system (AIS) is important.
I think that agricultural information system (AIS) should be able to impart knowledge and motivate its users to improve themselves.
I think that the use of the agricultural information system (AIS) should be able to guarantee yield/production for farmers.
DependabilityI agree that the information in the agricultural information system (AIS) has been proven to be related to the conditions in the field.
I agree that the agricultural information system (AIS) should be able to support the increase in land productivity.
I agree that the agricultural information system (AIS) can provide complete information than other similar information systems.
NoveltyI agree that the agricultural information system (AIS) developed must be creative and innovative.
FeatureI am satisfied with using the features of the agricultural information system (AIS) application.
EmotionI am satisfied using the agricultural information system (AIS) application service.
AttributionsI agree that the agricultural information system (AIS) is reliable in providing rice information services.
I am willing to share my experience using agricultural information system (AIS) with others.
I agree that all rice information needs are available in the agricultural information system (AIS).
PerceptionsI am satisfied using the agricultural information system (AIS) because it has characteristics/specific information compared to other applications.
I am satisfied using the agricultural information system (AIS) because it has interesting features compared to other applications.
Other customerI am satisfied using the agricultural information system (AIS) because the quality of the information is better.
I see that the farmers in my group also use the agricultural information system (AIS) application.
I am satisfied with using the agricultural information system (AIS) because it can increase the knowledge of farmers around me.
RepeatI still use agricultural information system (AIS) now.
I used the agricultural information system (AIS) for more than one growing season.
RetentionI am still using the agricultural information system (AIS) even though I know there are other new applications.
I still use the agricultural information system (AIS) even though it is not promoted/no subsidies come with it.
ReferralI invite other farmers to use the agricultural information system (AIS) because it is useful.
I invite other farmers to use the agricultural information system (AIS) to obtain subsidies.
TangibleI agree that the use of common language/terms in agricultural information system (AIS) is easy to understand.
I agree that the agricultural information system (AIS) already has a diversity of information.
I agree that the agricultural information system (AIS) has detailed information.
I agree that the agricultural information system (AIS) has an organized and easy-to-find information layout.
I agree that the color selection of the agricultural information system (AIS) layout is interesting.
I agree that the display of the agricultural information system (AIS) logo is attractive and easy to recognize.
ReliabilityI agree that the presentation of information in the agricultural information system (AIS) is concise.
I agree that the presentation of information in the agricultural information system (AIS) is clear.
I agree that the information in the agricultural information system (AIS) is related to the problems encountered in the field.
I agree that the functions of the features in the agricultural information system (AIS) are appropriate and easy to understand.
I agree that the agricultural information system (AIS) is easy to access anywhere.
ResponsivenessI feel that Agricultural information system (AIS) excels in the speed of service.
I feel that the loading speed supports the access to Agricultural information system (AIS).
I feel that the Agricultural information system (AIS) has an easy-to-understand menu.
I feel that the output of the Agricultural information system (AIS) is easy to interpret.
AssuranceI feel that the information in the Agricultural information system (AIS) is appropriate and suitable.
I feel that the information in the Agricultural information system (AIS) is up to date.
I feel that the accuracy of the information in the Agricultural information system (AIS) can be accounted for.
I feel that the personal data of Agricultural information system (AIS) users are safe and protected.
EmpathyI found that the Agricultural information system was supported and equipped with the ease of giving feedback.
I found that the ease of communicating with managers has supported the Agricultural information system

References

  1. Hasan, F.F. A Review Study of Information Systems. Int. J. Comput. Appl. 2018, 179, 15–19. [Google Scholar] [CrossRef]
  2. Das, B. ICTs Adoption for Accessing Agricultural Information: Evidence from Indian Agriculture. Agric. Econ. Res. Rev. 2014, 27, 199–208. [Google Scholar] [CrossRef] [Green Version]
  3. Patel, S.; Illiyas, S. Impact of Information Technology in Agriculture Sector. Int. J. Food. Agric. Vet. Sci. 2014, 4, 17–22. [Google Scholar]
  4. Singh, B. Geographical Information System in Agriculture. IJSRST 2018, 4, 702–705. [Google Scholar] [CrossRef]
  5. Apriyana, Y.; Surmaini, E.; Estiningtyas, W.; Pramudia, A.; Ramadhani, F.; Suciantini, S.; Susanti, E.; Purnamayani, R.; Syahbuddin, H. The Integrated Cropping Calendar Information System: A Coping Mechanism to Climate Variability for Sustainable Agriculture in Indonesia. Sustainability 2021, 13, 6495. [Google Scholar] [CrossRef]
  6. Delima, R.; Santoso, H.B.; Purwadadi, J. Study of Agricultural Applications Developed in Several Asian and African Countries. Semin. Nas. Apl. Teknol. Inf. 2016, 2016, 19–26. [Google Scholar]
  7. Giua, C.; Materia, V.C.; Camanzi, L. Management Information System Adoption at the Farm Level: Evidence from the Literature. Br. Food J. 2021, 123, 884–909. [Google Scholar] [CrossRef]
  8. BPS. Indonesian Telecommunication Statistics 2015; Central Bureau of Statistics: Jakarta, Indonesia, 2016.
  9. BPS. Indonesian Telecommunication Statistics 2020; Central Bureau of Statistics: Jakarta, Indonesia, 2021.
  10. Subejo; Untari, D.W.; Wati, R.I.; Mewasdinta, G. The Effect of Baseline Component Correlation on the Design of GNSS Modernization of Agriculture and Use of Information and Communication Network Configuration for Sermo Reservoir Deformation Monitoring Technologies by Farmers in Coastal Yogyakarta. Indones. J. Geogr. 2019, 51, 332–345. [Google Scholar] [CrossRef] [Green Version]
  11. BPS. Results of the 2018 Inter-Census Agricultural Survey (SUTAS) Series-A2; Central Bureau of Statistics: Jakarta, Indonesia, 2019; ISBN 9786024382834.
  12. Tsinigo, E.; Behrman, J.R. Technological Priorities in Rice Production among Smallholder Farmers in Ghana. NJAS Wagening. J. Life Sci. 2017, 83, 47–56. [Google Scholar] [CrossRef]
  13. Carrer, M.J.; de Souza Filho, H.M.; Batalha, M.O.; Rossi, F.R. Farm Management Information Systems (FMIS) and Technical Efficiency: An Analysis of Citrus Farms in Brazil. Comput. Electron. Agric. 2015, 119, 105–111. [Google Scholar] [CrossRef]
  14. Rose, D.C.; Sutherland, W.J.; Parker, C.; Lobley, M.; Winter, M.; Morris, C.; Twining, S.; Ffoulkes, C.; Amano, T.; Dicks, L.V. Decision support tools for agriculture: Towards effective design and delivery. Agric. Syst. 2016, 149, 165–174. [Google Scholar] [CrossRef] [Green Version]
  15. Hasler, K.; Olfs, H.-W.; Omta, O.; Bröring, S. Drivers for the Adoption of Different Eco-Innovation Types in the Fertilizer Sector: A Review. Sustainability 2017, 9, 2216. [Google Scholar] [CrossRef]
  16. Handika, I.D.S.; Sulistiawati, A. Use and Utilization of the Internet for Agriculture and Its Role on Farmers’ Income Levels (Case: Gapoktan Bina Tani Wargi Pugupay Suntenjaya Village, Lembang District, West Bandung Regency). J. Sains Komun. Dan Pengemb. Masy. 2021, 5, 233–255. [Google Scholar]
  17. Sumardjo; Lubis, D.; Mulyani, E.; Mulyandari, R. Benefits of Information and Communication Technology-Based Information Systems for Empowering Vegetable Farmers. Inform. Pertan. 2011, 20, 14–29. [Google Scholar]
  18. DeLone, W.H.; McLean, E.R. The DeLone and McLean Model of Information Systems Success: A Ten-Year Update. J. Manag. Inf. Syst. 2003, 19, 9–30. [Google Scholar] [CrossRef]
  19. Nguyen, T.D.; Nguyen, T.M.; Cao, T.H. Information System Success: A Literature Review. In Proceedings of the Future Data and Security Engineering (FDSE) 2nd International Conference, Ho Chi Minh City, Vietnam, 23–25 November 2015; Volume 9446, pp. 242–256. [Google Scholar]
  20. Agustiono, W. Building a Future Farm Management Information System (FMIS): The Case of Australia. In Proceedings of the International Conference on Information, Communication Technology and System, Surabaya, Indonesia, 24 September 2014; pp. 165–170. [Google Scholar]
  21. Bramantyo, B.A.; Sudirman, I.; Umar, F. The Influence of Service Quality and Customer Satisfaction on Customer Loyalty (The Case of Marine Customers of the Indonesian National Shipping Company). HJBS 2022, 4, 62–72. [Google Scholar] [CrossRef]
  22. Mahsyar, S.; Surapati, U. Effect of Service Quality and Product Quality on Customer Satisfaction and Loyalty. Int. J. Econ. Bus. Account. Res. 2020, 4, 204–211. [Google Scholar]
  23. Izogo, E.E.; Ogba, I.-E. Service Quality. Customer Satisfaction and Loyalty in Automobile Repair Services Sector. Int. J. Qual. Reliab. Manag. 2015, 32, 250–269. [Google Scholar] [CrossRef]
  24. Lotfy, A.; Adeeb, N. Measuring Farmers’ Satisfaction with the Services of Agricultural Service Providers in Minya and BeniSuef Governorates; CARE International Egypt in Cooperation with EU: Cairo, Egypt, 2016. [Google Scholar]
  25. Mosahab, R.; Mahamad, O.; Ramayah, T. Service Quality. Customer Satisfaction and Loyalty: A Test of Mediation. Int. Bus. Res. 2010, 3, 72–80. [Google Scholar] [CrossRef] [Green Version]
  26. Henim, S.R.; Sari, R.P. Evaluasi User Experience Evaluation of Student Academic Information System of Higher Education Using User Experience Questionnaire. J. Komput. Terap. 2020, 6, 69–78. [Google Scholar] [CrossRef]
  27. Cota, M.P.; Thomaschewski, J.; Schrepp, M.; Gonçalves, R. Efficient Measurement of the User Experience. A Portuguese Version; Elsevier Masson SAS: Moulineaux, France, 2014; Volume 27. [Google Scholar]
  28. Schrepp, M. User Experience Questionnaire Handbook Version 8; UEQ: Hockenheim, Germany, 2019. [Google Scholar]
  29. Parasuraman, A.; Zeithaml, V.A.; Berry, L.L. A Conceptual Model of Service Quality and Its I-Mplications for Future Research. J. Mark. 1985, 49, 41–50. [Google Scholar] [CrossRef]
  30. Schrepp, M.; Hinderks, A.; Thomaschewski, J. Construction of a Benchmark for the User Experience Questionnaire (UEQ). Int. J. Interact. Multimed. Artif. Intell. 2017, 4, 40. [Google Scholar] [CrossRef] [Green Version]
  31. Zeithaml, V.A.; Bitner, M.J.; Gremler, D.D. Services Marketing. Bus. Horiz. 2008, 51, 163–168. [Google Scholar] [CrossRef]
  32. Kotler, P.; Bowen, J.T.; Makens, J.C. Marketing for Hospitality and Tourism; Pearson: London, UK, 2014; ISBN 9781292020037. [Google Scholar]
  33. Rahman, I.A.; Memon, A.H.; Karim, A.T.A. Examining Factors Affecting Budget Overrun of Construction Projects Undertaken through Management Procurement Method Using PLS-Sem Approach. Procedia Soc. Behav. Sci. 2013, 107, 120–128. [Google Scholar] [CrossRef] [Green Version]
  34. Constantin, A.M. The Antecedents of E-Satisfaction and e-Loyalty and the Relationship between Them. Timis. J. Econ. 2012, 5, 236–252. [Google Scholar]
  35. Sever, I. Importance-Performance Analysis: A Valid Management Tool? Tour. Manag. 2015, 48, 43–53. [Google Scholar] [CrossRef]
  36. Silva, J.V.; Pede, V.O.; Radanielson, A.M.; Kodama, W.; Duarte, A.; de Guia, A.H.; Malabayabas, A.J.B.; Pustika, A.B.; Argosubekti, N.; Vithoonjit, D.; et al. Revisiting Yield Gaps and the Scope for Sustainable Intensification for Irrigated Lowland Rice in Southeast Asia. Agric. Syst. 2022, 198, 103383. [Google Scholar] [CrossRef]
  37. Anaglo, J.N.; Boateng, S.D.; Boateng, C.A. Gender and Access to Agricultural Resources by Smallholder Farmers in the Upper West Region of Ghana. J. Educ. Pract. 2014, 2, 1–16. [Google Scholar]
  38. Akter, S.; Rutsaert, P.; Luis, J.; Htwe, N.M.; San, S.S.; Raharjo, B.; Pustika, A. Women’s Empowerment and Gender Equity in Agriculture: A Different Perspective from Southeast Asia. Food Policy 2017, 69, 270–279. [Google Scholar] [CrossRef]
  39. Hailu, S.; Abebe, W. Gender Disparities in Utilization of Agricultural Information by Small Scale Farming Households in Ambo District of West Shewa Zone. J. Sci. Sustain. Dev. 2019, 7, 22–28. [Google Scholar] [CrossRef]
  40. Ragetlie, R.; Najjar, D.; Oueslati, D. Dear Brother Farmer: Gender-Responsive Digital Extension in Tunisia during the COVID-19 Pandemic. Sustainability 2022, 14, 4162. [Google Scholar] [CrossRef]
  41. Djuara, L.; Sulistiawati, A. Agricultural Short Message Services as Information for Farmer Empowerment. J. Komun. Pembang. 2021, 19, 62–72. [Google Scholar] [CrossRef]
  42. Khan, N.; Ray, R.L.; Kassem, H.S.; Zhang, S. Mobile Internet Technology Adoption for Sustainable Agriculture: Evidence from Wheat Farmers. Appl. Sci. 2022, 12, 4902. [Google Scholar] [CrossRef]
  43. Devkota, K.P.; Pasuquin, E.; Elmido-Mabilangan, A.; Dikitanan, R.; Singleton, G.R.; Stuart, A.M.; Vithoonjit, D.; Vidiyangkura, L.; Pustika, A.B.; Afriani, R.; et al. Economic and Environmental Indicators of Sustainable Rice Cultivation: A Comparison across Intensive Irrigated Rice Cropping Systems in Six Asian Countries. Ecol. Indic. 2019, 105, 199–214. [Google Scholar] [CrossRef]
  44. Khaerunnisa; Nurmayulis; Salampessy, Y.L.A. Attitude of Young Farmers to On-Farm Business Sustainability Based on The Behavior and Success of Seeking Digital Information Related to Agriculture (Case of Lebak Regency. Banten Province-Indonesia). In IOP Conference Series: Earth and Environmental Science; IOP Publishing: Bristol, UK, 2022; Volume 978. [Google Scholar] [CrossRef]
  45. Susilowati, S.H. The Phenomenon of Aging Farmers and Reducing Young Workers and Their Implications for Agricultural Development Policies. Forum Penelit. Agro Ekon. 2016, 34, 35–55. [Google Scholar] [CrossRef] [Green Version]
  46. Afful-Dadzie, E.; Lartey, S.O.; Clottey, D.N.K. Agricultural Information Systems Acceptance and Continuance in Rural Communities: A Consumption Values Perspective. Technol. Soc. 2022, 68, 101934. [Google Scholar] [CrossRef]
  47. GriSP. Rice Almanac: Source Book for One of The Most Important Economic Activities on Earth, 4th ed.; IIRI: Los Banos, Philippines, 2013; ISBN 9789712203008. [Google Scholar]
  48. Connor, M.; Tuan, L.A.; DeGuia, A.H.; Wehmeyer, H. Sustainable Rice Production in the Mekong River Delta: Factors Influencing Farmers’ Adoption of the Integrated Technology Package “One Must Do. Five Reductions” (1M5R). Outlook Agric. 2020, 50, 1–15. [Google Scholar] [CrossRef]
  49. Lampayan, R.M.; Rejesus, R.M.; Singleton, G.R.; Bouman, B.A.M. Field Crops Research Adoption and Economics of Alternate Wetting and Drying Water Management for Irrigated Lowland Rice. Field Crops Res. 2015, 170, 95–108. [Google Scholar] [CrossRef]
  50. BPS. Indonesian Statistics 2022; Burhan, M., Ghaniswati, R., Adimira, S., Wijayanti, D., Utami, F.V.P.E., Venditama, D., Wulandari, A.K., Jatmiko, A.B., Wibowo, W.S., Wahyudi, N., et al., Eds.; Central Bureau of Statistics: Jakarta, Indonesia, 2022.
  51. Wehmeyer, H.; De Guia, A.H.; Connor, M. Reduction of Fertilizer Use in South China—Impacts and Implications on Smallholder Rice Farmers. Sustainability 2020, 12, 2240. [Google Scholar] [CrossRef] [Green Version]
  52. Connor, M.; de Guia, A.H.; Pustika, A.B.; Sudarmaji; Kobarsih., M.; Hellin., J. Rice Farming in Central Java. Indonesia—Adoption of Sustainable Farming Practices, Impacts and Implications. Agronomy 2021, 11, 881. [Google Scholar] [CrossRef]
  53. Hunecke, C.; Engler, A.; Jara-rojas, R.; Poortvliet, P.M. Understanding the Role of Social Capital in Adoption Decisions: An Application to Irrigation Technology. Agric. Syst. 2021, 153, 221–231. [Google Scholar] [CrossRef]
  54. van Rijn, F.; Bulte, E.; Adekunle, A. Social Capital and Agricultural Innovation in Sub-Saharan Africa. Agric. Syst. 2012, 108, 112–122. [Google Scholar] [CrossRef]
  55. James, A.O.; George, M.M. Introduction to Information Systems; Mcgraw-Hill: New York, NY, USA, 2005; Volume 13, ISBN 978–0-07–337677-6. [Google Scholar]
  56. Harahap, A.R. Utilization of Information and Communication Technology in Fulfillment of Information for Agricultural Household Businesses in Halongonan District, North Padang Lawas Regency. Penelit. Komun. Dan Pembang. 2016, 17, 77–88. [Google Scholar] [CrossRef]
  57. Burhan, A.B. Utilization of Information and Communication Technology for Agricultural Economic Development and Poverty Alleviation. J. Komun. Pembang. 2018, 16, 233–247. [Google Scholar] [CrossRef]
  58. Tadesse, G.; Bahiigwa, G. Mobile Phones and Farmers’ Marketing Decisions in Ethiopia. World Dev. 2015, 68, 296–307. [Google Scholar] [CrossRef] [Green Version]
  59. Abdillah, W.; Hartono, J.; Prabantini, D. Partial Least Square (PLS): Alternatif Structural Equation Modeling (SEM) Dalam Penelitian Bisnis; Andi Offset: Yogyakarta, Indonesia, 2015; ISBN 9789792952162. [Google Scholar]
  60. Hair, J.F., Jr.; Matthews, L.M.; Matthews, R.L.; Sarstedt, M. PLS-SEM or CB-SEM: Updated Guidelines on Which Method to Use Marko Sarstedt. Int. J. Multivar. Data Anal. 2017, 1, 107–123. [Google Scholar] [CrossRef]
  61. Hair, J.F.; Sarstedt, M.; Pieper, T.M.; Ringle, C.M. The Use of Partial Least Squares Structural Equation Modeling in Strategic Management Research: A Review of Past Practices and Recommendations for Future Applications. Long Range Plan. 2012, 45, 320–340. [Google Scholar] [CrossRef]
  62. Hair, J.F.; Sarstedt, M.; Ringle, C.M.; Mena, J.A. An Assessment of the Use of Partial Least Squares Structural Equation Modeling in Marketing Research. J. Acad. Mark. Sci. 2011, 40, 414–433. [Google Scholar] [CrossRef]
  63. Lee, L.; Petter, S.; Fayard, D.; Robinson, S. On the Use of Partial Least Squares Path Modeling in Accounting Research. Int. J. Account. Inf. Syst. 2011, 12, 305–328. [Google Scholar] [CrossRef]
  64. Ringle, C.M.; Sarstedt, M.; Straub, D.W. A Critical Look at the Use of PLS-SEM in MIS Quarterly. MIS Q. Manag. Inf. Syst. 2012, 36, 2–14. [Google Scholar]
  65. Hair, J.; Hollingsworth, C.L.; Randolph, A.B.; Chong, A.Y.L. An Updated and Expanded Assessment of PLS-SEM in Information Systems Research. Ind. Manag. Data Syst. 2017, 117, 442–458. [Google Scholar] [CrossRef]
  66. Sarstedt, M.; Ringle, C.M.; Smith, D.; Reams, R.; Hair, J.F., Jr. Partial Least Squares Structural Equation Modeling (PLS-SEM): A Useful Tool for Family Business Researchers. J. Fam. Bus. Strategy 2014, 5, 105–115. [Google Scholar] [CrossRef]
  67. Valle, P.O.d.; Assaker, G. Using Partial Least Squares Structural Equation Modeling in Tourism Research: A Review of Past Research and Recommendations for Future Applications. J. Travel Res. 2015, 55, 695–708. [Google Scholar] [CrossRef]
  68. Trenggonowati, D.L.; Kulsum. Factor Analysis of Optimizing Golden Age Early Childhood Case Studies in Cilegon City. J. Ind. Serv. 2018, 4, 48–56. [Google Scholar] [CrossRef] [Green Version]
  69. Asbari, M.; Santoso, P.B.; Purwanto, A. The Influence of Leadership and Organizational Culture on Innovative Work Behavior in Industry 4.0. JIMUPB 2019, 8, 7–15. [Google Scholar] [CrossRef]
  70. Chin, W.W. The Partial Least Squares Approach to Structural Formula Modeling. In Modern Methods for Business Research; Lawrence Erlbaum Associates: London, UK, 1998; Volume 8, pp. 295–336. [Google Scholar]
  71. Tse, H.H.M.; To, M.L.; Chiu, W.C.K. When and Why Does Transformational Leadership Influence Employee Creativity? The Roles of Personal Control and Creative Personality. Hum. Resour. Manag. 2018, 57, 145–157. [Google Scholar] [CrossRef]
  72. Periantalo, J. Test the Contract Validity of the Indonesian Interest Test Through the Aspect of Psychological Interest. Psycho Idea 2017, 15, 9–17. [Google Scholar] [CrossRef]
  73. Laurett, R.; Paço, A.; Mainardes, W.E. Antecedents and Consequences of Sustainable Development in Agriculture and the Moderator Role of the Barriers: Proposal and Test of a Structural Model. J. Rural. Stud. 2021, 86, 270–281. [Google Scholar] [CrossRef]
  74. Yasar, M.; Siwar, C.; Firdaus, R.B.R. Assessing Paddy Farming Sustainability in the Northern Terengganu Integrated Agricultural Development Area (IADA KETARA): A Structural Equation Modelling Approach. Pac. Sci. Rev. B Humanit. Soc. Sci. 2016, 1, 71–75. [Google Scholar] [CrossRef] [Green Version]
  75. Sarkar, A.; Azim, J.A.; Asif, A.A.; Qian, L.; Peau, A.K. Structural Equation Modeling for Indicators of Sustainable Agriculture: Prospective of a Developing Country’s Agriculture. Land Use Policy 2021, 109, 105638. [Google Scholar] [CrossRef]
  76. Sholiha, E.U.N.; Salamah, M. Structural Equation Modeling-Partial Least Square Untuk Pemodelan Derajat Kesehatan Kabupaten/Kota Di Jawa Timur (Studi Kasus Data Indeks Pembangunan Kesehatan Masyarakat Jawa Timur 2013). J. Sains Dan Seni ITS 2015, 4, 169–174. [Google Scholar]
  77. Panca, W.A.P.; Ariana, I.N.J.; Arismayanti, N.K. The Influence of Service Quality on Tourist Loyalty and the Image of Jasmine Hotels in Seminyak Village, Badung Regency, Bali. J. Kepariwisataan Dan Hosp. 2017, 1, 65–72. [Google Scholar]
  78. Mohebifar, R.; Hasani, H.; Barikani, A.; Rafiei, S. Evaluating Service Quality from Patients’ Perceptions: Application of Importance-Performance Analysis Method. Osong Public Health Res. Perspect. 2016, 7, 233–238. [Google Scholar] [CrossRef] [PubMed] [Green Version]
  79. Markazi-moghaddam, N.; Kazemi, A.; Alimoradnori, M. Using the Importance-Performance Analysis to Improve Hospital Information System Attributes Based on Nurses’ Perceptions. Inform. Med. Unlocked 2019, 17, 100251. [Google Scholar] [CrossRef]
  80. Patandianan, M.V.; Shibusawa, H. Importance and Performance of Streetscapes at a Tourism Destination in Indonesia: The Residents’ Perspectives. Front. Archit. Res. 2020, 9, 641–655. [Google Scholar] [CrossRef]
  81. Esmailpour, J.; Aghabayk, K.; Vajari, M.A. Importance–Performance Analysis (IPA) of Bus Service Attributes: A Case Study in a Developing Country. Transp. Res. Part A 2020, 142, 129–150. [Google Scholar] [CrossRef]
  82. Ariyani, D.E.; Setyowati, K.; Wahyunengseh, R.D. Importance-Performance Analysis: Reviewing the Evaluation of Licensing Service for Production Certificate of Home Food Industry. Russ. J. Agric. Socio Econ. Sci. 2019, 85, 173–179. [Google Scholar] [CrossRef]
  83. Silva, F.d.J.H.; Fernandes, P.O. Importance-Performance Analysis as A Tool in Evaluating Higher Education Service Quality: The Empirical Results of Estig (IPB). In Proceedings of the 17th International Business Information Management Association Conference, Milan, Italy, 14–15 November 2011; Volume 4, pp. 306–315. [Google Scholar]
  84. Hu, F.; Teichert, T.; Deng, S.; Liu, Y.; Zhou, G. Dealing with Pandemics: An Investigation of The Effects of COVID-19 on Customers’ Evaluations of Hospitality Services. Tour. Manag. 2021, 85, 104320. [Google Scholar] [CrossRef]
  85. Zhang, P.; Ye, Q.; Yu, Y. Research on Farmers’ Satisfaction with Ecological Restoration Performance in Coal Mining Areas Based on Fuzzy Comprehensive Evaluation. Glob. Ecol. Conserv. 2021, 32, e01934. [Google Scholar] [CrossRef]
  86. Istriningsih; Dewi, Y.A.; Yulianti, A.; Hanifah, V.W.; Jamal, E.; Sarwani, M.; Mardiharini, M.; Anugrah, I.S.; Darwis, V.; Suib, E.; et al. Heliyon Farmers’ Knowledge and Practice Regarding Good Agricultural Practices (GAP) on Safe Pesticide Usage in Indonesia. Heliyon 2022, 8, e08708. [Google Scholar] [CrossRef]
Figure 1. Outer model (measurement model) of AIS technology indicators.
Sustainability 15 01114 g001
Figure 2. Inner model (structural model) of AIS Technology Indicators.
Sustainability 15 01114 g002
Figure 3. Perception of users about the application of AIS.
Sustainability 15 01114 g003
Table 1. Total population and number of samples.
ProvinceSubdistrictPopulationNumber of Samples
North Sumatra
FarmerPantai Labu307
Beringin21644
Siantar278
Tanah Jawa12722
Panombeian Panei12524
Perbaungan15032
Extension officers and other stakeholdersSurveyed district4516
South Sumatra
FarmerRambutan 12010
Talang Kelapa5022
Lempuing Jaya12513
Tanjung Lago12522
Muara Telang 806
Pemulutan 407
Tungkal Ilir 30050
Extension officers and other stakeholdersSurveyed district12045
Yogyakarta
FarmerPrambanan25357
Imogiri19224
Berbah10236
Patuk11012
Piyungan14416
Extension officers and other stakeholdersSurveyed district3411
Amount 2415473
Table 2. Description and code of the variables in the study.
Endogenous VariableCodeDescription
Service QualitySQA measure of how well an attribute in the service meets user/consumer expectations
User experienceUEPerception of the service compared to previous services or other services.
Consumer satisfactionCSFulfillment of consumer desires in using services
LoyaltyLoyaltyConsumers are at the stage of loyal and believe in the service.
Indicators
TangiblesTangInclude the physical evidence of the service.
ReliabilityReliInvolves consistency of performance and dependability
ResponsivenessRespondConcern about the willingness of employees to provide service
AssuranceAssuFreedom from danger, risk, or doubt
EmpathyEmphInvolves making an effort to understand needs
AttractivenessAttrcOverall impression of the service
PerspicuityPerspEasy to obtain familiarity with the service
EfficiencyEffiUsers can solve their tasks without unnecessary effort.
DependabilityDepeUsers understand and can predict the system’s behavior.
StimulationStimExciting and motivating to use
NoveltyNoveInnovative and creative
Service FeatureFeatuSatisfaction with service features
Customer EmotionsEmotUser emotion after using the service
AttributionsAttriAn explanation of why the user decides to feel satisfied or not
PerceptionsPercepPerceptions of equity and fairness
Other CustomerOtherSatisfaction influenced by the closest person factor
RepeatRepeRepeated use of the service
RetentionRetenConsumers easily remember the service providers.
ReferralReferMake the service recommendation to others.
Table 3. General characteristics of AIS users.
DescriptionNumber of Respondents
(People)
Percentage (%)
Gender
Man37378.86
Woman10021.14
Occupation
Agricultural service officer10.21
Trader20.42
Extension6613.96
Farmer40184.78
Plant pest controller10.21
Village secretary10.21
Entrepreneur10.21
Age (year)
11–2040.85
21–305311.2
31–4011023.26
41–5012426.21
51–6012225.8
61–704910.36
71–80102.11
>8010.21
Duration of education (years)
0–614330.23
7–99820.72
10–1215131.93
>128117.12
Table 4. Characteristics of respondents based on rice farming.
DescriptionNumber of Respondents (People)Percentage (%)
Land tenure area (ha)
0–0.527457.93
0.51–111123.47
1.1–58417.76
5.1–1010.21
10.1–2020.42
>2010.21
Length of farming (years)
0–1017637.21
11.0–2013428.33
21–307716.28
31–405110.78
41–50285.92
>5071.48
Harvested dry grain rice production (t ha−1)
0–312726.85
3.1–620042.29
6.1–913829.17
>981.69
Table 5. Respondents’ attributes based on the use and usability of cell phones.
DescriptionNumber of Respondents (People)Percentage (%)
Cellphone usage time (h day−1)
0–218939.98
3–47716.27
5–67415.64
>613328.11
Credit usage fee (IDR month−1)
10,000–50,00016835.52
51,000–100,00018038.05
101,000–150,0006613.96
151,000–200,000418.67
>200,000183.8
Internet network condition
Strong11624.52
Strong enough19641.44
More often weak6814.38
Weak9319.66
Levels of adoption of AIS
Never heard5211
Ever heard12025.36
Ever tried22748
Often use7415.64
Use of AIS
Timing of planting20743.76
Fertilizer recommendation28760.67
Variety recommendations17336.57
Other275.70
Table 6. Outer values of AIS technology indicator models.
Cronbach’s AlphaComposite ReliabilityAverage Variance Extracted (AVE) *
Service Attributes0.9370.9450.568
Customer satisfaction0.9380.9490.698
Loyalty0.8970.9240.709
User experience0.9170.9310.602
* The AVE value for service attributes (0.568), customer satisfaction (0.698), loyalty (0.709) and user experience (0.602) > 0.5. This indicates that all indicators are valid and convergent.
Table 7. Value of R square and R square adjusted.
R SquareR Square Adjusted
Customer satisfaction0.6440.643
Loyalty0.6250.623
User experience0.3090.307
Table 8. Bootstrapping and path coefficient indicators of AIS technology.
Original Sample (O)Standard Deviation (STDEV)T Statistics (|O/STDEV|)p-Values
Service attribute → Customer satisfaction0.0950.0382.5050.0130 *
Service attribute → Loyalty0.0730.0431.6800.0940 ns
Service attribute → User experience0.5560.03416.3920.0000 ***
Customer Satisfaction → Loyalty0.6710.06111.0670.0000 ***
User experience → Customer satisfaction0.7460.02925.5960.0000 ***
User experience → Loyalty0.0960.0731.3070.1920 ns
*, and *** indicate significance at the 0.05, and 0.001 probability levels, respectively; ns = not significance.
Table 9. The Spearman correlation between the respondents’ characteristics and the satisfaction level of AIS services.
Characteristics ConvenientEase of ApplicationOutput InterpretationAccuracySecurity
Land tenure areaCorrelation Coefficient−0.118 **−0.091 *−0.104 *−0.089 ns−0.029 ns
Sig. (2-tailed)0.0100.0470.0240.0530.524
AgeCorrelation Coefficient0.008 ns0.042 ns0.064 ns0.044 ns0.030 ns
Sig. (2-tailed)0.8650.3650.1640.3450.514
Duration of educationCorrelation Coefficient0.021 ns0.039 ns0.024 ns0.023 ns−0.014 ns
Sig. (2-tailed)0.6450.3950.6060.6230.756
Length of farmingCorrelation Coefficient−0.015 ns0.021 ns0.020 ns−0.001 ns−0.002 ns
Sig. (2-tailed)0.7430.6450.6570.9820.963
Cellphone usage time Correlation Coefficient0.297 ***0.238 ***0.210 ***0.137 **0.180 ***
Sig. (2-tailed)0.0000.0000.0000.0030.000
Credit usage fee Correlation Coefficient0.057 ns0.077 ns0.010 ns−0.002 ns0.094 *
Sig. (2-tailed)0.2170.0950.8270.9580.041
*, **, and *** indicate significance at the 0.05, 0.01, and 0.001 probability levels, respectively; ns = not significance N = 473.
Disclaimer/Publisher’s Note: The statements, opinions and data contained in all publications are solely those of the individual author(s) and contributor(s) and not of MDPI and/or the editor(s). MDPI and/or the editor(s) disclaim responsibility for any injury to people or property resulting from any ideas, methods, instructions or products referred to in the content.

