1. Introduction
The earthquake that occurred in Petrinja on 29 December 2020 caused destruction and extensive material damage to residential buildings and infrastructure. The main earthquake had a magnitude of 6.2, with the highest intensity estimated as VIII-IX °EMS scale, while the hypocentre was at a depth of 6 km. It was preceded by three stronger earthquakes (3.8–5.0) the day before [
1]. The earthquake was followed by a series of foreshocks and aftershocks, and about 4000 aftershocks occurred within three days, nine of which were in the 4.0–5.0 magnitude range [
2]. According to [
1], the main earthquake was located on the main fault in the area, the so-called the Petrinja fault.
These earthquakes caused a geological phenomenon that also had a great impact on the lives of people living in the area, i.e., consequences on infrastructure and residential buildings. In the area of rural settlements in Mečenčani and Borojevići, located some 25 km southeast from Petrinja, the sudden onset of cover-collapse sinkholes occurred (
Figure 1). The cover-collapse sinkholes occurred alongside residential buildings and infrastructural facilities, endangering the daily lives of people in the area. These phenomena existed in the area even before the Petrinja earthquake, hence the conclusion that the phenomenon is a natural geological process.
However, after the earthquake, a sudden increase in the number of cover-collapse sinkholes was observed, leading one to conclude that the earthquake acted as an accelerator of the whole phenomenon. It was mapped across the investigated area, with a total of 91 new cover-collapse sinkholes occurring in the period of several months after the earthquake and 49 old fossil cover-collapse sinkholes that had appeared prior to the earthquake and were most often subsequently backfilled [
3]. Old sinkholes were not systematically geologically investigated in the past, but were located based on the testimony of local residents. Nonetheless, the process behind the formation of new sinkholes has continued, and today 109 cover-collapse sinkholes have been discovered, appearing mainly across a small area covering approx. 4 square km in the area incorporating the rural settlements of Mečenčani and Borojevići.
Figure 1.
Topographic and tectonic map of the Pannonian-Dinaridic region with the border area of the Alcapa (Alpine-Carpathian tectonic unit). The epicenter of the Petrinja earthquake is shown as a red star, and the survey area is the villages of Mečenčani and Borojevići. The main tectonic units and faults are superimposed on the topographic map (PAF: Periadriatic fault; CF: Ćićarija fault; SMF: South marginal fault of the Pannonian basin). The borders of the suture zone (dashed black line) after [
4].
The adverse effect of the occurrence of cover-collapse sinkholes on the infrastructure and the population, as well as the risks caused by their occurrence, have generated great interest in their study. That is why numerous papers have been published on the research of sinkholes and the underground cavities that precede them. Classification of sinkholes illustrated on the evaporite paleokarst in Spain was presented by [
5]. A multidisciplinary study of large cover-collapse sinkhole, the Fossa San Vito in Italy, was described by [
6]. Many papers have dealt with the problem of the formation and development of underground cavities as a key factor that precedes collapses and the appearance of sinkholes. Thus, [
7] considered the mechanism of upward propagation of cover-collapse sinkholes. The authors of [
8] investigated the formation of underground cavities and sinkholes caused by internal erosion from cracks in pipes. Extensive hydromechanical modelling and laboratory tests that can explain the origin and development of underground cavities in the clastic cover above the karstified carbonate basement were presented by [
9]. In all these models, the action of groundwater has played a major role, which was also highlighted in the work of [
10]. The effect of groundwater levels on the development of cover-collapse sinkholes due to groundwater pumping and mining dewatering was investigated in central Florida by [
11]. The influence of other factors on the development of cover-collapse sinkholes, especially seismicity, was also investigated [
12,
13,
14,
15]. More recently, the possibilities of predicting collapse are being considered, and optical fibre sensors are being developed [
16,
17].
The cover-collapse sinkholes that appeared after the Petrinja earthquake had to be comprehensively investigated as reliably as possible in order to assess the risks they caused. The investigations systematically covered the area of their appearance, with a special emphasis on identifying the most endangered areas and investigating the threat to the main infrastructure facilities: school buildings, water supply pipelines and main roads. Basic research included the application of geophysical methods with the use of available geological data from previous investigations. Geophysical methods can provide the speculation on underground geological structures with a non-destructive methodology. Several geophysical methods were used in the test measurements (seismic refraction, georadar and electric tomography), and the most effective was electrical tomography, which was chosen as the basic research method.
Comprehensive electrical tomography measurements along thoroughfares were conducted in the investigated area, including along the main water supply pipeline route that extends from the Pašino vrelo water source and supplies drinking water to the wider area, and in the area of the primary school in Mečenčani. The primary purpose was to determine the level of threat to infrastructural facilities and demarcate safety zones, i.e., the areas in which cover-collapse sinkholes will not appear. Investigations on the route of the main water supply pipeline indicate the presence of underground cavities that cause the formation of cover-collapse sinkholes and thereby a large possibility of subsequent damage. Accordingly, additional geophysical investigations were conducted in the area in order to ascertain the safe area and route of the new water supply pipeline for its relocation.
Geophysical investigations were focused on electrical resistivity tomography, which in this type of geological situation, can fully and reliably identify the underground lithological composition. Surface electrical tomography has rapidly developed over the decades. The method ensures continual underground coverage, not just in two-dimensional [
18] but also in three-dimensional space [
19], and its use has been rapidly spreading in hydrogeological, geotechnical and other near-surface investigations. The main advantage of the method is the ability to map areas that have complex geological relationships [
20], providing exceptional results in karst terrain, where it has become the fundamental geophysical method for undertaking investigations [
21,
22,
23]. Development of the method began with the advent of multielectrode systems [
24], where electrodes are placed at equal intervals, providing a uniformly allocated pseudo-depths. A slightly different system for taking denser measurements in shallow sections, which is used for continual electrical sounding, was published by [
25]. The system enables a rolling method of taking measurements and was later applied in two-dimensional electrical tomography by [
26]. The method was finally established with the development of algorithms and software for data inversion [
27,
28].
This study has shown that the electrical tomography method is a very effective tool in the investigation of the geological hazards caused by the appearance of sinkholes in the covered karst model. Tomographic measurements alongside and over the cover-collapse sinkholes, especially over the largest sinkhole, have enabled more precise definition of the entire hydrogeological model and the mechanisms involved in the formation of cover-collapse sinkholes as well. Likewise, the role of earthquakes in the formation of cover-collapse sinkholes can be more reliably evaluated.
2. Geological Setting
The area under investigation is located on a plain and slightly hilly area in the valley of the Sunja River, surrounded by smaller hills (
Figure 1). It is located 25 km southeast of Petrinja and 85 km southeast of Zagreb. The epicentre of the main earthquake is located 3 km southeast of Petrinja (45.4002° N and 16.2187° E). The survey area, the villages of Mečenčani and Borojevići, are located approximately 20 km southeast of the epicentre region.
The investigated region and the epicentre area belong to the Pannonian Basin and are located in the southwest peripheral area of the mentioned regions. They are also associated with the peripheral region of the Sava depression, one of the largest depressions in the southwest section of the Pannonian Basin (
Figure 1). In geological terms, they are located in the ophiolite zones, i.e., the Sava and Dinaridic zones, which are an integral part of the transitional zone and suture zone of the Adriatic microplate and Pannonian tectonic segment [
29,
30].
Earthquakes in the Dinaridic and southwest Pannonian Basin are caused by Adriatic subduction, i.e., collision of the Adriatic microplate, pushed towards the north by the African Plate, and the Pannonian tectonic segment as part of the Eurasian Plate. The Adriatic microplate moves under Eurasia, and the lithospheric mantle separates from the crust and sinks steeply under the Dinarides [
31,
32,
33]. On the other hand, the Pannonian crust thrusts over the Dinaridic, Adriatic crust, which is the main cause of earthquakes in the Dinarides and peripheral regions [
4,
34]; hence, only shallow earthquakes situated in the crust are generally detected [
35].
Located on the surface of the area under investigation are the youngest Quaternary clastic deposits: alluvial, diluvial and proluvial sediments of clays, gravels, clayey gravels as well as silty and sandy clay [
36,
37], in addition to the discovery of Plio-Quaternary (PI, Q) clays (
Figure 2). On the surrounding hills, in the wider surroundings of the investigated area, Badenian (M4) carbonate rocks, Lithothamnium limestones and calcarenites were identified, somewhat more broken and weathered but showing good permeability properties, meaning that they play an important role as the main aquifer of this region. Their surface is typified by the appearance of sinkholes (dolines) as the fundamental karst phenomenon. Quaternary deposits from a hydrogeological standpoint can be impermeable or permeable, depending on the lithological composition. The deposits developed in the valley of the local Sunja River contain large amounts of coarse-grained clastic components, so they are permeable and play the role of a shallow aquifer, which is hydraulically connected to the carbonate aquifer in the basement [
36]. According to the ionic composition of groundwater from springs and wells in the survey area, it belongs to the Ca-HCO
3 water type [
36], while the water from the Sunja River belongs to the CaMg-HCO
3 water type, which points to a dominant carbonate aquifer.
In the wider area, clastic deposits of the Eocene, Ottnangian, Sarmatian and Pannonian, which are dominantly impermeable, were also mapped. A series of faults has been interpreted in the survey area (
Figure 2), and the dominant Dinaridic extension of geological units and tectonic blocks (NW-SE) can be observed. The occurrence of the sources was also associated with a diagonal fault that brought the permeable Lithothamnium limestones and the impermeable Pannonian deposits into contact [
36].
Sinkholes are a natural phenomenon predominantly related to karst areas and carbonate rocks [
38], with the literature referring to them also as dolines [
39]; this originates from the Slavic languages, given that karst is intensively present in the mountain chain of the Dinarides, as described in numerous geological papers. Sinkholes are one of the many phenomena occurring in the topography of karst, carbonate terrains. They are funnel-shaped depressions with a terra rosa, most often on the base; in other words, earth accumulates due to the weathering of carbonate rocks. This involves chemical and mechanical destruction of carbonates in which cavities are formed, and surface rocks break up and collapse into the cavities. Surface waters rinse the clayey and silty deposits on the surface and deposit them into these formed depressions. This process is most often gradual; however, during the creation of large underground cavities, a sudden and immediate collapsing of the rock structure can occur and, subsequently, the onset of a phenomenon called collapse sinkholes. They are generally a circular shape and feature vertical or overhanging walls. Some of the more spectacular examples are Crveno jezero (Red Lake) and Modro jezero (Blue Lake) near Imotski in Croatia [
40]. The main axis of the Modro jezero collapse sinkhole is approx. 1500 m. The diameter of the Crveno jezero collapse sinkhole on the surface of the lake is approx. 400 m, at a maximum depth of 520 m.
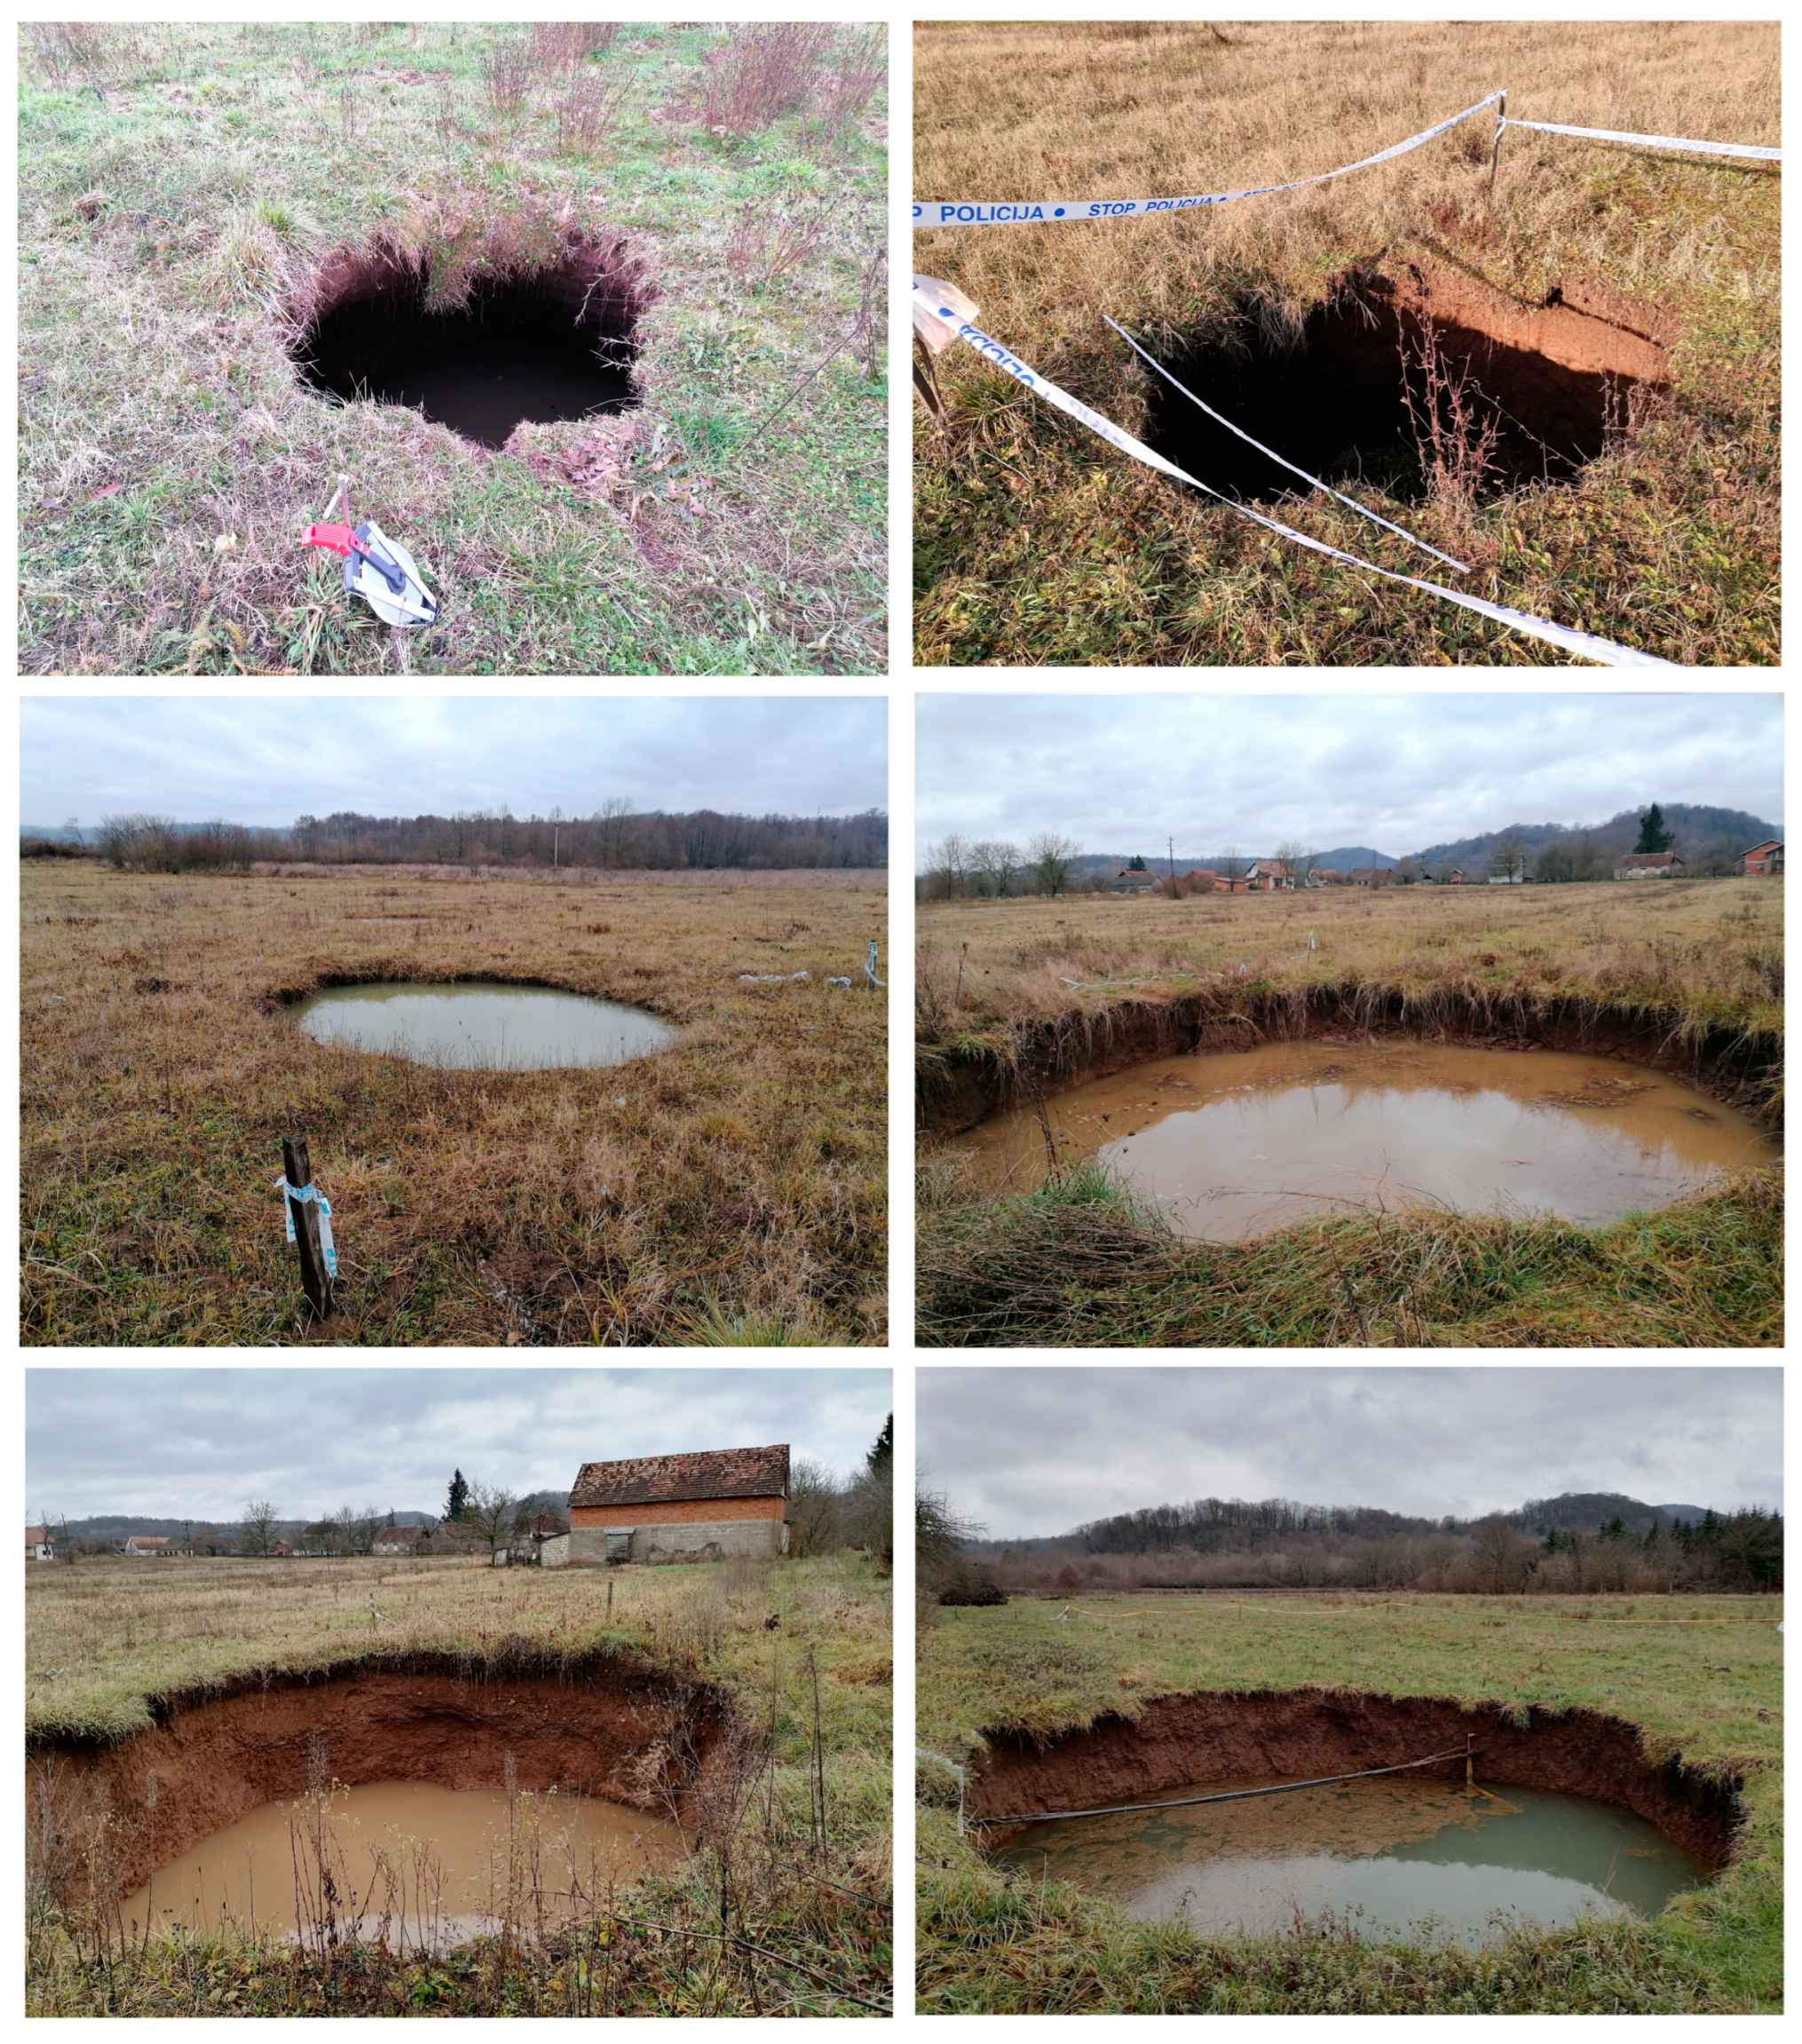
The investigated area belongs to the mantled karst terrains, which means that carbonates are covered by clastic deposits ranging in thickness from a few meters to 10 or so meters. Circular sinkholes of steep walls can appear on such terrains, which are formed by the sudden collapse of the clastic covering above the carbonate basement and are called “cover-collapse sinkholes” (
Figure 3 and
Figure 4).
Underground water plays a major role in the development of underground cavities. The water level can range from the surface to 5 m, depending on the season and rainfall, and in some parts of the investigated area there may be artesian water. The cover-collapse sinkholes appeared even before the earthquake, although in much smaller numbers, but they were not systematically explored and mapped. Due to the threat caused by their rapid spreading after the earthquake, there has been increasing interest in the mentioned phenomenon and hence greater systematic research into the topic. The dimensions of the cover-collapse sinkholes vary in size from less than one to tens of meters (
Figure 5). The largest number of new sinkholes has dimensions up to 4 m (78%), and only four are greater than 8 m. However, one of them stands out in terms of size, with dimensions exceeding 25 m (
Figure 4), and serves as a polygon for more detailed geophysical measurements in order to identify the underlying mechanism of the phenomenon. The largest number of fossil sinkholes are up to 4 m in size, [
5] but a great number of sinkholes with dimensions greater than 8 m can be observed (
Figure 5). However, it should be noted that fossil sinkholes are regularly buried, so their dimensions are mostly determined based on the testimony of local residents. That is why the precision of determining their dimensions is significantly lower than new sinkholes.
We differentiated two eventual causes of the karst hazards located in the area under investigation, which are interpreted on the basis of previous geological and other data [
36,
37]. These two geological cases can generally be called basic geological models in the investigated area, which is addressed in the following text. Both models show a surface with Quaternary clastic deposits (Alluvium, Diluvium and Proluvium): gravels, sands and clays as well as their transitional forms (
Figure 6). The first geological model (GM-1) shows the presence of weathered and fractured Lithothamnium limestone and calcarenites (Badenian, M
4), in the basement in which the action of water forms underground cavities. The action of water again means that clastites from the surface layer fill the cavity; however, an underground cavity appears in the clastites. In time it spreads, along with the thinning of the surface clastic layer, and at a certain moment, due to reduced load-bearing capabilities, it suddenly collapses (
Figure 7). This is then followed by the formation of circular and elliptical sinkholes with steep walls (
Figure 3 and
Figure 4). This explanation of the origins of cover-collapse sinkholes is most encountered in the geological literature [
41], but the issue surrounding the effects of water and earthquakes in this case implies the need to consider a more precise model of their origin based on gathered geophysical data from the investigated region.
In the second geological model (GM-2), Quaternary deposits again are found on the surface, but the base has deposits with very small resistivity, stemming from the Plio-Quaternary clay [
37]; see
Figure 6. Badenian carbonate rocks can again appear under them at shallower or deeper depths, but Plio-Quaternary clays act as a buffer zone and prevent the creation of cover-collapse sinkholes. Specifically, underground cavities do not develop in such deposits as in carbonates, whereas the area where the lithological column forms is considered safe against the onset of cover-collapse sinkholes.
3. Methodology of Data Acquisition and Processing
Comprehensive tomographic measuring of the area under investigation was conducted in four phases (
Figure 8). The first phase of measurements was performed in the area of the school building and along the road in order to determine the potential threat to infrastructural facilities, in other words, to determine which geological model (GM-1 or GM-2;
Figure 6) is present in that area. The school area was also defined as a potential location for accommodating housing containers for the population in the event of new earthquakes and expectations of new cover-collapse sinkholes. The measurements were conducted using a Wenner electrode array with a unit electrode spacing of 5 m, which enabled a depth coverage up to 50 m for the reliable determination of geological cases.
The second phase took tomographic measurements along the route of the main water supply pipeline, which supplies the entire region with drinking water and extends from the Pašino vrelo source to the town of Hrvatska Kostajnica, which is the centre of the area (
Figure 8). In direct proximity to the pipeline is a series of cover-collapse sinkholes that opened up after the earthquake; one of them is located along the actual route. Investigations should provide a reliable assessment of the threat to the main water supply pipeline, i.e., the onset of underground cavities that cause cover-collapse sinkholes. The measurements were performed using a Wenner electrode array with very densely positioned electrodes, every 2 or 3 m. The dense arrangement of electrodes enabled a higher resolution, which is required for mapping relatively small objects, potential small underground cavities in the clastic cover and possibly the top part of the carbonate bedrock. The conclusion is that the main water supply pipeline faces a significant threat from possibly new cover-collapse sinkholes, and repairs in the event of damage are very risky, as heavy machinery would be required. This leads to the decision to create a new route over a safe region, i.e., a region in which neither underground cavities nor cover-collapse sinkholes will form.
The third phase systematically covered the entire region of Pašino vrelo in order to demarcate the safe area and define the boundaries of the respective area. The measurements were performed using the Wenner electrode array, with unit electrode spacing of 10 m, covering the greatest possible depth range, of up to 100 m, as well as reliably defining the geological models and thicknesses of clastic cover. The final phase involved taking measurements over the largest cover-collapse sinkhole in order to precisely define the resistivity model that facilitated identification of the mechanisms for the formation of underground cavities and the creation of cover-collapse sinkholes. Measurements were performed using the Wenner and Wenner-Schlumberger electrode array, with unit electrode spacing of 3 m, which enabled a high resolution. The Schlumberger array has a theoretically better resolution, but it is very sensitive to electrical noises that adversely affect the data inversion process. On the other hand, the Wenner array has a lower resolution but is significantly less sensitive to noises; thus, it can provide a more reliable inverse model. Therefore, both arrays were applied during the research, depending on the field conditions.
Measurements were taken using the Terrameter SAS 1000 instrument and the automatic multielectrode system LIS (Lund Imaging System) sourced from the Swedish company ABEM. This system uses four cables with 80 take-outs and enables a roll-along measurement technique. The number of electrodes used in the measurements depended on the unit electrode spacing and the length of the profile and was in the range of 60–80 electrodes. Given that it involves small readings and very small electrical anomalies, the measurements must be taken using instruments that provide high-quality measured data, i.e., highly precise instruments that reduce noise to a minimum. Tests showed that these instruments are suitable if the electrodes are properly grounded.
Data of tomographic measurements were processed and interpreted according to the most frequently used inversion method [
27,
28]. The final version of the interpreted resistivity model is impacted by the terrain topography; hence, the profiles were further processed by taking into account above-sea level heights, altitudes read from accurate topographic maps and supplementary geodetic measurements. The applied inversion method, an otherwise robust method which emphasizes the resistivity differences in rocks, provides a sharper image in order to more precisely determine relatively small bodies. This means that the interface of the carbonate bedrock and the clastic cover is more clearly expressed. In addition, this method can more reliably detect potential underground cavities whose dimensions are very small. The interpreted resistivity model is a model of real resistivities that fits measured apparent resistivities. Deviations between measured apparent resistivities and theoretical apparent resistivities, calculated from the interpreted resistivity model, were expressed as absolute errors in percentages. Final solutions of the inverse resistivity models were reached after 5 or 6 iterations, applying a damping factor ranging from 0.02 to 0.06, depending on the quality of the data, i.e., the noise level. The finite-element method was used for the forward modelling calculations.
4. Results
Clastic deposits will generally cause low resistivity. The resistivity of clay is approx. 20 Ωm. Large quantities of sandy, gravelly and calcite components lead to increases in resistivity. On the other hand, carbonates (limestones and dolomites) cause high resistivities, ranging from a few hundred to a few thousand Ωm. If the rocks are compact and dry, they provide a very high resistivity, whereas increased fragmentation reduces resistivity, given that cracks are filled with clay or water. Hence, the resistivity of more fractured carbonate rocks can superimpose with the resistivity of certain clastic deposits. Given that Lithothamnium limestones in the base strata are weathered and fractured, as well as saturated with water, the resistivity will be proportionally smaller, only a few hundred Ωm or even less, hence, the superimposition with the resistivity provided from gravel deposits [
22].
Underground cavities in clastites in the survey area have never been systematically investigated, and there is no information on their increase and progress towards the surface. There is also no information about the critical moment of a collapse, and it can be assumed that many factors influence this: the thickness of the overlying layer, the composition of the clastites, humidity, etc. [
9]. However, it has been observed that, in most cases, a sudden collapse occurs without a previous subsidence of the terrain [
3].
Tomographic resistivity models taken in the area of the main water supply pipeline show that a large part of the route is located in the area of the GM-1 model, in which underground cavities form, and consequently cover-collapse sinkholes appear. This part of the route is, in fact, located close to the boundary of the two geological models, and numerous cover-collapse sinkholes have already appeared in the immediate surroundings. Investigations into the underground cavities along the actual water supply pipeline route have shown that the risk of underground cavities appearing in the clastites is estimated in the range from low to very high. Unfortunately, a high risk exists along a large section of the route, while discovered electrical anomalies on the tomographic profiles indicate the presence of larger underground cavities in the clastic strata.
Likewise, the investigation of underground cavities, using geophysical methods, that precede the development of sinkholes, is presented in the work of [
42]. It is also pointed out that the appearance of electrical anomalies enables detection by the method of electrical tomography. On the other hand, [
43] points out that after the collapse and reaching the stable phase of the sinkhole, there are no clear geophysical signals, nor is there an electrical anomaly that would indicate disturbed rocks.
The formation of underground cavities should be viewed as a continual process; hence, the area of the GM-1 model can be considered a region facing continual risk. The first goal of the investigation is to determine the boundary of the GM-1 models, along with the carbonate strata, and GM-2 with the clay strata, in which the formation of underground cavities and subsequently cover-collapse sinkholes is not expected. Electrical tomography effectively differentiates these models based on the characteristic distribution of resistivity, which can be demonstrated using two separate cross-sections in the area under investigation, i.e., TP-26 and TP-27 (
Figure 9).
The first half of profile TP-26 shows predominantly higher resistivities caused by gravel-clay deposits on the surface and Lithothamnium limestones in the base strata. Up to 190 m along the surface, there are gravel-clay deposits varying in thickness from a few meters to ten or so meters. In the second half of the cross-section, lower resistivities are typical and are caused by clay deposits, except at positions located at approx. 250 m and 350 m, where thin surface zones exhibited higher resistivities, probably due to gravel deposits. The boundary between the GM-1 and GM-2 models is defined at the 190-metre position, where the thickness of the contacting clay is approx. 20 m, and under this there is again limestone. The thickness of clay gradually increases towards the end of the profile in the northeast, and at the 310-metre position, the thickness increases considerably. A similar resistivity relationship exists on the neighbouring TP-27 profile, but the boundaries are shifted towards the start of the profile. The boundary of the GM-1 and GM-2 models is located at 110 m, and a greater thickness of the clay is seen at 270 m. Young clay deposits on an uneven carbonate strata are noticeable on both profiles along with sudden changes in depth. The resistivity in the carbonate strata is proportionally less and generally does not exceed 200 Ωm, which indicates the level of fragmentation and weathering, given that such resistivity is typical for saturated gravel deposits, whereas carbonate rocks can have a very high resistivity (a few thousand Ωm) if not very fractured.
The boundaries of the tomographic profiles have been marked on position maps, and the two boundaries have been drawn, i.e., the boundary of the GM-1 and GM-2 geological models as well as the boundary demarcating the greater thickness of the clay Plio-Quaternary (PIQ) packet in the GM-2 model (
Figure 10). The boundaries extend in a northwest-southeast direction, with the boundary demarcating the presence of cover-collapse sinkholes generally following the boundary of the GM-1 and GM-2 models, indicating the significant role of water, especially its mechanical effect on forming underground cavities in the clastic strata as the basis for the formation of cover-collapse sinkholes.
Detailed tomographic measurements over the largest cover-collapse sinkhole facilitated reliable devising of the entire model for the formation of cover-collapse sinkholes (
Figure 11); three tomographic profiles with a length of 240 m are shown. At profile TP-10, extending from the edge of the cover-collapse sinkhole, carbonate strata exhibiting higher resistivity is located at a depth of 6–10 m, and above are clastic, clay-gravel deposits providing lower resistivity (max. 60 Ωm). The boundary is generally levelled, but the resistivities in the Lithothamnium limestones are uniform; hence, zones with greater fragmentation are not expected. However, the resistivity model changes dramatically on the TP-31 profile, which extends through the middle of the sinkhole (
Figure 11). Resistivity distribution is much more complex and indicates very complex lithological relationships. Noticeable under the cover-collapse sinkhole is a lower-resistivity zone in the shape of an undulating depression in the carbonate strata. Higher resistivities were identified at the southern edge of the sinkhole, indicating a less fractured block, while at the northern edge, lower resistivities indicated larger fractured carbonate blocks. Located on the transversal TP-32 profile is a more compact block to the west, whereas an anomaly of lower resistivities is fully directed towards the east (
Figure 11). Accordingly, located on the southwest is a significantly compact carbonate block, while significantly fractured and weathered carbonate rocks are found on the northeast edge. The depth of the anomaly indicating low resistivities is estimated to be at 15 or so meters on the TP-31 profile, and 20 or so m on the TP-32 profile, indicating an exceptional anisotropic environment.
Located on both profiles immediately under the sinkholes is a zone with somewhat higher resistivities (40–100 Ωm), followed by a zone of lower resistivities (10–40 Ωm). Higher resistivities in the first zone are probably caused by the remaining smaller carbonate blocks and gravel deposits that have filled underground cavities in carbonates, whereas lower resistivities in the second zone indicate larger underground cavities containing water and clay. The resistivity of clay is approx. 20 Ωm, and water is approx. 40 Ωm, making it difficult to differentiate the content of underground cavities in tomographic resistivity models.
Located at positions 51–117 m on the TP-31 profile is an extensive anomaly of very low resistivity that extends to a depth of 25 m, and within it, close to the surface, there are smaller high-resistivity blocks, which probably stem from tightly compacted carbonate blocks (
Figure 11). The resistivities are a maximum of about 20 Ωm, i.e., at the clay level. However, we can see that the vertical projection of that profile section is essentially reduced, given that the measurements contain negative resistivity values, which were rejected in the inversion process. This kind of phenomenon causes a sudden flow of water in the underground and, subsequently, large natural potentials; this, in turn, causes large amounts of noise during measurements and is attributed to water escaping from tectonic, fractured zones. Rejecting the negative resistivity values reduced the vertical projection; hence, a less fractured carbonate strata, indicating a fault zone, was not included.
Accordingly, the zone probably contains large underground cavities through which groundwater flows and is probably partially filled with clay deposits. The distribution of resistivity in the respective zone, along with the high-resistivity blocks, indicates a grid-like structure of the underground environment, where carbonate rocks are the basis of the grid-like structure, and where numerous underground cavities are located between them through which groundwater flows. This kind of anomaly and structure is noticeable at the end of the TP-32 profile in the positions at 180–213 m and may be linked to the anomaly on the TP-31 profile. This all indicates the significant role of water, especially its mechanical effects at high levels in the formation of underground cavities and, subsequently, cover-collapse sinkholes.
The argument concerning the strong mechanical effects of water is further supported in profile TP-25, which was measured over the main water source at Pašino vrelo (
Figure 12). There is a large correlation between the low resistivity anomaly under Pašino vrelo and profile TP-31 (51–117 m, length 66 m). Profile TP-25 mostly features high resistivities caused by the limestones. Low resistivities, stemming from the clay in the base, are located after the 390-metre position, where model GM-2 begins. The thickness of the clay increases towards the end of the profile. At the positions extending to 260–390 m, a relatively large section of low resistivities (140 m in length) was noticed, extending to a depth of approx. 40 m, whereas resistivities are at the clay level, similar to the anomaly on profile TP-31. However, this section is found in the area of the Pašino vrelo source; hence, it is improbable to conceive that these low resistivities are due to clay. Again, the likelihood is that the zone has underground cavities, partially filled with water and partially with clay. Moreover, wells are used in the zone to pump up water, which causes significant electrical noise and causes distortion of the measured resistivities. This is supported by the large absolute error (8.1%) in the inverse resistivity model with respect to other surrounding profiles.
Similar anomalies of low resistivities and smaller dimensions are shown in [
44], which are associated with collapse sinkholes in the area of El Hajeb in Morocco. High resistivities are caused by fractured dolomitic limestones, and the low resistivity anomalies were interpreted as underground cavities filled with clayey deposits of low resistivity. On the other side, in [
45], different resistivity values of electrical anomalies measured over the area with cover-collapse sinkholes, in the case of Tarimba Cave in Brazil, are highlighted. The variable resistivities of electrical anomalies are the result of variable degrees of compaction and moisture of sedimentary fill in the underground cavities.
Unfortunately, lithological data from exploratory boreholes in the investigated area are very limited; although in 2005 and 2006, two boreholes were drilled near the Pašino vrelo source, no lithological columns were published. Thus, [
36] stated only that the Quaternary alluvial aquifer, composed of weakly bound and unbound clastites (gravels, sands and clayey gravels), is located immediately above the Badenian carbonate aquifer, and the authors estimated the thickness of this alluvial aquifer to be about 10 m. On the other hand, the resistivity models of the measured tomographic profiles point to large changes in the thickness of the clastic cover, from 1 m to about 10 m.
5. Mechanism behind Cover-Collapse Sinkholes
Clay deposits containing clay-sand and gravel lenses found on the surface above Lithothamnium limestones and calcarenites have exceptionally poor permeability or are completely impermeable, and range in thickness from a few metres to 10 or so metres. This is the reason for poor replenishment of this aquifer with stormwater, which due to dissolving carbon dioxide becomes acidic. resulting in the chemical dissolving of limestone, leading to the formation of underground cavities in such locations. This formation is very important, as it leads to sedimentation of material from clastic deposits in the covering strata and creation of shallow underground cavities in it. Accordingly, the carbonate aquifer is mainly replenished laterally, i.e., partly from those same Lithothamnium limestones that, on the surrounding hills are found on surfaces, southwest from the investigated area. In that particular area, acidic rain can have a chemical effect on the limestones, but it is likely quickly saturated with dissolved CaCO
3 and loses its dissolving strength further downstream in the underground. It was also pointed out that the collapse processes in carbonate karst are much less pronounced than in the case of evaporite substrate, especially due to the lower solubility and higher mechanical strength of carbonates [
5].
Hence, the question is to the origin of underground cavities in Lithothamnium limestones located under clastic strata. These cavities probably originated at a time when the limestones were on the surface and exposed to chemical erosion, where added tectonic activity and the mechanical action of water further contributed to the formation of underground cavities in them. Most of the underground cavities in the limestones are probably of a fossil type, and only a smaller part was formed due to the more recent action of underground water, predominantly mechanical in nature. The authors of [
36] stated that the sampled waters from the springs and wells in the survey area are mostly saturated with respect to calcite. They also stated that a higher partial pressure of CO
2 is noticed during colder months, which leads to greater solubility of carbonate minerals. During the warmer months, the lower partial pressure of CO
2 causes a decrease in solubility. On the other hand, underground cavities in the clastites occurred due to the recent action of underground water, rinsing clastic deposits in the covering, whereas clastic materials undergo sedimentation in underground cavities in carbonates.
The mechanism of the cavity development in clastites is explained in [
9] by hydro-mechanical modelling. The groundwater flow was modeled through open conduit, which can be well correlated with the groundwater flows in the top part of the carbonate aquifer, with numerous underground cavities determined by tomographic measurements. The formation and development of underground cavities in clastites depends on the size of the conduit, the change in hydraulic pressure and particle cohesion of the clastites. In our case, very high hydraulic pressure during high groundwater levels is particularly important, while the particle cohesion in clastites is affected by changes in moisture during rainy–dry periods. High hydraulic pressure causes downward granular discharge and upward cavity progression and, finally, collapse of the thinned clastic layer. The authors of [
9] also defined a linear dependence of the characteristic collapse width and the thickness of the clastic cover. In the area of Mečenčani, it was also noticed that large sinkholes appear with a great thickness of the clastic cover (8–10 m). The analysis of the effect of internal erosion on the development of underground cavities caused by cracks in conduits presented by [
8] can also be used to understand the mechanism of the formation and development of underground cavities in clastites. The role of earthquakes can be explained due to the effect on the structure of upper parts of aquifers, which are described as grid-like, featuring a series of smaller and larger irregular underground cavities where the matrix comprises narrow carbonate blocks, dividing up the underground cavity like a house of cards (
Figure 11 and
Figure 12). The main strong earthquake and a series of subsequent earthquakes, foreshocks and aftershocks caused breakage of these fragile structures, leading to the sudden creation of large underground cavities in the underground and sudden collapse of the clastic strata or covering. This type of structure is visible and documented in the tomographic profiles TP-31 and TP-32, measured over the largest cover-collapse sinkhole (
Figure 11). The role of the earthquake as a trigger for the development of cover-collapse sinkholes can be supported by
Figure 5, which shows a sudden increase in the number of sinkholes after the earthquake.
The influence of earthquakes on the development of underground cavities has also been shown in a number of previous studies. Refs. [
12,
13,
14] observed a causal connection between the occurrence of sinkholes and seismically active faults. Earthquakes cause fracturing of the rocks and increase permeability by creating secondary porosity, which increases water circulation and chemical and mechanical weathering of the rocks. The trigger for the collapse of unstable cavities can also be seismically-induced stress. as in the case of sinkholes near Ein Gedi after the Mw 5.2 earthquake on the Dead Sea Transform fault [
46].
A general drawing of the entire hydrogeological model of the underground is shown in
Figure 13. Stormwater feeds the peripheral parts of the aquifer, including the Lithothamnium limestones located on the surface of surrounding hills. The water enters the aquifer and flows through its more permeable sections, surface weathered zone, upper zone, as well as faults and fractured zones, that is, through underground cracks and cavities [
47]. These zones contain systems of underground cavities typical for carbonate rocks. The expectation is that the surface zone of the aquifer has mostly sub-horizontal groundwater flows, whereas subvertical flows are dominant in the fault zones. Water continually washes the clay out from the clastic deposits of the covering, whereas sand and gravel components undergo sedimentation in the underground cavities in limestones, creating and forming shallow underground cavities in the clastic covering. During intense rainfall and high groundwater levels, in addition to a sudden increase in water yield, severe water turbidity was observed at springs and wells. This washes the clay component out of the system, which means that the cavities in the deposits increase. Intense pressure from underground waters at high water levels, which are artesian in nature, especially along the permeable fault zones containing subvertical flows, also cause strong mechanical action from groundwater and increase the size of underground cavities in the clastic covering. As the cavities approach the surface, there is a sudden collapse followed by the formation of circular and elliptical sinkholes with steep walls.
Cover-collapse sinkholes generally appear across a wide area of the rural settlements of Mečenčani and Borojevići, but their concentration is found along contact zones between models GM-1 and GM-2 (
Figure 14). In other words, the pressure of the water is greatest at the barrier of clay deposits, which is found in the GM-2 model, representing the strongest mechanical effects of underground water and subsequently the most frequent formation of underground cavities in the clastic covering. Therefore, the boundaries of where the cover-collapse sinkholes appear across the wider area provide evidence of a boundary between the two geological models. It can be clearly seen in
Figure 14 that all cover-collapse sinkholes in the area of Mečenčani appear in the GM-1 model under the boundary of the geological models, as determined on the basis of tomographic measurements. In other words, the boundary of the presence of cover-collapse sinkholes follows the boundary of the geological models. Hence, the remaining area of Mečenčani and Borojevići; i.e., to the northwest of Pašino vrelo, the boundary of the two models can be determined by following the boundary demarcating the presence of cover-collapse sinkholes.

