
Study of the Effects of Daylighting and Artificial Lighting at 59° Latitude on Mental States, Behaviour and Perception


Abstract
:1. Introduction
Summary and Research Questions
- An artificial lighting condition (ALC) without view;
- A day-lit only condition with view (DLC).
- Better mood and lower sleepiness;
- An advance of sleeping time (sleep phase) and an increase in sleep duration;
- Faster and shorter perception of the passing of time.
2. Material and Methods
2.1. Compliance with Ethics Standard
2.2. Participants
2.3. Experimental Setting
2.3.1. ALC: Room Design and Lighting Conditions
2.3.2. DLC: Room Design and Lighting Conditions
2.4. Lighting Conditions
2.4.1. Photometric Values
2.4.2. Spectral Values
2.5. Behaviour: Activity and Sleep
2.6. Emotional States: Karolinska Sleepiness Scale (KSS) and Mood Diary
2.7. Perception of Lighting and Time
2.7.1. Perception of Lighting Qualities
- Level of light (1 = ”dark”–5 = “bright”);
- Light distribution (1 = “uniform”–5 = “dramatic”);
- Colour of light (1 =“cold”–5 =“warm”);
- Glare (1 = “none”–5 = “intolerable”).
2.7.2. Temporal Perception
- Duration “Did it seem like a short or long period of time?” (1=“short”–5=“long”);
- Speed “How did you feel the passing of time?” (1=“slow”–5=“fast”);
- Pace “At which pace did time pass?” (1=“smooth”–5=“fragmented”).
2.8. Procedure
- Each morning, they reported their sleep quality on the previous night;
- Every hour, they rated their emotional states (sleepiness and mood);
- At the end of each day, they evaluated lighting, temporal and spatial perception. They filled-in an open questionnaire for qualitative feedback.
2.9. Statistical Analysis
3. Results
3.1. Measured Illuminance Values
3.1.1. Weather
3.1.2. Photometric Values
3.2. Emotional States
3.2.1. Sleepiness
3.2.2. Mood
3.3. Behaviour
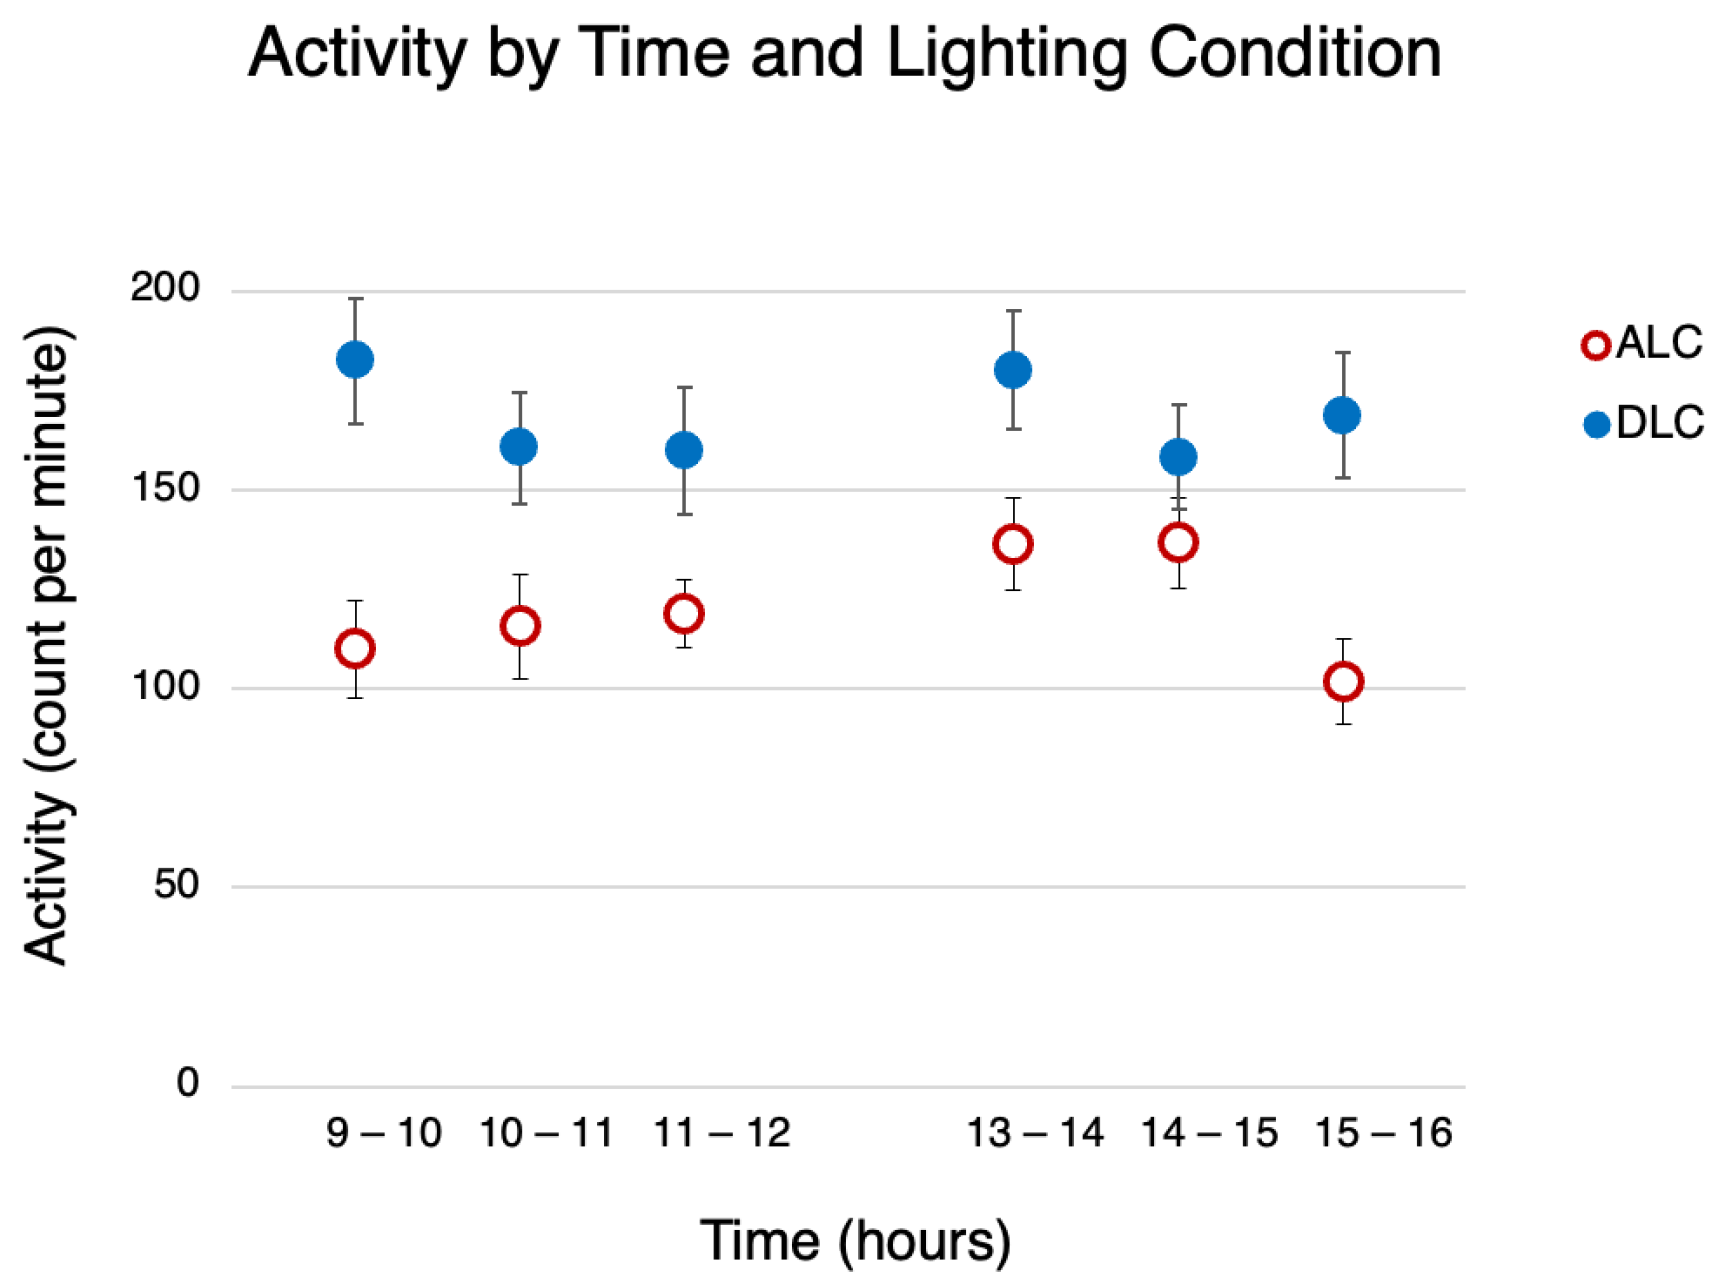
3.3.1. Activity
3.3.2. Sleep
3.4. Summary of Emotional States and Activity
3.5. Perception
3.5.1. Temporal Perception
3.5.2. Lighting Parameters Perception
4. Discussion
4.1. Lighting Conditions and Emotional States
4.2. Exposure and Behaviour
4.3. Perception of Time and Lighting
4.4. Daylighting Spaces in Scandinavian Winter
4.5. Limitations
5. Conclusions
Author Contributions
Funding
Institutional Review Board Statement
Informed Consent Statement
Data Availability Statement
Acknowledgments
Conflicts of Interest
Appendix A

| ALC ID | Day 1 | Day 2 | Day 3 |
|---|---|---|---|
| 250 | Today I felt the light was warmer than yesterday | Again like yesterday, I feel the light is too warm… | |
| 249 | The intensity of colour became stronger than the first 2 days. The perception of the glare from the reflectors of the luminaires also became kind of intolerable and harsh. I started to feel the colour temperature becoming warmer than before. The feeling of losing sense of time getting stronger, and the space’s becoming narrower than before. started to feel strong contrast. | ||
| 265 | The light is good—specially colour of the light is good. The problem is feeling like a prisoner. In my opinion the lack of view is a problem for this room not the light. Even it was the night view of outside with artificial light I would have felt much better. | ||
| 254 | The condition haven’t changed although now I notice it is a bit more dramatic then it seemed yesterday. I find more contrast. | The room has a very clear lighting, focus and although the whole room is lit up ’well’. Some areas seem very dark and unpleasant (around the doors and the middle of the tables). | |
| 231 | I feel the brightness seems lower than the previous day. | Feel the light continues to become darker and gloomy than the previous days. | |
| 252 | Multiple shadows, one is stronger than the others. | ||
| 258 | |||
| 239 | |||
| 240 | Looks like the colours are changing from 14:00 to 16:30. | Today I was adapted to the environment. I think we have a feeling of being at our place somehow. | |
| 262 | The light was very uniform and pleasant to be | The day was snowing so the light was not as bright as yesterday. Overall, the light was more uniform due to stable, snowing conditions, It kept quite bright all day. | Overcast and partially sunny: I like working in natural daylight. The space feels open and easy to be in. |
| 260 | [⋯] you’re like outside in winter | ||
| 248 | Bad weather, look sad, windy, gray sky and little cold inside the room(from after lunch time). | ||
| 253 | Quite ok | Good lighting condition | |
| 245 | The color of the light is rather cold. Snowy theme outside the window, the atmosphere of room seems cold. | ||
| 241 | If not looking at a computer screen, reflection wouldn’t be a problem. | ||
| 244 | I did not feel glare because I focused more on my book than looking to the wall or window. But when I looked towards the window or walls I felt glare to some extent. | ||
| 259 | It was an overcast day with a high level of illumination. Light ? the day was pleasant. | A dark, snowing northern winter-day.Total experience and view of outside was not pleasant as yesterday. | It was a partly sunny partly cloudy day. Lighting conditions varied a lot. |
| ALC | |||
|---|---|---|---|
| ID | Day 1 | Day 2 | Day 3 |
| 250 | I want to concentrate on what I’m doing(which is quite boring!) but it’s not that easy! | The worst thing for me is having no connection to outside, I had a feeling like I’m in bed and I need daylight to make myself awake! And I can’t do this!! | I had to stay, while there was no motivation… no sense of belonging to the space. |
| 249 | If there’s no clock or watch, It’s too difficult to tell the time. Also people rarely have happy face, always quite, even more quiet than in a hospital. | No sense of orientation, No sense of time. Narrow space. | |
| 265 | For me it’s not just only like a boring lecture. It’s more like being in a prison for a short time, with no exciting event, just having my laptop saved me and helped me to feel better. | Today I was more bored actually after 13 o’clock. But as same as yesterday in the beginning of the day was different for me, I felt extremely alert and in a good mood, after some hours I’m going to feel worst. | Today I didn’t have my laptop with myself. So I felt today worst comparing the past 2 days, and having a bad last night sleeping had a awful effect on me. |
| 254 | The light doesn’t have any problem. The problem is the feeling of being forced in a room for long time. | ||
| 231 | it is much closer to waiting to the train station in the middle of the night. | A long standby because it is like I’m waiting for something to happen but no idea when. So it makes me anxious and weary. | For me being in a shopping mall is tedious and slow, also I usually can’t wait for it to be over. |
| 252 | Just like a scene I’ve experienced before. | Not so energetic but the general status is still ok. You always wait for the time of the meal, you feel hungry more often. | No stress but never find an exciting point and the feeling is not going well but getting slightly worse than the previous days. |
| 258 | |||
| 239 | |||
| 240 | Quite an atmosphere for me. I love reading and I have to say I enjoyed it. It was like watching a movie. | I didn’t notice the time passing by. It’s almost over and I spent almost the whole day inside the room. This was looking impossible at the first day. | |
| 262 | I was very tired so it felt like time was passing slowly in order for me to get to leave for work. | It’s a nice place to work in. | |
| 260 | Similar to the free spent time at home | ||
| 248 | Sitting close window watching outside the bad, cold, windy weather and gray sky also people How they look giving you cold feeling from outside to inside(room) so energy go down. | sunny day and bright—active day. So bad for not doing work inside the room | |
| 253 | Even lit, quite cold light. You really feel the light going down in the afternoon! | I was pretty busy today so it went rather quick by. The skylight outside was more comfortable toady. | I was tired today due to little sleep, sky very greyish and colors quite vague! |
| 245 | Alternate attention/Inattention. Few moments of focus. | Feels like the light is going down to the end of the sky | Great sky view |
| 241 | the color is similar to hospital light | ||
| 244 | Not sunny but a pleasant day spent outside! | The dark grey clouds passed in front of me all day long in a different variety of shades. | 3rd. day in the same spot felt like déjà vu |
| 259 | It was like being outdoor, but feeling no cold | It was like sitting in a not-crowed shopping mall | I felt a kind of freedom like being in a shopping mall while sitting in its middle to rest |
References
- Czeisler, C.A. Perspective: Casting light on sleep deficiency. Nature 2013, 497, S13. [Google Scholar] [CrossRef] [PubMed]
- Daugaard, S.; Markvart, J.; Bonde, J.P.; Christoffersen, J.; Garde, A.H.; Hansen, Å.M.; Schlünssen, V.; Vestergaard, J.M.; Vistisen, H.T.; Kolstad, H.A. Light Exposure during Days with Night, Outdoor, and Indoor Work. Ann. Work Expo. Health 2019, 63, 651–665. [Google Scholar] [CrossRef] [PubMed]
- Lowden, A.; Lemos, N.; Gonçalves, B.; Öztürk, G.; Louzada, F.; Pedrazzoli, M.; Moreno, C. Delayed Sleep in Winter Related to Natural Daylight Exposure among Arctic Day Workers. Clocks Sleep 2018, 1, 105–116. [Google Scholar] [CrossRef] [PubMed] [Green Version]
- Gaston, K.J.; Bennie, J.; Davies, T.W.; Hopkins, J. The ecological impacts of nighttime light pollution: A mechanistic appraisal. Biol. Rev. 2013, 88, 912–927. [Google Scholar] [CrossRef]
- Edwards, L.; Torcellini, P. A Literature Review of the Effects of Natural Light on Buildings Occupants; Technical report; National Renewable Energy Laboratory—U.S. Department of Energy Laboratory: Golden, CO, USA, 2002.
- Boyce, P.; Hunter, C.; Howlett, O. The Benefits of Daylight through Windows Sponsored by: Capturing the Daylight Dividend Program The Benefits of Daylight through Windows. Exposure 2003, 1, 1–88. [Google Scholar]
- Veitch, J.A.; Newsham, G.R.; Boyce, P.R.; Jones, C.C. Lighting appraisal, well-being and performance in open-plan offices: A linked mechanisms approach. Light. Res. Technol. 2008, 40, 133–148. [Google Scholar] [CrossRef] [Green Version]
- Aries, M.B.; Aarts, M.P.; Hoof, J.V. Daylight and health: A review of the evidence and consequences for the built environment. Light. Res. Technol. 2013, 47, 1–22. [Google Scholar] [CrossRef]
- Lowden, A.; Favero, F. Light and health—A summary of research focusing on the importance of daylight in the living environment. (Swedish: Ljus och hälsa. En kunskapssammanställning med fokus pådagsljusets betydelse i inomhusmiljö.). Folkhälsomyndigheten 2017, 1–49. Available online: https://scholar.google.com/scholar?hl=fr&as_sdt=0%2C5&q=Ljus+och+h%C3%A4lsa%3A+En+kunskapssammansta%CC%88llning+med+fokus+pa%CC%8A+dagsljusets+betydelse+i+inomhusmiljo%CC%88&btnG= (accessed on 29 November 2022).
- Aarts, M. Changing perspectives on daylight: Science, technology, and culture. Supplement to Science. Science 2017, 358, 1–48. [Google Scholar]
- Knoop, M.; Stefani, O.; Bueno, B.; Matusiak, B.; Hobday, R.; Wirz-Justice, A.; Martiny, K.; Kantermann, T.; Aarts, M.P.; Zemmouri, N.; et al. Daylight: What makes the difference? Light. Res. Technol. 2019, 0, 1–20. [Google Scholar] [CrossRef] [Green Version]
- Lundgren, M. Performance in the Swedish Building Code: An Inquiry into the Consequences for Architectural Design of the Formulation and Assessment of Performance Requirements. Ph.D. Thesis, KTH, Stockholm, Sweden, 2019. [Google Scholar]
- Münch, M.; Wirz-Justice, A.; Brown, S.A.; Kantermann, T.; Martiny, K.; Stefani, O.; Vetter, C.; Wright, K.P.; Wulff, K.; Skene, D.J. The Role of Daylight for Humans: Gaps in Current Knowledge. Clocks Sleep 2020, 2, 61–85. [Google Scholar] [CrossRef] [Green Version]
- Veitch, J.A.; Gifford, R. Choice, perceived control, and performance decrements in the physical environment. J. Environ. Psychol. 1996, 16, 269–276. [Google Scholar] [CrossRef]
- Aan het Rot, M.; Moskowitz, D.S.; Young, S.N. Exposure to bright light is associated with positive social interaction and good mood over short time periods: A naturalistic study in mildly seasonal people. J. Psychiatr. Res. 2008, 42, 311–319. [Google Scholar] [CrossRef]
- Kaida, K.; Takahashi, M.; Haratani, T.; Otsuka, Y.; Fukasawa, K.; Nakata, A. Indoor exposure to natural bright light prevents afternoon sleepiness. Sleep 2006, 29, 462–469. [Google Scholar] [CrossRef] [PubMed] [Green Version]
- De Zeeuw, J.; Papakonstantinou, A.; Nowozin, C.; Stotz, S.; Zaleska, M.; Hädel, S.; Bes, F.; Münch, M.; Kunz, D. Living in Biological Darkness: Objective Sleepiness and the Pupillary Light Responses Are Affected by Different Metameric Lighting Conditions during Daytime. J. Biol. Rhythm. 2019, 34, 410–431. [Google Scholar] [CrossRef] [PubMed] [Green Version]
- Smolders, K.; de Kort, Y.; van den Berg, S. Daytime light exposure and feelings of vitality: Results of a field study during regular weekdays. J. Environ. Psychol. 2013, 36, 270–279. [Google Scholar] [CrossRef]
- Fox, E. Emotion Science; Macmillan Education UK: London, UK, 2008. [Google Scholar] [CrossRef]
- Scherer, K.R. The dynamic architecture of emotion: Evidence for the component process model. Cogn. Emot. 2009, 23, 1307–1351. [Google Scholar] [CrossRef]
- Legates, T.A.; Altimus, C.M.; Wang, H.; Lee, H.K.; Yang, S.; Zhao, H.; Kirkwood, A.; Weber, E.T.; Hattar, S. Aberrant light directly impairs mood and learning through melanopsin-expressing neurons. Nature 2012, 491, 594–598. [Google Scholar] [CrossRef] [Green Version]
- Åkerstedt, T.; Gillberg, M. Subjective and Objective Sleepiness in the Active Individual. Int. J. Neurosci. 1990, 52, 29–37. [Google Scholar] [CrossRef]
- Gillberg, M.; Kecklund, G.; Akerstedt, T. Relations between performance and subjective ratings of sleepiness during a night awake. Sleep 1994, 17, 236–241. [Google Scholar] [CrossRef] [Green Version]
- Burns, A.C.; Saxena, R.; Vetter, C.; Phillips, A.J.; Lane, J.M.; Cain, S.W. Time spent in outdoor light is associated with mood, sleep, and circadian rhythm-related outcomes: A cross-sectional and longitudinal study in over 400,000 UK Biobank participants. J. Affect. Disord. 2021, 295, 347–352. [Google Scholar] [CrossRef] [PubMed]
- Evans, G.W.; Mccoy, J.M. When Buildings Don’t Work: The Role Of Architecture In Human Health. J. Environ. Psychol. 1996, 18, 85–94. [Google Scholar] [CrossRef]
- Matthews, W.J.; Meck, W.H. Time perception: The bad news and the good. Wiley Interdiscip. Rev. Cogn. Sci. 2014, 5, 429–446. [Google Scholar] [CrossRef] [PubMed] [Green Version]
- Cajochen, C.; Freyburger, M.; Basishvili, T.; Garbazza, C.; Rudzik, F.; Renz, C.; Kobayashi, K.; Shirakawa, Y.; Stefani, O.; Weibel, J. Effect of daylight LED on visual comfort, melatonin, mood, waking performance and sleep. Light. Res. Technol. 2019, 51, 1044–1062. [Google Scholar] [CrossRef]
- Figueiro, M.; Rea, M. Office lighting and personal light exposures in two seasons: Impact on sleep and mood. Light. Res. Technol. 2016, 48, 352–364. [Google Scholar] [CrossRef]
- Kozaki, T.; Miura, N.; Takahashi, M.; Yasukouchi, A. Effect of reduced illumination on insomnia in office workers. J. Occup. Health 2012, 54, 331–335. [Google Scholar] [CrossRef] [Green Version]
- Giménez, M.C.; Geerdinck, L.M.; Versteylen, M.; Leffers, P.; Meekes, G.; Herremans, H.; Ruyter, B.E.R.d.; Bikker, J.W.; Kuijpers, P.; Schlangen, L.J.M. Patient room lighting influences on sleep, appraisal and mood in hospitalised people. J. Sleep Res. 2017, 26, 236–246. [Google Scholar] [CrossRef] [Green Version]
- CIE. CIE S 026/E:2018 CIE System for Metrology of Optical Radiation for ipRGC-Influenced Responses to Light; Technical report; International Commission on Illumination: Vienna, Austria, 2018. [Google Scholar] [CrossRef]
- Lucas, R.J.; Peirson, S.N.; Berson, D.M.; Brown, T.M.; Cooper, H.M.; Czeisler, C.A.; Figueiro, M.G.; Gamlin, P.D.; Lockley, S.W.; O’Hagan, J.B.; et al. Measuring and using light in the melanopsin age. Trends Neurosci. 2014, 37, 1–9. [Google Scholar] [CrossRef]
- Brown, T.M. Melanopic illuminance defines the magnitude of human circadian light responses under a wide range of conditions. J. Pineal Res. 2020, 69, 1–14. [Google Scholar] [CrossRef] [Green Version]
- Brown, T.M.; Brainard, G.C.; Cajochen, C.; Czeisler, C.A.; Hanifin, J.P.; Lockley, S.W.; Lucas, J.R.; Münch, M.; O’Hagan, J.B.; Peirson, S.N.; et al. Recommendations for Healthy Daytime, Evening, and Night-Time Indoor Light Exposure. PLoS Biol. 2022, 20, 3. [Google Scholar] [CrossRef]
- Borisuit, A.; Linhart, F.; Scartezzini, J.L.; Münch, M. Effects of realistic office daylighting and electric lighting conditions on visual comfort, alertness and mood. Light. Res. Technol. 2015, 47, 192–209. [Google Scholar] [CrossRef]
- Boyce, P.R.; Veitch, J.A.; Newsham, G.R.; Jones, C.C.; Heerwagen, J.; Myer, M.; Hunter, C.M. Lighting quality and office work: Two field simulation experiments. Light. Res. Technol. 2006, 38, 191–223. [Google Scholar] [CrossRef] [Green Version]
- Ejhed, J. Lighting and environmental design—A full scale study. In CIE: Proceedings 22nd Session; Australian Road Research Board: Melbourne, Australia, 1991. [Google Scholar]
- Matusiak, B.S.; Klöckner, C.A. How we evaluate the view out through the window. Archit. Sci. Rev. 2016, 59, 203–211. [Google Scholar] [CrossRef]
- Flynn, J.; Hendrick, C.; Spencer, T.; Martyniuk, O. A guide to methodology procedures for measuring subjective impressions in lighting. J. Illum. Eng. Soc. 1979, 8, 95–110. [Google Scholar] [CrossRef]
- Liljefors, A. Lighting—Visually and Physically; KTH Royal Institute of Technology—School of Architecture: Stockholm, Sweden, 1999. [Google Scholar]
- Torsvall, L.; Åkerstedt, T. A Diurnal Type Scale Construction, Consistency and Validation in Shift Work. Scand. J. Work. Environ. Health 1980, 6, 283–290. [Google Scholar] [CrossRef] [PubMed] [Green Version]
- JASP Team. JASP (Version 0.16.4) [Computer software] 2022. Available online: https://jasp-stats.org/download/ (accessed on 1 September 2022).
- Field, A. An Adventure in Statistics: The Reality Enigma; SAGE Publications Ltd.: London, UK, 2016; p. 768. [Google Scholar]
- Hubalek, S.; Brink, M.; Schierz, C. Office workers’ daily exposure to light and its influence on sleep quality and mood. Light. Res. Technol. 2010, 42, 33–50. [Google Scholar] [CrossRef] [Green Version]
- Neil-Sztramko, S.E.; Rafn, B.S.; Gotay, C.C.; Campbell, K.L. Determining activity count cut-points for measurement of physical activity using the Actiwatch2 accelerometer. Physiol. Behav. 2017, 173, 95–100. [Google Scholar] [CrossRef]
- Kemp, C.; Pienaar, P.R.; Henst, R.H.; Roden, L.C.; Kolbe-Alexander, T.L.; Rae, D.E. Assessing the validity and reliability and determining cut-points of the Actiwatch 2 in measuring physical activity. Physiol. Meas. 2020, 41, 085001. [Google Scholar] [CrossRef]
- Cappuccio, F.P.; Miller, M.A.; Lockley, S.W. Sleep, Health and Society; Oxford University Press: Oxford, UK, 2010. [Google Scholar] [CrossRef] [Green Version]
- Boyce, P.R. Human Factors in Lighting; CRC Press: Boca Raton, FL, USA, 2014. [Google Scholar]
- Bournas, I.; Dubois, M.C. Daylight regulation compliance of existing multi-family apartment blocks in Sweden. Build. Environ. 2019, 150, 254–265. [Google Scholar] [CrossRef]
- Gentile, N.; Goven, T.; Laike, T.; Sjoberg, K. A field study of fluorescent and LED classroom lighting. Light. Res. Technol. 2018, 50, 631–650. [Google Scholar] [CrossRef]
- Figueiro, M.G.; Saldo, E.; Rea, M.S.; Kubarek, K.; Cunningham, J.; Rea, M.S. Developing Architectural Lighting Designs to Improve Sleep in Older Adults. Open Sleep J. 2008, 1, 40–51. [Google Scholar] [CrossRef] [Green Version]
- Pirkola, S.; Eriksen, H.; Partonen, T.; Kieseppä, T.; Veijola, J.; Jääskeläinen, E.; Mylläri-Figuerola, E.M.; Salo, P.; Paunio, T. Seasonal variation in affective and other clinical symptoms among high-risk families for bipolar disorders in an arctic population. Int. J. Circumpolar Health 2015, 74, 29671. [Google Scholar] [CrossRef]
- Nioi, A.; Roe, J.; Gow, A.; McNair, D.; Aspinall, P. Seasonal Differences in Light Exposure and the Associations With Health and Well-Being in Older Adults: An Exploratory Study. Health Environ. Res. Des. J. 2017, 10, 64–79. [Google Scholar] [CrossRef] [PubMed] [Green Version]
- Figueiro, M.G.; Hamner, R.; Bierman, A.; Rea, M.S. Comparisons of three practical field devices used to measure personal light exposures and activity levels. Light. Res. Technol. 2013, 45, 421–434. [Google Scholar] [CrossRef] [PubMed]


| Architectural Feature | ALC | DLC |
|---|---|---|
| Room measurements | 8 by 8 m | 8 by 6 m |
| Ceiling height | 3.9 m | 3.9 m |
| Illuminated ceiling/skylight dimensions | 3.6 by 3.6 m | 3.6 by 4 m |
| View | limited to the room | open to the sky |
| Vertical surfaces | white plaster (0.74), light grey concrete columns (0.45), red bricks (0.32), dark curtain (0.07) | white plaster (0.74), light grey concrete columns (0.45) |
| Horizontal surfaces | linoleum floor (0.28), red laminate tables (0.34) | wooden floor (0.26), red laminate tables (0.34) |
| Layout | participants facing each other | participants facing each other |
| Sleepiness | F | Df | p | B | Standardized |
|---|---|---|---|---|---|
| Day | 0.88 | 2, 291 | 0.414 | −0.01 (0.11) | −0.01 |
| Time * | 2.75 | 5, 282 | 0.019 | 0.13 (0.04) | 0.17 |
| Daily Exposure (log) * | 4.53 | 1, 31 | 0.041 | −0.99 (0.23) | −0.24 |
| Mood | F | Df | p | B | Standardized |
| Day | 1.26 | 2, 16 | 0.309 | 0.04 (0.09) | 0.02 |
| Time | 1.86 | 5, 250 | 0.102 | −0.05 (0.04) | −0.07 |
| Lighting Condition ** | 11.85 | 1, 15 | 0.004 | 1.12 (0.15) | 0.39 |
| Activity | F | Df | p | B | Standardized |
|---|---|---|---|---|---|
| Day | 2.02 | 2, 271 | 0.135 | 7.45 (4.59) | 0.09 |
| Time | 1.07 | 5, 262 | 0.378 | 0.15 (1.74) | 0.01 |
| Daily Exposure (log) * | 5.40 | 1, 28 | 0.028 | 76.53 (10.72) | 0.39 |
| Duration | F | Df | p | B | Standardized |
|---|---|---|---|---|---|
| Day | 0.17 | 2, 32 | 0.844 | −0.03 (0.18) | −0.02 |
| Lighting Condition * | 5.50 | 1, 15 | 0.033 | −0.90 (0.30) | −0.40 |
| Speed | F | Df | p | B | Standardized |
| Day | 0.51 | 2, 32 | 0.608 | 0.09 (0.17) | 0.08 |
| Lighting Condition | 0.39 | 1, 15 | 0.543 | 0.24 (0.28) | 0.13 |
| Pace | F | Df | p | B | Standardized |
| Day | 1.99 | 2, 33 | 0.153 | −0.14 (0.13) | −0.12 |
| Daily Exposure (log) ** | 11.18 | 1, 18 | 0.004 | −1.07 (0.29) | −0.46 |
| Level of Light | F | Df | p | B | Standardized |
|---|---|---|---|---|---|
| Day * | 4.307 | 2, 35 | 0.021 | −0.24 (0.13) | −0.25 |
| Daily Exposure (log) | 0.10 | 1, 16 | 0.763 | 0.37 (0.28) | −0.18 |
| Distribution | F | Df | p | B | Standardized |
| Day | 0.32 | 2, 32 | 0.728 | 0.06 (0.17) | 0.05 |
| Colour of Light | F | Df | p | B | Standardized |
| Day | 0.171 | 2, 30 | 0.844 | −0.08 (0.19) | −0.06 |
| Hourly Exposure 15–16 h * | 5.129 | 1, 35 | 0.030 | −1.11 (0.48) | −0.32 |
| Glare | F | Df | p | B | Standardized |
| Day | 1.57 | 2, 34 | 0.222 | 0.07 (0.13) | 0.07 |
| Daily Exposure (log) ** | 8.68 | 1, 28 | 0.006 | −1.28 (0.27) | −0.56 |
Disclaimer/Publisher’s Note: The statements, opinions and data contained in all publications are solely those of the individual author(s) and contributor(s) and not of MDPI and/or the editor(s). MDPI and/or the editor(s) disclaim responsibility for any injury to people or property resulting from any ideas, methods, instructions or products referred to in the content. |
© 2023 by the authors. Licensee MDPI, Basel, Switzerland. This article is an open access article distributed under the terms and conditions of the Creative Commons Attribution (CC BY) license (https://creativecommons.org/licenses/by/4.0/).
Share and Cite
Favero, F.; Lowden, A.; Bresin, R.; Ejhed, J. Study of the Effects of Daylighting and Artificial Lighting at 59° Latitude on Mental States, Behaviour and Perception. Sustainability 2023, 15, 1144. https://doi.org/10.3390/su15021144
Favero F, Lowden A, Bresin R, Ejhed J. Study of the Effects of Daylighting and Artificial Lighting at 59° Latitude on Mental States, Behaviour and Perception. Sustainability. 2023; 15(2):1144. https://doi.org/10.3390/su15021144
Chicago/Turabian StyleFavero, Federico, Arne Lowden, Roberto Bresin, and Jan Ejhed. 2023. "Study of the Effects of Daylighting and Artificial Lighting at 59° Latitude on Mental States, Behaviour and Perception" Sustainability 15, no. 2: 1144. https://doi.org/10.3390/su15021144
APA StyleFavero, F., Lowden, A., Bresin, R., & Ejhed, J. (2023). Study of the Effects of Daylighting and Artificial Lighting at 59° Latitude on Mental States, Behaviour and Perception. Sustainability, 15(2), 1144. https://doi.org/10.3390/su15021144