Abstract
The present study aims to examine profiles of design thinkers in a teacher education programme during technology-enhanced teaching/learning in face-to-face and distance modes. Additionally, it investigates how the design thinking (DT) profiles are related to students’ interpersonal and evaluative skills, as well as how DT profiles predict the level of use of technology. A total of 307 undergraduate students participated in this study. Hierarchical and k-means cluster analysis were adopted to identify the DT profiles, whereas multivariate analysis of covariance (MANCOVA) was run to study how the DT profiles were related to respective students’ levels of interpersonal and evaluative skills. Subsequently, the individual profiles of all components of DT were examined for group differences using cross-tabulations. Multinomial logistic regressions were run to examine relationships among DT profiles, interpersonal and evaluative skill levels and use of technology. Based on these analyses, three major findings were obtained. These are as follows: (1) Three distinctive DT profiles were revealed underlying a new extensively validated DT mindset. Low importance was given to team learning and knowledge transfer, which points to the lack of behavioural uncertainty; (2) DT profiles differed significantly in their metacognitive perspectives of interaction- and individual-centred tasks, as well as evaluative skills of monitoring, critical thinking and reflection; (3) Interaction-oriented design tasks involving target use of varied technologies were seen to further enhance socialization, facilitate dialogue and reflection, create an immersive experience and aid the understanding and internalization of tacit knowledge. These findings represent a step toward closing critical gaps in the theory and practice of DT and serve as a springboard for instructors and researchers to develop customized metacognitive instructional support for students in technology-enhanced environments for effective knowledge transfer.
1. Introduction
Nowadays, we witness extremely dynamic behaviour in real-world environments. Political and war crises, climate changes and the COVID-19 pandemic have exposed the vulnerability of the global economy. All stakeholders involved, e.g., individuals, organisations and institutions, have faced disruptions and uncertainties in their everyday personal and business lives. This calls for societal transformation supported by sustainable digital transformation. Such situations also demand new knowledge, strategies and institutional/organisational practices to reduce the risks and uncertainties arising from spatial economic interdependencies [1,2].
Innovation may be seen as the key to overcome current challenges and to create a competitive advantage [3]. Thus, several countries, especially in Europe, give a central place to learning for innovation when it comes to policy-making towards education for sustainable development [4]. This directly influences stakeholders in other sectors such as business and industry also. In these sectors, organisations strive towards creating products and services for improved customer experiences. Such organisations also strive towards overcoming complex business problems using innovative processes, as well as business and educational models for increased impact and revenue. Innovation management across sectors requires the creation of a complex framework, including multiple perspectives, wherein knowledge management can lead to superior organisational performance [5,6]. In this area, complex mechanisms mediating this relationship seem to still be evolving [6]. Perhaps, knowledge sharing might encourage innovation as a result of exchange of expertise that is oriented towards creating or improving valuable products and services [7].
The European Commission (EC) has recognized an innovation gap behind the lack of resources and mechanisms to overcome the challenges we face [8]. Moreover, behavioural change has become a ubiquitous objective for policy-makers and other practitioners involved in trying to promote positive change in society [2,8]. Thus, all stakeholders in the innovation cycle (educational institutions, industrial and business sectors and end-users) need to work on changing their policies, thinking and behaviours in order to contribute as much as possible towards innovation for a competitive sustainable economy and a resilient society [9]. Moreover, innovation may increase and become resilient when concerns of viability (business), desirability (users) and feasibility (technology) are addressed through knowledge creation [10], while some uncertainties will remain to shape innovation systems towards resolving societies’ long-term grand challenges: ageing, clean growth, artificial intelligence and data, future of mobility, etc. [9].
DT has been applied as a powerful learning methodology by several organisations across all sectors of the economy and education. DT is generally defined as “an analytic and creative process that engages a person in opportunities to experiment, create and prototype models, gather feedback, and redesign” [11] (p. 1). DT has received great attention from both academics and practitioners [12]. It has positively affected organisational transformation, innovation, customer orientation, business growth and competitive advantage [12] since “it helps deal with ambiguities and articulate the right questions, as well as identify and formulate possibilities and potentials” [13] (p. 191). However, implementing and applying DT in non-design educational settings or communities seems to be challenging [12,14,15,16]. In non-design communities and organisations dominated by reductionist thinking, DT implementation was found to be too simplistic and faced several difficulties. This raised several concerns among practitioners and academics [12]. Several researchers [12,14,16,17,18,19] report shortcomings and deficiencies caused by inadequate DT implementation. This is also affected by organisational culture features, such as: (1) A lack of durable innovation; (2) Inadequacies in knowledge construction leading to the emergence of pseudoscience; (3) A lack of development of higher-order thinking skills in trainees or students; (4) Flaws in digital technology use; (5) Fluctuating epistemic uncertainty and complex structure of knowledge transfer patterns making them difficult for externalisation or internalisation. Moreover, DT can fail when cognitive obstacles interfere across all stages of DT implementation, e.g., top-down processing, encoding failures, confirmation bias, fixation and fundamental attribution error [20]. Therefore, the knowledge-sharing behaviours inherent in the sustainability challenge of open innovation need to be drastically rethought and reconceptualized. This is partly because of the new demands on business ecosystems and partly on account of the different stakeholders, barriers and factors that might determine the most effective practices for successfully addressing the sustainability problem. On the other hand, a lack of content knowledge and a poor level of learners’ absorptive capacity [21], together with a lack of methods/approaches for transferring knowledge across different levels, e.g., physical level (design artifacts), neuronal level (design intuitive cognition), symbolic level (design rational) and model level (design theories) [22], can be seen as major barriers to innovative learning [9].
The recent shift to online learning in both traditional and open learning environments, requires a clear definition of what constitutes DT in an era of digital teaching and learning. Experts are still debating about technology-enhanced DT conceptualization and the creation of an improved definition for it [2,20,23,24,25,26,27,28]. This underlines the importance of conducting an ongoing examination on DT in technology-enhanced environments. Therefore, the overall goal of this study is to explore the current state of DT implementation in teacher education, along with prospective teachers of design and technology, mediated by the application of different technologies, especially those used during the COVID-19 pandemic.
Above all, this study makes four key contributions to the literature. First, it aims at extending available insights into individual differences in pre-service teachers’ DT behaviour. The importance of understanding the DT-technology-supported group work based on their personal characteristics, skills and abilities for a particular innovation phase is essential for the success of learning innovation [29]. Second, by identifying DT profiles during technology-intensive teaching/learning, the present study serves as an important starting point for the design of tailored metacognitive support adapted to the characteristics and DT needs specific to each DT profile. The results of this study may allow for more individualised support in pedagogical practise, which is likely to have a positive impact on student and trainee learning outcomes. Third, this study also investigates whether technology used for DT implementation in distance and face-to-face learning enables knowledge sharing, especially tacit experiences and tacit knowledge. Finally, the study findings will further extend knowledge on transfer theory, which can improve students’ learning outcomes. Thus, this study seeks to further stimulate innovation in this field.
The structure of this study is as follows: Section 1.1 provides an overview of DT in educational settings, while Section 1.2 addresses the objectives and research questions of the study. Section 2 deals with materials and methods, and the results are presented in Section 3. Section 4 provides a critical discussion of opportunities for technology-enabled sustainable knowledge transfer enhancement, considering the research questions. Section 5 provides conclusions on and the implications of the current findings.
1.1. DT in Educational Settings
In educational institutions, as argued by Hero et al. [4], innovation processes should enable the development of personal characteristics, future orientation, creative thinking skills, social skills, content knowledge, soft skills (e.g., digital fluency, big data analytics, critical thinking, problem solving, flexibility, communication and team work) and hard skills (e.g., lean manufacturing, fabrication technology, machining, prototyping, product design and quality management systems) [4]. Moreover, the goal-oriented learning environment should also allow for the social interactions and enhanced digital transformation needed for the effective design of complex transdisciplinary solutions essential to innovative learning [4,12]. In this sense, the sphere of teacher education is not an exemption. There exists a need to develop the potential of prospective teachers to work creatively with ideas for sustained teaching improvement [30]. Prospective teachers’ DT capacity may be fostered using a knowledge-building approach, which adopts a principle-based pedagogical approach rather than a procedural-based approach [30]. Principle-based learners are engaged in a more designerly manner of knowing and doing and in a reflective and creative course of learning. They are guided towards inventing solutions, interpreting situations, adapting to contexts and dealing with multiple variables. In the process, they learn to formulate and solve pertinent problems [30].
In this context, DT can be considered as an appropriate approach to be used across teaching/learning processes to develop 21st century skills. By its very nature, it includes collaboration to solve malignant problems. Such collaboration employs data gathering and information processing from the real-world environment, people’s experiences and feedback [31] and the use of creativity, critical thinking, system thinking and communication for effective transformative learning [32]. Thus, Panke [23], in her review, reveals the multi-dimensional potential of DT in education. This potential includes: encouraging tacit experiences, reducing cognitive bias, creating flow, increasing empathy, facilitating behavioural change, fostering inter- and multi-disciplinary collaboration, inducing productive failure/increasing resilience, producing surprising and delightful solutions and nurturing creative confidence. Panke [23] also offers insights into DT implementation at different levels of education, both in formal learning and non-formal learning settings. In formal settings, the aim is to boost innovation, improve science, technology, engineering, arts and mathematics (STEAM) learning, enhance interdisciplinarity and hone the perspectives of teachers. In informal settings, the learning goes beyond traditional contexts by including the social and natural environment to improve collaboration and service learning [23]. This, in turn, will create a vision and aid in the implementation of the new possibilities discovered by learners [33].
In higher education, DT goes beyond the studio or laboratory disciplines but is still predominantly applied in marketing, business or entrepreneurship education. Its application across various subject areas is growing [23]. In general, not only students but teachers also might benefit from capability building when DT is used through curriculum themes. Such use of DT involves developing a participatory approach towards world issues, an open explorative attitude, a creative ability and an ethical mindset [23]. DT, as implemented in educational settings, includes several methods stemming from different origins and subject trajectories. These methods might include: (1) Stand-alone scholarly discourses and communities of practice; (2) An interface with the methodical repertoire of qualitative research in general; (3) An interface with software-development concepts, such as rapid prototyping or early stage end-users testing; (4) Methods specifically developed in the context of DT [23]. Along with the benefits of DT for teaching and learning, Panke [23] also reveals some shortcomings or limitations. The limitations include: a lack of creative confidence or mastery, wrong priorities, shallow ideas, anxiety and frustration, creative over-confidence, teamwork conflicts, sprinting instead of long-term focus, placing idea creation over evaluation, as well as tensions between learning content and DT process. Motivations for using DT in education are multi-dimensional. They are reflected in educators’ expectations about unique ideas, elegant solutions and novel concepts, the need to facilitate a learning or development event in a new and invigorating format, as well as the need to induce transferable skills and competencies among participants [23].
The essence of DT as a human-centred approach to problem finding and solving [2] is to put participants into contexts making them think and work like expert designers, and thereby, foster civic literacy, empathy, cultural awareness and risk taking [34]. As a methodology for innovation, DT integrates human, business and technical factors in problem forming, solving and design [35]. It is not a new paradigm for dealing with complex problems academics and practitioners face. However, in recent years, it has gained in popularity and attention, especially in the field of higher education. Here, researchers across multiple fields are involved in studying designers’ practices to develop and refine education and training programmes and to continue the dialogue around the nature and direction of design [2,25,36]. DT can be seen as a strong tool for innovation and a means to address societal challenges [2,12,24]. Contemporary repositioning of DT can be seen as a collaborative, socially informed, creative process [24]. On the other hand, as a unique form of knowledge, DT has been understood as a method, mindset, process and socially embodied practice, wherein knowledge can be created and transferred through modes of knowledge creation (participation, design research, a designerly way of knowing and problem solving) [24], across knowledge levels [22]. Thus, DT can be also understood as a tacit way of knowing [24], wherein a certain comfort-level with ambiguity and uncertainty, as well as empathy with end-users are essential to knowledge production in design [12,37].
One of the crucial points for effective DT implementation is to motivate and empower teachers to effectively implement learning and knowledge transfer. Simultaneously, teachers are trained to acknowledge the side effects of constructivism-based tasks or assignments, such as chaos, crisis and ill-structured problems as learning opportunities, wherein the teacher or educator must ensure enough space for experience, holistic involvement of students and balance between instruction and construction [38]. Successful DT learning requires: handling students with varying levels of domain-specific content knowledge, technological knowledge, semantic processing and visualisation ability; willingness to collaborate; technical and socio-communicative expertise to interact and agree on organising DT; the know-how of interpreting, evaluating and extending the learning content addressed [39,40]. This implies students’ activation of both DT and regulation strategies to coordinate, evaluate, modify, or reinforce their ideas; the occurrence of learning activities; as well as the progress made towards learning outcomes [2,24,40]. Moreover, metacognitive thinking plays an essential role in design idea generation and development and is an important part of the creative process in design [15,28]. Kavousi et al. [28] propose a model for educators to enhance the design process and its outcomes for learners. This model is focused on reflective process knowledge, reflective process monitoring and reflective process control, wherein special attention can be given to sophisticated interpersonal competence alongside technical research skills [41]. Reflective process knowledge deals with DT through cognitive strategy knowledge, self-awareness and task awareness. On the other hand, reflective process monitoring calls for feedback on learning in the form of situational actions monitoring (idea generation, idea development and idea evaluation) and personal feeling monitoring, wherein students check their attachment to the group and DT itself [28,42]. Reflective process control deals with the decisions students make and the corresponding actions that influence their process of designing problem-solving [28]. This is especially important in the conversion of tacit knowledge to explicit knowledge and vice versa, using designerly ways of knowing [24]. Moreover, control over personal feelings, over situational actions and over the environment can be realised during DT [22,28,40], especially at the behavioural design stage, which is the key to addressing major behavioural and societal challenges across several areas [43]. Behavioural uncertainty is associated with being able to predict or explain a person’s behaviour. It might play a selective role in the methods used in behavioural design, wherein tensions between design and scientific concerns (abductive, inductive and deductive reasoning) must be managed across the DT process [43]. Thus, regulation activities can be directed at the cognitive, motivational or behavioural aspects of collaboration [40,44], especially at the balancing of concerns (design and scientific) [45]. The inclusion of metacognition in DT might be critical for developing a comprehensive understanding of the strategic processing of design tasks, as argued by Ball and Christensen [46].
Knowledge-creation during DT requires students, first of all, to regulate their cognition (e.g., activating their prior knowledge, planning when and how to contribute to the DT team, evaluating their conceptual understanding or personal input to the DT group or team). Further, students are required to align their personal learning with the collective learning process [44]. Despite an emphasis on the collaboration and team work inherent to the social nature of DT, each DT learner or group member is expected to activate both individual-centred and interaction-centred metacognitive regulation strategies, aimed at optimizing personal and group understanding and progress [40,47], and to regulate peers’ cognition [48]. Moreover, DT requires students to engage in goal setting, both for self and group, to control the interpretations put forward as a group, as well as to collectively modify or reinforce the course of ongoing interaction [40,47]. Socially shared metacognitive regulation in students should reflect diversity within their shared regulative acts, while students must be aware of when and why variations in regulation can optimise collaborative learning [49]. During collaborative knowledge creation, students are involved in: setting group-learning objectives; questioning the adequateness of the problem-finding or problem-solving approach; evaluating the group’s solutions to assigned tasks; mutually reflecting upon alternate learning strategies to optimize future learning [40] through variations of metacognitive regulation such as affirmation, interfering, progression and interrogation [49] during DT implementation. When the socially shared metacognitive regulation of DT is considered, inter-individual differences can arise in students’ adoption of metacognitive regulation during DT. This might affect the achievement of DT learning outcomes [49]. Thus, in-depth investigations of inter-individual DT variety across its constructs and its impact on students’ learning outcomes are needed. This will allow the designing of more customized instruction for regulations and the prediction of adaptive regulative support during DT, which can, in turn, optimize the effectiveness of DT for both individuals and group members [50,51].
For studying differences among students while adopting an active learning strategy such as DT, a person-centred approach is preferred instead of a variable-centred approach [52,53]. A person-centred perspective allows one to investigate how individuals or subgroups of students combine DT in a particular way [54]. This enables the unravelling of naturally occurring profiles in students’ behaviour. It also aids the designing of customised educational practices, matching the variation in students’ learning needs and actual competences [40]. Whether similar design behaviour profiles can be revealed during the DT process remains unclear. Thus, further support is needed for the growing research on the effectiveness of metacognitive DT. Although being actively engaged in DT is assumed to advance the learning outcomes and knowledge transfer of the learners involved, empirical evidence in this respect is scarce and rarely acknowledges the potential heterogeneity within DT [12,25,28]. To better understand and justify DT profiles, a combined approach including a variable-centred approach can be used. Here, DT profiles can be used for better comprehension inter-individual differences in students’ interpersonal and evaluative skills, which are needed for the evaluation of ideas and concepts. Moreover, DT profiles can be also used as predictors in the use of technology, being controlled for age, gender and technology-enhanced learning in both face-to-face learning and distance learning environments. Thus, special attention needs to be devoted to whether DT profiles might predict the level of technology use, which might enhance higher order thinking skills needed for successful knowledge transfer both at higher and tacit taxonomic levels. Still, the effectiveness of technology as a facilitator of tacit knowledge-sharing remains unclear in both general and teacher education since the current literature suggests that technology both contributes and does not contribute to sharing [7].
1.2. Objectives and Research Questions
The present study aims at unravelling the profiles of prospective design and technology teachers based on their adoption of design cognition and DT during technology-intensive learning through online, distance and face-to-face modes. The identification of DT profiles is more specifically based on students’ activation of individual-oriented DT strategies and their engagement in self-directed learning that determines a use of technology for enhancing either low or high order thinking skills. In other words, both the focus of design cognition and the function of self-directed learning are taken into consideration. Moreover, the study aims at examining the relationship between the DT profiles and self-reported interpersonal skills alongside evaluation competency. Interpersonal skills supported by individual-centred theories, interaction-centred theories and relationship-centred theories aim to equip DT evaluators with sophisticated competence for monitoring, critical reasoning, reflective thinking and feedback seeking. This study also aims to explore how pre-service design, as well as technology teachers’ self-reported DT, interpersonal and evaluative skills controlled for gender, age and teaching/learning mode, reflect on the inclusion of technology (i.e., ICT and manufacturing technology) in their learning.
The objectives of this study allow lecturers and researchers to develop differentiated teaching/learning and supporting of DT during technology-intensive courses of design and technology subject matter, as well as to better comprehend individual differences in pre-service teachers’ behavioural self-regulation and design.
This study addresses the following research questions (RQs):
- RQ1: Are there some differences in the self-assessed ability for DT and the level of interpersonal and evaluative skills as perceived by students enrolled in different teaching/learning modes?
- RQ2: Which DT profiles can be discerned based on students’ adoption of design cognition and DT during technology-intensive learning through distance and face-to-face teaching/learning modes?
- RQ3: How are DT profiles related to students’ interpersonal and evaluative skills?
- RQ4: Which DT profiles, as well as interpersonal and evaluative skills in students might be predictors in decision-making for technology use to attain higher order thinking skills?
2. Materials and Methods
2.1. Research Design and Sample
This study used a quantitative research approach with a cross-sectional survey design [55]. The target sample was undergraduate students in teacher training and education majors at the Faculty of Education, University of Ljubljana, in the last three academic years since 2019–2020. Since DT as an approach to teaching and learning is generally implemented in teacher education programmes with design and technology subjects as a starting point, a sample of 620 participants was used. The sample size was subsequently calculated by strata, according to the teaching/learning modes (online distance learning and face-to-face learning). This sample size was checked against the values produced by the GPower 3.1 analysis program (Heinrich Heine Universität, Düsseldorf, Germany) [56]. A power analysis using GPower with the power (1-β) set at 0.95, α = 0.05 indicated that a total sample of 163 participants would be needed to detect moderate effect size (f2(V) = 0.0625) for the F-test, using the MANCOVA with two groups, three predictors and six response variables. The final sample, after discarding a number of invalid candidates, was a total of 307 pre-service design and technology teachers, with an average age of 20.73 years (SD = 2.12). This study excluded candidates who had not completed the entire questionnaire (n = 38) and those who had failed in the attention-check item (n = 24). The effective response rate was 49.5%, which is comparable with the average online response rate of 44.1%, as argued by Wu et al. [57]. The sample included more female (n = 274, 89.3%) than male participants (n = 33, 10.7%). The distribution of students among different teaching/learning modes was as follows: 156 (50.8%) students were engaged in technology-enhanced online distance education and 151 (49.2%) in technology-enhanced face-to-face education. This sample size is considered adequate and representative of the sample under study; it might also suffice for conducting cluster analysis, since Qiu and Joe [58] suggest a minimum sample size of 10 times the number of clustering variables. Using a sample size calculator (https://sample-size.net/means-effect-sizeclustered/ (accessed on 22 August 2022)), which shows the detectable effect size given the sample size and allows for clustered sampling, with the power set at 0.80, α = 0.05, and expectedly, three clusters of a size of 40 each, the total sample size, including cluster correction, stands at 240. The detectable effect size is 0.619.
The sample predominantly included more female than male participants, which is typical for samples enrolled in teacher education and research [59]
2.2. Design and Technology Education: Main Settings and Intervention
The design and technology subject matter is delivered to students through different study programmes: pre-school teacher education, primary teacher education and two-subject teacher education. Graduates of the aforementioned study programmes for teacher education gain: (1) The fundamental professional knowledge from the subject area; (2) Specialist didactic knowledge from the selected subject areas of education together with practical pedagogical training; (3) The fundamental professional knowledge from the areas of pedagogy, psychology, philosophy and sociology, which is important for a professional career in education [60]. Design and technology subjects aim to deliver basic knowledge about the contents of mechanical engineering, electrical engineering, didactics of design, technology and engineering and technical practicum. In technical practicum, students become acquainted theoretically and practically with the most important technological processes of material-processing, using measuring devices and instruments, hand tools, as well as various machines and devices that they will use for their work. Students also acquire suitable work experience and the skills necessary for independent work and teaching at schools. At the same time, they develop creativity and independence in individual and group work. Laboratory exercises are carried out in well-equipped workshops and dedicated laboratories.
Teaching/learning through distance education mode was organised as a synchronous and asynchronous intervention, via online and offline means, using different portals, such as MS Teams, Zoom, and a learning management system (Moodle). A lack of exposure to directly using processing and manufacturing technologies was substituted with additional e-learning material, demonstration videos, interactive tutorials, animations, online collaborative-learning environments in MS Teams, virtual laboratory work, etc. On the other hand, face-to-face technology-enhanced intervention was organised combining both ICT and on-site manufacturing technologies (e.g., paper processing, woodwork, metalwork, real-world measurement laboratory, 3D modelling, scanning and printing, prototyping, testing and verification).
In general, the workload for each subject and the time devoted to intervention in both the online and the offline mode were comparable. Additionally, students were enabled to work at their own pace on both modes, when needed. The delivery of design and technology subject matter was carried out by different teachers and teaching assistants throughout the academic year (30 weeks). The faculty belonged to corresponding sub-fields or majors of technology and engineering. They also possessed various ICT skills and digital literacy levels along with years of varied teaching experience. Students from both groups were given lectures by the same lecturers.
2.3. Measures
2.3.1. Basic Attributes
Basic attributes included age, sex and the mode of teaching/learning (online, distance or face-to-face). Students typifying the online distance learning group were randomly select from the study programmes conducted during and after the COVID-19 lockdown. Students who typified the face-to-face learning group were selected from the study programs conducted after the lockdown, but they already had some experience of online distance learning in the year before. Before the COVID-19 lockdown, all these students had also experienced blended learning across different subjects at varied levels, scopes and intensities.
2.3.2. DT
The DT was measured using a mindset developed by Dosi et al. [61]. The original questionnaire has a 5-point Likert scale, while this study used a 6-point Likert scale. This scale was chosen because the actual purpose of the instrument was to track the development of metacognitive awareness either for self-assessment or for research. Since the original questionnaire has 22 constructs with 71 items, using a 6-point Likert scale is expected to lead to lesser constructs and items but a higher discrimination value and reliability. Its variance is comparable to that of a 5-point Likert scale, as argued by [62].
In order to discover the new factor structure of a measure and to decide the number of factors with their internal reliability, exploratory factor analysis (EFA) was used. Kaiser-Meyer-Olkin (KMO) measure of the sampling adequacy of the DT questionnaire was 0.94, while Bartlett’s test of sphericity was significant (p = 0.00 < 0.05). Communalities of all items were greater than 0.5, whereas the EFA revealed a 14-factor solution, wherein items accounted for 69.5% of the total variance above the threshold of 0.5 suggested by Hair et al. [63] and Pituch and Stevens [64]. In this study, there was theoretical justification for believing that the factors measuring the DT of pre-service design and technology teachers would correlate with each other. An Oblimin oblique rotation was performed on the principal components of the exploratory factor analysis, as suggested by Field [65], which resulted in a pattern matrix with item loadings. All items with factor loadings less than 0.5 were excluded from the measurement model, as suggested by [65] and Haier et al. [66]. As a result, a pattern matrix of the 47 items distributed across 14 latent factors was generated. To verify whether the factors were distinct and uncorrelated, a factor correlation matrix was generated, wherein correlation did not exceed 0.7 (0.38). This depicts high discriminant validity of factors [64]. A new DT mindset consists of 14 factors with 47 items in total, which are labelled as follows (Table 1):

Table 1.
New DT mindset structure.
2.3.3. Interpersonal and Evaluative Skills
Professional education and practise are based on the competencies of professionals, so theoretical knowledge is necessary, but a practical component is also necessary to both teach practical skills and integrate students into the profession [67]. Teaching in DT is similar to that in nursing, which is one of the many professions devoting a large amount of training to practicing interpersonal communication. Thus, the frequently used Williamson’s questionnaire [68] seemed to be suitable for self-assessment of interpersonal skills through its subscale of 12 items. Williamson’s original response scale was a 5-point Likert scale, ranging from 5 (always) to 1 (never). To map some of the crucial theories underlining the interpersonal relationships framed in the items and to determine the styles of feeling, thought and behaviour in the relationships of individuals with others [69], an EFA was conducted. The EFA revealed two latent factors, with three items in each factor supporting individual-centred theories (e.g., goals-plans-action, uncertainty and action assembly) and interaction-centred theories (e.g., communication accommodation and facework), respectively.
Similarly, to establish the latent factors for interpersonal skills, constructs for evaluative skills were formed as well. An evaluation subscale from Williamson’s questionnaire [68] was used as the basis. Considering the importance of the ability of monitoring, critical thinking and reflection in self-regulated learning, as suggested by Kavousi et al. [28], and developing interpersonal competencies for DT evaluators, three latent factors were established with a total of 10 items. Table 2 depicts this.
Table 2.
Interpersonal and evaluative skills constructs’ structure along with construct of perceived technology used.
2.3.4. Technology Use
Students’ perception about the use of technologies across design and technology subjects was self-assessed by the scale, which comprises three items, and is to be answered on a five-point Likert scale (1, never; 5, always). This variable aims at evaluating whether pre-service design and technology teachers have used technologies (e.g., ICT and manufacturing) for enhancing lower or higher order thinking skills. An item example can be seen in Table 2.
2.4. Procedure and Data Analysis
Students were informed about the study in lectures by the principal investigator, and a questionnaire was sent as a link to their email addresses. Students were given access to the survey through 1KA’s portal at https://1ka.arnes.si (accessed on 27 August 2022), which fully complies with the new personal data protection regulation (GDPR). Students participated in the study during face-to-face or online distance learning sessions at the end of the semester in January 2021 and 2022, and in June 2020, 2021 and 2022, during a study day. The questionnaire took 10–15 min to complete.
The data were analysed using SPSS Statistics, a software package commonly used for statistical analysis in the social sciences. To estimate ordinal reliability for Likert-type and ordinal-item responses, data were collected using a single-administration McDonald’s omega (ω) coefficient, as proposed by Komperda et al. [70] and Hayes and Coutts [71].
McDonald’s omega was calculated using Hayes’ Omega macro for SPSS downloaded from www.afhayes.com (accessed on 12 September 2022). Furthermore, McDonald’s omega can be used multi-dimensionally too [71].
For verifying the discriminant validity of questionnaire constructs, tests were carried out, wherein a Fornell and Larcker criterion [72] was used together with a Heterotrait-monotrait (HTMT) criterion, as proposed by Henseler et al. [73]. Three hundred and seven (307) data sets were available for the data analysis, and no missing data were found. Assessment of convergent and discriminant validity was conducted using the ADANCO 2.3 software (https://www.composite-modeling.com/ (accessed on 14 September 2022)).
A descriptive analysis of the data was carried out to describe and summarise the characteristics of a sample, expressed by mean and standard deviations. Pre-analysis investigations were conducted to check the normal distribution of data, homogeneity of variance and homogeneity of regression. No assumption was violated.
In order to identify DT profiles, a two-step clustering method was applied. First, hierarchical cluster analysis was run using Ward’s method with squared Euclidian distance [74]. The frequency of students’ self-perceived self-directed learning was included as a cluster variable. As the scale measurements of the latter was comparable, data were not standardised. Second, k-means cluster analysis was performed to verify the clustering [74]. Based on the results of the cluster analyses, the cluster membership for each participant was used as a starting point for examining differences among the DT profiles in more detail. Finally, cross-tabulation with adjusted residuals was used to quantitively analyse categorical data of the relationship between the number of cluster cases and the teaching/learning mode.
To examine whether DT constructs differ across the groups involved in the study, a MANCOVA was conducted. As measure of effect size, eta squared (η2) was used with the following interpretation: size from 0.01 to 0.05 = a small effect, 0.06 to 0.14 = medium effect, and 0.14 and more = large effect [75]. MANCOVA was also used to examine whether DT profiles were related to individual learner characteristics (self-reported interpersonal and evaluative skills). Multinomial logistic regressions were run to examine the relationships among DT profiles, interpersonal and evaluative skills and a use of technology controlled for gender, age and subject group.
2.5. Ethical Consideration
This study was conducted according to the code of ethics for researchers at the University of Ljubljana [76] and approved by the Head of the Department of Physics and Technology at the Faculty of Education, University of Ljubljana. Students were provided with all necessary information by the study director, and a detailed introduction of the study and its purpose was also provided on the survey cover sheet before they gave consent for the collection of personal information, e.g., gender, age, and type of enrolment, and then proceeded with the survey.
3. Results
Before reporting the results and interpretation, an assessment of the outer model (measurement model) was carried out to confirm the loadings, provide evidence of reliability and establish the validity of latent factors.
3.1. Validity and Relability Analysis
3.1.1. Common Method Bias
The validity checks were performed to ascertain whether this study followed a common bias-free method. Because this study used the same response method to measure independent and dependent variables in one survey, bias may occur [77]. This study employed two approaches: Harman’s single factor test and variance inflation factor (VIF). Harman’s single factor test was performed to determine whether a single variable appears for the greater part of the covariance between the measures, using principal axis factoring with a single factor to extract [78]. The result indicated that a single factor solution accounted for less than 50% (42.32%). This shows that the dataset was not contaminated by common method bias [78]. The VIF was further used, based on the approach proposed by Kock [79], to assess and confirm the common method bias. The full collinearity factor was used in this study. When the VIF of each latent factor is greater than 3.3, the latent factor is considered to have pathological collinearity, which shows that the model is affected by bias [32]. In this study, all latent factors had a VIF value of less than 3.3 (2.44 and less).
3.1.2. Convergent and Discriminant Validity
The convergent validity of the constructs in this study verified the following: (1) Whether the average variance extracted (AVE) values were greater than 0.5 [72]; (2) Whether the factor loadings (λ) of all the items were significant and greater than 0.5 [63]. The results from the analysis showed that the AVE values ranged from 0.51 to 0.60. Moreover, in determining the composite reliability (CR) of the constructs where the suggested threshold value is =0.7 [63], the CR values ranged from 0.72 to 0.85 (Table 3). This means that the constructs used in this study meet the thresholds of convergent validity [80].
Table 3.
Reliability McDonald’s ω, composite reliability (CR), the square root of the average variance extracted (AVE) (in bold) and correlations among DT constructs (off-diagonal).
Discriminant validity is used to determine the extent to which constructs differ empirically from other constructs [73]. In this study, discriminant validity was evaluated using two criteria: the Fornell and Larcker criterion [72] and the HeteroTraitMonoTrait (HTMT) criterion [73]. Fornell and Larcker [72] opine that discriminant validity is achieved when the square root of the AVE is higher than the AVE shared correlation on a particular latent factor. The square root of the AVE should be above 0.5 and higher than the inter-correlation of latent factors in the model [81]. Table 3 shows the validity measurement based on the Fornell and Larcker criterion. By comparing the square root of each AVE in the diagonal with the correlation coefficients (off-diagonal) for each construct in the relevant rows and columns, the criteria have been met successfully across all constructs.
The HTMT2 criterion was used as the second criterion to evaluate discriminant validity. Table 4 shows results from analyses carried out using the ADANCO software. The HTMT2 is compared to 0.85 to judge whether discriminant validity is violated [73], while a threshold value for more liberal assessments is 0.90 [82,83]. Since the HTMT2 is based only on the indicator’s correlations, it provides less biased estimations of the correlations among the latent variables compared to the HTMT, as argued by Roemer et al. [82].
Table 4.
HTMT2 results.
Table 4 reflects the establishment of discriminant validity based on the HTMT2 criterion. To conclude, according to all standards used in this study, all DT constructs meet discriminant validity indicators.
The same procedure was repeated for the validity assessment of constructs of interpersonal and evaluative skills and perceived use of technology. Discriminant validity based on the Fornel–Larcker criterion is shown in Table 5.
Table 5.
Reliability McDonald’s ω, composite reliability (CR), the square root of the average variance extracted (AVE) (in bold) and correlations among interpersonal skills (IPS), evaluative skills (EV) and technology use (TECH) constructs (off-diagonal).
Table 6 reflects the establishment of discriminant validity of constructs representing self-perceived interpersonal skills, evaluative skills and technology-use based on the HTMT2 criterion. After HTMT analysis was employed, all the values were seen to be less than the threshold value of 0.85 [84]. Therefore, HTMT results support discriminant validity.
Table 6.
Heterotrait–Monotrait ratio of correlations (HTMT2) results.
Overall, discriminant validity can be accepted for this measurement model. The model also supports the discriminant validity among the constructs. This means that the respondents were able to comprehend and distinguish various constructs in this study.
3.2. Descriptive Analysis
Descriptive statistics include the self-reported ability for DT and the self-assessment of the level of interpersonal and evaluative skills, together with the perceived use of technology. As suggested by Pituch and Stevens [64], all scales demonstrated sufficient internal consistency for basic research via the McDonald’s omega scores above 0.70 (Table 3 and Table 5).
3.2.1. Perceived Ability for DT
Students’ DT ability was assessed on a six-point Likert scale against 14 subscales of the validated questionnaire. Means, standard deviations and differences in the sub-scales across the teaching/learning modes can be found in Table 7. The skewness and kurtosis values of the research constructs indicated that the data sets are normally distributed since no value exceeds 1 (skewness) or 2 (kurtosis), as per the cut-off values proposed by Tabachnik and Fidel [85].
Table 7.
Pre-service design and technology teachers’ self-reported average scores expressed with mean (M) and standard deviation (SD), across the subscales of DT and teaching/learning modes, along with a measure of skewness (S) and kurtosis (K) (n = 307). The significance and effect size of mean differences among the groups are also visualised as a heat map (green-no effect, yellow-small effect, orange-medium effect, and red-large effect).
The Shapiro–Wilk test for normality did not reveal a violation of normality assumption across the teaching/learning modes (p > 0.05), suggesting the use of parametric tests. To identify differences among groups of students regarding their ability for DT across its constructs, a MANCOVA test was used. This type of teaching/learning mode was used as an independent variable, while age, gender, interpersonal skills, and evaluative ability level were used as control variables. The main effects of modes of teaching/learning were compared with Bonferroni corrections for confidence interval adjustment.
First, we tested the homogeneity of the variance–covariance matrices using Box’s M test, which is very sensitive to large data sets and can detect even small deviations from homogeneity. In our case, the sample size can be considered equal so that a robustness of the significance tests can be expected [85]. Thus, a significant level of p = 0.001 was used as proposed by Tabachnik and Fidel [85]. Test of equality of covariances matrices is statistically non-significant (p = 0.017). Wilks’ lambda criterion was used to assess the multivariate significance of the interaction effects. The interaction effect of independent variable and covariates is also not significant in the study (Wilks’ lambda = 0.94, F (28, 284) = 0.94, p = 0.93).
Second, a full factorial MANCOVA was conducted to determine the effect of teaching/learning mode on the self-rated DT ability. Box’s M test was not statistically significant (p > 0.001), while multivariate tests showed significant effects of the teaching/learning mode on interpersonal and evaluative skills (Wilks’ lambda = 0.77, F (14, 285) = 5.85, p < 0.001, partial η2 = 0.23).
Third, Levene’s test for equality of variances revealed that the variances of the DT constructs as dependent variables were equal in both samples (p > 0.05).
Finally, significant differences in DT ability were found between the teaching/learning mode groups, controlled with covariates (Table 7).
Analysis of covariance revealed that age and gender as covariates have no significant predictive value for DT ability (p > 0.05), whereas the level of interpersonal and evaluative skills may have an explanatory value for DT ability. The construct IPS 1 can significantly (p < 0.05) explain some variances in DT1, DT6-10, and DT13, while IPS 2 has a significant (p < 0.05) predictive value in DT2-5, DT7, DT9, DT12, and DT14. When comparing within-person ability and evaluative ability as covariates in the study, the latter has lower predictive power for DT ability. The construct EV1 can significantly explain some of the variability in DT2, DT3, DT5, DT6, and DT14, while EV2 has predictive value in DT7, DT12, and DT13 (p < 0.05). The ability to reflect and seek feedback can significantly (p < 0.05) explain variability in DT1 (active experimentation), DT8 (desire to change something), and DT11 (problem reframing). RQ1 revealed the differences in self-reported DT among students, who were taught design and technology through different modes.
3.2.2. Perceived Interpersonal and Evaluative Skills and the Level of Technology Use
Students’ individual- and interaction-centred interpersonal skills were self-assessed together with their ability for monitoring, critical and reflective thinking and perceived use of technology, on a five-point Likert scale, against six subscales of the validated questionnaire. Means, standard deviations and differences in the subscales across the teaching/learning modes can be found in Table 8. The skewness and kurtosis values of the research constructs indicated that the data sets were normally distributed since no value exceeded 1 (skewness) or 2 (kurtosis), as per cut-off values proposed by Tabachnik and Fidel [85].
Table 8.
Pre-service design and technology teachers’ self-reported average scores, expressed using mean (M) and standard deviation (SD), along with a measure of skewness (S) and kurtosis (K) (n = 307). The significance and effect size of mean differences among the groups are also visualised as a heat map (green-no effect, yellow-small effect, and orange-medium effect).
To find differences between students in different teaching/learning modes, MAN-COVA was used, controlling for age, gender, and DT ability. Based on the results of the previous section that the level of interpersonal and evaluative skills has explanatory power for the DT constructs that make up the DT ability, an average score of the DT constructs was calculated as the general DT ability covariate in the study.
Interaction effects between independent variable and covariables were not significant (Wilks’ lambda = 0.95, F (12, 590) = 1.88, p = 0.36). Thus, we have a matter of assumption of homogeneity of regression slopes. Further, full factorial design was used where a significant relationship of general DT ability as covariate was confirmed (p < 0.001, partial η2 = 0.43) and a significant difference in the teaching/learning mode (p < 0.001, partial η2 = 0.13).
RQ1 also revealed the differences in self-reported interpersonal and evaluative skills and technology use among students, who were taught design and technology through different modes.
3.3. DT Profiles during Technology-Intensive Education
Before cluster analysis was conducted, it was assumed that the sample was representative of the population and variables were not correlated. Thus, outlier cases were detected using the Mahalanobis distance. As the probability associated with the Mahalanobis distance in all subjects was greater than 0.001, no records of multivariate outliers were detected [86]. Thus, all 307 responses were subjected to further analysis.
For answering RQ2, a two-step clustering method was applied. In the first step, hierarchical cluster analysis was conducted based on the frequency scores of students’ engagement in DT. An initial run of two to seven clusters was analysed, given that there were no literature-based expectations regarding the number of clusters [87]. The inspection of the dendrogram indicated a two- to four-cluster solution, whereas the analysis of changes in agglomeration coefficients pointed to a three-cluster solution. Based on the mean scores for students’ DT behaviour for each cluster, a total of three DT profiles were discerned (see Table 9).
Table 9.
Mean scores (standard deviation) of the DT profiles on the cluster variables.
The first cluster represents a large group of the students (n = 131, 42.67%). Students in the first cluster generally have a higher ability for DT in comparison to their counterparts. In the first cluster, students’ DT behaviour is characterised by a larger involvement in DT through collaboration, use of experiential intelligence in action-oriented tasks, as well as a stronger desire to learn, including learning about others, challenging existing frameworks and seeking new contexts. In the second cluster (n = 131; 42.67%), students’ DT behaviour is characterised by a larger involvement in openness to different perspectives, which changes the direction of collaborative learning. With regard to learning orientation, this may activate a new direction for ongoing interaction in active learning. Third cluster students (n = 45, 14.66%) have especially low tolerance for uncertainty and risk propensity (Figure 1).
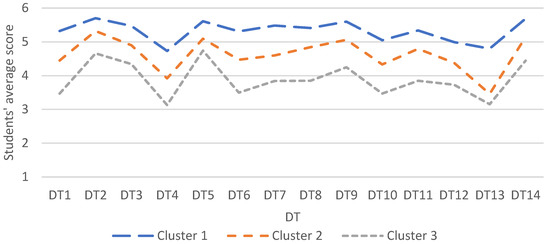
Figure 1.
Three-cluster solution of DT presenting mean values so as to ease interpretation of clusters with respect to average sample scores per dimension.
In the second step, k-means cluster analysis was performed, aimed at validating the cluster solution unravelled during hierarchical cluster analysis. Table 9 reveals that the final three-cluster solution was confirmed. A total of 45.60% of students could be profiled as high DT, 38.44% as medium DT and 15.96% as low DT.
Further, we analyse how the DT profile-clusters are composed according to the type of teaching/learning modes. The analysis of the data was carried out through crosstabs and chi-square, wherein p values of <0.05 were considered statistically significant. To find out the strength of the relationship among nominal variables, a Cramer’s V statistical strength test of correlation was used. Therefore, the larger the value of Cramer’s V, the stronger the correlation among the variables was. When the chi-square tests were initially statistically significant, subsequent analyses used adjusted standardized residual values [88,89] in order to examine the contribution of each cell in the cross tabulation to the chi-square value. To adjust for multiple non-independent testing, we adopted a conservative criterion of adjusted standardised residual values ≥ ±3, as suggested by Landis et al. [90].
An examination of DT profiles on the teaching/learning modes indicated a different cluster membership distribution. Crosstab analysis indicated that there was a significant correlation between the cluster membership and type enrolment (chi-square = 20.67, p = 0.000, Cramer’s V = 0.28). Students’ distribution according to DT profile (cluster) and teaching/learning modes are shown in Figure 2.
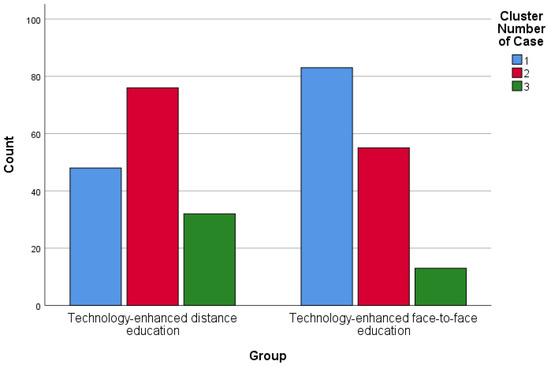
Figure 2.
Pre-service design and technology teacher cluster membership, according to the teaching/learning modes of enrolment in the course.
A crosstab between the types of students’ enrolment in the course versus their membership in the cluster showed that students who scored higher were involved in the course as full-time students (adjusted standardised residual was 3.0). On the other hand, pre-service teachers with a lower ability for DT were more related with distance education in Cluster 3 (adjusted standardised residual was 3.0). Highly capable design thinkers were generally found in the face-to-face mode, supported by different technologies, and typified in Cluster 1 (adjusted residual was 4.3) (Table 10).
Table 10.
Crosstabs relation between types of teaching/learning modes and DT profiles.
Next, using a two-step cluster analysis on three clusters, we identified variables or subscales of DT. These subscales dominated the predictor importance or had the most impact upon determining clusters. Figure 3 depicts the predictor importance of DT variables.
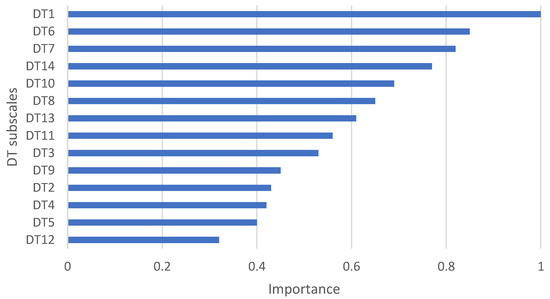
Figure 3.
Predictor importance of DT variables in generating clusters.
As shown in Figure 3, active experimentation and critical questioning (DT1) appears to have the highest predictor importance across the clustering cases (predictor importance = 1), followed by creative confidence (DT6) (predictor importance = 0.85), whereas team learning and knowledge transfer (DT12) were the least important variables (predictor importance = 0.32).
3.4. The Influence of DT Profiles on Students’ Level of Interpersonal and Evaluative Skills
To assess the impact of DT profiles on students’ levels of interpersonal and evaluative skills, a MANCOVA was conducted with learning mode, student age, gender, and perceived level of technology used as control variables.
First, the homogeneity of the variance–covariance matrices was tested using Box’s M test, which is very sensitive to large data sets and can detect even small deviations from homogeneity. The test for equality of the covariance matrices is not statistically significant (p = 0.07). To evaluate the multivariate significance of the interaction effects, a Wilks’ lambda criterion was used. The interaction effect of independent variable and covariates in the study is also non-significant (Wilks’ lambda = 0.96, F (10, 809) = 0.76, p = 0.73).
Second, a full factorial MANCOVA was conducted to determine the effects of the DT profiles on interpersonal and evaluative skills. The box test was not statistically significant (p > 0.001), while the multivariate tests showed significant effects of the DT profiles on interpersonal and evaluative skills (Wilks’ lambda = 0.71, F (10, 592) = 10.89, p < 0.001, partial η2 = 0.16). Similarly, significant differences were found in the covariate of perceived level of technology use, which could influence the level of interpersonal and evaluative skills (Wilks’ lambda = 0.83, F (5, 296) = 11.47, p < 0.001, partial η2 = 0.17). Partial η2 is reported to MANCOVA analysis and denotes the effect size of significant differences among DT profiles, with partial η2 = 0.01 as small, η2 = 0.09 as medium, and η2 = 0.25 as large effect, as suggested by Cohen et al. [75]. Covariates of age and learning mode appear as statistical non-significant (p > 0.05).
The Leven test used in the study tested the homogeneity assumption and indicated that the group variances in the sample were the same for all dependent variables calculated in the study in relation to the level of interpersonal and evaluative skills (p > 0.05).
Regarding students’ interpersonal skills, the findings revealed significant differences between both individual-centred (F (2, 306) = 36.56; p < 0.001) and interaction-centred (F (2306) = 12.78; p < 0.001) approaches, whereas the effect of DT profile is medium for both individual-centred (IPS1) (partial η2 = 0.20) and interaction-centred (IPS2) (partial η2 = 0.13).
Post hoc comparison by means of the Bonferroni correction demonstrated significantly higher levels of IPS 1 and 2 among students typified as high DT-able students. Here, the majority represents students from a technology-enhanced face-to-face learning mode.
Further, the DT profiles differed significantly from each other regarding evaluation ability for monitoring (F (2306) = 19.34; p < 0.001), critical thinking and motivation (F (2306) = 25.89; p < 0.001) and reflection and feedback seeking (F (2306) = 22.55; p < 0.001). The effect of DT profile is medium, expressed with partial η2 (0.15, 0.13, 0.14, respectively).
Post hoc comparison by means of the Bonferroni correction demonstrated significantly higher levels of evaluation ability among students typified as high DT-able cluster. Here, the majority of students belong to technology-enhanced face-to-face learning mode.
The covariate of the perceived level of technology use in the learning mode significantly affects IPS1 (F (1306) = 11.61; p < 0.001) and IPS 2 (F (1306) = 11.47; p < 0.001) with medium effect size expressed as partial η2 (0.11,0.12, respectively). Regarding evaluative skills, only monitoring ability could be predicted by technology use in terms of evaluative ability (F (1306) = 3.97; p = 0.001; partial η2 = 0.04).
3.5. Predicting Advanced Technology Use Based on Gender, Age, Group, Interpersonal Skills, Evaluative Skills and DT Profiles
First, a median split of technology use was performed to divide participants into ‘higher’ and ‘lower’ technology-use groups. To facilitate a regression analysis, dummy variables were created for pre-service teachers’ DT profiles, wherein the medium-able DT group was the reference group.
To find predictors in high technology use amongst the students, a hierarchical multinomial regression was conducted stepwise (Table 11). As a reference, a low technology- use variable was used.
Table 11.
Hierarchical multinomial regression predicting high-level technology use based on sex, age, subject, interpersonal and evaluative skills and 3-cluster model of DT profiles. Beta value (β) is regression coefficient, while SE is standard error.
Based on the results, as depicted in Table 11, self-reported DT measures alone suffice for determining differences in pre-service teachers’ use of technology. However, in combination with interpersonal skills, these measures do not suffice for the prediction of the use of technology. If evaluative skills are considered, high-able DT students could make decisions for the use of technology at higher thinking levels. On the other hand, in case of low-able design thinkers, technology use is not decisive, whether they use it at a low or high level.
Social interactions during DT as a goal-driven process, together with the ability to cope with uncertainty in problematic situations, might be predictors for advanced use of technology.
Evaluative skills appear as not significant (p > 0.05) in the prediction of technology-use in the combined model. Considering only the evaluative skills and control variables in the model, only the ability for monitoring and observation (EV1) has significant predictive power for advanced technology use (β = 0.59, p = 0.012).
4. Discussion
Articulating relationships within designing and DT through the business ecosystems of touch points is very challenging for learners, who tend to focus on separate components or simply follow algorithms when learning. Products or services, as outcomes of DT, are increasingly reliant on a myriad of tangible and intangible interdependencies. The present study explores the possibility of DT as a means for technology-enhanced sustainable knowledge transfer improvement.
4.1. DT and Interpersonal and Evaluative Skills in Prospective Teachers
RQ1 investigates differences in ability for DT, as well as levels of interpersonal and evaluative skills as reported by prospective design and technology teachers teaching through different technology-enhanced modes. In a large majority of DT constructs, students in face-to-face learning reported greater levels of DT, wherein effect size was estimated as strong at DT4 (Tolerance for and being comfortable with uncertainty). A moderate effect size of differences was found at DT5 (Experiential intelligence and transformation ability) and DT13 (Embracing risk). This finding shows that intentionally designed trans-disciplinary and collaborative learning environments where students in a student-centred process have the opportunity to develop both soft and hard skills, might have a positive effect on the designerly way of thinking and doing (encouraging tacit experiences), behavioural change, reducing cognitive bias and transformative learning. This confirms the findings of Panke [23]. On the other hand, manipulating materials, tools and different technologies might help students at risk propensity. This confirms the findings of Sharples et al. [34]. Further, it might improve the absorptive capacity for knowledge transfer and learning outcome achievement at higher taxonomic levels, as argued by Peng et al. [21].
Similarly, students in the face-to-face mode reported higher levels of both interpersonal and evaluative skills across all constructs. Small effects were found at IPS2 (Interaction-centred theory), which points to better accommodation of communication theory in students’ work or tasks, wherein many interactions were enabled, not only virtually, but also physically. It might be that students in face-to-face modes generally accommodate others and consider others’ conversational needs, as well as the power or role relations of the individuals in the interaction. This confirms the findings of Bylund et al. [47]. A weak effect was also found at IPS1 (individually centred theory), which reveals that students in face-to-face modes are better at planning their learning goals, cope better with uncertainties in design tasks, and more easily activate procedural records during interactions, as argued by Bylund et al. [47]. Moreover, exposing students to daily practise in laboratories, classrooms or workshops might be helpful for a reconceptualization of design practice as a process of imposing limitations. This confirms the findings of Dorland [24].
Surprisingly, the level of evaluative skills for monitoring and critical thinking and motivation were comparable in both modes; only a weak effect was found at EV3 (Reflection and feedback seeking) in favour of the face-to-face mode. It might be that the real-world environment with all its interactions helps students to sustain an interest in assignments and regulate behavioural aspects of collaboration in design tasks [40,44].
4.2. DT Profiles in Pre-Service Design and Technology Teachers
Almost half of the participants were typified as high-able design thinkers. They displayed openness to different perspectives, transformative ability, mastery over learning and goal-orientation in interaction-centred DT. Additionally, they reinforced peer-thinking during collaborative design tasks. The next DT profile, which was discerned as medium-able design thinkers, had a significant deficit in tolerance for and being comfortable with uncertainty and in embracing risk. The last set of design thinkers remained rather inactive during DT, especially in experimentation and critical questioning, coping with uncertainty and risk taking. In case they activated metacognitive strategies to scaffold DT, they could succeed at transformative learning and mastery over goal-orientation, which confirms the findings of Kavousi et al. [28]. They perform poorly in creative confidence and abductive thinking, which are needed to develop conceptual variants. Additionally, here, some amount of risk should be encountered as part of individual-oriented learning. This also points to the use of ICT in distance-education settings at low taxonomic levels. On the other hand, ICT use at higher taxonomic levels has a positive influence on creative design outcomes, especially on functional integrity, technical requirements, sophistication and aesthetics, as well as originality and novelty, as argued by Chang et al. [91]. Moreover, the last set of students might fail at behavioural design, since their ability to synthesise aspects of abductive, inductive and deductive reasoning might not be enough to frame, develop and deliver behavioural change through target interventions [43].
Further, crosstabs analysis revealed that high-able design thinkers were in face-to-face mode, whereas low-able design thinker usually belonged to the distance education mode. The variables with the most influence over cluster formation included active experimentation and critical questioning, creative confidence and optimism to have an impact. Surprisingly, the predictors with the lowest importance in cluster generation included team learning and knowledge transfer. This may happen when teams are created by students themselves, who would rather develop and transfer general problem-solving skills. However, to attain greater significance, teams should be created and act as diverse mental models and experience different tasks’ variations. This will enrich the divergence influence of team learning, as argued by Toader and Kessler [92]. The low value attached to team work also points to the lack of fluctuating epistemic uncertainty in a design team, which is a key driver for the creative process, as argued by Christensen and Ball [93]. It might be that variables with low importance can be neglected when predicting the DT treatment response.
4.3. DT Profiles in Relation to Prospective Design and Technology Teachers’ Interpersonal and Evaluative Skills
The results of how the DT profiles are related to students’ interpersonal and evaluative skill levels confirm previous findings on metacognitive DT [15,25,28,46,93] since a metacognitive perspective of design cognition is critical for developing a comprehensive understanding of strategic processing in design. Large differences among DT profiles were found in individual-centred responses towards planning, activating and creating effective goals, as well as processing, appraising and coping with incoming information and uncertainty. DT profiles also differed significantly in the contents, forms and functions of messages and in the behavioural interaction patterns among peers. However, their effect is estimated as medium. Various models of hands-on learning, such as DT, can help students develop evaluation competencies, including interpersonal skills. They might also simulate actual evaluation circumstances [41]. DT profiles also differ significantly from each other, across all three constructs of evaluative skills: monitoring, motivation and reflection with feedback seeking, wherein the effect of the DT profile is medium. High-able design thinkers who generally come from face-to-face modes, when they interact with each other and the educator, might develop insights into the dynamics of evaluations. Using several loops or iterations in metacognitive DT as a process, learners might experience evaluation circumstances. Here, DT serves as a framework for reflection [24,41]. Real-world settings with hands-on strategies deeply engage learners in DT. Here, collaboration and decision-making regarding evaluation give students valuable experiences. They also help sharpen evaluation skills via internships in schools or other training institutions, problem-based learning activities, collaborative learning, customer-based projects and purposefully designed interventions or behavioural designs to address both behavioural and societal change [41,43].
4.4. Predictors in Decision-Making for Use of Technology to Enhance Higher Order Thinking during Design and Technology Courses
Based on the results of multinomial regression applied to the sample of pre-service teachers, several predictors of the use of technology to enhance higher order thinking skills during the DT process were found. It seems that regulation strategies in the face-to-face mode enable students’ reflection in and on action. Hence, they perceive the use of technology as being meaningful for real-world creative interventions and deeply engaging in decision-making and critical thinking. Real-world settings in the face-to-face mode might help to broaden views of pre-service teachers towards: preparedness, perception and affect toward certain technology systems, influencing student acquisition of design and technology knowledge; process skills; teaching innovations; and willingness to use technology in their classroom. This is supported by Xie et al. [94]. Moreover, students typified as high-able DT perceived the use of technology at a higher level since they could be affected by immersion and interactivity in terms of enhancing the positive learning affect. On the other hand, low-able DT students’ perception of technology use, expectedly, does not enhance higher order thinking skills nor does it decrease such skills. This points to the use of technology during design and technology courses for remedying low thinking skills and weakening negative affective experiences. It might be that prior and immersive experience of technology use may influence affective empathy, as argued by Xie et al. [94]. The use of technology for 3D modelling, simulations, animations, virtual reality materials, technical drawing and drafting might influence the creative design process, especially the design and planning, testing and modification, as well as thinking and sharing stages. This is supported by Chang et al. [91].
Moreover, it seems that, decisions about how technology will be used also depend on activation of procedural records. These are dictated by how frequently they were activated in the past and how relevant they are to the current situation, as argued by Green [95]. A similar situation appears at IPS2, where according to interaction-centred theories, learners might adjust their behaviours to accommodate each other. Different technologies might be useful for this. It seems that in design studios or design courses, instructors form secure attachments with their students to facilitate the ground for them to interact, cooperate, progress and success, as argued by Ding [42], especially when students manipulate different materials and technologies. Interaction-oriented design tasks may further enhance socialization using different technologies (e.g., ICT to facilitate dialogue, reflection and create immersive experiences) and may facilitate the understanding and internalization of tacit knowledge by pre-service teachers. This confirms the findings of Castaneda and Toulson [7].
With regard to the control variables, no significant differences according to sex or age were found. This result is not surprising and confirms the findings of Schmid et al. [96].
4.5. Limitations of the Study and Future Research
This study investigates perceptions of and experiences with DT across the design and technology discipline. Several innovative insights have been delivered in the present study, but it is not free from limitations. The cluster analysis in this study is based on frequency measures of prospective teachers’ overt DT use, while it can be assumed that not all DT behaviour (e.g., general strategies and methods and practise routines) has been made explicit by students [24,43,45,93]. Future research should rather focus on mixed-methods for assessing students’ DT (e.g., learning analytics, ability test, eye-tracking, students’ preparations for internship and observations in work), applied on bigger samples to replicate cluster analysis and further validate current solutions. Moreover, since developing interpersonal and evaluative skills in online or distance settings might be delayed in operation, and face-to-face settings invite students more easily to deeply operate on each other’s thinking [40], alternate regulation profiles might be unravelled during face-to-face technology-enhanced collaborative learning.
The next limitation can be seen in conceptualisation of DT profiles. By merely focusing on the frequency of occurrence, potential differences in the depth of adopted individual-oriented metacognitive strategies for DT are neglected [40]. Thus, for future study, both individually oriented and socially shared metacognition for peer learning in design should be considered. This may result in more accurate DT profiles.
Further, more research is required on the academic success of prospective teachers based on their DT profiles. Moreover, both cognitive and non-cognitive skills might have impacts on the transfer of knowledge in DT, but a majority of them were not considered in the current study. Alternate measures of students’ performance or more comprehensive learning outcomes about future studies might, consequently, yield other findings about the academic success of learners with a particular DT profile, as argued by [40].
5. Conclusions and Implications of the Current Findings
DT is an important area of research and practice, key to addressing behavioural and societal challenges. Still, several questions remain as to how DT approaches/methods are selected, adapted and used during the design for sustainable improvement of knowledge transfer. To take a step toward answering these questions, an extensive and methodologically complex study was performed on the sample of pre-service teachers. Pre-service teachers with their preparedness, perception and affect toward certain technology systems appear as a key factor in knowledge transfer for improving students learning outcomes (knowledge, skills and attitudes), teaching innovation, and willingness to use technology in their classroom or laboratory. Based on complex analysis, I offer three main contributions. First, by identifying DT profiles based on self-reported measures of students’ perceptions of and experiences with technology-enhanced teaching/learning, acknowledging the multifaceted character of DT based on its domain and functions, the study extends the literature on the heterogeneity of DT and its differential effectiveness on pre-service teachers’ level of DT cognitive and non-cognitive skills. Its findings particularly imply a call for differentiated support of (shared) metacognitive regulation during behavioural DT for societal change, which meets the needs of collaborative learners’ DT profile.
Second, the fact that the DT profiles demonstrate significantly different correlations with both pre-service teachers’ interpersonal and evaluative skills is also interesting since these learner characteristics are not fixed but can change depending on students’ expertise and learning experiences. This implies that teachers should design behavioural design environments triggering and maintaining motivation for design-based learning and promoting learners’ interpersonal skills through goals–plans–action theory, uncertainty theory and action assembly theory. Simultaneously, interaction-centred learning should be implemented through communication accommodation theory. Students may attain evaluation experiences by free choice of assignment or task, by including different responsibilities for different team roles, by differentiating the learning content and modality, by foreseeing automated feedback and by organizing peers’ supervision sessions, which may be implemented across all stages of DT as a process. By developing interpersonal skills of DT evaluators, lecturers can indirectly encourage students to shift away from low-able design thinkers who hardly stimulate students’ higher-order thinking skills.
Third, despite several research studies on technology use for developing higher-order thinking skills, this study offers new insights into how individually centred and interaction-centred implementation of DT influences higher order thinking, especially where a target use of technology in the face-to-face mode is used. High-able design thinkers especially benefited, while low-able design thinkers were not negatively affected.
However, the present study: (1) Sets an innovative agenda for investigating—behavioural DT in future research, how method use and behavioural uncertainty interact in practice and how this relates to new designer’s mindset development; (2) Advances current insights on how to optimally support pre-service teachers’ DT behaviours and learning outcomes.
Funding
This research was funded by Slovenian Research Agency Javna Agencija za Raziskovalno Dejavnost RS, related to project No. J5-4573 “Developing the Twenty-first Century skills needed for sustainable development and quality education in the era of rapid technology-enhanced changes in the economic, social and natural environment”.
Institutional Review Board Statement
The study was conducted in accordance with the Declaration of Helsinki and with the ethical principles and integrity in research of the University of Ljubljana, Slovenia. The study was approved by the Department of Physics and Technology Education of Faculty of Education at the University of Ljubljana (approval number 2018OFT05/11).
Informed Consent Statement
Informed consent was obtained from all subjects involved in the study.
Data Availability Statement
The data presented in this study are available on request from the author. The data are not publicly available due to privacy issues.
Acknowledgments
The author thanks the participating pre-service teachers at the University of Ljubljana, Faculty of Education Ljubljana, Slovenia for their active participation and important contributions to this research.
Conflicts of Interest
The author declares no conflict of interest. The funders had no role in the design of the study; in the collection, analyses, or interpretation of data; in the writing of the manuscript; or in the decision to publish the results.
References
- Cai, Y.; Ahmad, I. From an Entrepreneurial University to a Sustainable Entrepreneurial University: Conceptualization and Evidence in the Contexts of European University Reforms. High. Educ. Policy 2021. [Google Scholar] [CrossRef]
- Hoolohan, C.; Browne, A.L. Design thinking for practice-based intervention: Co-producing the change points toolkit to unlock (un)sustainable practices. Des. Stud. 2020, 67, 102–132. [Google Scholar] [CrossRef]
- Galván, J.A.; Casman, E.; Fisher, E. What skills predict an intern’s ability to innovate new products? A quantitative study of innovation capability of Mexican college interns. Int. J. Interact. Des. Manuf. 2022, 16, 1301–1320. [Google Scholar] [CrossRef]
- Hero, L.-M.; Lindfors, E.; Taatila, V. Individual innovation competence: A systematic review and future research agenda. Int. J. High. Educ. 2017, 6, 103–121. [Google Scholar] [CrossRef]
- Huang, X.; Guo, P.; Wang, X.; Wang, D. Modeling and Analysis of Interorganizational Knowledge Transfer Considering Reputation Mechanisms. Sustainability 2021, 13, 14020. [Google Scholar] [CrossRef]
- Duke, J.; Igwe, V.; Tapang, A.; Usang, O. The innovation interface between knowledge management and firm performance. Knowl. Manag. Res. Pract. 2022. epub ahead of print. [Google Scholar] [CrossRef]
- Castaneda, D.I.; Toulson, P. Is it possible to share tacit knowledge using information and communication technology tools? Glob. Knowl. Mem. Commun. 2021, 70, 673–683. [Google Scholar] [CrossRef]
- Kownator, D. Bridging the Innovation Gap: How Can the European Union “Do More and Better with Less”? EuropaNova. Available online: https://uploads-ssl.webflow.com/594919aeb0d3db0e7a726347/61ae0cafc7dfbcbadb10efc4_Bridging%20the%20innovation%20gap.pdf (accessed on 14 October 2022).
- Organisation for Economic Co-Operation and Development (OECD). OECD Science, Technology and Innovation Outlook 2021: Times of Crisis and Opportunity; OECD Publishing: Paris, France, 2021. [Google Scholar] [CrossRef]
- Chasanidou, D.; Gasparini, A.A.; Lee, E. Design Thinking Methods and Tools for Innovation. In Design, User Experience, and Usability: Design Discourse. Lecture Notes in Computer Science; Marcus, A., Ed.; Springer: Cham, Switzerland, 2015; pp. 12–23. [Google Scholar] [CrossRef]
- Razzouk, R.; Shute, V. What Is Design Thinking and Why Is It Important? Rev. Educ. Res. 2012, 82, 330–348. [Google Scholar] [CrossRef]
- Dunne, D. Implementing design thinking in organizations: An exploratory study. J. Organ. Design. 2018, 7, 1–16. [Google Scholar] [CrossRef]
- Grots, A.; Creuznacher, I. Design Thinking: Process or Culture? In Design Thinking for Innovation; Brenner, W., Uebernickel, F., Eds.; Springer: Cham, Switzerland, 2016; pp. 183–191. [Google Scholar] [CrossRef]
- Avsec, S.; Ferk Savec, V. Pre-Service Teachers’ Perceptions of, and Experiences with, Technology-Enhanced Transformative Learning towards Education for Sustainable Development. Sustainability 2021, 13, 10443. [Google Scholar] [CrossRef]
- Avsec, S.; Jagiełło-Kowalczyk, M. Investigating possibilities of developing self-directed learning in architecture students using design thinking. Sustainability 2021, 13, 4369. [Google Scholar] [CrossRef]
- Haskamp, T.; Paul, A.; Stöckli, E.; De Paula, D.; Uebernickel, F. Implementing Design Thinking for Non-Designers: Learning Profiles from a Q-Methodology Study. 2020. ISPIM Connects Global 2020: Celebrating the World of Innovation. Available online: https://www.alexandria.unisg.ch/261501/1/ISPIM2020-Final.pdf (accessed on 25 October 2022).
- Kupp, M.; Anderson, J.; Reckhenrich, J. Why design thinking in business needs a rethink. MIT Sloan Manag. Rev. 2017, 59, 42–44. [Google Scholar]
- Kimbell, L. Rethinking Design Thinking: Part I. Des. Cult. 2011, 3, 285–306. [Google Scholar] [CrossRef]
- Elsbach, K.D.; Stigliani, I. Design Thinking and Organizational Culture: A Review and Framework for Future Research. J. Manag. 2018, 44, 2274–2306. [Google Scholar] [CrossRef]
- Butler, A.G.; Roberto, M.A. When cognition interferes with innovation: Overcoming cognitive obstacles to design thinking. Res. Technol. Manag. 2018, 61, 45–51. [Google Scholar] [CrossRef]
- Peng, M.Y.; Feng, Y.; Zhao, X.; Chong, W. Use of Knowledge Transfer Theory to Improve Learning Outcomes of Cognitive and Non-cognitive Skills of University Students: Evidence from Taiwan. Front. Psychol. 2021, 12, 583722. [Google Scholar] [CrossRef]
- Thoring, K.; Müller, R.M. Creating knowledge in design thinking. The relationship of process steps and knowledge types. In Proceedings of the IASDR2011, the 4th World Conference on Design Research, Delft, The Netherlands, 31 October–4 November 2011; pp. 1–9. [Google Scholar]
- Panke, S. Design Thinking in Education: Perspectives, Opportunities and Challenges. Open Educ. Stud. 2019, 1, 281–306. [Google Scholar] [CrossRef]
- Dorland, A.M. Didn’t we solve this one? The function of practice routines in design thinking. Commun. Des. 2017, 5, 115–130. [Google Scholar] [CrossRef]
- Avsec, S.; Ferk Savec, V. Mapping the Relationships between Self-Directed Learning and Design Thinking in Pre-Service Science and Technology Teachers. Sustainability 2022, 14, 8626. [Google Scholar] [CrossRef]
- Ericson, J.D. Mapping the Relationship between Critical Thinking and Design Thinking. J. Knowl. Econ. 2022, 13, 406–429. [Google Scholar] [CrossRef]
- Hay, L.; Cash, P.; McKilligan, S. The future of design cognition analysis. Des. Sci. 2020, 6, E20. [Google Scholar] [CrossRef]
- Kavousi, S.; Miller, P.A.; Alexander, P.A. Modeling metacognition in design thinking and design making. Int. J. Technol. Des. Educ. 2020, 30, 709–735. [Google Scholar] [CrossRef]
- Corrales-Estrada, M. Design thinkers’ profiles and design thinking solutions. Acad. Rev. Latinoam. Adm. 2020, 33, 9–24. [Google Scholar] [CrossRef]
- Koh, J.H.L.; Chai, C.S.; Wong, B.; Hong, H.-Y. Design Thinking for Education: Conceptions and Applications in Teaching and Learning; Springer: Singapore, 2015. [Google Scholar]
- Luka, I. Design Thinking in Pedagogy. J. Educ. Cult. Soc. 2020, 5, 63–74. [Google Scholar] [CrossRef]
- Avsec, S.; Jagiełło-Kowalczyk, M.; Zabicka, A. Enhancing Transformative Learning and Innovation Skills Using Remote Learning for Sustainable Architecture Design. Sustainability 2022, 14, 3928. [Google Scholar] [CrossRef]
- Liedtka, J.M. Innovative ways companies are using design thinking. Strat. Leadersh. 2014, 42, 40–45. [Google Scholar] [CrossRef]
- Sharples, M.; de Roock, R.; Ferguson, R.; Gaved, M.; Herodotou, C.; Koh, E.; Kukulska-Hulme, A.; Looi, C.-K.; McAndrew, P.; Rienties, B. Pedagogy 2016: Open University Innovation Report 5; The Open University: Milton Keynes, UK, 2016. [Google Scholar] [CrossRef]
- Leifer, L.J.; Steinert, M. Dancing with Ambiguity: Causality Behavior, Design Thinking, and Triple-Loop-Learning. In Management of the Fuzzy Front End of Innovation; Gassmann, O., Schweitzer, F., Eds.; Springer: Cham, Switzerland, 2014. [Google Scholar] [CrossRef]
- Bresciani, S. Visual design thinking: A collaborative dimensions framework to profile visualisations. Des. Stud. 2019, 63, 92e124. [Google Scholar] [CrossRef]
- Cross, N. Designerly Ways of Knowing; Springer: London, UK, 2006. [Google Scholar]
- Scheer, A.; Plattner, H. Transforming Constructivist Learning into Action: Design Thinking in education. Des. Tech. Educ. Int. J. 2011, 17, 8–19. [Google Scholar]
- Melzner, N.; Greisel, M.; Dresel, M.; Kollar, I. Regulating self-organized collaborative learning: The importance of homogeneous problem perception, immediacy and intensity of strategy use. Int. J. Comput. Support. Collab. Learn. 2020, 15, 149–177. [Google Scholar] [CrossRef]
- De Backer, L.; Van Keer, H.; De Smedt, F.; Merchie, E.; Valcke, M. Identifying regulation profiles during computer-supported collaborative learning and examining their relation with students’ performance, motivation, and self-efficacy for learning. Comput. Educ. 2022, 179, 104421. [Google Scholar] [CrossRef]
- Warner, L.H. Developing Interpersonal Skills of Evaluators: A Service-Learning Approach. Am. J. Eval. 2020, 41, 432–451. [Google Scholar] [CrossRef]
- Ding, J. Exploring Effective Teacher-Student Interpersonal Interaction Strategies in English as a Foreign Language Listening and Speaking Class. Front Psychol. 2021, 12, 765496. [Google Scholar] [CrossRef]
- Cash, P.; Vallès Gamundi, X.; Echstrøm, I.; Daalhuizen, J. Method use in behavioural design: What, how, and why? Int. J. Des. 2022, 16, 1–21. [Google Scholar] [CrossRef]
- Järvelä, S.; Järvenoja, H.; Malmberg, J. Capturing the dynamic and cyclical nature of regulation: Methodological Progress in understanding socially shared regulation in learning. Int. J. Comput. Support. Collab. Learn. 2019, 14, 425–441. [Google Scholar] [CrossRef]
- Wendel, S. Designing for Behavior Change: Applying Psychology and Behavioral Economics, 2nd ed.; O’Reilly: Sebastopol, ON, Canada, 2020. [Google Scholar]
- Ball, L.J.; Christensen, B.T. Advancing an understanding of design cognition and design metacognition: Progress and prospects. Des. Stud. 2019, 65, 35–59. [Google Scholar] [CrossRef]
- Bylund, C.L.; Peterson, E.B.; Cameron, K.A. A practitioner’s guide to interpersonal communication theory: An overview and exploration of selected theories. Patient Educ. Couns. 2012, 87, 261–267. [Google Scholar] [CrossRef]
- Iiskala, T.; Volet, S.; Lehtinen, E.; Vauras, M. Socially shared metacognitive regulation in asynchronous CSCL in science: Functions, evolution, and participation. Frontline Learn. Res. 2015, 3, 78–111. [Google Scholar] [CrossRef]
- De Backer, L.; Van Keer, H.; Valcke, M. Variations in socially shared metacognitive regulation and their relation with university students’ performance. Metacogn. Learn. 2020, 15, 233–259. [Google Scholar] [CrossRef]
- Schnaubert, L.; Bodemer, D. Providing different types of group awareness information to guide collaborative learning. Int. J. Comput. Support. Collab. Learn. 2019, 14, 7–51. [Google Scholar] [CrossRef]
- Yilmaz, F.G.K.; Yilmaz, R. Impact of pedagogical agent-mediated metacognitive support towards increasing task and group awareness in CSCL. Comput. Educ. 2019, 134, 1–14. [Google Scholar] [CrossRef]
- Li, Y.; Li, X.; Su, Y.; Peng, Y.; Hu, H. Exploring the role of EFL learners’ online self-regulation profiles in their social regulation of learning in wiki-supported collaborative reading activities. J. Comput. Educ. 2020, 7, 575–595. [Google Scholar] [CrossRef]
- Zheng, J.; Xing, W.; Zhu, G.X.; Chen, G.; Zhao, H.; Xie, C. Profiling self-regulation behaviors in STEM learning of engineering design. Comput. Educ. 2020, 143, 103669. [Google Scholar] [CrossRef]
- Bergman, L.R.; Wangby, M. The person-oriented approach: A short theoretical and practical guide. Estonian J. Educ. 2014, 2, 29–49. [Google Scholar] [CrossRef]
- Creswell, J.W.; Creswell, J.D. Research design: Qualitative, quantitative, and mixed methods approaches, 5th ed.; Sage: Los Angeles, CA, USA, 2018. [Google Scholar]
- Faul, F.; Erdfelder, E.; Buchner, A.; Lang, A.G. Statistical power analyses using G*Power 3.1: Tests for correlation and regression analyses. Behav. Res. Methods 2009, 41, 1149–1160. [Google Scholar] [CrossRef] [PubMed]
- Wu, M.-J.; Zhao, K.; Fils-Aime, F. Response rates of online surveys in published research: A meta-analysis. Comput. Hum. Behav. Rep. 2022, 7, 100206. [Google Scholar] [CrossRef]
- Qiu, W.; Joe, H. clusterGeneration: Random Cluster Generation. R Package Version 1.3.7. Available online: https://cran.r-project.org/web/packages/clusterGeneration/clusterGeneration.pdf (accessed on 14 October 2022).
- Avsec, S.; Sajdera, J. Factors influencing pre-service preschool teachers’ engineering thinking: Model development and test. Int. J. Technol. Des. Educ. 2019, 29, 1105–1132. [Google Scholar] [CrossRef]
- University of Ljubljana. Study Programmes. Available online: https://www.pef.uni-lj.si/323.html (accessed on 13 September 2022).
- Dosi, C.; Rosati, F.; Vignoli, M. Measuring design thinking mindset. In Design 2018, Proceedings of the 15th International Design Conference, Dubrovnik, Croatia, 21–24 May 2018; Marjanovíc, D., Štorga, M., Škec, S., Bojčetić, N., Pavković, N., Eds.; The Design Society: Dubrovnik, Croatia, 2018; pp. 1991–2002. Available online: https://www.designsociety.org/publication/40597/MEASURING+DESIGN+THINKING+MINDSET (accessed on 13 September 2022).
- Chomeya, R. Quality of Psychology Test between Likert Scale 5 and 6 Points. J. Soc. Sci. 2010, 6, 399–403. [Google Scholar] [CrossRef]
- Hair, J.; Black, B.; Babin, B.; Anderson, R.E.; Tatham, R.L. Multivariate Data Analysis, 7th ed.; Prentice Hall: Englewood Cliffs, NJ, USA, 2009. [Google Scholar]
- Pituch, K.A.; Stevens, J.P. Applied Multivariate Statistics for the Social Sciences; Routledge: New York, NY, USA, 2015. [Google Scholar]
- Field, A. Discovering Statistics Using IBM SPSS Statistics: North American Edition, 5th ed.; Sage: Thousand Oaks, CA, USA, 2017. [Google Scholar]
- Hair, J.F.; Sarstedt, M.; Pieper, T.M.; Ringle, C.M. The Use of Partial Least Squares Structural Equation Modeling in Strategic Management Research: A Review of Past Practices and Recommendations for Future Applications. Long Range Plan. 2012, 45, 320–340. [Google Scholar] [CrossRef]
- Meier, K.; Parker, P.; Freeth, D. Mechanisms that support the assessment of interpersonal skills. J. Pract. Teach. Learn. 2014, 12, 6–24. [Google Scholar] [CrossRef]
- Williamson, S.N. Development of a self-rating scale of self-directed learning. Nurse Res. 2007, 14, 66–83. [Google Scholar] [CrossRef]
- Plutchik, R. The circumplex as a general model of the structure of emotions and personality. In Circumplex Models of Personality and Emotions; Plutchik, R., Conte, H.R., Eds.; American Psychological Association: Washington, DC, USA, 1997; pp. 17–45. [Google Scholar] [CrossRef]
- Komperda, R.; Pentecost, T.C.; Barbera, J. Moving beyond Alpha: A Primer on Alternative Sources of Single-Administration Reliability Evidence for Quantitative Chemistry Education Research. J. Chem. Educ. 2018, 95, 1477–1491. [Google Scholar] [CrossRef]
- Hayes, A.F.; Coutts, J.J. Use Omega Rather than Cronbach’s Alpha for Estimating Reliability. But…. Commun. Methods Meas. 2020, 14, 1–24. [Google Scholar] [CrossRef]
- Fornell, C.G.; Larcker, D.F. Evaluating structural equation models with unobservable variables and measurement error. J. Mark. Res. 1981, 18, 39–50. [Google Scholar] [CrossRef]
- Henseler, J.; Ringle, C.M.; Sarstedt, M. A new criterion for assessing discriminant validity in variance-based structural equation modeling. J. Acad. Mark. Sci. 2015, 43, 115–135. [Google Scholar] [CrossRef]
- Gore, P. Cluster Analysis. In Handbook of Applied Multivariate Statistics and Mathematical Modelling; Tinsley, H., Brown, S., Eds.; Academic Press: Cambridge, MA, USA, 2000; pp. 297–321. [Google Scholar]
- Cohen, J.; Cohen, P.; West, S.G.; Aiken, L.S. Applied Multiple Regression/Correlation Analysis for the Behavioral Sciences, 3rd ed.; Routledge: New York, NY, USA, 2003; pp. 32–35. [Google Scholar]
- University of Ljubljana. Code of Ethics. Available online: https://www.uni-lj.si/university/code_of_ethics/ (accessed on 17 September 2022).
- Chang, S.J.; Van Witteloostuijn, A.; Eden, L. From the editors: Common method variance in international business research. J. Int. Bus. Stud. 2010, 41, 178–184. [Google Scholar] [CrossRef]
- Podsakoff, P.M.; MacKenzie, S.B.; Lee, J.Y.; Podsakoff, N.P. Common method biases in behavioral research: A critical review of the literature and recommended remedies. J. Appl. Psychol. 2003, 88, 879–903. [Google Scholar] [CrossRef]
- Kock, N. Common method bias in PLS-SEM: A full collinearity assessment approach. Int. J. e-Collab. 2015, 11, 1–10. [Google Scholar] [CrossRef]
- Malhotra Naresh, K.; Dash, S. Marketing Research, An Applied Orientation, 7th ed.; Pearson: New Delhi, India, 2015. [Google Scholar]
- Hair, J.F.; Black, W.C.; Babin, B.J.; Anderson, R.E. Multivariate Data Analysis, 8th ed.; Cengage: Hampshire, UK, 2019. [Google Scholar]
- Roemer, E.; Schuberth, F.; Henseler, J. HTMT2–an improved criterion for assessing discriminant validity in structural equation modeling. Ind. Manag. Data Syst. 2021, 121, 2637–2650. [Google Scholar] [CrossRef]
- Teo, T.S.H.; Srivastava, S.C.; Jiang, L. Trust and electronic government success: An empirical study. J. Manag. Inf. Syst. 2008, 25, 99–132. [Google Scholar] [CrossRef]
- Henseler, J.A. Adanco 2.0.1: User Manual, 1st ed.; Composite Modeling GmbH & Co: Kleve, Germany, 2017. [Google Scholar]
- Tabachnick, B.G.; Fidell, L.S. Using Multivariate Statistics, 6th ed.; Pearson Education: Boston, MA, USA, 2013. [Google Scholar]
- Byrne, B.M. Structural Equation Modeling with AMOS: Basic Concepts, Applications, and Programming, 3rd ed.; Routledge: New York, NY, USA, 2016. [Google Scholar]
- Vermunt, J.K.; Magidson, J. Latent class models for classification. Comput. Stat. Data Anal. 2003, 41, 531–537. [Google Scholar] [CrossRef]
- Agresti, A. An Introduction to Categorical Data Analysis, 2nd ed.; Wiley: Hoboken, NJ, USA, 2007. [Google Scholar]
- Sharpe, D. Your Chi-Square test is statistically significant: Now what? Pract. Assess. Res. Eval. 2015, 20, 1–10. [Google Scholar] [CrossRef]
- Landis, S.E.; Barrett, M.; Galvin, S.L. Effects of different models of integrated collaborative care in a family medicine residency program. Fam. Syst. Health 2013, 31, 264–273. [Google Scholar] [CrossRef] [PubMed]
- Chang, Y.-S.; Kao, J.-Y.; Wang, Y.-Y. Influences of virtual reality on design creativity and design thinking. Think. Skills Creat. 2022, 46, 101127. [Google Scholar] [CrossRef]
- Toader, A.F.; Kessler, T. Task Variation and Mental Models Divergence Influencing the Transfer of Team Learning. Small Group Res. 2018, 49, 545–575. [Google Scholar] [CrossRef]
- Christensen, B.T.; Ball, L.J. Fluctuating epistemic uncertainty in a design team as a metacognitive driver for creative cognitive processes. CoDesign 2017, 14, 1–21. [Google Scholar] [CrossRef]
- Xie, T.; Zhang, L.; Liu, G. Understanding preservice teachers’ affective responses to VR-enabled scientific experiments. Front. Psychol. 2022, 13, 1–12. [Google Scholar] [CrossRef]
- Greene, J.O. A cognitive approach to human communication: An action assembly theory. Commun. Monogr. 1984, 51, 289–306. [Google Scholar] [CrossRef]
- Schmid, M.; Brianza, E.; Petko, D. Self-reported technological pedagogical content knowledge (TPACK) of pre-service teachers in relation to digital technology use in lesson plans. Comput. Hum. Behav. 2021, 115, 106586. [Google Scholar] [CrossRef]


Disclaimer/Publisher’s Note: The statements, opinions and data contained in all publications are solely those of the individual author(s) and contributor(s) and not of MDPI and/or the editor(s). MDPI and/or the editor(s) disclaim responsibility for any injury to people or property resulting from any ideas, methods, instructions or products referred to in the content. |
© 2023 by the author. Licensee MDPI, Basel, Switzerland. This article is an open access article distributed under the terms and conditions of the Creative Commons Attribution (CC BY) license (https://creativecommons.org/licenses/by/4.0/).