Pluvial Flash Flood Hazard and Risk Mapping in Croatia: Case Study in the Gospić Catchment
Abstract
:1. Introduction
2. Materials and Methods
2.1. Flood Risk Management in Croatia
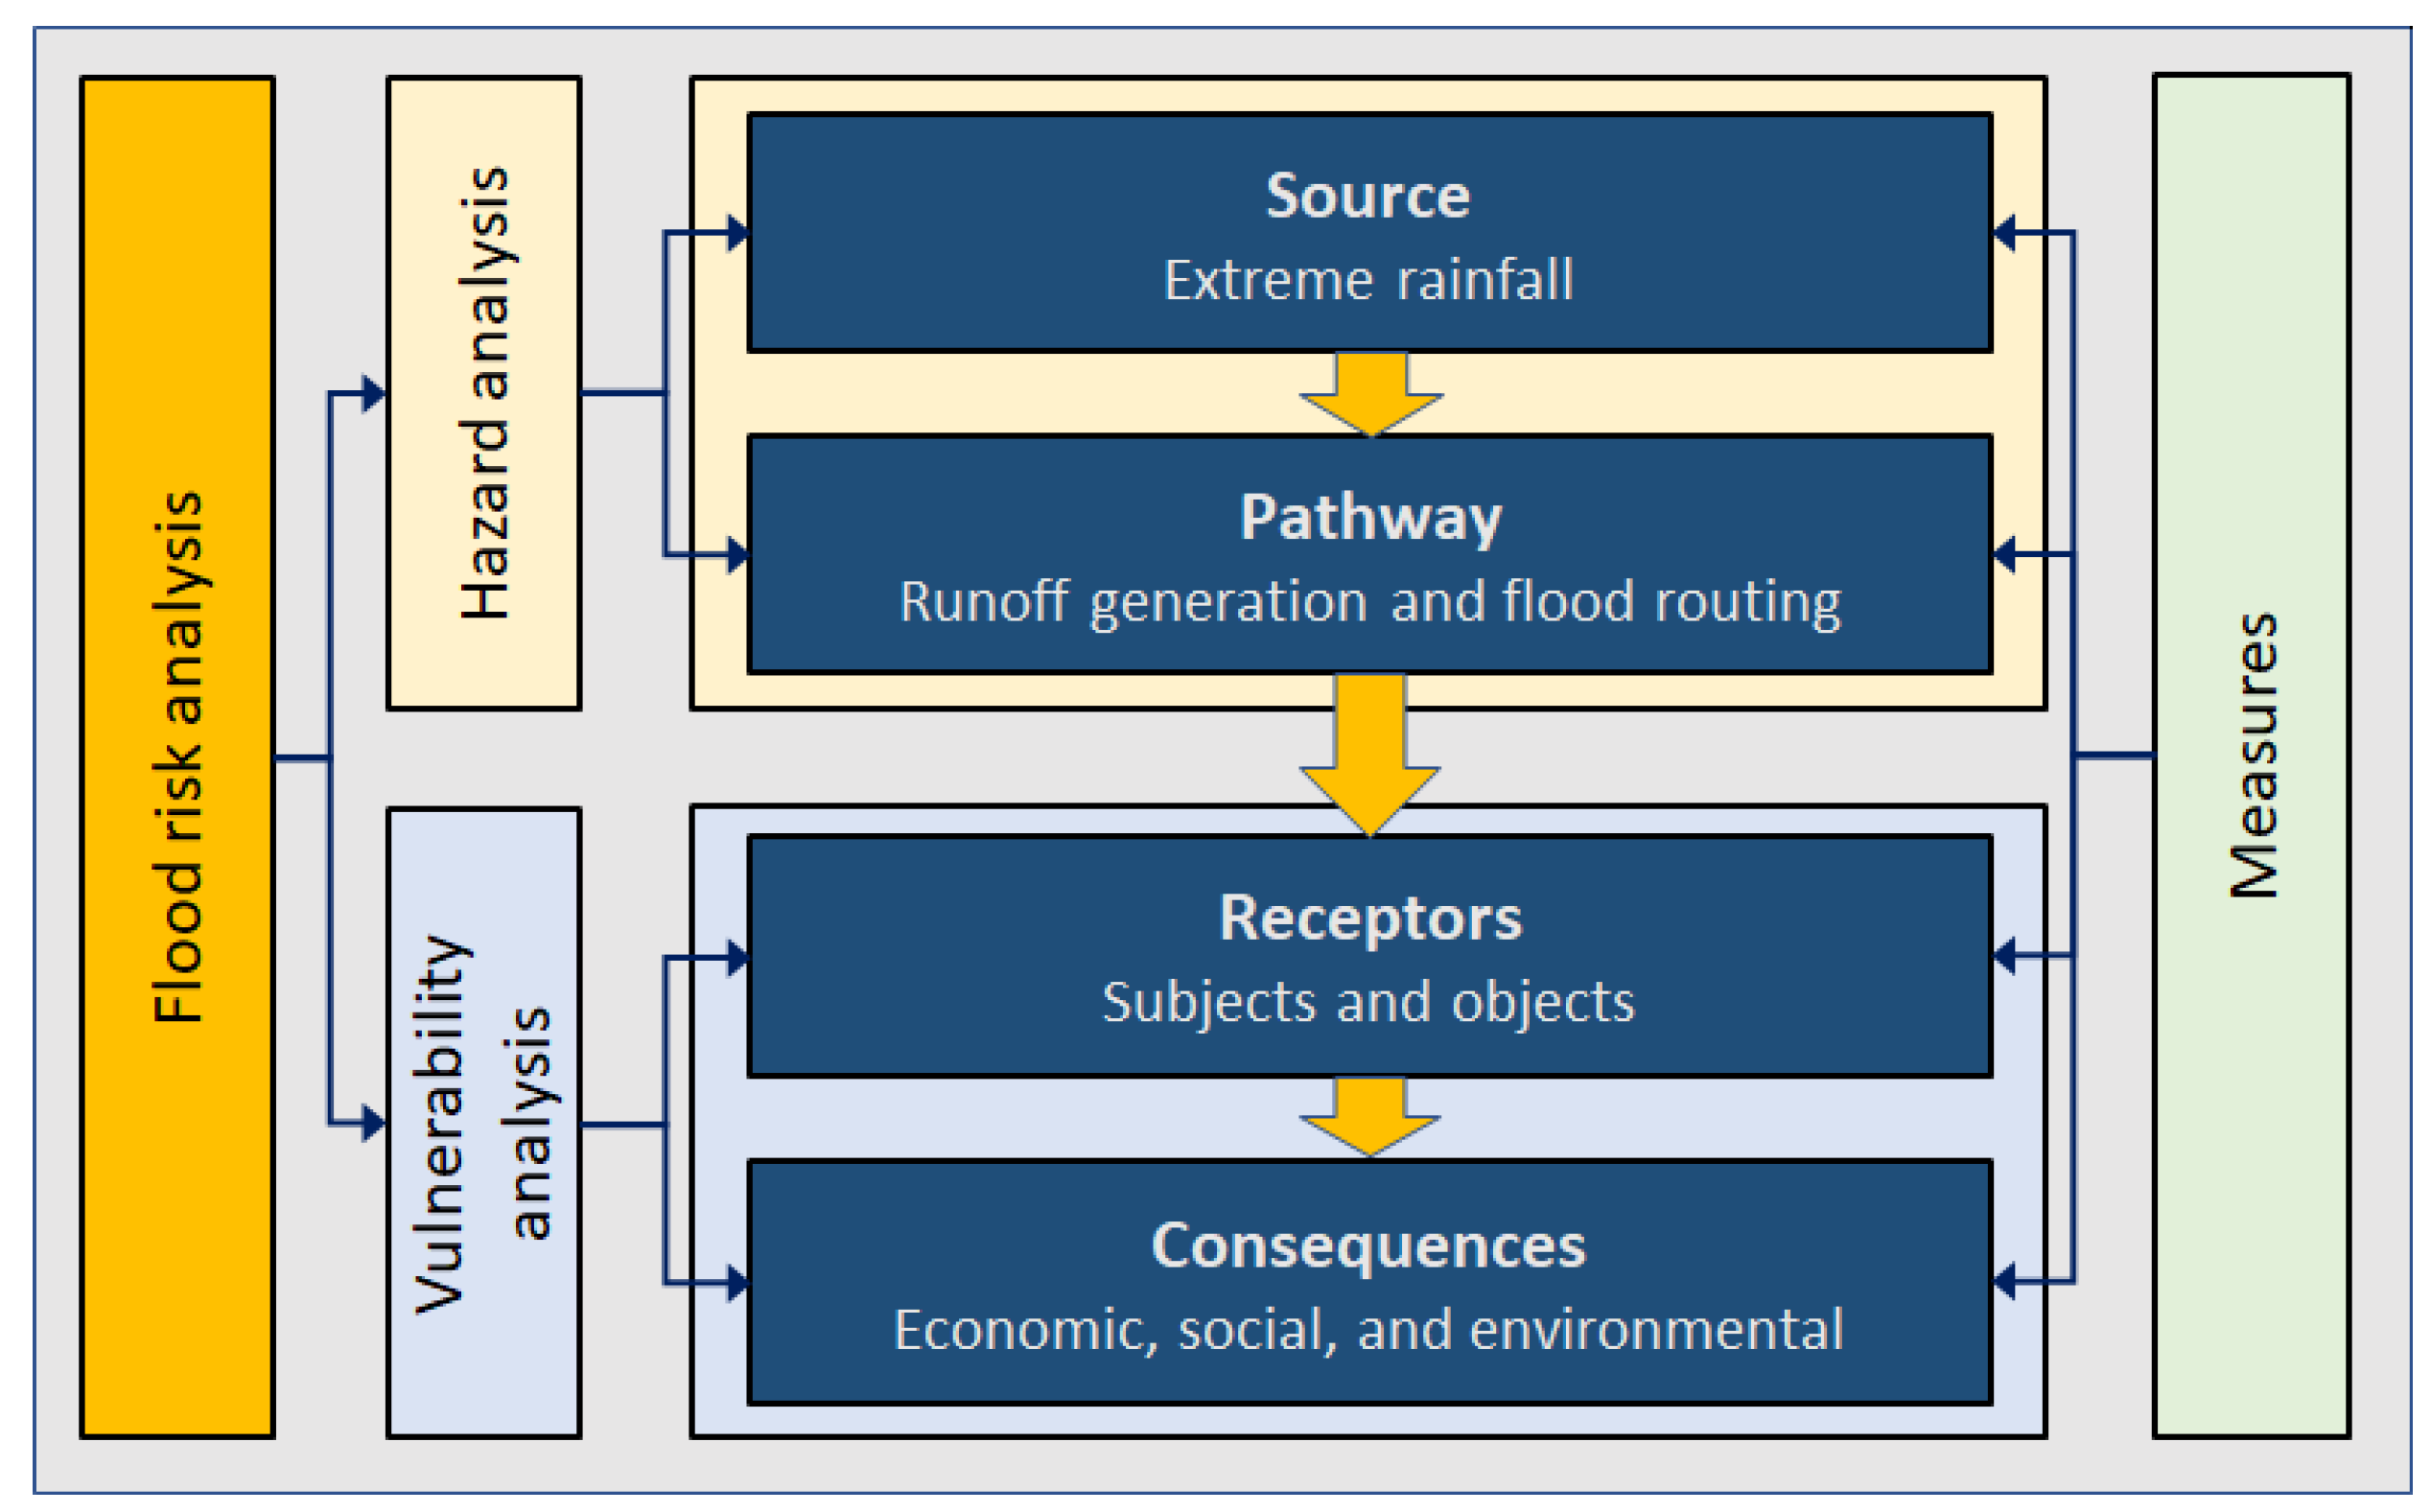
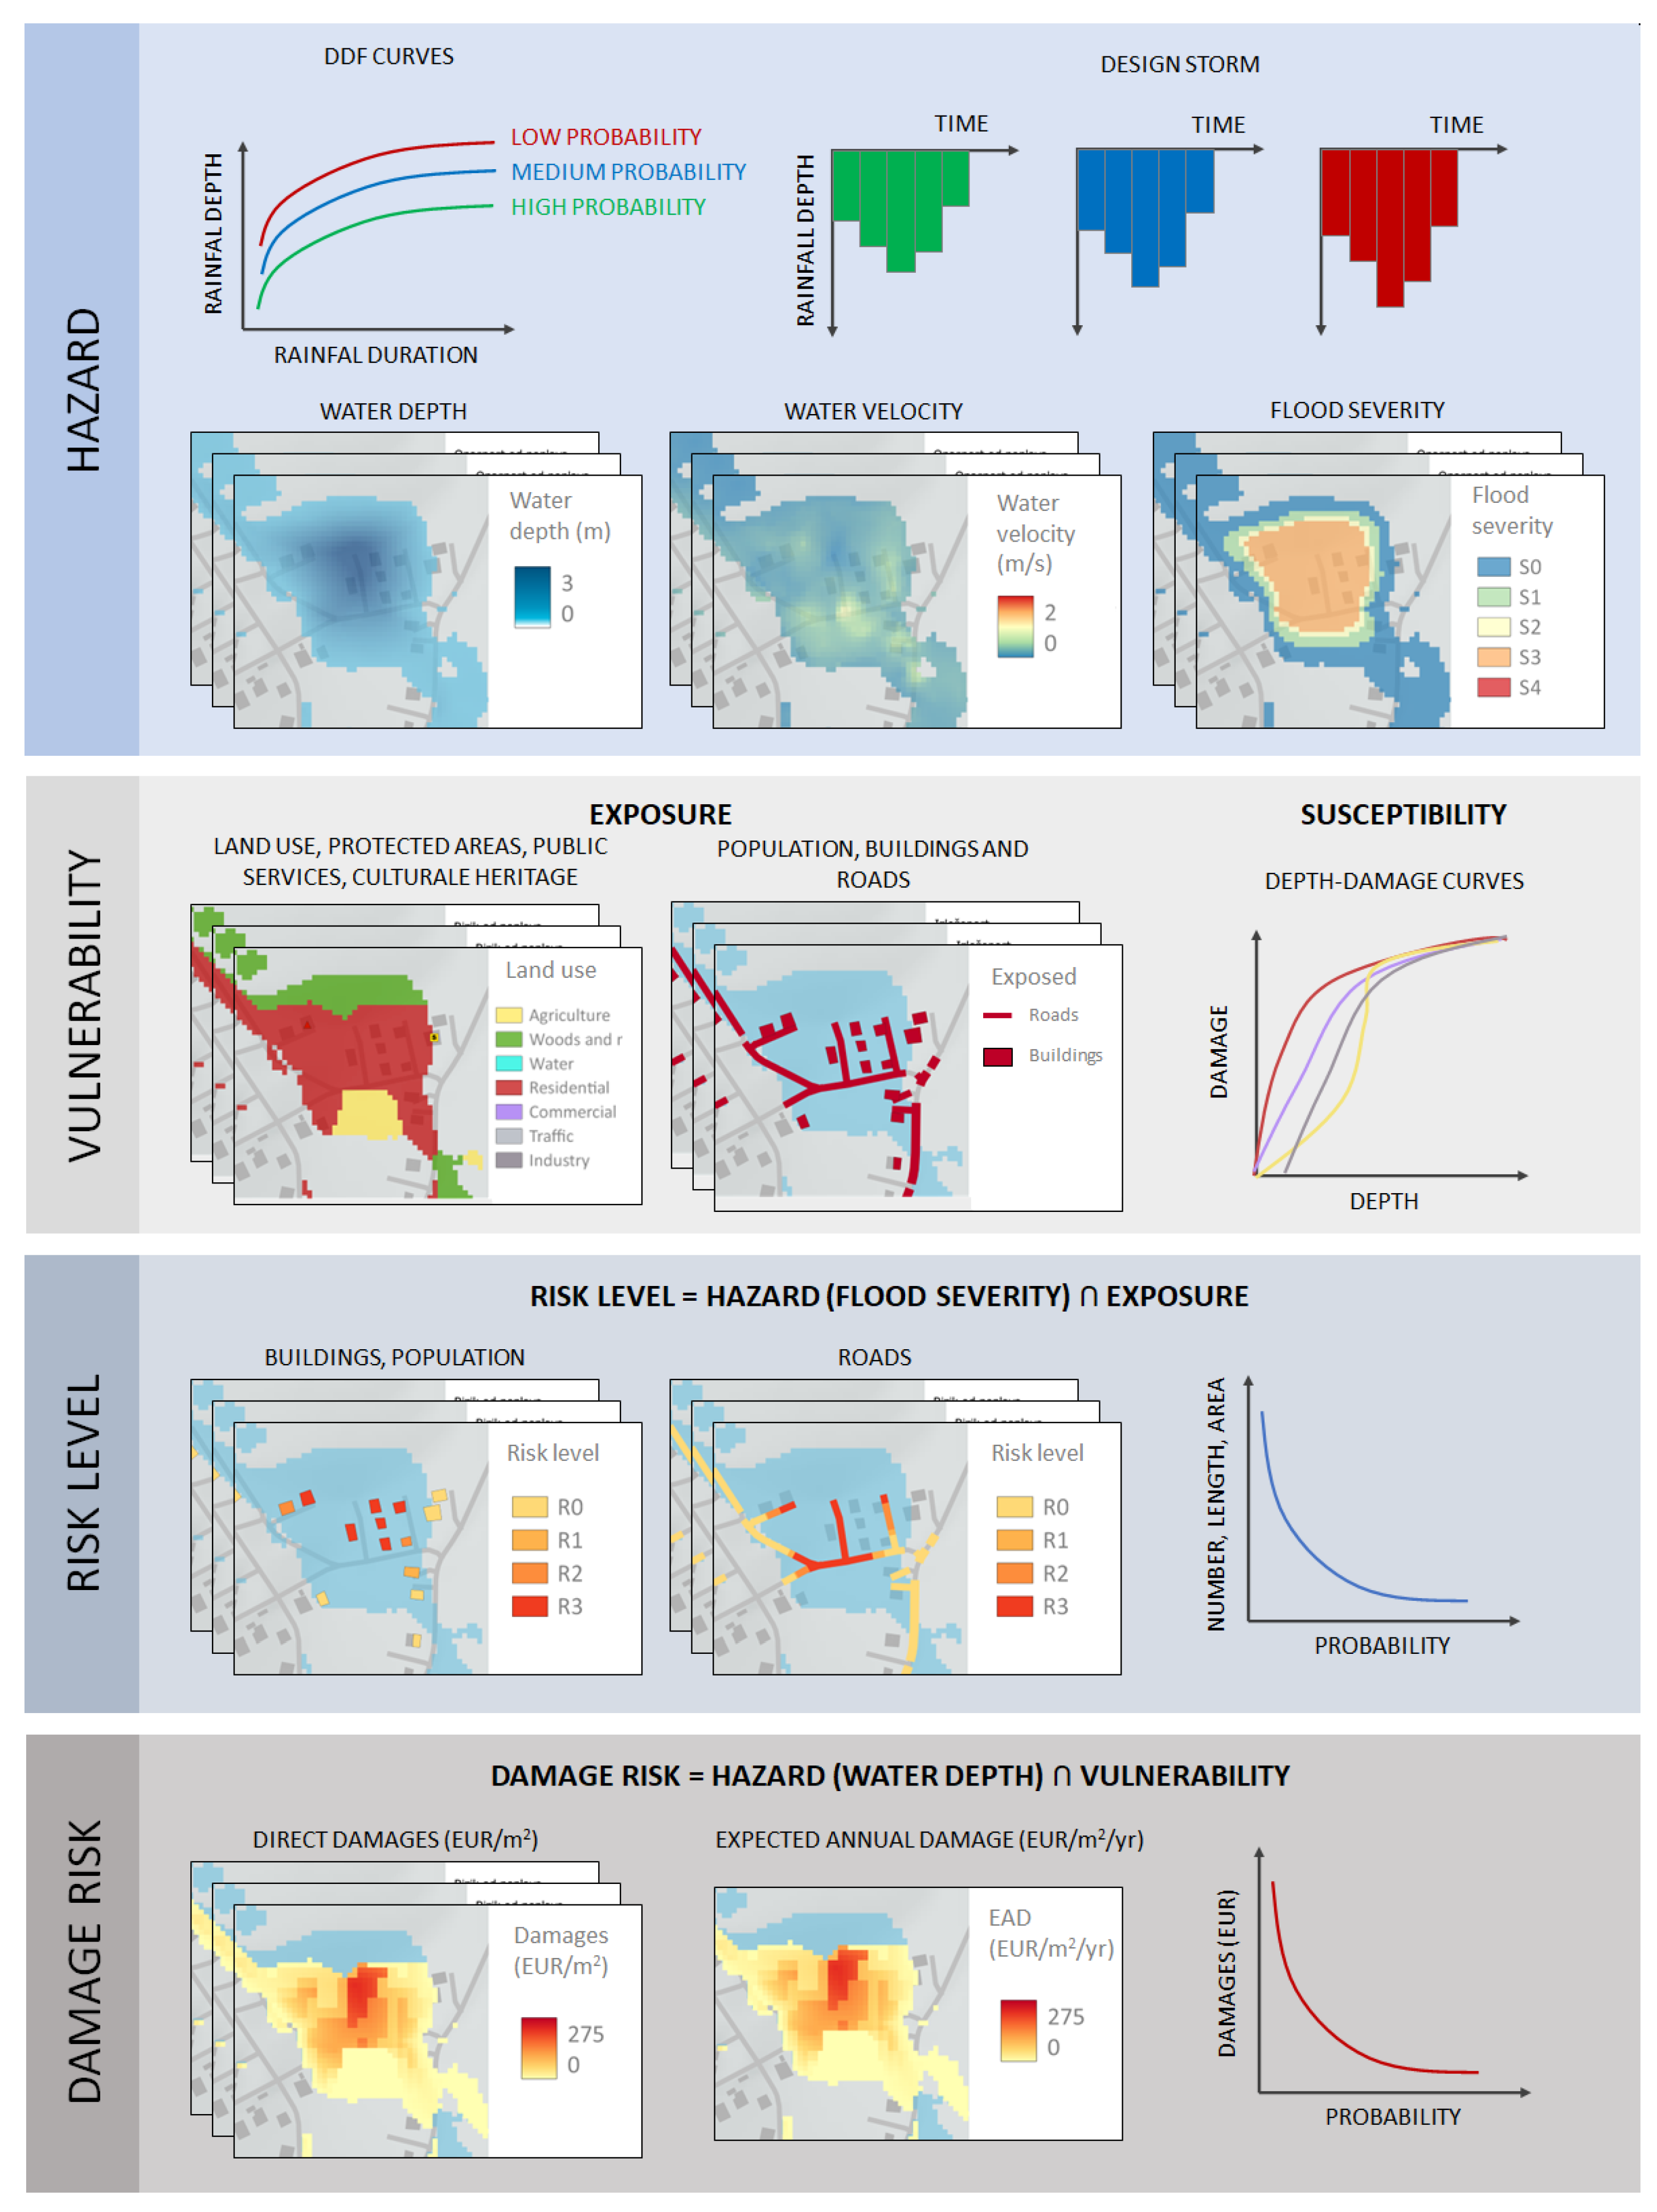
2.2. Methodological Framework for Flood Hazard and Risk Assessment
2.3. Flood Hazard Analysis
2.3.1. Scenarios
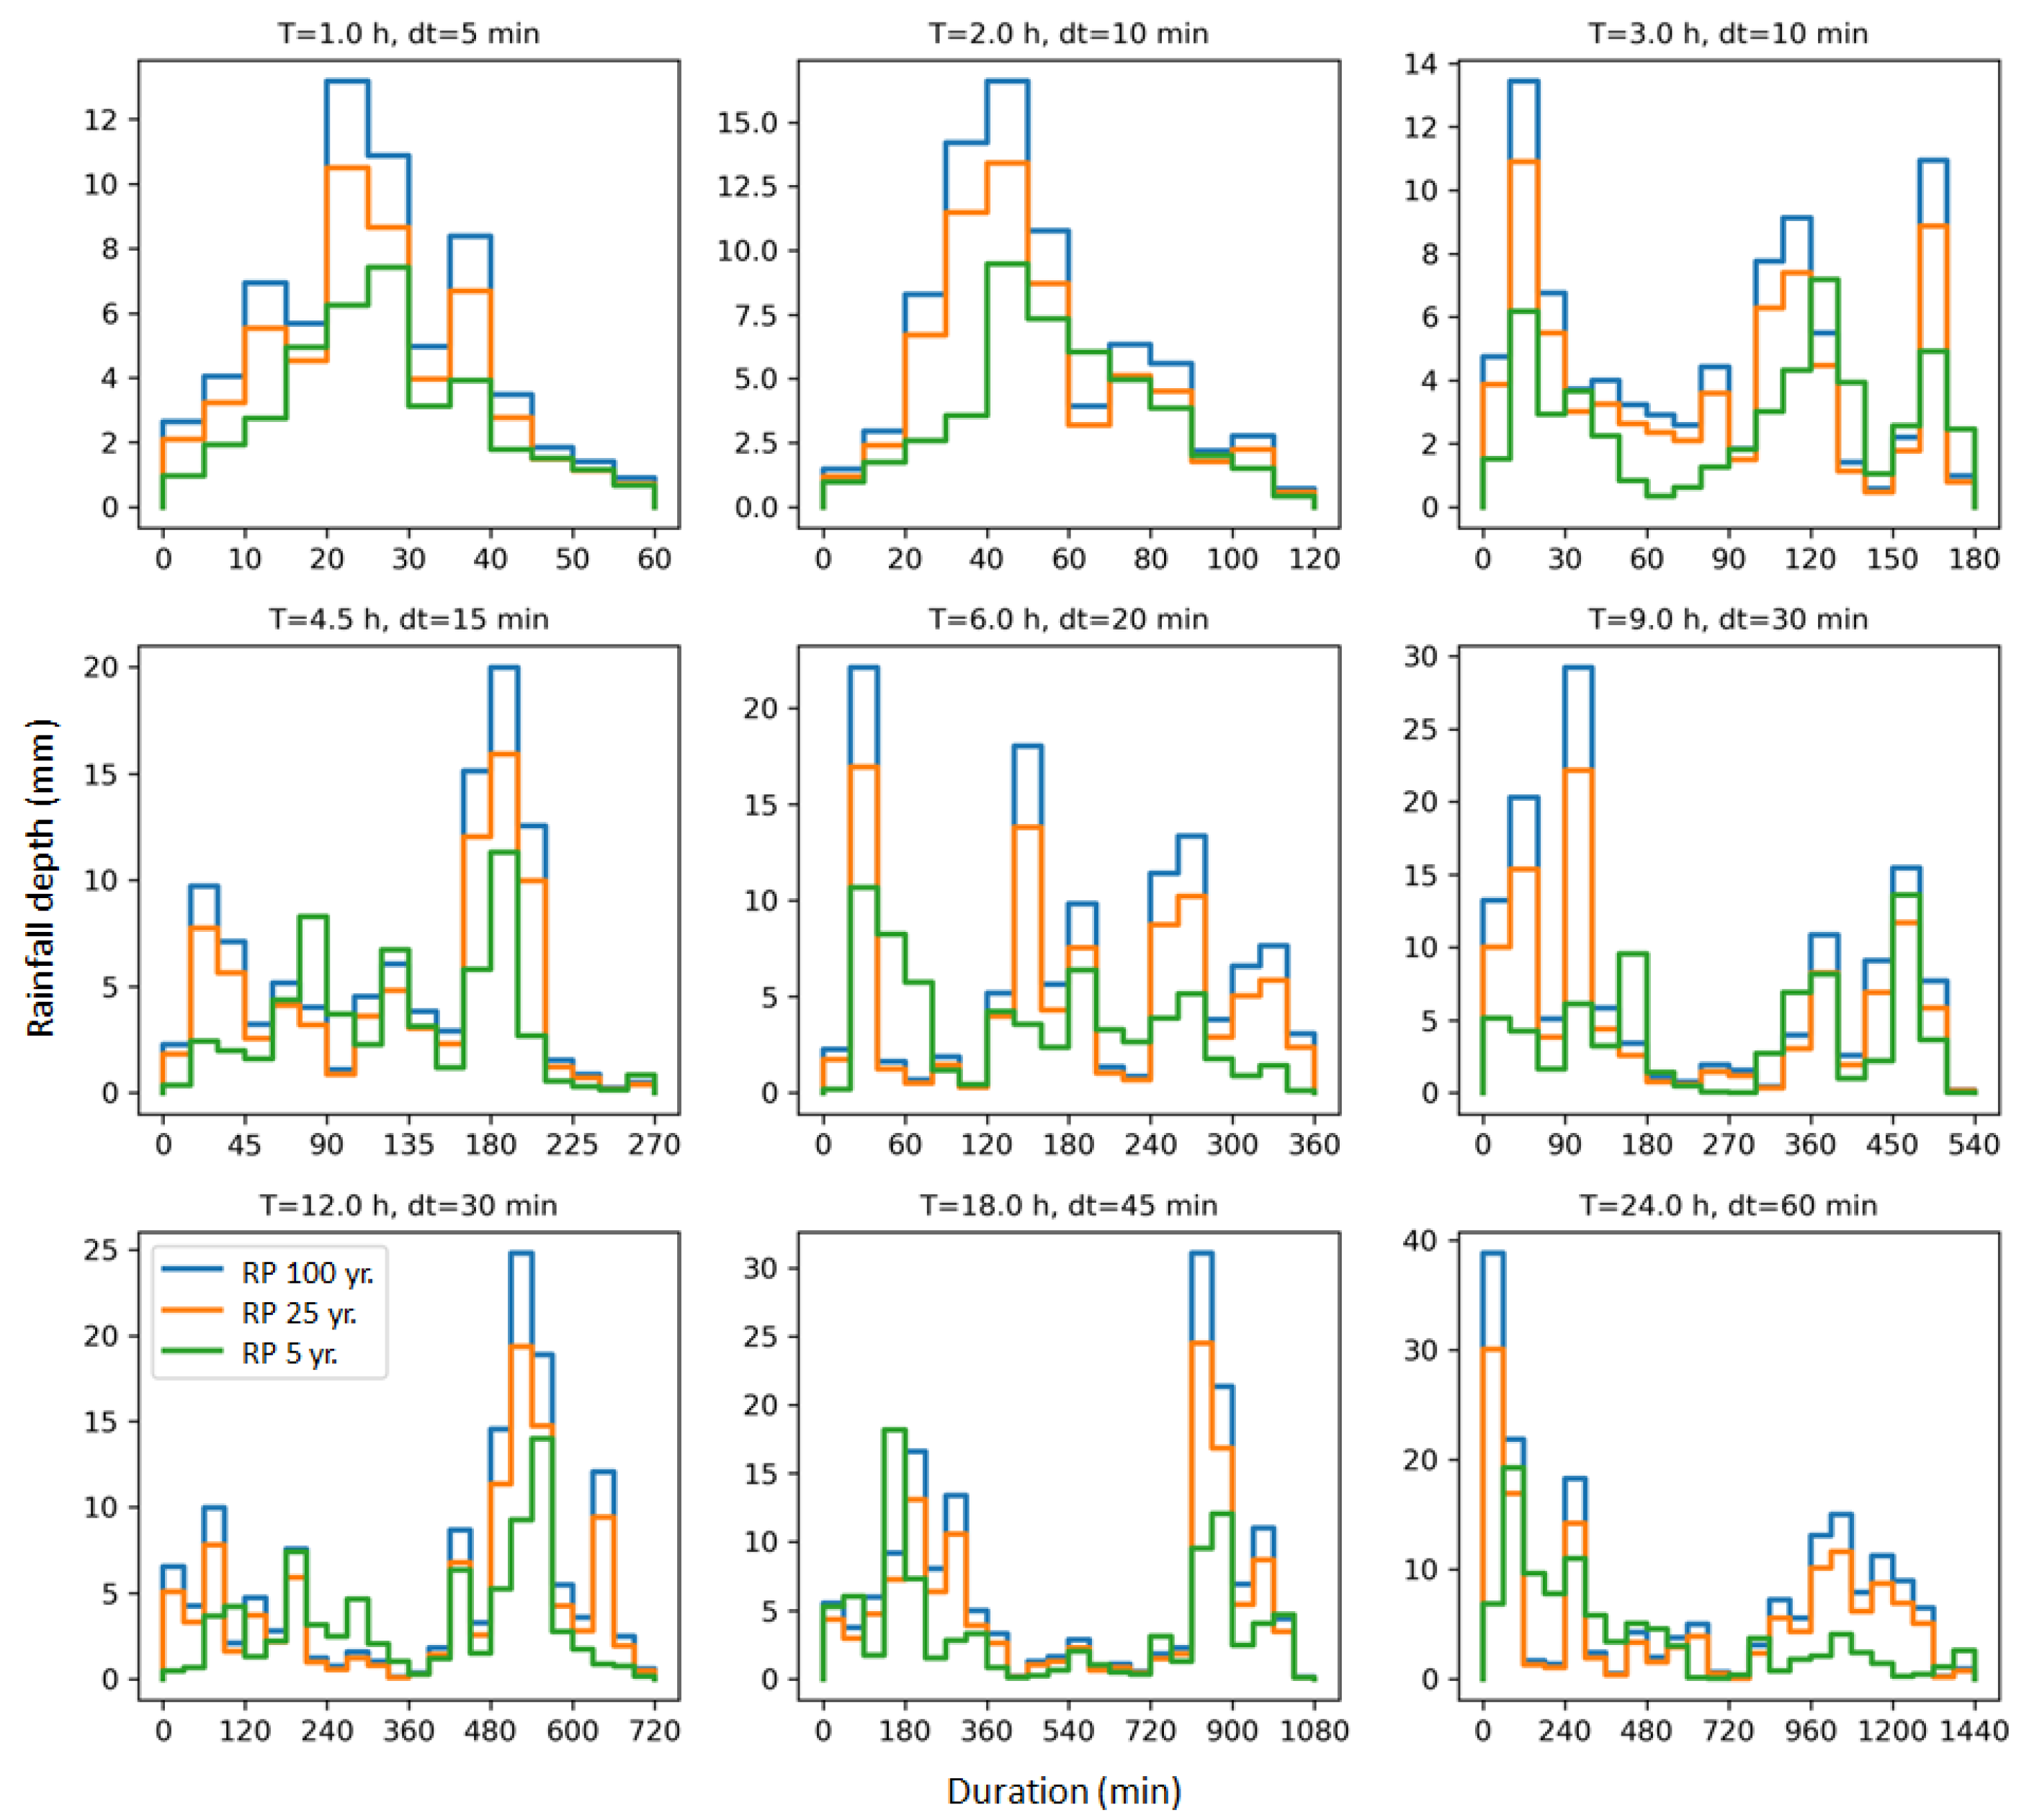
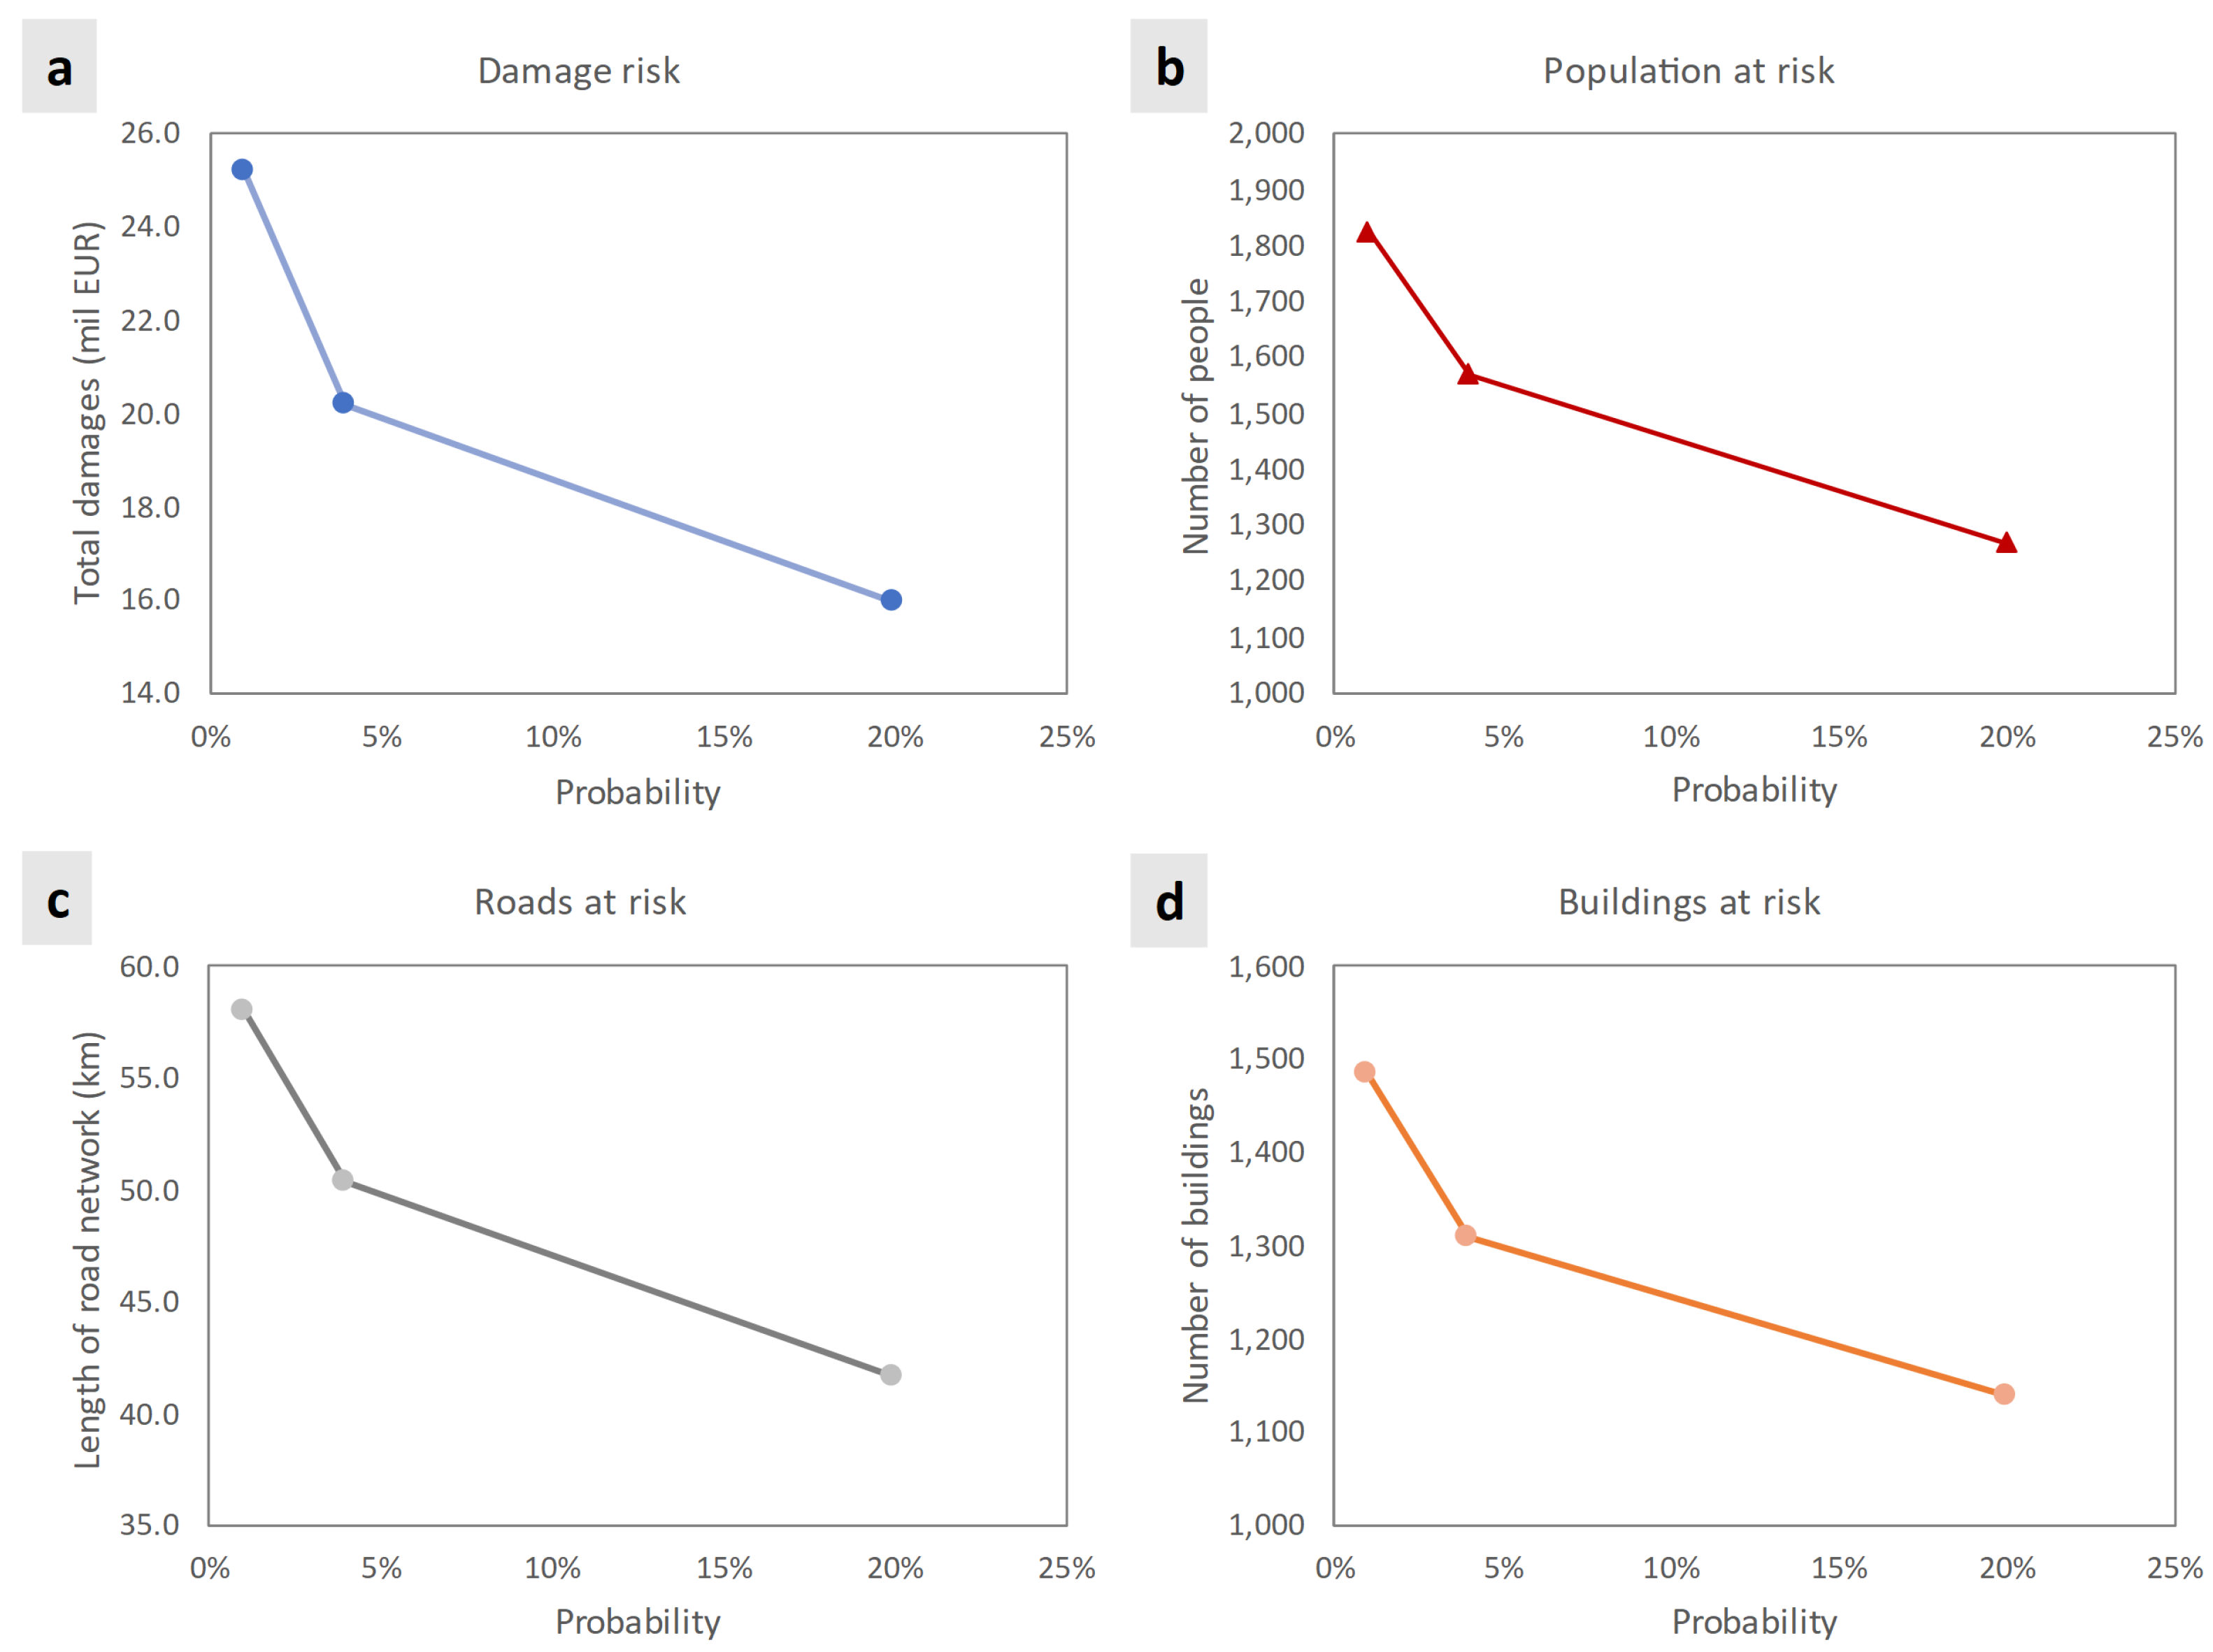
- Scenario H—high probability: describes a high probability of flooding, characterized by lower extreme rainfall intensity, corresponding to a return period of 5 years or 20% AEP.
- Scenario M—medium probability: describes a medium probability of flooding, characterized by a medium extreme rainfall intensity, corresponding to a return period of 25 years or 4% AEP.
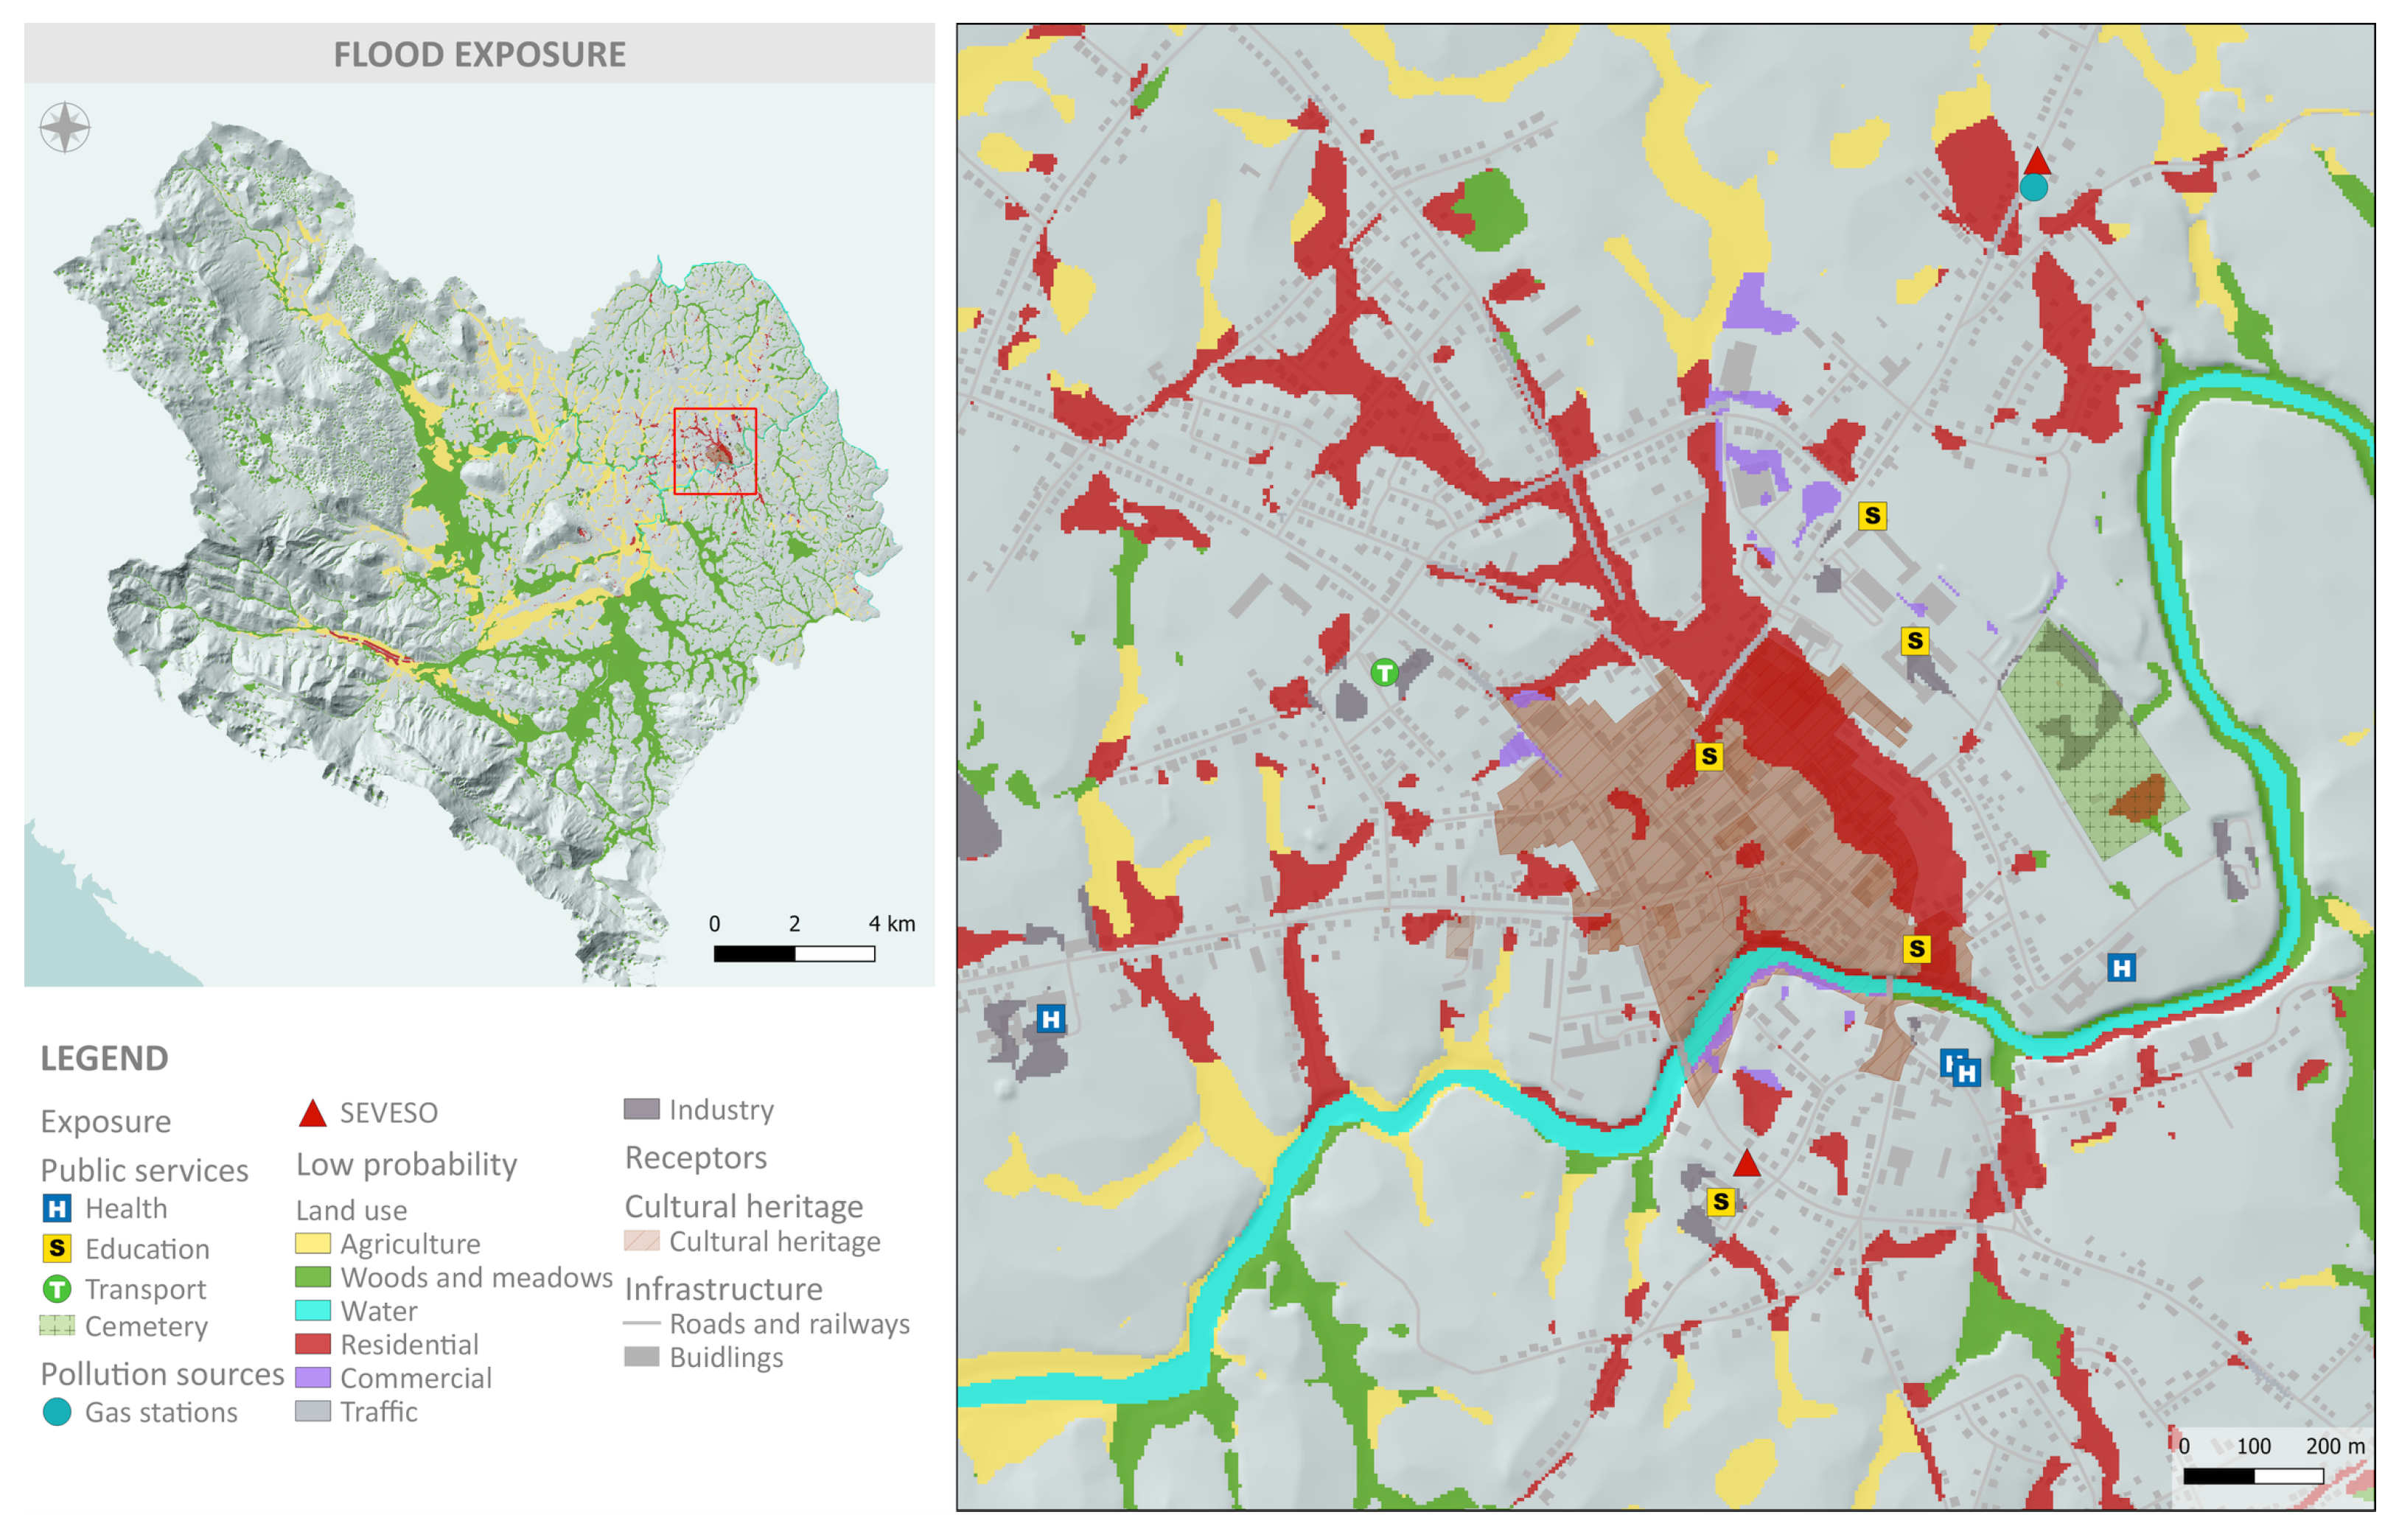
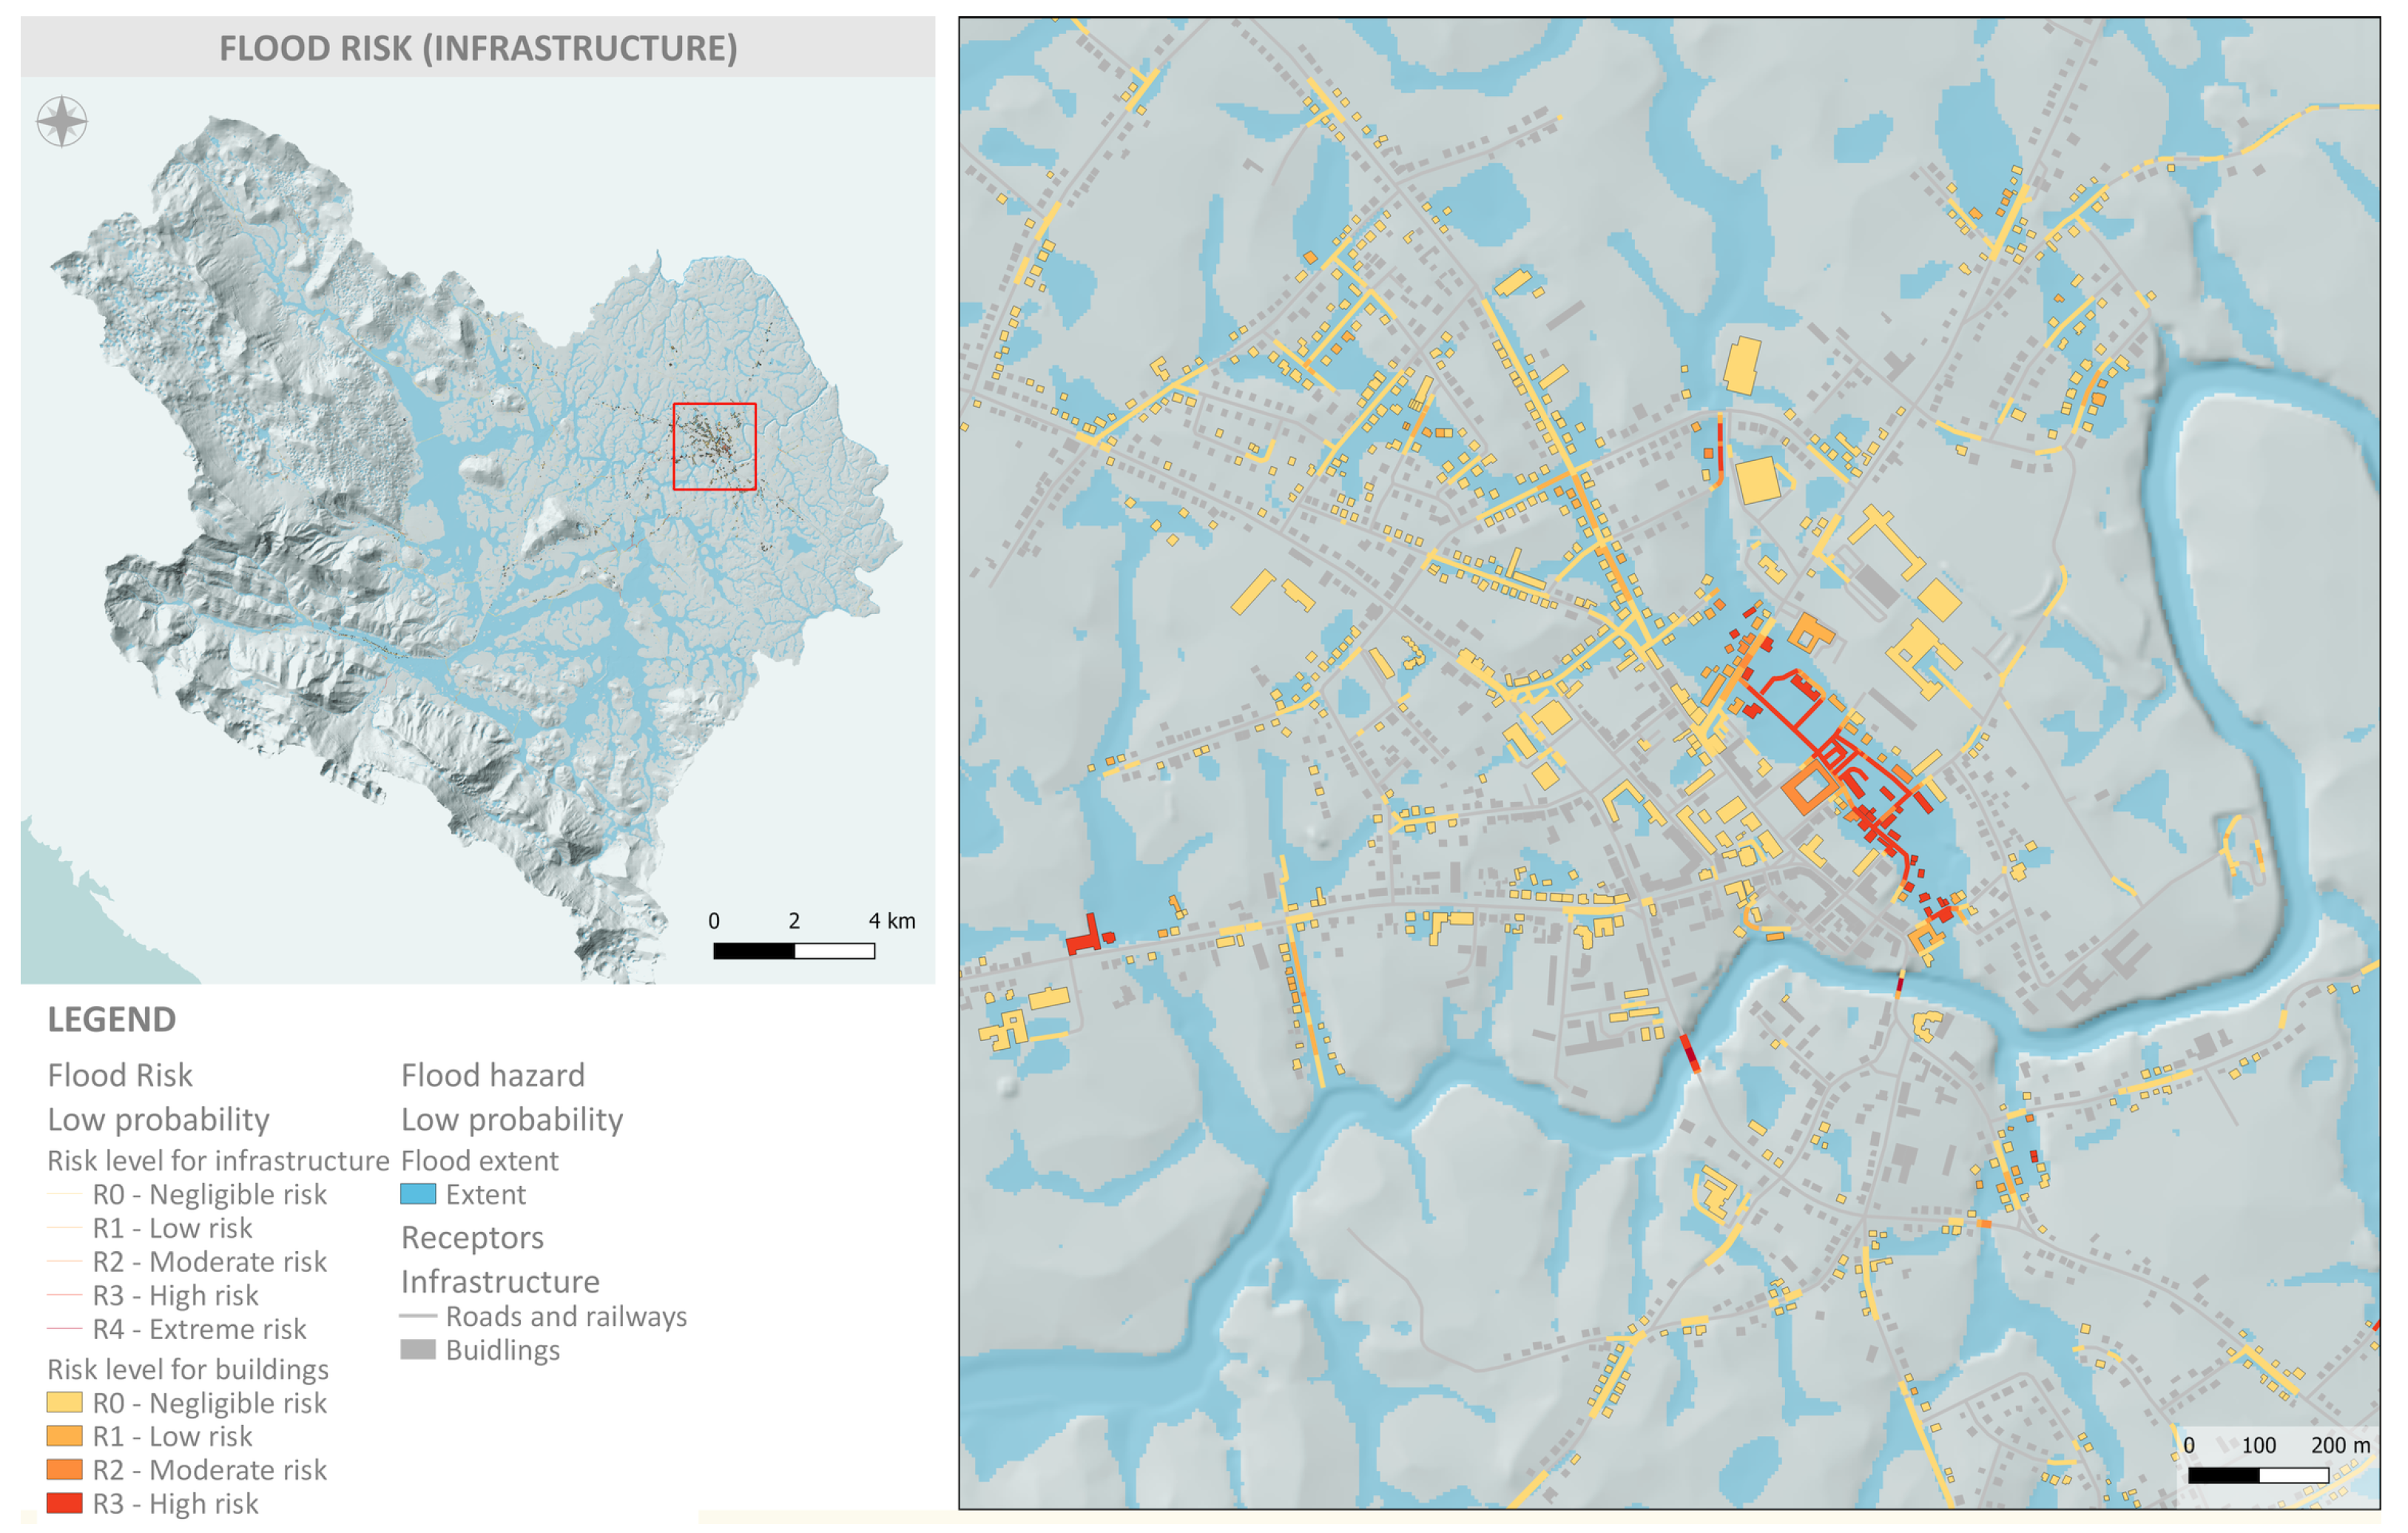
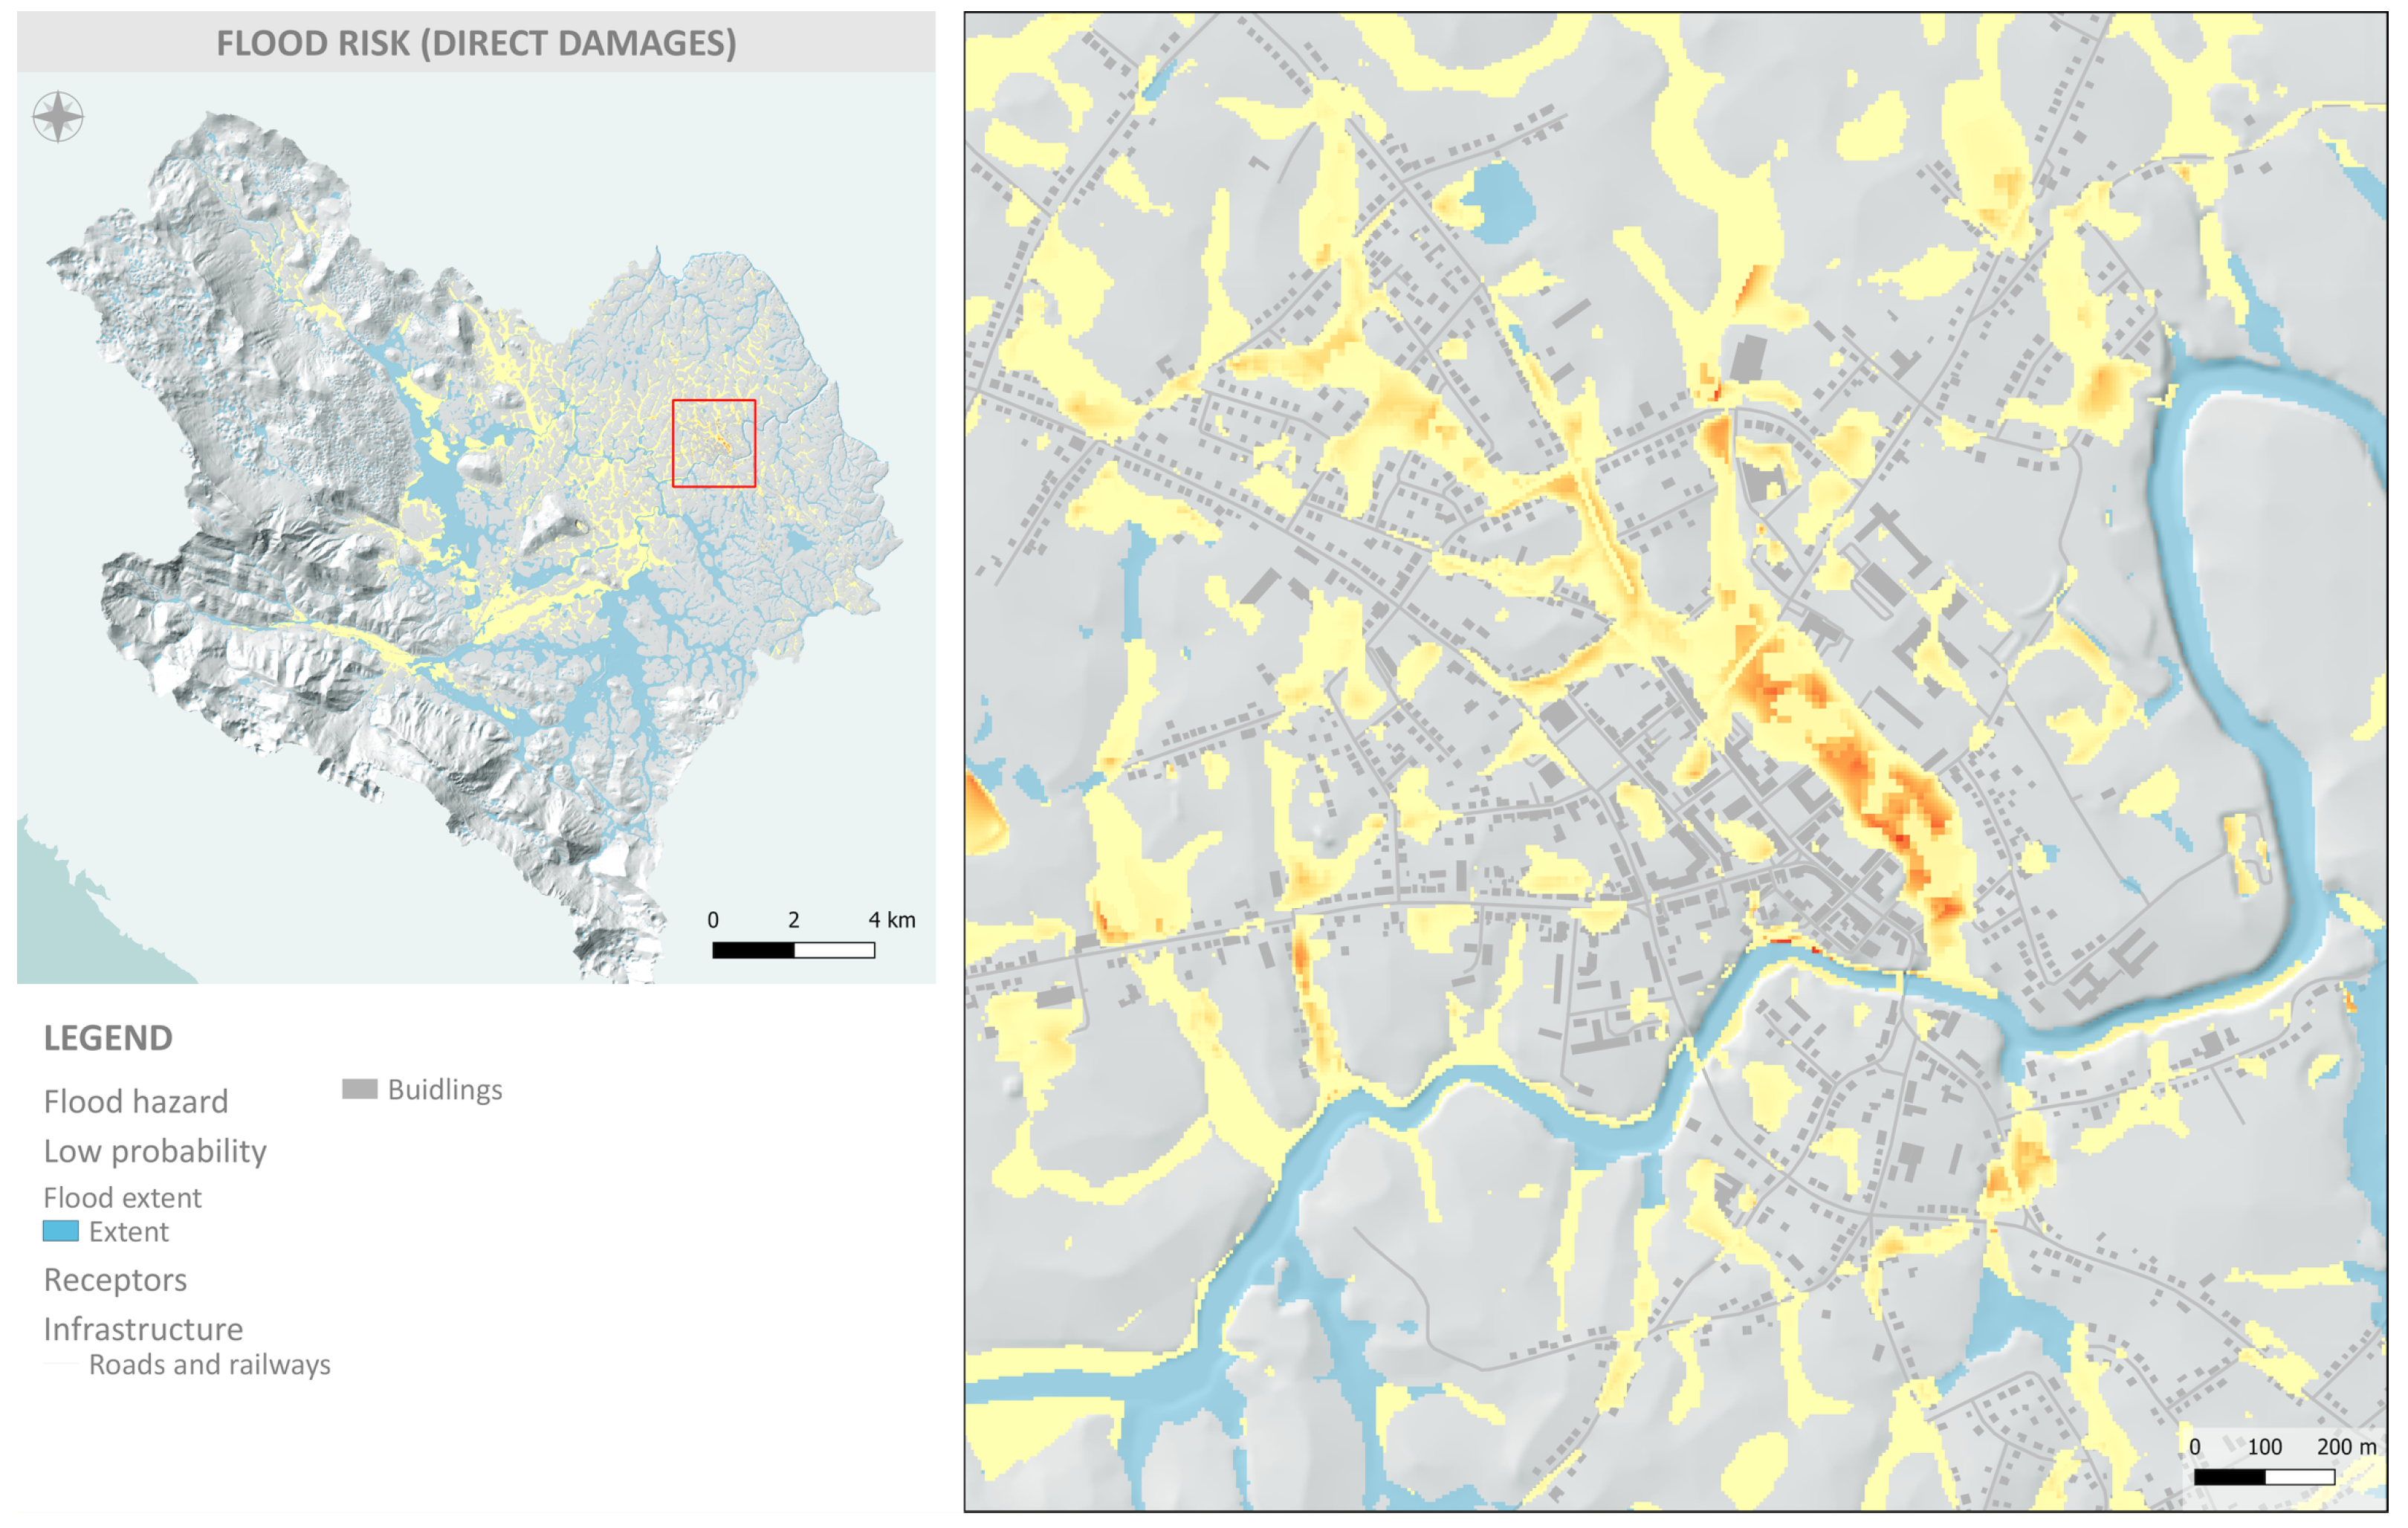
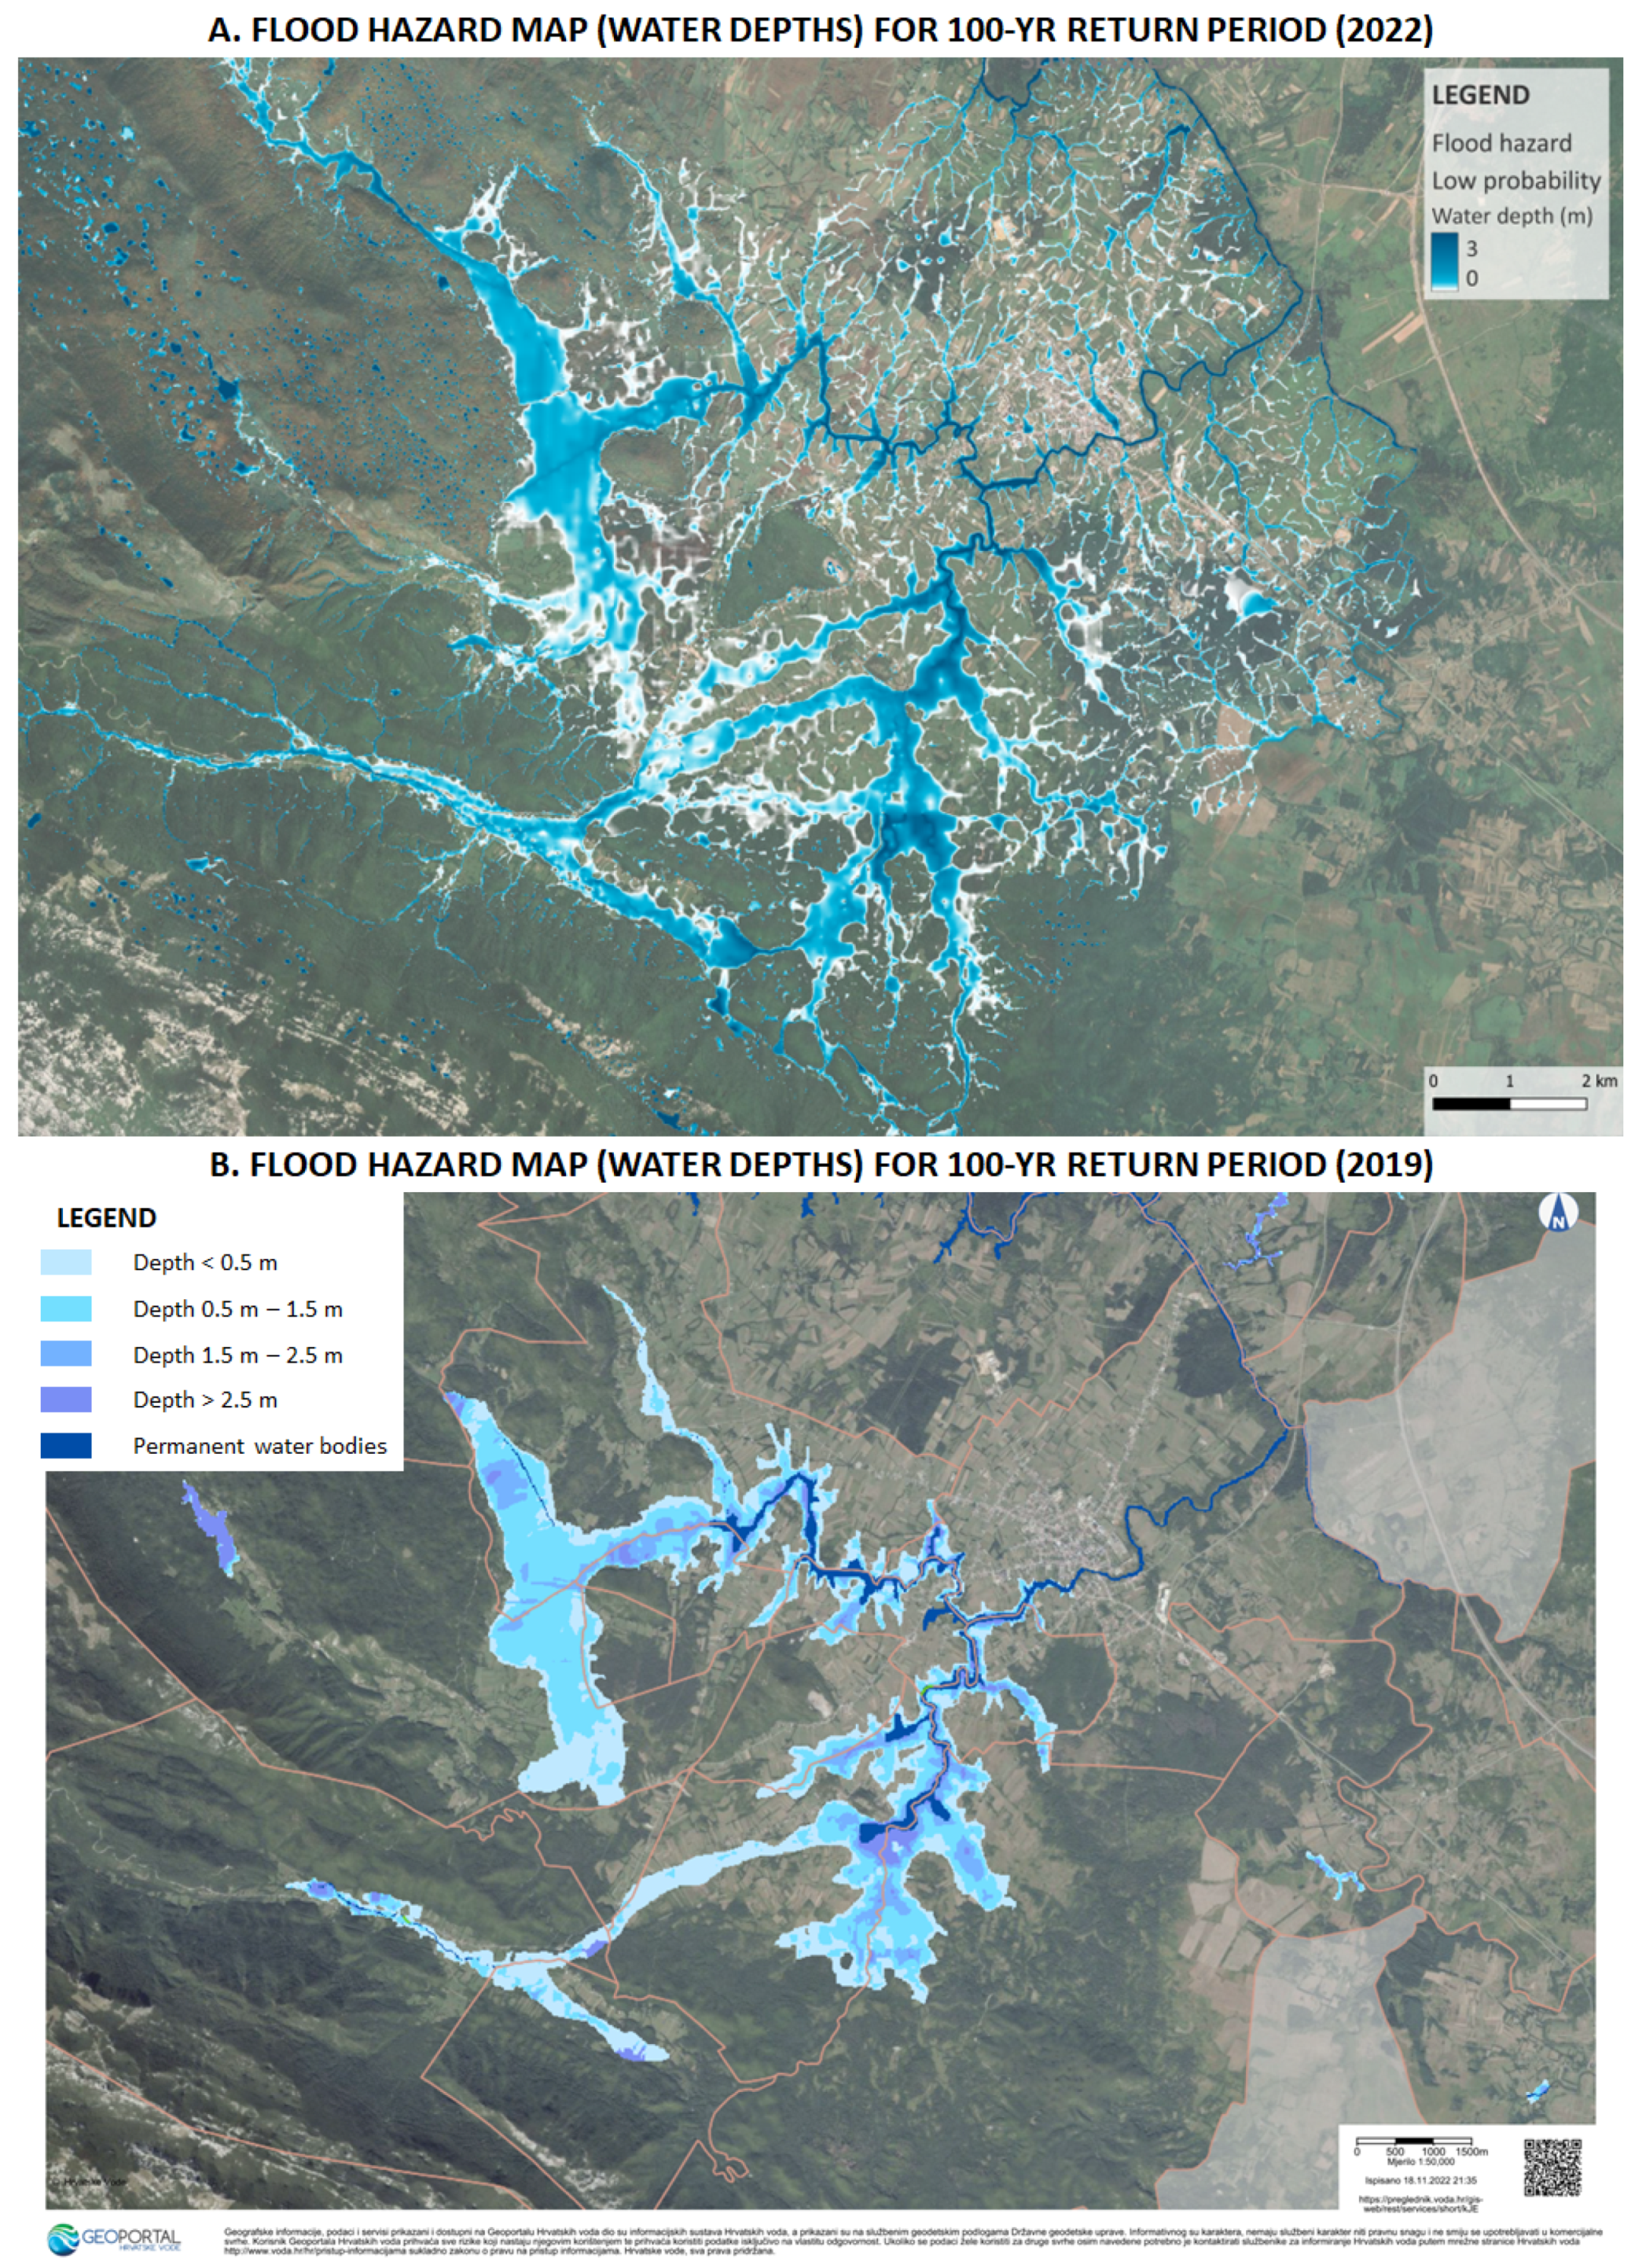
- Scenario L—low probability: describes a low probability of flooding, characterized by a higher extreme rainfall intensity, corresponding to a return period of 100 years or 1% AEP.
2.3.2. Rainfall Data
2.3.3. Spatial Data
2.3.4. Hydrologic–Hydraulic Model
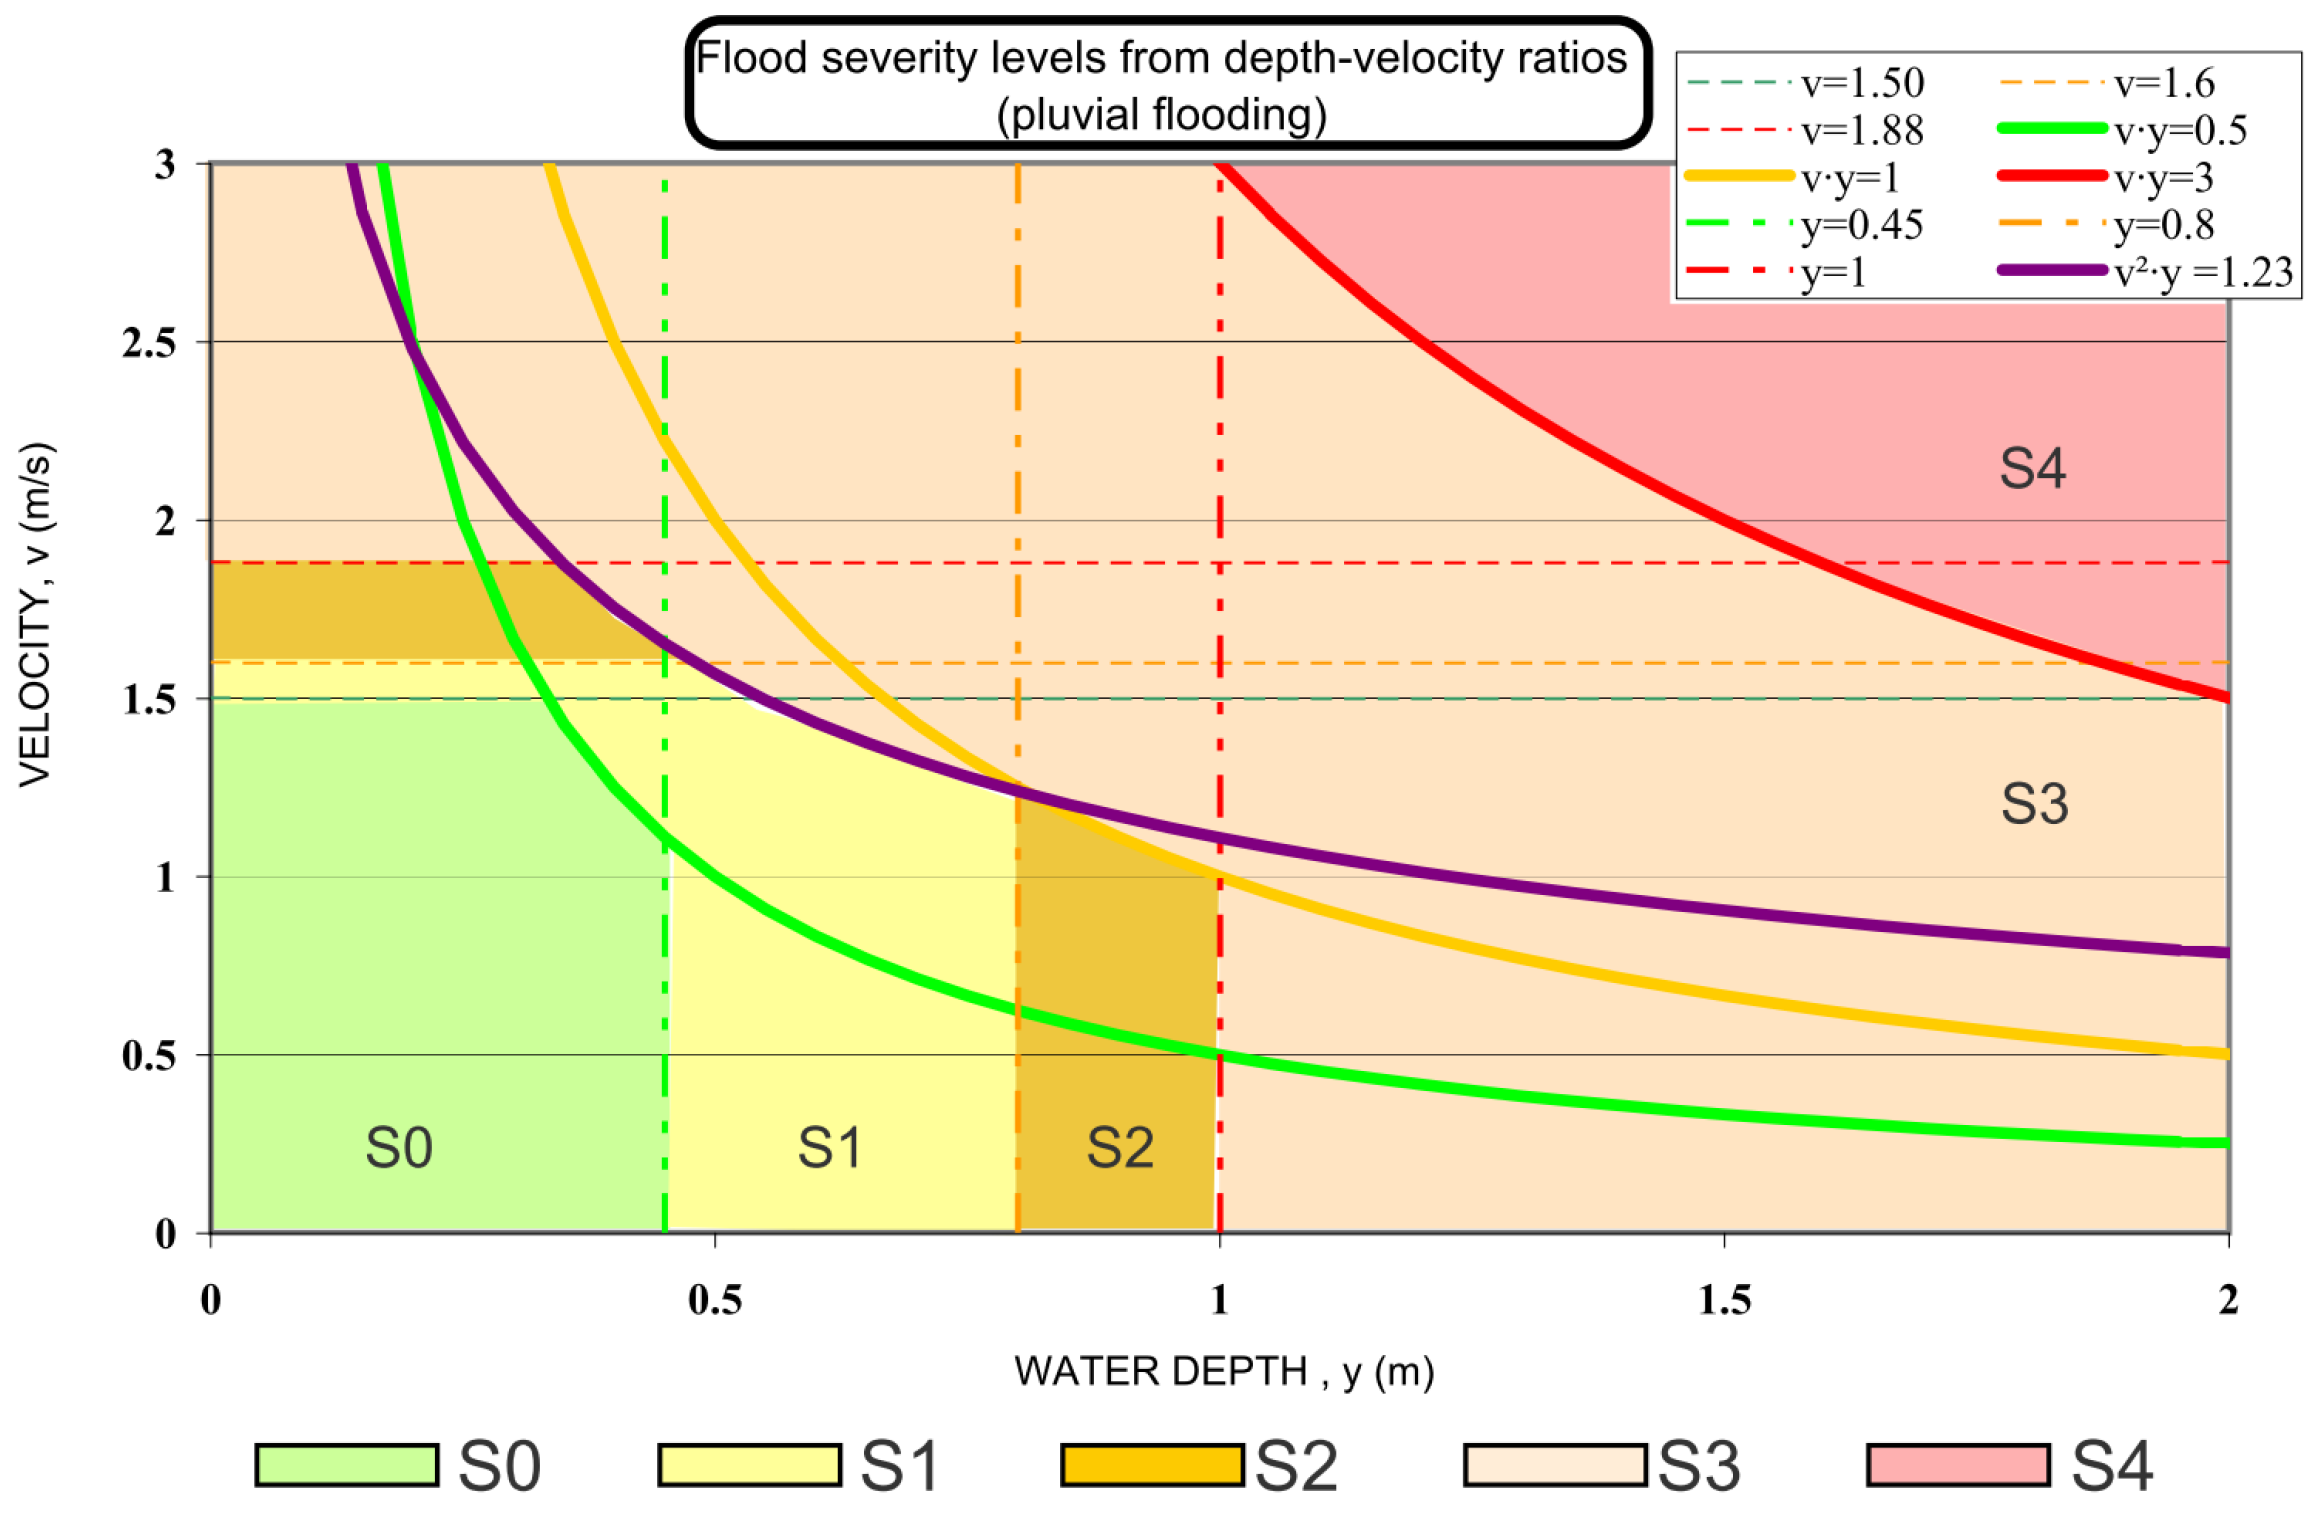
2.3.5. Flood Severity Analysis
2.4. Vulnerability Analysis
2.5. Flood Risk Analysis
2.6. Study Area
3. Results
3.1. Historical Floods
3.2. Pluvial Flash Flood Hazard
3.3. Exposure to Pluvial Flash Flooding
3.4. Pluvial Flash Flood Risk
4. Discussion
5. Conclusions
Author Contributions
Funding
Institutional Review Board Statement
Informed Consent Statement
Data Availability Statement
Conflicts of Interest
References
- UNDRR. Sendai Frameworkfor Disaster Risk Reduction 2015–2030; United Nations Office for Disaster Risk Reduction: Geneva, Switzerland, 2021. [Google Scholar]
- EEA. Climate Change, Impacts and Vulnerability in Europe 2016. An Indicator-Based Report (EEA Report No 1/2017); Technical Report; European Environment Agency Copenhagen: Copenhagen, Denmark, 2017. [Google Scholar]
- EEA. Climate Change Adaptation and Disaster Risk Reduction in Europe. Enhancing Coherence of the Knowledge Base, Policies and Practices (EEA Report No 15/2017); Technical Report; European Environment Agency Copenhagen: Copenhagen, Denmark, 2017. [Google Scholar]
- EEA. Flood Risks and Environmental Vulnerability—Exploring the Synergies between Floodplain Restoration, Water Policies and Thematic Policies (EEA Report No 1/2016); Technical Report; European Environment Agency Copenhagen: Copenhagen, Denmark, 2016. [Google Scholar]
- Tomar, P.; Singh, S.K.; Kanga, S.; Meraj, G.; Kranjčić, N.; Đurin, B.; Pattanaik, A. GIS-Based Urban Flood Risk Assessment and Management—A Case Study of Delhi National Capital Territory (NCT), India. Sustainability 2021, 13, 12850. [Google Scholar] [CrossRef]
- Di Baldassarre, G.; Kooy, M.; Kemerink, J.; Brandimarte, L. Towards understanding the dynamic behaviour of floodplains as human-water systems. Hydrol. Earth Syst. Sci. 2013, 17, 3235–3244. [Google Scholar] [CrossRef] [Green Version]
- Alfieri, L.; Burek, P.; Feyen, L.; Forzieri, G. Global warming increases the frequency of river floods in Europe. Hydrol. Earth Syst. Sci. 2015, 19, 2247–2260. [Google Scholar] [CrossRef] [Green Version]
- Yang, L.; Smith, J.A.; Wright, D.B.; Baeck, M.L.; Villarini, G.; Tian, F.; Hu, H. Urbanization and climate change: An examination of nonstationarities in urban flooding. J. Hydrometeorol. 2013, 14, 1791–1809. [Google Scholar] [CrossRef]
- Bednar-Friedl, B.; Biesbroek, R.; Schmidt, D.N. IPCC Sixth Assessment Report (AR6): Climate Change 2022-Impacts, Adaptation and Vulnerability: Regional Factsheet Europe; Technical Report; Intergovernmental Panel on Climate Change: Geneva, Switzerland, 2022. [Google Scholar]
- De Moel, H.d.; Van Alphen, J.; Aerts, J.C. Flood maps in Europe–methods, availability and use. Nat. Hazards Earth Syst. Sci. 2009, 9, 289–301. [Google Scholar] [CrossRef] [Green Version]
- Domeneghetti, A.; Carisi, F.; Castellarin, A.; Brath, A. Evolution of flood risk over large areas: Quantitative assessment for the Po river. J. Hydrol. 2015, 527, 809–823. [Google Scholar] [CrossRef]
- Albano, R.; Mancusi, L.; Abbate, A. Improving flood risk analysis for effectively supporting the implementation of flood risk management plans: The case study of “Serio” Valley. Environ. Sci. Policy 2017, 75, 158–172. [Google Scholar] [CrossRef]
- Heintz, M.D.; Hagemeier-Klose, M.; Wagner, K. Towards a risk governance culture in flood policy—Findings from the implementation of the “floods directive” in Germany. Water 2012, 4, 135–156. [Google Scholar] [CrossRef] [Green Version]
- Mysiak, J.; Testella, F.; Bonaiuto, M.; Carrus, G.; De Dominicis, S.; Ganucci Cancellieri, U.; Firus, K.; Grifoni, P. Flood risk management in Italy: Challenges and opportunities for the implementation of the EU Floods Directive (2007/60/EC). Nat. Hazards Earth Syst. Sci. 2013, 13, 2883–2890. [Google Scholar] [CrossRef]
- Müller, U. Implementation of the flood risk management directive in selected European countries. Int. J. Disaster Risk Sci. 2013, 4, 115–125. [Google Scholar] [CrossRef]
- Nones, M. Implementation of the floods directive in selected EU member states. Water Environ. J. 2015, 29, 412–418. [Google Scholar] [CrossRef]
- Molinari, D.; Minucci, G.; Mendoza, M.T.; Simonelli, T. Implementing the European “floods directive”: The case of the Po River Basin. Water Resour. Manag. 2016, 30, 1739–1756. [Google Scholar] [CrossRef]
- Nones, M.; Pescaroli, G. Implications of cascading effects for the EU Floods Directive. Int. J. River Basin Manag. 2016, 14, 195–204. [Google Scholar] [CrossRef]
- Priest, S.J.; Suykens, C.; Van Rijswick, H.F.; Schellenberger, T.; Goytia, S.; Kundzewicz, Z.W.; van Doorn-Hoekveld, W.J.; Beyers, J.C.; Homewood, S. The European Union approach to flood risk management and improving societal resilience: Lessons from the implementation of the Floods Directive in six European countries. Ecol. Soc. 2016, 21. [Google Scholar] [CrossRef] [Green Version]
- Mikša, K.; Kalinauskas, M.; Inácio, M.; Pereira, P. Implementation of the European Union Floods Directive—Requirements and national transposition and practical application: Lithuanian case-study. Land Use Policy 2021, 100, 104924. [Google Scholar] [CrossRef]
- Naulin, J.P.; Payrastre, O.; Gaume, E. Spatially distributed flood forecasting in flash flood prone areas: Application to road network supervision in Southern France. J. Hydrol. 2013, 486, 88–99. [Google Scholar] [CrossRef] [Green Version]
- Yin, J.; Yu, D.; Yin, Z.; Liu, M.; He, Q. Evaluating the impact and risk of pluvial flash flood on intra-urban road network: A case study in the city center of Shanghai, China. J. Hydrol. 2016, 537, 138–145. [Google Scholar] [CrossRef] [Green Version]
- David, A.; Schmalz, B. Flood hazard analysis in small catchments: Comparison of hydrological and hydrodynamic approaches by the use of direct rainfall. J. Flood Risk Manag. 2020, 13, e12639. [Google Scholar] [CrossRef]
- Falconer, R.H.; Cobby, D.; Smyth, P.; Astle, G.; Dent, J.; Golding, B. Pluvial flooding: New approaches in flood warning, mapping and risk management. J. Flood Risk Manag. 2009, 2, 198–208. [Google Scholar] [CrossRef]
- Archer, D.; Fowler, H. Characterising flash flood response to intense rainfall and impacts using historical information and gauged data in Britain. J. Flood Risk Manag. 2018, 11, S121–S133. [Google Scholar] [CrossRef]
- Hall, J.; Arheimer, B.; Borga, M.; Brázdil, R.; Claps, P.; Kiss, A.; Kjeldsen, T.; Kriaučiūnienė, J.; Kundzewicz, Z.W.; Lang, M.; et al. Understanding flood regime changes in Europe: A state-of-the-art assessment. Hydrol. Earth Syst. Sci. 2014, 18, 2735–2772. [Google Scholar]
- Mejía, A.I.; Moglen, G.E. Impact of the spatial distribution of imperviousness on the hydrologic response of an urbanizing basin. Hydrol. Process. 2010, 24, 3359–3373. [Google Scholar] [CrossRef]
- Popa, M.C.; Peptenatu, D.; Drăghici, C.C.; Diaconu, D.C. Flood hazard mapping using the flood and flash-flood potential index in the Buzău River catchment, Romania. Water 2019, 11, 2116. [Google Scholar] [CrossRef] [Green Version]
- Samela, C.; Persiano, S.; Bagli, S.; Luzzi, V.; Mazzoli, P.; Humer, G.; Reithofer, A.; Essenfelder, A.; Amadio, M.; Mysiak, J.; et al. Safer_RAIN: A DEM-based hierarchical filling-&-Spilling algorithm for pluvial flood hazard assessment and mapping across large urban areas. Water 2020, 12, 1514. [Google Scholar]
- Bout, v.B.; Jetten, V. The validity of flow approximations when simulating catchment-integrated flash floods. J. Hydrol. 2018, 556, 674–688. [Google Scholar] [CrossRef]
- Costabile, P.; Costanzo, C.; Ferraro, D.; Barca, P. Is HEC-RAS 2D accurate enough for storm-event hazard assessment? Lessons learnt from a benchmarking study based on rain-on-grid modeling. J. Hydrol. 2021, 603, 126962. [Google Scholar] [CrossRef]
- Cea, L.; Bladé, E. A simple and efficient unstructured finite volume scheme for solving the shallow water equations in overland flow applications. Water Resour. Res. 2015, 51, 5464–5486. [Google Scholar] [CrossRef] [Green Version]
- Fernández-Pato, J.; Caviedes-Voullième, D.; García-Navarro, P. Rainfall/runoff simulation with 2D full shallow water equations: Sensitivity analysis and calibration of infiltration parameters. J. Hydrol. 2016, 536, 496–513. [Google Scholar] [CrossRef]
- Mihu-Pintilie, A.; Cîmpianu, C.I.; Stoleriu, C.C.; Pérez, M.N.; Paveluc, L.E. Using high-density LiDAR data and 2D streamflow hydraulic modeling to improve urban flood hazard maps: A HEC-RAS multi-scenario approach. Water 2019, 11, 1832. [Google Scholar] [CrossRef] [Green Version]
- Kastridis, A.; Kirkenidis, C.; Sapountzis, M. An integrated approach of flash flood analysis in ungauged Mediterranean watersheds using post-flood surveys and unmanned aerial vehicles. Hydrol. Process. 2020, 34, 4920–4939. [Google Scholar] [CrossRef]
- Bellos, V.; Papageorgaki, I.; Kourtis, I.; Vangelis, H.; Kalogiros, I.; Tsakiris, G. Reconstruction of a flash flood event using a 2D hydrodynamic model under spatial and temporal variability of storm. Nat. Hazards 2020, 101, 711–726. [Google Scholar] [CrossRef]
- Diakakis, M.; Deligiannakis, G.; Antoniadis, Z.; Melaki, M.; Katsetsiadou, N.; Andreadakis, E.; Spyrou, N.; Gogou, M. Proposal of a flash flood impact severity scale for the classification and mapping of flash flood impacts. J. Hydrol. 2020, 590, 125452. [Google Scholar] [CrossRef]
- Costache, R.; Pham, Q.B.; Sharifi, E.; Linh, N.T.T.; Abba, S.I.; Vojtek, M.; Vojteková, J.; Nhi, P.T.T.; Khoi, D.N. Flash-flood susceptibility assessment using multi-criteria decision making and machine learning supported by remote sensing and GIS techniques. Remote Sens. 2019, 12, 106. [Google Scholar] [CrossRef] [Green Version]
- Janizadeh, S.; Avand, M.; Jaafari, A.; Phong, T.V.; Bayat, M.; Ahmadisharaf, E.; Prakash, I.; Pham, B.T.; Lee, S. Prediction success of machine learning methods for flash flood susceptibility mapping in the Tafresh watershed, Iran. Sustainability 2019, 11, 5426. [Google Scholar] [CrossRef] [Green Version]
- Arabameri, A.; Saha, S.; Chen, W.; Roy, J.; Pradhan, B.; Bui, D.T. Flash flood susceptibility modeling using functional tree and hybrid ensemble techniques. J. Hydrol. 2020, 587, 125007. [Google Scholar] [CrossRef]
- Band, S.S.; Janizadeh, S.; Chandra Pal, S.; Saha, A.; Chakrabortty, R.; Melesse, A.M.; Mosavi, A. Flash flood susceptibility modeling using new approaches of hybrid and ensemble tree-based machine learning algorithms. Remote Sens. 2020, 12, 3568. [Google Scholar] [CrossRef]
- Costache, R.; Ngo, P.T.T.; Bui, D.T. Novel ensembles of deep learning neural network and statistical learning for flash-flood susceptibility mapping. Water 2020, 12, 1549. [Google Scholar] [CrossRef]
- Pham, B.T.; Avand, M.; Janizadeh, S.; Phong, T.V.; Al-Ansari, N.; Ho, L.S.; Das, S.; Le, H.V.; Amini, A.; Bozchaloei, S.K.; et al. GIS based hybrid computational approaches for flash flood susceptibility assessment. Water 2020, 12, 683. [Google Scholar] [CrossRef] [Green Version]
- Escuder-Bueno, I.; Castillo-Rodríguez, J.T.; Zechner, S.; Jöbstl, C.; Perales-Momparler, S.; Petaccia, G. A quantitative flood risk analysis methodology for urban areas with integration of social research data. Nat. Hazards Earth Syst. Sci. 2012, 12, 2843–2863. [Google Scholar] [CrossRef]
- Bodoque, J.M.; Amérigo, M.; Díez-Herrero, A.; García, J.A.; Cortés, B.; Ballesteros-Cánovas, J.A.; Olcina, J. Improvement of resilience of urban areas by integrating social perception in flash-flood risk management. J. Hydrol. 2016, 541, 665–676. [Google Scholar] [CrossRef] [Green Version]
- Michielsen, A.; Kalantari, Z.; Lyon, S.W.; Liljegren, E. Predicting and communicating flood risk of transport infrastructure based on watershed characteristics. J. Environ. Manag. 2016, 182, 505–518. [Google Scholar] [CrossRef] [PubMed]
- Wagenaar, D.; De Bruijn, K.; Bouwer, L.; De Moel, H. Uncertainty in flood damage estimates and its potential effect on investment decisions. Nat. Hazards Earth Syst. Sci. 2016, 16, 1–14. [Google Scholar] [CrossRef]
- Muñoz, P.; Orellana-Alvear, J.; Willems, P.; Célleri, R. Flash-flood forecasting in an Andean mountain catchment—development of a step-wise methodology based on the random forest algorithm. Water 2018, 10, 1519. [Google Scholar] [CrossRef] [Green Version]
- Song, T.; Ding, W.; Wu, J.; Liu, H.; Zhou, H.; Chu, J. Flash flood forecasting based on long short-term memory networks. Water 2019, 12, 109. [Google Scholar] [CrossRef] [Green Version]
- Wu, J.; Liu, H.; Wei, G.; Song, T.; Zhang, C.; Zhou, H. Flash flood forecasting using support vector regression model in a small mountainous catchment. Water 2019, 11, 1327. [Google Scholar] [CrossRef] [Green Version]
- Spyrou, C.; Varlas, G.; Pappa, A.; Mentzafou, A.; Katsafados, P.; Papadopoulos, A.; Anagnostou, M.N.; Kalogiros, J. Implementation of a nowcasting hydrometeorological system for studying flash flood events: The Case of Mandra, Greece. Remote Sens. 2020, 12, 2784. [Google Scholar] [CrossRef]
- Rapant, P.; Kolejka, J. Dynamic pluvial flash flooding hazard forecast using weather radar data. Remote Sens. 2021, 13, 2943. [Google Scholar] [CrossRef]
- Zanchetta, A.D.; Coulibaly, P. Recent advances in real-time pluvial flash flood forecasting. Water 2020, 12, 570. [Google Scholar] [CrossRef] [Green Version]
- Albano, R.; Mancusi, L.; Sole, A.; Adamowski, J. Collaborative strategies for sustainable EU flood risk management: FOSS and geospatial tools—challenges and opportunities for operative risk analysis. ISPRS Int. J. -Geo-Inf. 2015, 4, 2704–2727. [Google Scholar] [CrossRef]
- EC. EU overview of methodologies used in preparation of flood hazard and flood risk maps. Final report. 2016. [Google Scholar]
- Barbalić, D.; Sanja, B.; Biondić, D.; Pavković, I.; Vukmanić, L. Upravljanje rizicima od poplava. Karte opasnosti od poplava i karte rizika od poplava—2019. 2019. (In Croatian). Available online: https://voda.hr/hr/karte-opasnosti-od-poplava-i-karte-rizika-od-poplava-2019 (accessed on 1 November 2022).
- Samuels, P.; Gouldby, B.; Klijn, F.; Messner, F.; van Os, A.; Sayers, P.; Schanze, J.; Udale-Clarke, H. Language of Risk—Project Definitions; Floodsite Project Report T32-04-01; HR: Wallingford, UK, 2009. [Google Scholar]
- Schanze, J. Pluvial flood risk management: An evolving and specific field. J. Flood Risk Manag. 2018, 11, 227–229. [Google Scholar] [CrossRef]
- Arrighi, C.; Brugioni, M.; Castelli, F.; Franceschini, S.; Mazzanti, B. Flood risk assessment in art cities: The exemplary case of Florence (Italy). J. Flood Risk Manag. 2018, 11, S616–S631. [Google Scholar] [CrossRef]
- Krvavica, N.; Rubinić, J. Evaluation of design storms and critical rainfall durations for flood prediction in partially urbanized catchments. Water 2020, 12, 2044. [Google Scholar] [CrossRef]
- Cordery, I.; Pilgrim, D.; Rowbottom, I. Time patterns of rainfall for estimating design floods on a frequency basis. Water Sci. Technol. 1984, 16, 155–165. [Google Scholar] [CrossRef]
- Hay, G.J.; Castilla, G. Geographic Object-Based Image Analysis (GEOBIA): A New Name for a New Discipline; Springer: Berlin/Heidelberg, Germany, 2008; pp. 75–89. [Google Scholar]
- Hay, G.J.; Blaschke, T. Geographic object-based image analysis (GEOBIA). Photogramm. Eng. Remote Sens. 2010, 76, 121. [Google Scholar]
- Maxwell, A.E.; Strager, M.P.; Warner, T.A.; Ramezan, C.A.; Morgan, A.N.; Pauley, C.E. Large-area, high spatial resolution land-cover mapping using random forests, GEOBIA, and NAIP orthophotography: Findings and recommendations. Remote Sens. 2019, 11, 1409. [Google Scholar] [CrossRef] [Green Version]
- Jozdani, S.E.; Johnson, B.A.; Chen, D. Comparing deep neural networks, ensemble classifiers, and support vector machine algorithms for object-based urban land-use/land-cover classification. Remote Sens. 2019, 11, 1713. [Google Scholar] [CrossRef] [Green Version]
- Šiljeg, A.; Panđa, L.; Domazetović, F.; Marić, I.; Gašparović, M.; Borisov, M.; Milošević, R. Comparative Assessment of Pixel and Object-Based Approaches for Mapping of Olive Tree Crowns Based on UAV Multispectral Imagery. Remote Sens. 2022, 14, 757. [Google Scholar] [CrossRef]
- Strand, G.H. Accuracy of the Copernicus High-Resolution Layer Imperviousness Density (HRL IMD) Assessed by Point Sampling within Pixels. Remote Sens. 2022, 14, 3589. [Google Scholar] [CrossRef]
- Burek, P.; Bianchi, A.; Gentile, A. A Pan-European Data Set for Hydrological Modelling; Joint Research Center: Ispra, Italy, 2014. [Google Scholar]
- Babister, M.; Barton, C. Australian Rainfall and Runoff Revision Project 15: Two Dimensional Modelling in Urban and Rural Floodplains. Technical Report, Australian Rainfall and Runoff Report; 2012. Available online: https://arr.ga.gov.au/__data/assets/pdf_file/0019/40573/ARR_Project15_TwoDimensional_Modelling_DraftReport.pdf (accessed on 1 July 2022).
- Brunner, G.W. HEC-RAS 2D User’s Manual; Technical Report; USACE Hydrologic Engineering Center: Davis, CA, USA, 2022.
- NRCS, U. National Engineering Handbook: Part 630—Hydrology; USDA Soil Conservation Service: Washington, DC, USA, 2004.
- Hong, Y.; Adler, R. Estimation of global SCS curve numbers using satellite remote sensing and geospatial data. Int. J. Remote Sens. 2008, 29, 471–477. [Google Scholar] [CrossRef]
- Grimaldi, S.; Petroselli, A.; Arcangeletti, E.; Nardi, F. Flood mapping in ungauged basins using fully continuous hydrologic–hydraulic modeling. J. Hydrol. 2013, 487, 39–47. [Google Scholar] [CrossRef]
- Merz, B.; Thieken, A.; Gocht, M. Flood risk mapping at the local scale: Concepts and challenges. In Flood risk management in Europe; Springer: Berlin/Heidelberg, Germany, 2007; pp. 231–251. [Google Scholar]
- Tsakiris, G. Flood risk assessment: Concepts, modeling, applications. Nat. Hazards Earth Syst. Sci. 2014, 14, 1361–1369. [Google Scholar] [CrossRef] [Green Version]
- Huizinga, J.; De Moel, H.; Szewczyk, W. Global Flood Depth-Damage Functions: Methodology and the Database with Guidelines; Technical Report; Joint Research Centre (Seville site): Ispra, Italy, 2017. [Google Scholar]
- Othmer, F.J.; Becker, D.; Schulte, L.M.; Greiving, S. A Methodological Approach to Municipal Pluvial Flood Risk Assessment Based on a Small City Case Study. Sustainability 2020, 12, 10487. [Google Scholar] [CrossRef]
- Rumbach, A. Disaster governance in small urban places: Issues, trends, and concerns. In Disaster Governance in Urbanising Asia; Springer: Berlin/Heidelberg, Germany, 2016; pp. 109–125. [Google Scholar]
- Birkmann, J.; Welle, T.; Solecki, W.; Lwasa, S.; Garschagen, M. Boost resilience of small and mid-sized cities. Nature 2016, 537, 605–608. [Google Scholar] [CrossRef] [PubMed]
- UIH. Prostorni Plan Uređenja Grada Gospića (In Croatian). 2005. Available online: https://www.gospic.hr/PPUGG/Prostorni%20plan/Prostorni_plan_uredenja_Grada_Gospica_11-2005.PDF (accessed on 1 July 2022).


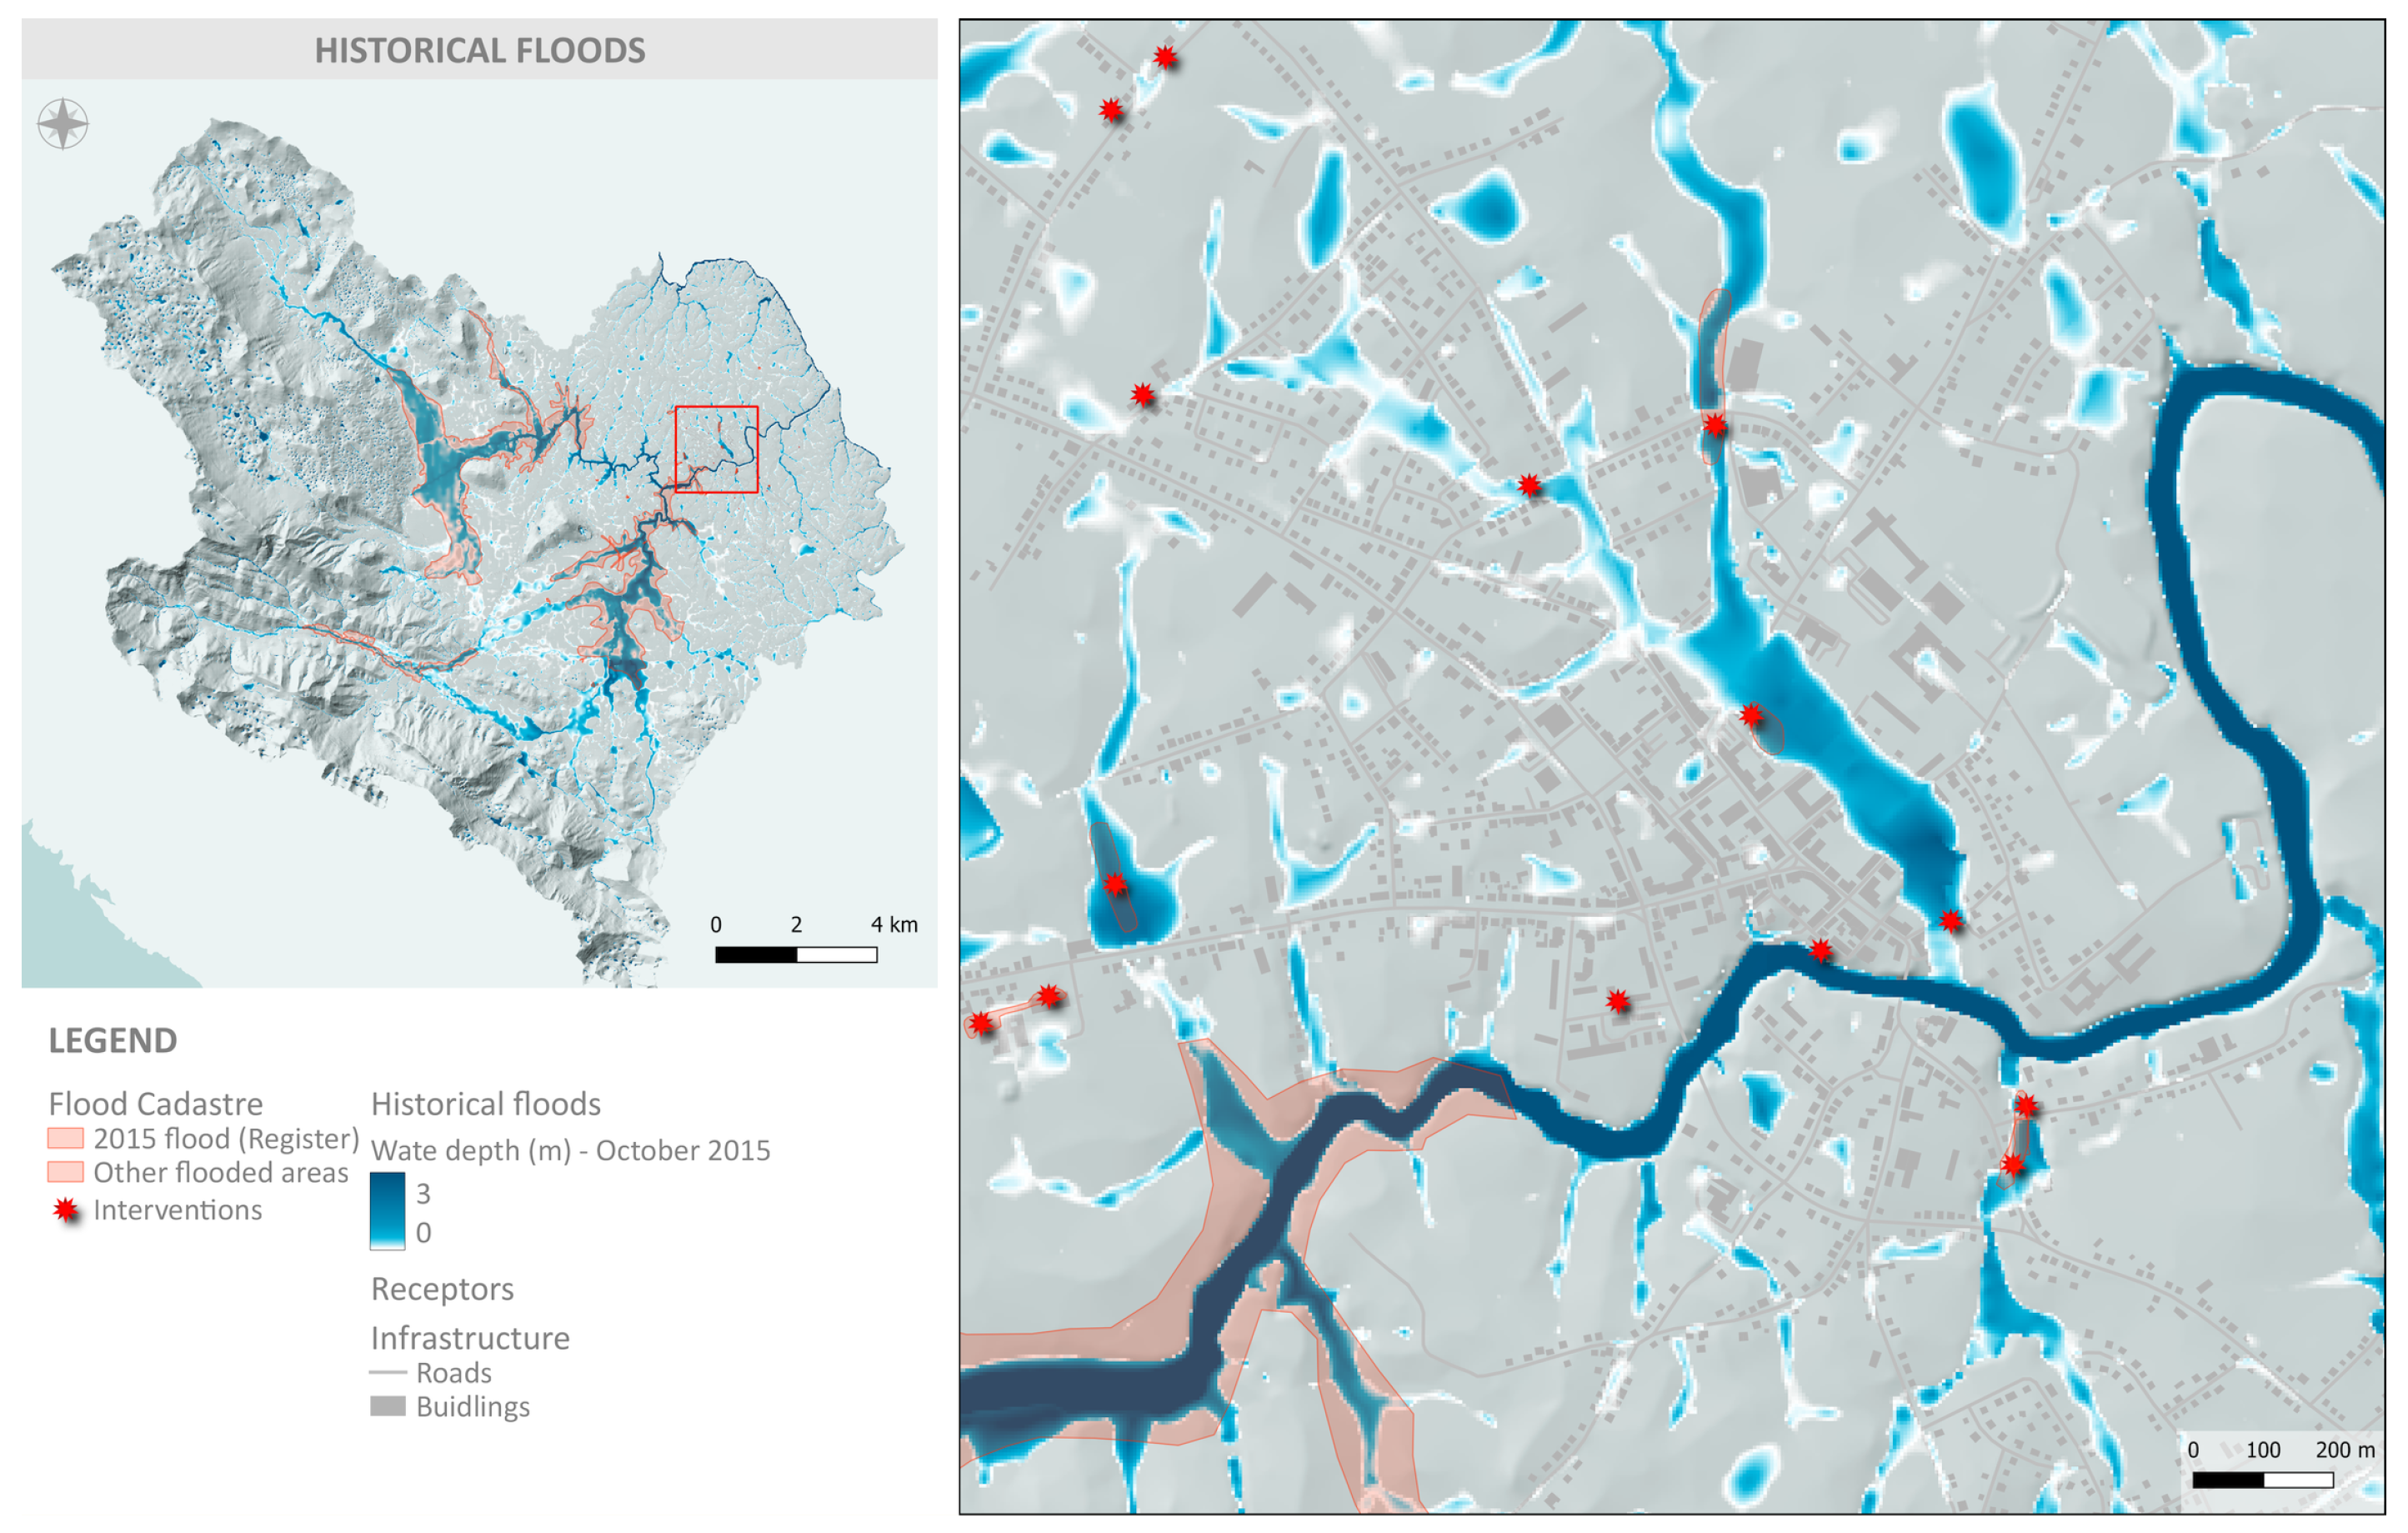

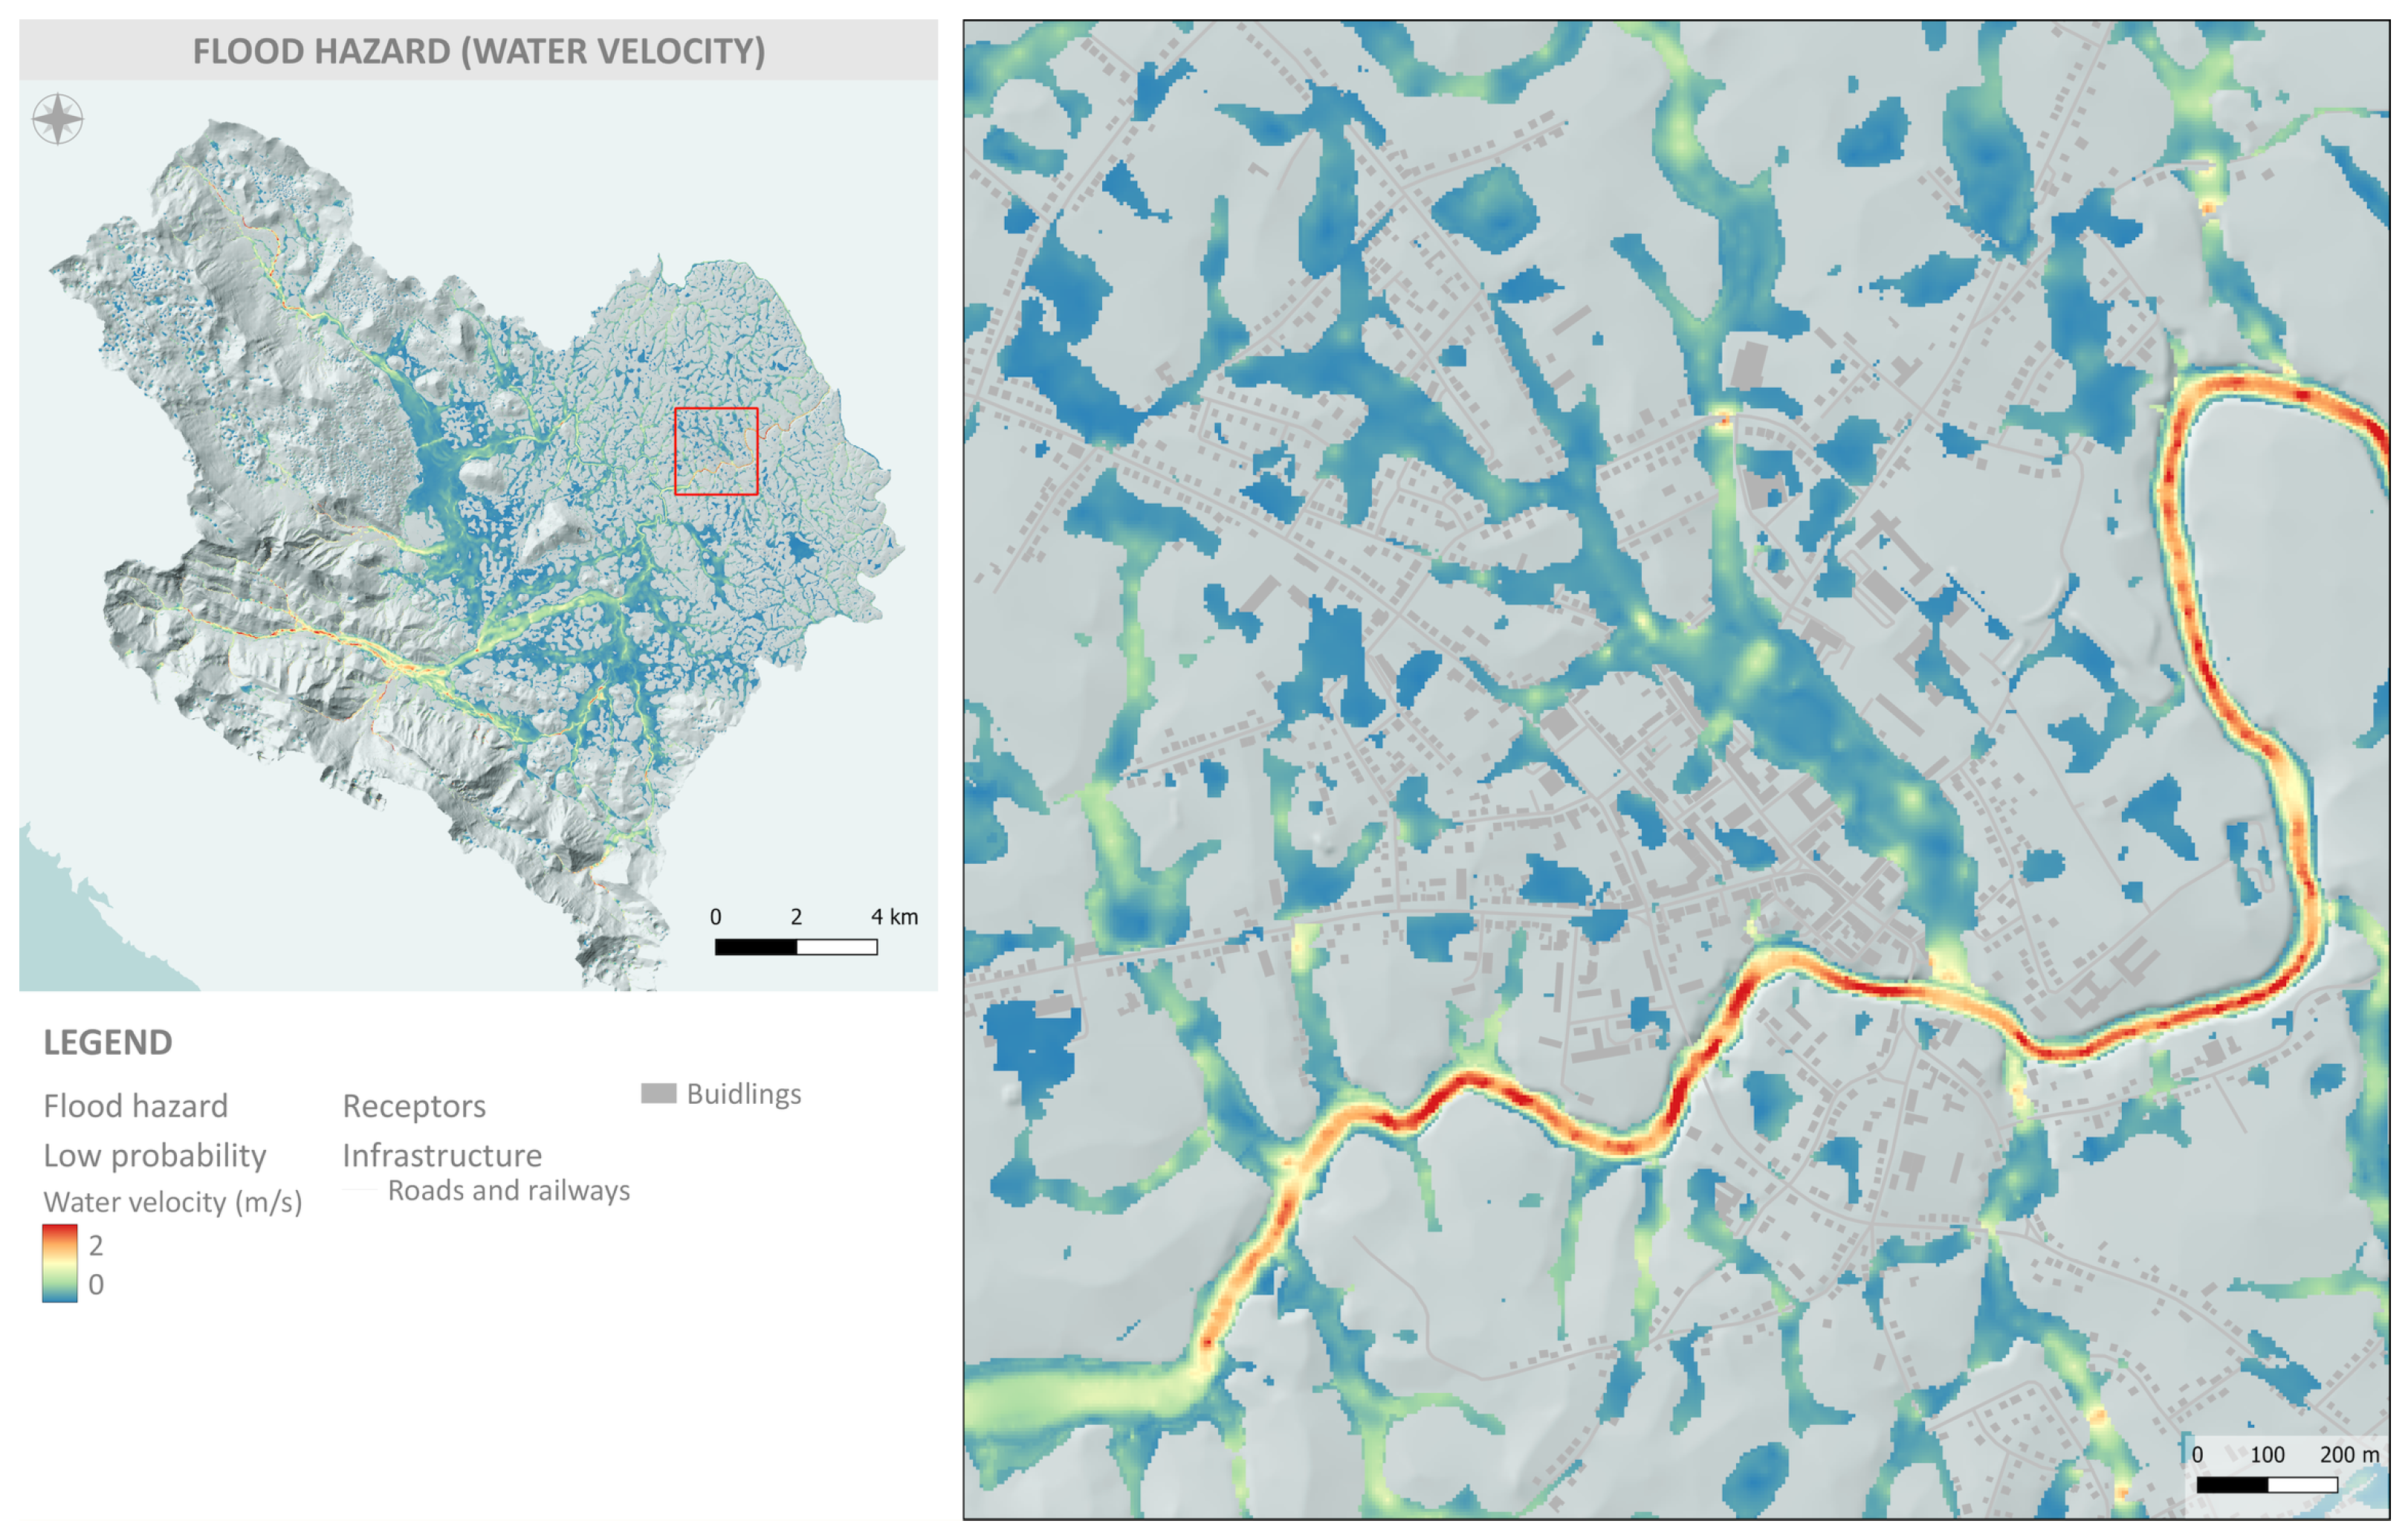
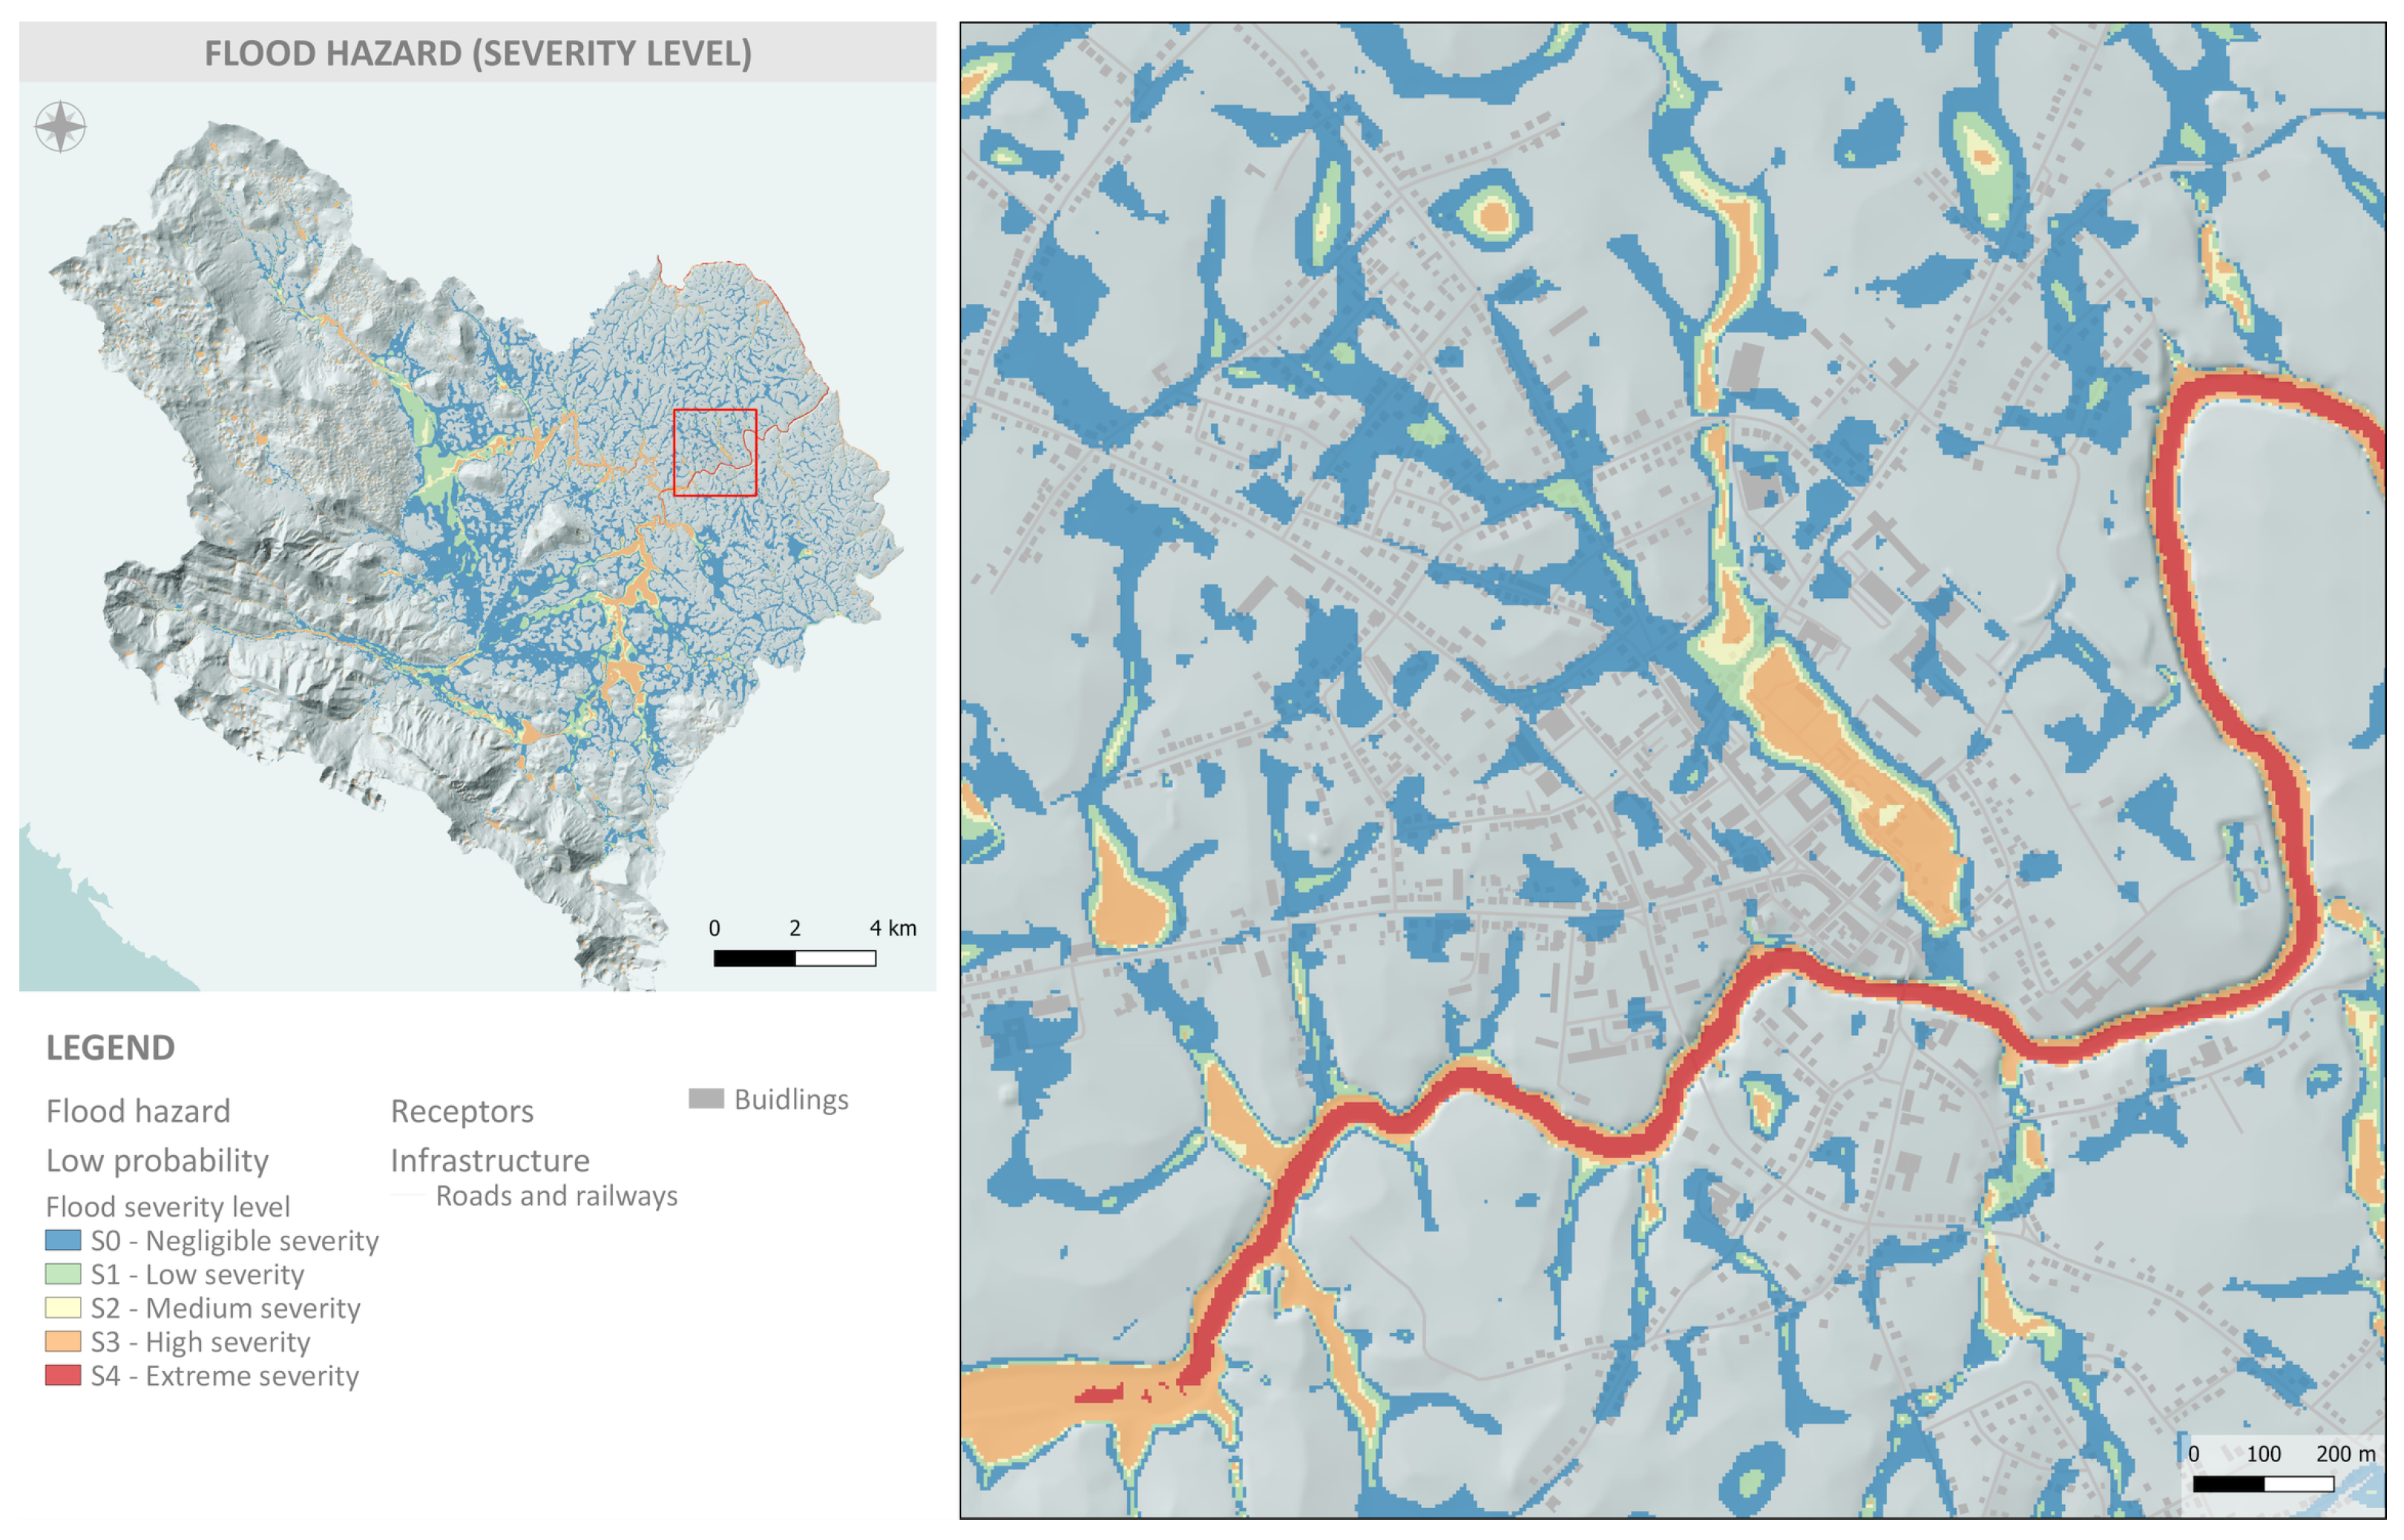


| Type of Analysis | Methods | Results/Maps |
|---|---|---|
| Hazard | 2D hydrologic–hydraulic modeling of surface flow | Water depth, water velocity, and flood severity. |
| Vulnerability | GIS exposure analysis | Exposure of population, buildings, road network, land, public facilities, pollution sources, cultural heritage, and protected areas. |
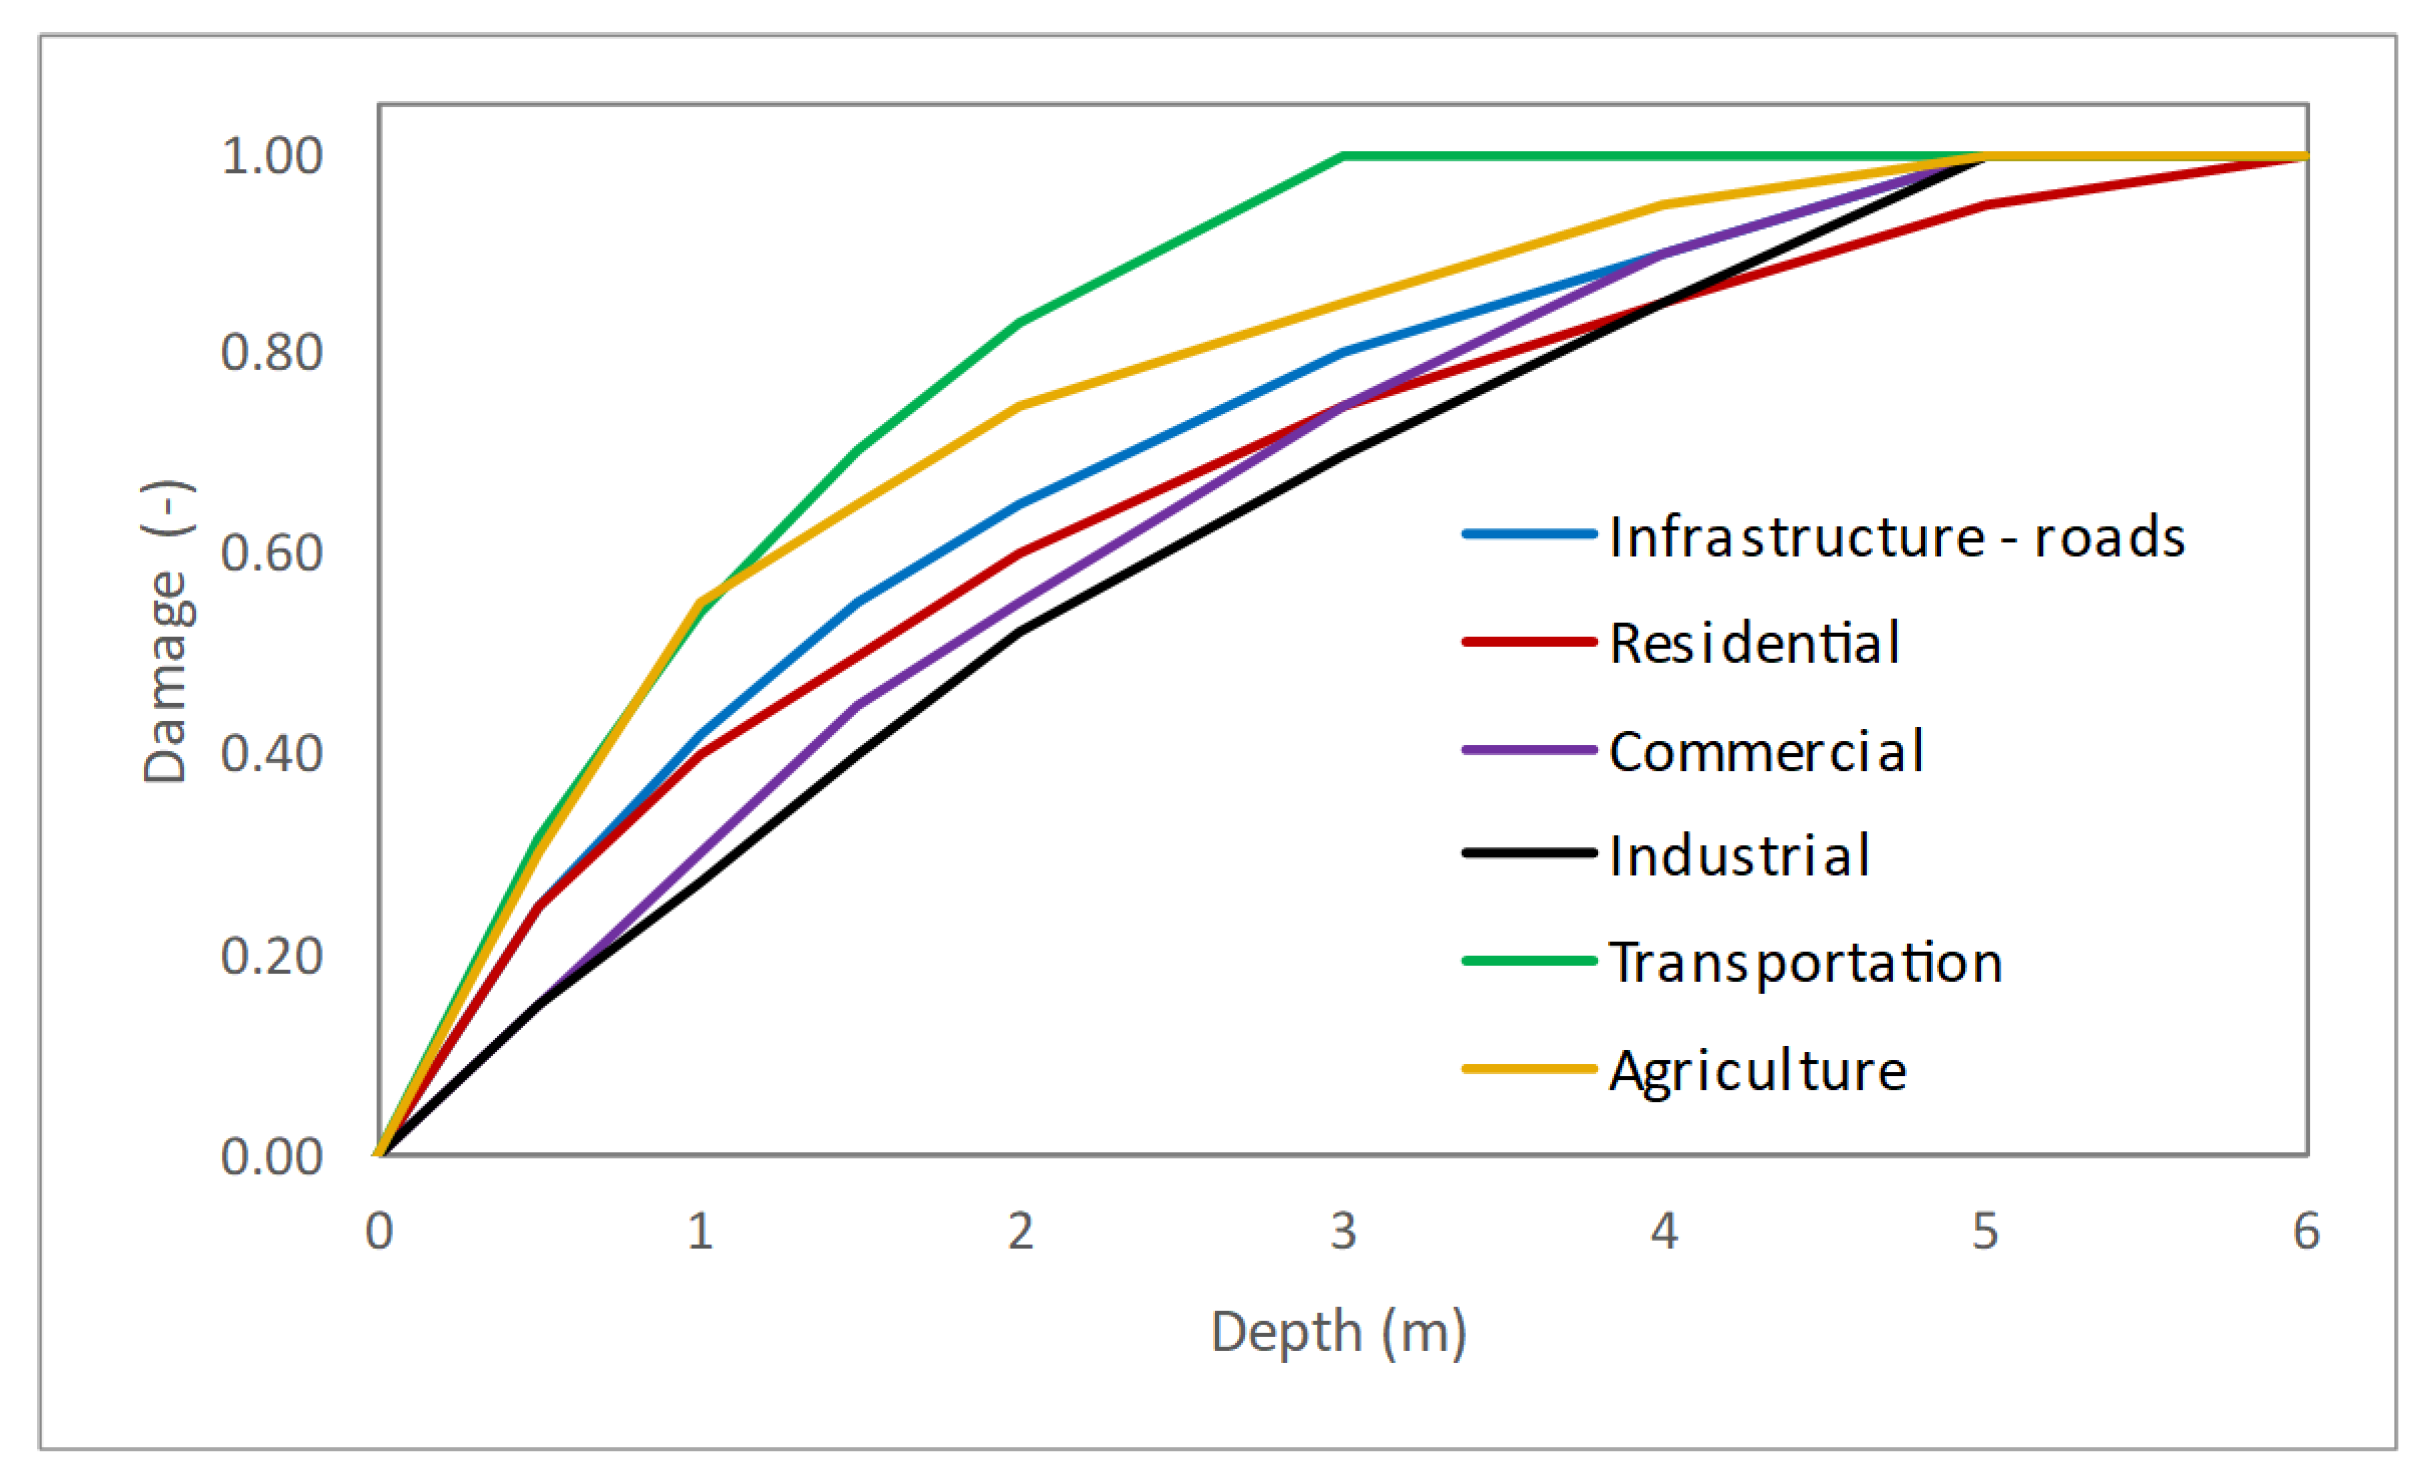
| Susceptibility assessment | Depth–damage curves and maximum potential damages for land-use. | |
| Risk | GIS qualitative analysis | Risk level to the population, buildings, and roads. |
| GIS quantitative analysis | Risk of damage expressed in monetary terms. |
| Data | Type | Source |
|---|---|---|
| Digital terrain model (DTM) | Raster, 5 m resolution | Interpolated vector elevation data obtained from the State Geodetic Administration of the Republic of Croatia (DGU) |
| Land-cover | Raster, 10 m resolution | Created from satellite imagery (Sentinel 2) using GEOBIA, European Space Agency. |
| Imperviousness density | Raster, 5 m resolution (upsampled from 10 m) | Imperviousness density (IMD), Copernicus Land Monitoring Service |
| Surface roughness | Raster, 5 m resolution (upsampled from 10 m) | Generated from the land-cover using appropriate Manning’s roughness coefficient data from the literature |
| Soil infiltration | Raster, 5 m resolution (upsampled from 10 m) | Generated from the land-cover using appropriate CN data from the literature (SCS method) |
| Land-Cover Class | Manning’s | CN | |||
|---|---|---|---|---|---|
| n (ms) | A | B | C | D | |
| Low-density fabric (IMD < 30%) | 0.099 | 39 | 59 | 72 | 80 |
| Dense urban fabric (IMD => 30–80%) | 0.135 | 68 | 80 | 87 | 90 |
| Continuous urban fabric (IMD => 80%) | 0.179 | 85 | 90 | 93 | 94 |
| Road networks and associated land | 0.026 | 98 | 98 | 98 | 98 |
| Gravel and dirt roads | 0.032 | 69 | 80 | 85 | 88 |
| Agro-forestry | 0.093 | 49 | 69 | 79 | 84 |
| Abandoned crops with natural vegetation | 0.049 | 67 | 80 | 87 | 91 |
| Complex cultivation patterns | 0.054 | 52 | 69 | 79 | 84 |
| Vineyards, fruit trees, and olive groves | 0.057 | 28 | 52 | 67 | 75 |
| Woods and forests | 0.138 | 38 | 62 | 75 | 81 |
| Natural grassland and meadows | 0.047 | 44 | 63 | 75 | 85 |
| Dry grassland | 0.048 | 49 | 69 | 79 | 84 |
| Mountain grassland | 0.048 | 23 | 49 | 63 | 71 |
| Transitional woodland and scrub | 0.093 | 40 | 61 | 73 | 79 |
| Scrubs | 0.091 | 45 | 65 | 75 | 80 |
| Sparse vegetation on rocks | 0.035 | 70 | 81 | 88 | 92 |
| Burnt areas (except burnt forest) | 0.032 | 70 | 81 | 88 | 92 |
| Bare rocks and outcrops | 0.034 | 70 | 81 | 88 | 92 |
| Inland marshes | 0.094 | 86 | 86 | 86 | 86 |
| Water bodies and surfaces | 0.026 | 100 | 100 | 100 | 100 |
| Channels | 0.035 | 77 | 85 | 90 | 91 |
| Flood Severity Level (S) | Depth y (m) | Velocity v (m/s) | Dragging Parameter (m2/s) | Sliding Parameter (m3/s2) | |
|---|---|---|---|---|---|
| S0 | Negligible severity. No fatalities are expected. People expected to survive. | <0.45 | <1.50 | <0.50 | <1.23 |
| S1 | Low severity. People may suffer loss of stability. People in danger. | <0.80 | <1.60 | <1.00 | <1.23 |
| S2 | Medium severity. Significant loss of stability. Cars can lose roadholding. Floating. | <1.00 | <1.88 | <1.00 | <1.23 |
| S3 | High severity. High risk for people outside. Low risk for buildings. | ≥1.00 | ≥1.88 | ≥1.00 | ≥1.23 |
| S4 | Extreme severity. Structural damages to buildings. | ≥1.00 | ≥1.88 | ≥3.00 | ≥1.23 |
| Data | Type | Source |
|---|---|---|
| Land-use | Raster, 5 m resolution (rasterized from polygons) | Natura 2000 (2018), Copernicus Land Monitoring Service. Corrected and upgraded with OpenStreetMap. |
| Building footprint | Vector, polygon | OpenStreetMap (OSM). |
| Road and railway network | Vector, polygon | OpenStreetMap (OSM). |
| Population | Vector, point | Number of inhabitants in each settlement spatially distributed over buildings. Croatian Bureau of Statistics. |
| Public services | Vector, point | Emergency services, education, transport, cemetery, Google Maps, and manual digitalization. |
| Facilities that can cause accidental pollution | Vector, point | Industrial facilities, SEVESO, gas stations, landfills, Ministry of Economy and Sustainable Development of the Republic of Croatia. |
| Protected areas | Vector, polygon | Protected areas, Natura 2000 sites, Ministry of Economy and Sustainable Development of the Republic of Croatia. |
| Cultural heritage | Vector, polygon | Ministry of Culture of the Republic of Croatia. |
Disclaimer/Publisher’s Note: The statements, opinions and data contained in all publications are solely those of the individual author(s) and contributor(s) and not of MDPI and/or the editor(s). MDPI and/or the editor(s) disclaim responsibility for any injury to people or property resulting from any ideas, methods, instructions or products referred to in the content. |
© 2023 by the authors. Licensee MDPI, Basel, Switzerland. This article is an open access article distributed under the terms and conditions of the Creative Commons Attribution (CC BY) license (https://creativecommons.org/licenses/by/4.0/).
Share and Cite
Krvavica, N.; Šiljeg, A.; Horvat, B.; Panđa, L. Pluvial Flash Flood Hazard and Risk Mapping in Croatia: Case Study in the Gospić Catchment. Sustainability 2023, 15, 1197. https://doi.org/10.3390/su15021197
Krvavica N, Šiljeg A, Horvat B, Panđa L. Pluvial Flash Flood Hazard and Risk Mapping in Croatia: Case Study in the Gospić Catchment. Sustainability. 2023; 15(2):1197. https://doi.org/10.3390/su15021197
Chicago/Turabian StyleKrvavica, Nino, Ante Šiljeg, Bojana Horvat, and Lovre Panđa. 2023. "Pluvial Flash Flood Hazard and Risk Mapping in Croatia: Case Study in the Gospić Catchment" Sustainability 15, no. 2: 1197. https://doi.org/10.3390/su15021197
APA StyleKrvavica, N., Šiljeg, A., Horvat, B., & Panđa, L. (2023). Pluvial Flash Flood Hazard and Risk Mapping in Croatia: Case Study in the Gospić Catchment. Sustainability, 15(2), 1197. https://doi.org/10.3390/su15021197


