Article

Panic Buying Behavior Analysis according to Consumer Income and Product Type during COVID-19

by
Irineu de Brito Junior
1,2,*,
Hugo Tsugunobu Yoshida Yoshizaki
2,3,
Flaviane Azevedo Saraiva
3,
Nathan de Campos Bruno
1,
Roberto Fray da Silva
4,
Celso Mitsuo Hino
3,
Larissa Limongi Aguiar
2 and
Isabella Marrey Ferreira de Ataide
2
1
Environmental Engineering Department, São Paulo State University, São José dos Campos 12247-004, Brazil
2
Graduate Program in Logistics Systems Engineering, University of São Paulo, São Paulo 05508-010, Brazil
3
Department of Production Engineering, University of São Paulo, São Paulo 05508-010, Brazil
4
Institute of Advanced Studies, University of São Paulo, São Paulo 05508-050, Brazil
*
Author to whom correspondence should be addressed.
Sustainability 2023, 15(2), 1228; https://doi.org/10.3390/su15021228
Submission received: 11 October 2022 / Revised: 25 November 2022 / Accepted: 8 December 2022 / Published: 9 January 2023

Abstract

:
In 2020, just before measures were established by governments to minimize the spread of SARS-CoV-2, such as social distancing, quarantine, lockdowns, and internal movement restrictions, people began to buy some products in quantities much superior to their regular needs. This behavior is called panic buying and is a typical human response in times of crisis and uncertainty. This study compares retail sale levels during the period in which panic purchases occurred to the sales levels before and after that period. We analyzed the sales of five groups of products from 144 stores of two major retailers in São Paulo, Brazil. Several regression models were used to evaluate the data obtained from demographic information, actual sales, per capita income, and product sales transactions. The results show that sales before, during, and after the panic buying period varied according to the product type and increased according to the average per capita income of each store’s influence area. These results may assist policymakers in introducing public policies and managing resources during a crisis that requires social distancing and lockdowns.

1. Introduction

In 2020, the COVID-19 pandemic, which originated in China and quickly spread over the globe, significantly changed the way individuals live [1]. Early in the pandemic, measures such as social distancing, quarantine, lockdowns, and internal movement restrictions were established by governments to reduce the spread of the SARS-CoV-2 virus. Just before these measures were officially established by the governments, but had already spread through mainstream media and social networks, consumers began to shop in panic [2,3,4,5,6,7].
This behavior is called “panic buying” (PB) or “hamster shopping” [8], and is a common human response in times of crisis and uncertainty. It is characterized by consumers buying large quantities of products, exceeding the necessary quantities for their needs [9]. This is behavior is enacted in order to mitigate the risk of future scarcities, due to a perceived possibility of running out of supplies or being unable to purchase them [10,11,12].
Episodes of PB tend to last for 7–10 days [13]. During this period, consumers behave in different ways and purchase different products and quantities. Rumors and misinformation regarding stockouts can influence individuals, creating confusion and excess buying [14,15], in turn inducing an adverse effect on consumer vulnerability [11,16]. In this period, higher-income people are better prepared than lower-income families [17], as the latter have less economic power to hoard materials [12].
During the initial period of the pandemic, in March 2020, when the quarantine and lockdowns were decreed (the COVID-19 breakout), there was even hysteria on the part of some consumers. People flocked to supermarkets and started to buy in panic, predominantly purchasing toilet paper, but several other products were also affected and had their consumption patterns changed, even causing shortages on supermarket shelves [18,19].
Since 2020, many studies on the subject have been published, mainly in the behavioral and consumer studies areas. Some papers have analyzed the amount purchased by the consumer before and during the PB period [12,20]. Other studies have analyzed the type of product purchased by consumers during PB, with an emphasis on toilet paper, due to the massive increase in purchases of this product [18]. However, studies exploring the most affected products and using real sales data and consumer behavior before, during, and after the PB period are scarce in the academic literature.
In 2020, one article [12] evaluated the magnitude of panic buying for toilet paper in the city of São Paulo during the COVID-19 breakout. The paper [12] concluded that PB is positively correlated to the average income level among different city neighborhoods: the higher the average income, the higher the PB effect. In this current work, the analysis is expanded to another four categories of consumer products. Additionally, the consumption patterns before, during, and after the breakout are analyzed. Measures and policies to minimize their effects are also discussed to help better prepare and address future periods of high uncertainty or widespread panic among consumers (which does not necessarily need to be related to pandemics).
In this study, we first evaluate whether there is a significant correlation between average income and buying behavior of five grocery categories (Food staples, Meat, Hygiene and cleansing, Toilet paper, and Candies) by applying regression models (the Candies category is included for comparison because it is not perceived as a type of product that generates PB and acts as a control group). Then, a dynamic evaluation is made in three different periods: before, during, and after the COVID-19 breakout. For each category, a t-test is applied to ascertain whether there are statistically significant differences between the average sales of the stores between the periods.
The research questions explored in this work are: (i) Is there a significant correlation between the products’ average sales during the PB period to the overall sample period of three months and the average per capita income considered in the store influence area? (ii) Are there statistically significant differences between the sales before, during and after the PB period by each product category?
The main contributions of this work are: (i) exploring whether PB sales of various product categories of several stores were correlated with the average per capita income of the store radius of influence; and (ii) comparing the sales of various product categories before, during, and after PB, according to income quartiles. Based on the analysis of the results, this article also discusses policies and actions that can be taken by the government, retailers, and consumers to guarantee access to goods and services during PB periods.
The following section presents the relevant literature; Section 3 describes the study’s materials and methods, and Section 4 outlines the data analysis and results. Finally, Section 5 presents the discussion, concluding remarks and opportunities for future research.

2. Literature Review

Publications on panic buying are fragmented across multiple disciplines [21]. The COVID-19 pandemic has been an essential topic in the scientific community because of its impacts and the different phenomena it caused. From the viewpoint of the consumer goods market, different behavior in consumption was observed in the early 2020s. This occurred due to the overwhelming coverage of the spread of the virus in the news and social media, which allowed the belief of a correlation between the pandemic and the panic shopping phenomenon.
For this paper, 63 other papers with similar and complementary themes to our research were selected from the Web of Science and Scopus (Search fields: Panic Buying, Hamster shopping, hoarding, stockpiling, COVID-19; connector OR ALL; data range 2020 to 2022). These were then analyzed and divided into seven categories: panic buying; income; products; behavior; kernel; supply chain, and social media.
In addition to this organization, a word cloud was produced using the “wordcloud” Python library. Figure 1 shows the most important terms in the articles researched, based on the terms in the abstracts, titles, and keywords. As expected, the terms with higher incidence were: “panic buying”, “consumer”, “COVID”, “pandemic”, and “stockpiling”.

2.1. PB and Consumer Behavior

The COVID-19 pandemic has brought about changes in consumption patterns and has impacted the supply chains of different products in various countries, influencing their resilience and consumption patterns [7,11,16].
The literature identifies the motivating elements that trigger panic purchases. Causes such as individual perception of threat or scarcity of products, fear of the unknown, and mimicking behavior are cited [15,22,23]. The studies also indicate an association of PB with factors of a survivalist nature [24] and in response to environmental stimuli and reflective thinking, so that perceptions of scarcity are stimulated by social influence, the awareness of exhaustion of resources and lack of control, in addition to the perception of the severity of the pandemic event [25,26]. Finally, some authors employ the theory of planned behavior (TPB) to investigate drivers of stockpiling behavior, revealing factors such as negative attitude (perceived barriers) and others’ behavior, that is, descriptive social norms [27] attitude, subjective norms and fear of future unavailability [28].
During the pandemic, PB behavior differs between countries and between cultures [26]. Consumers used technology as a tool for consumption activities and this may have accelerated some psychological reactions, anxiety, and panic by means of the influence of some feelings and opinions about product scarcity spread by social media [4,11]. The studies used information from tweets [4,29], from media reports [30], and even collected responses from social media users, to assess the perceived impact of media on PB behavior, finding positive statistical correlations [31]. In this line, factors influencing social media platforms were mainly indicated, such as uncertainties and insecurities, buying as persuasion, product unavailability, authorities communication, global logic, and expert opinion. Herd behavior is influenced more locally than globally [29].
During the COVID-19 pandemic, some reports investigated PB and behavior relationships by applying statistical techniques, such as stepwise regression analysis, bootstrapping, and robustness testing [32], as well as multiple regression models [33], multivariate statistics [34], big data [1] and regression models [6]. Studies have confirmed the influence on purchasing swings of factors such as fear of lockdown, peer buying, scarcity of basic goods on shelves, limited supply of essential supplies and social media fake news [34], government policies of intervention, lockdown and distancing [1], media, peers and friends [14]. Some studies also evaluated factors such as emotionality predicting the perceived threat of COVID-19, which in turn predicts the stock of products such as toilet paper, as well as materialism, the need to belong, and scarce consumption, so that when the pandemic enters its most serious stage, people show greater materialism to deal with the threat of death and, therefore, consume scarce goods [1].
PB behavior during the COVID-19 pandemic was observed in several countries, and the most reported events in the media were toilet paper stockpiling [4,18,33,35]. Some authors have investigated the occurrence of PB for products such as toilet paper, perishable and non-perishable products, and product lists containing items such as canned goods, rice, bottled water, pasta, bread, medicine, money, and alcohol, among others [12,20,35,36].
In this sense, one work [12] used regression analysis to investigate the relationship between the PB of toilet paper and per capita income in the city of São Paulo (Brazil) at the beginning of the COVID-19 pandemic. Another study [35] used data from interviews and multiple regression to investigate associations between hoarding during the COVID-19 pandemic and demographic and focal variables (such as social distancing), identifying the products most stocked by individuals: toilet paper followed by canned goods, rice, bottled water, pasta, bread, medicine, money, alcohol, gasoline, firewood, guns or other weapons, and gold or other precious metals.
In Spain, one study [20] analyzed consumer buying habits, before the COVID-19 pandemic and during the state of alarm, conducting consumer surveys via social media, and found answers on how purchase profiles changed, which products were most consumed and what the preferred form of consumption was (in-store or online). In China, in online surveys with Chinese consumers, one paper [37] studied correlations between hoarding behavior and rational and irrational factors, such as income, gender, and education, obtaining some answers about preferentially stocked products, for example, noting that the needs of storage for perishable foods such as vegetables and fruits are more sensitive than relatively non-perishable foods such as instant noodles.

2.2. PB and Public Policies

Studies on PB can contribute to governments’ response to pandemic disasters. In the literature, some authors discuss the importance of social trust, the dissemination of reliable information in the media, the definition of a cooperation strategy with retailers, and the need for mechanisms to protect vulnerable populations [4,12,15,32,38].
Government action is seen as necessary to inform people about which products can help them deal with the pandemic, to encourage retailers and establishments to digitally manage and share data in real-time [32], clarify false information [39], as well to issue advertisements aimed at combating panic, as it identifies public concerns on social media [4], reduces perceived scarcity and creates ways to take the pressure off scarce products [22]. Finally, the importance of considering the socio-economic factors of panic purchases and the needs of vulnerable populations is also discussed, defining protection mechanisms to assure food security to disadvantaged populations [40], such as cash and voucher programs and in-kind donations, as well as rationing policies and quota measures in cooperation with vendors [12,32,38].

2.3. PB and Income

At the beginning of the COVID-19 pandemic, the item most commonly sought was toilet paper, mainly due to the unprecedented media attention on the stockpiling of this product [35]. Non-linear methods for regression were used to infer the income of social media users and conclude that posts from higher-income users express greater fear and anger [41].
One study [12] detected a positive correlation between average income per capita and toilet paper PB. This behavior has been evidenced through the news media [42,43]. Some papers have studied the influence of income on products at the beginning of the pandemic. Fruits, for example, were considered less essential. In China, only people with high incomes displayed hoarding behavior in buying fruits, which indicates that fruits are less essential than other foods [37]. Other papers have considered the change in consumer behavior due to changes in financial situations and reduced monthly income. Lowest-income consumers preferred private label products, which are usually less expensive [7].
The increase in demand for food staples and household supplies was evaluated during the pre-lockdown period in the United Kingdom. The authors detected large increases in the demand for products, such as food staples and household supplies, in the days before the lockdown. Households and the average quantity bought by wealthier households were larger than the others [44]. The authors also detected that the average quantities increased, families bought more frequently than usual and vulnerable households failed to access the products they required.
In contrast, in the paper by Micalizzi et al. [35], income was not significantly associated with stockpiling. They conducted a survey on 361 workers recruited from Amazon’s Mechanical Turk, in which 67% of the sample held a bachelor’s degree or higher.

3. Materials and Methods

The methodology used in this research comprised four steps: data collection, processing, and validation; geocoding and geographic analysis; identification and selection of the periods; and statistical analysis. These are described in the following sections.

3.1. Data Collection, Processing, and Validation

The real sales data were obtained from a retail group composed of two large grocery chains spread in the city of São Paulo, with the second highest market share (brand intentionally omitted) in the region [45], encompassing 121 supermarkets and 23 supercenters. Data from all the stores from the two grocery chains were collected. These retailer formats were chosen because no stockouts were detected during the period in these stores. The occurrence of stockouts and, consequently, missing values, in convenience format stores [46] did not allow for PB analysis due to the lack of relevant data during the period analyzed. The following variables were collected: date of sale, location of the store, product category, quantity sold, sale value, and daily sale price.
Based on [44] and [47], the sales data of all stores were then grouped into 5 categories, representing different product groups with different buying behavior and consumption dynamics. These were:
  • Food staples [44] or food basket [47], comprising the products that make up the basic dry food diet in the region containing: sugar (2 types: white and crystal), rice, bean (2 types: pinto common and superior), pasta (2 types: traditional and noodle), and vegetable cooking oil;
  • Meat: comprising chicken (2 types: cooled and frozen) and beef;
  • Hygiene and cleansing: comprising bleach, disinfectant, and soap;
  • Toilet paper: adopted as a single category due to the relevance of the PB of this product during the COVID-19 pandemic and to the consumer´s stockpiling behavior [4,14,35].
  • Candies: selected as a baseline or comparison category, due to information from store professionals that no PB was detected in this category.
Comparisons were made in the periods before, during, and after the COVID-19 breakout, considering an equivalent number of days for each period. A historical price data analysis was carried out to verify possible influences on the increase or decrease during the period. Significant variations were not detected, and this assumption was discarded for the products and stores analyzed. Data regarding local income were obtained from the latest official census in Brazil [48], for the city of São Paulo, at a census sector (a few blocks) level.

3.2. Geocoding and Geographic Analysis

The megacity of São Paulo has an estimated 12.3 million inhabitants. It is a city with huge divergences in its social indicators across its different geographic regions. The central region of the city has better indicators regarding income distribution, housing, and education than the peripheral regions of the city [49].
The central region concentrates most of the population while the southern region has a very low population density. A geographic information system was used to estimate the average per capita income within each store radius of influence. For each retailer, we established the store primary radius of influence, where approximately 60–70% of its customers are concentrated, according to academic studies on the São Paulo market [50,51]. For supermarkets, the radius considered was 1 km and for supercenters, 2 km.
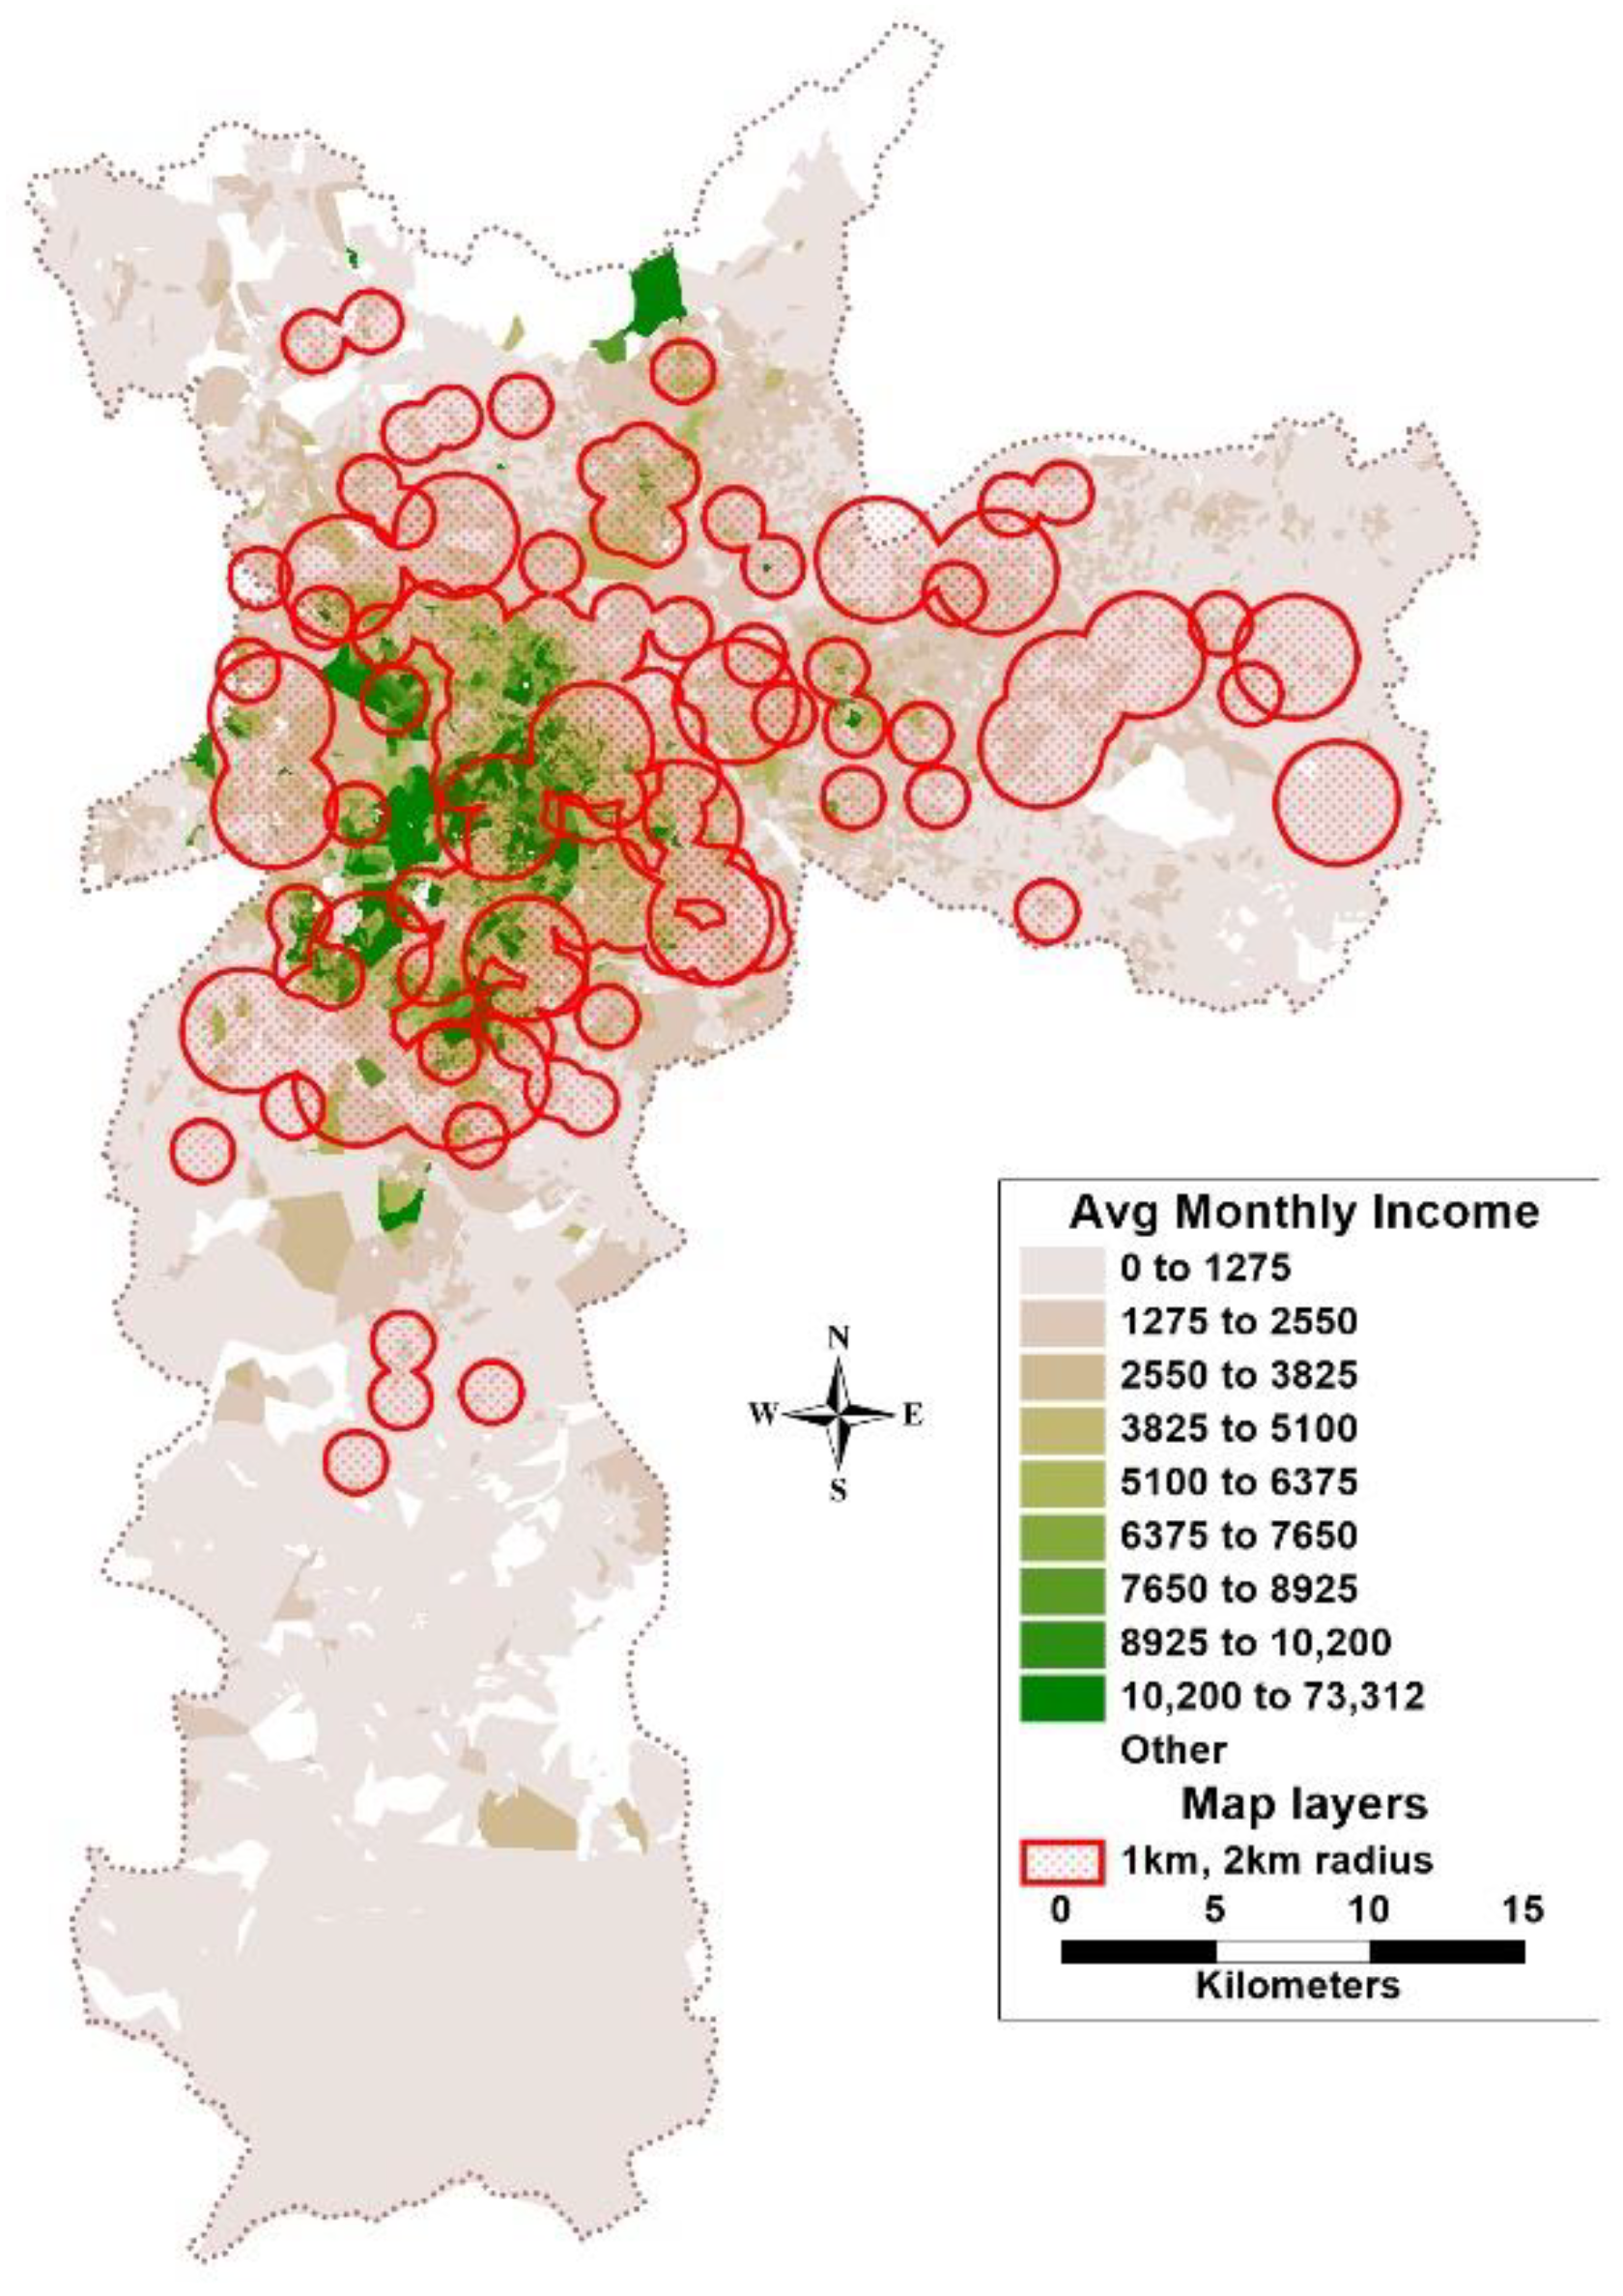
Figure 2 shows the Sao Paulo city map and the influence zones of all stores (red dots) superimposed for the spatial distribution of average monthly per capita income by census sector in the urban area of São Paulo. From the map, these radii of influence area cover a significant ratio (approximately 54%) of the city’s total inhabitants and the full range of income. The low coverage of stores in the southern part of the city is due to the low population density in the area.
In the retailers’ area of influence, the monthly per capita income varies between (Brazilian Real) BRL 770 (USD 435) in peripherical areas and BRL 10,889 (USD 6178) in the central region, according to the last census average exchange. The 144 stores were ordered according to the average income in the catchment area and then divided into quartiles to represent the monthly income ranges, as shown in Table 1:

3.3. Identifying the Analysis Periods

The sales data cover a period of 90 days, between 24 February and 24 May 2020, and a 10 day period is considered for the PB period: 12 March to 21 March (denominated “during”). This date coincides with the WHO’s declaration of the coronavirus pandemic (11 March 2020). Preliminary analyses mentioned a considerable increase in sales from 12 March on.
Starting from the identified PB period, the pre- and post- COVID-19 breakout periods were defined, considering the same days of the week in all periods, to avoid periods with daily seasonality effects on sales. The pre-COVID-19 breakout period (denominated “before”) was from 27 February to 7 March, and the post-COVID-19 breakout period (denominated “after”) was from 30 April to 9 May.
The period before occurred prior to the lockdown, in which a significant amount of news items concerning the pandemic, cases, and death toll were released [31], but without cases and deaths in São Paulo. In the period during, there were already some cases and fewer deaths in the city, and lockdown measures were being implemented. In the period after, measures such as social distancing, quarantine, and lockdown, were intense and more than 100 deaths were registered per day in the city of São Paulo [52].

3.4. Statistical Analysis

A comparison of differences and correlations was performed, including descriptive statistics of the data and the application of the appropriate tests (comparison before, during and after, the correlation between variables; and between products).
The analysis method used comprised two steps:
Step I: regression analysis using the ordinary least squares (OLS) method and the default 95% confidence interval was used to examine the relationship between the PB Ratio and average per capita income. Using the R statistical software, four regression models (linear ( Y i = a + b X i + u i ) , log ( ln ( Y i ) = a + b   ln ( X i ) + u i ) , semilog ( Y i = a + b   ln ( X i )   + u i ) and inverse ( Y i = a + b   1 X i + u i ) ) were tested. The assumptions of normality and homoscedasticity of the error terms were verified through the Shapiro-Wilk and Breusch-Pagan tests [53,54], using stats and lmtest (version 0.9-40) libraries, respectively, to select the functional forms of each category.
Step II: Test the association of the number of stores with statistically significant differences in sales between the periods within the income quartiles: the average sales values (BRL) of each of the 144 stores were calculated for before, during and after the PB period. For each combination of periods (i—before and after, ii—before and during, and iii—during and after), the t-test of two independent sample means, considering unknown and different variances, was applied to analyze the number of stores that presented significant variations; the results were grouped according to the income quartiles and compared in order to assess the existence of significant differences between them. Next, a chi-square statistic was used to examine the association between income quartiles and the number of stores with significant variations [53] between the average sales of two periods for each product category. The test starts from the null hypothesis that there is no association between the variables.

4. Data Analysis and Results

PB was measured at the store level. The Panic Buying indicator (PB ratio) is the ratio between average sales (BRL) during the PB period (12–21 March 2020) and the overall sample period (24 February to 24 May 2020) [12].

4.1. Step I: Regression Analysis between PB Ratio and Average per Capita Income

This analysis was performed to answer the research question (i): Is there a significant correlation between the PB Ratio of the calculated differences and the average per capita income considered in the store influence area?
Table 2 presents the r2 and p-value statistics for the regression models that presented the best fit for each product category. The best fit that satisfied the assumptions of normality and homoscedasticity (i.e., accept the null hypothesis—p-value > 0.05) were selected. However, for the candies category, although the p-value was satisfactory (***), it did not pass the normality test (reject the null hypothesis—p-value < 0.05).
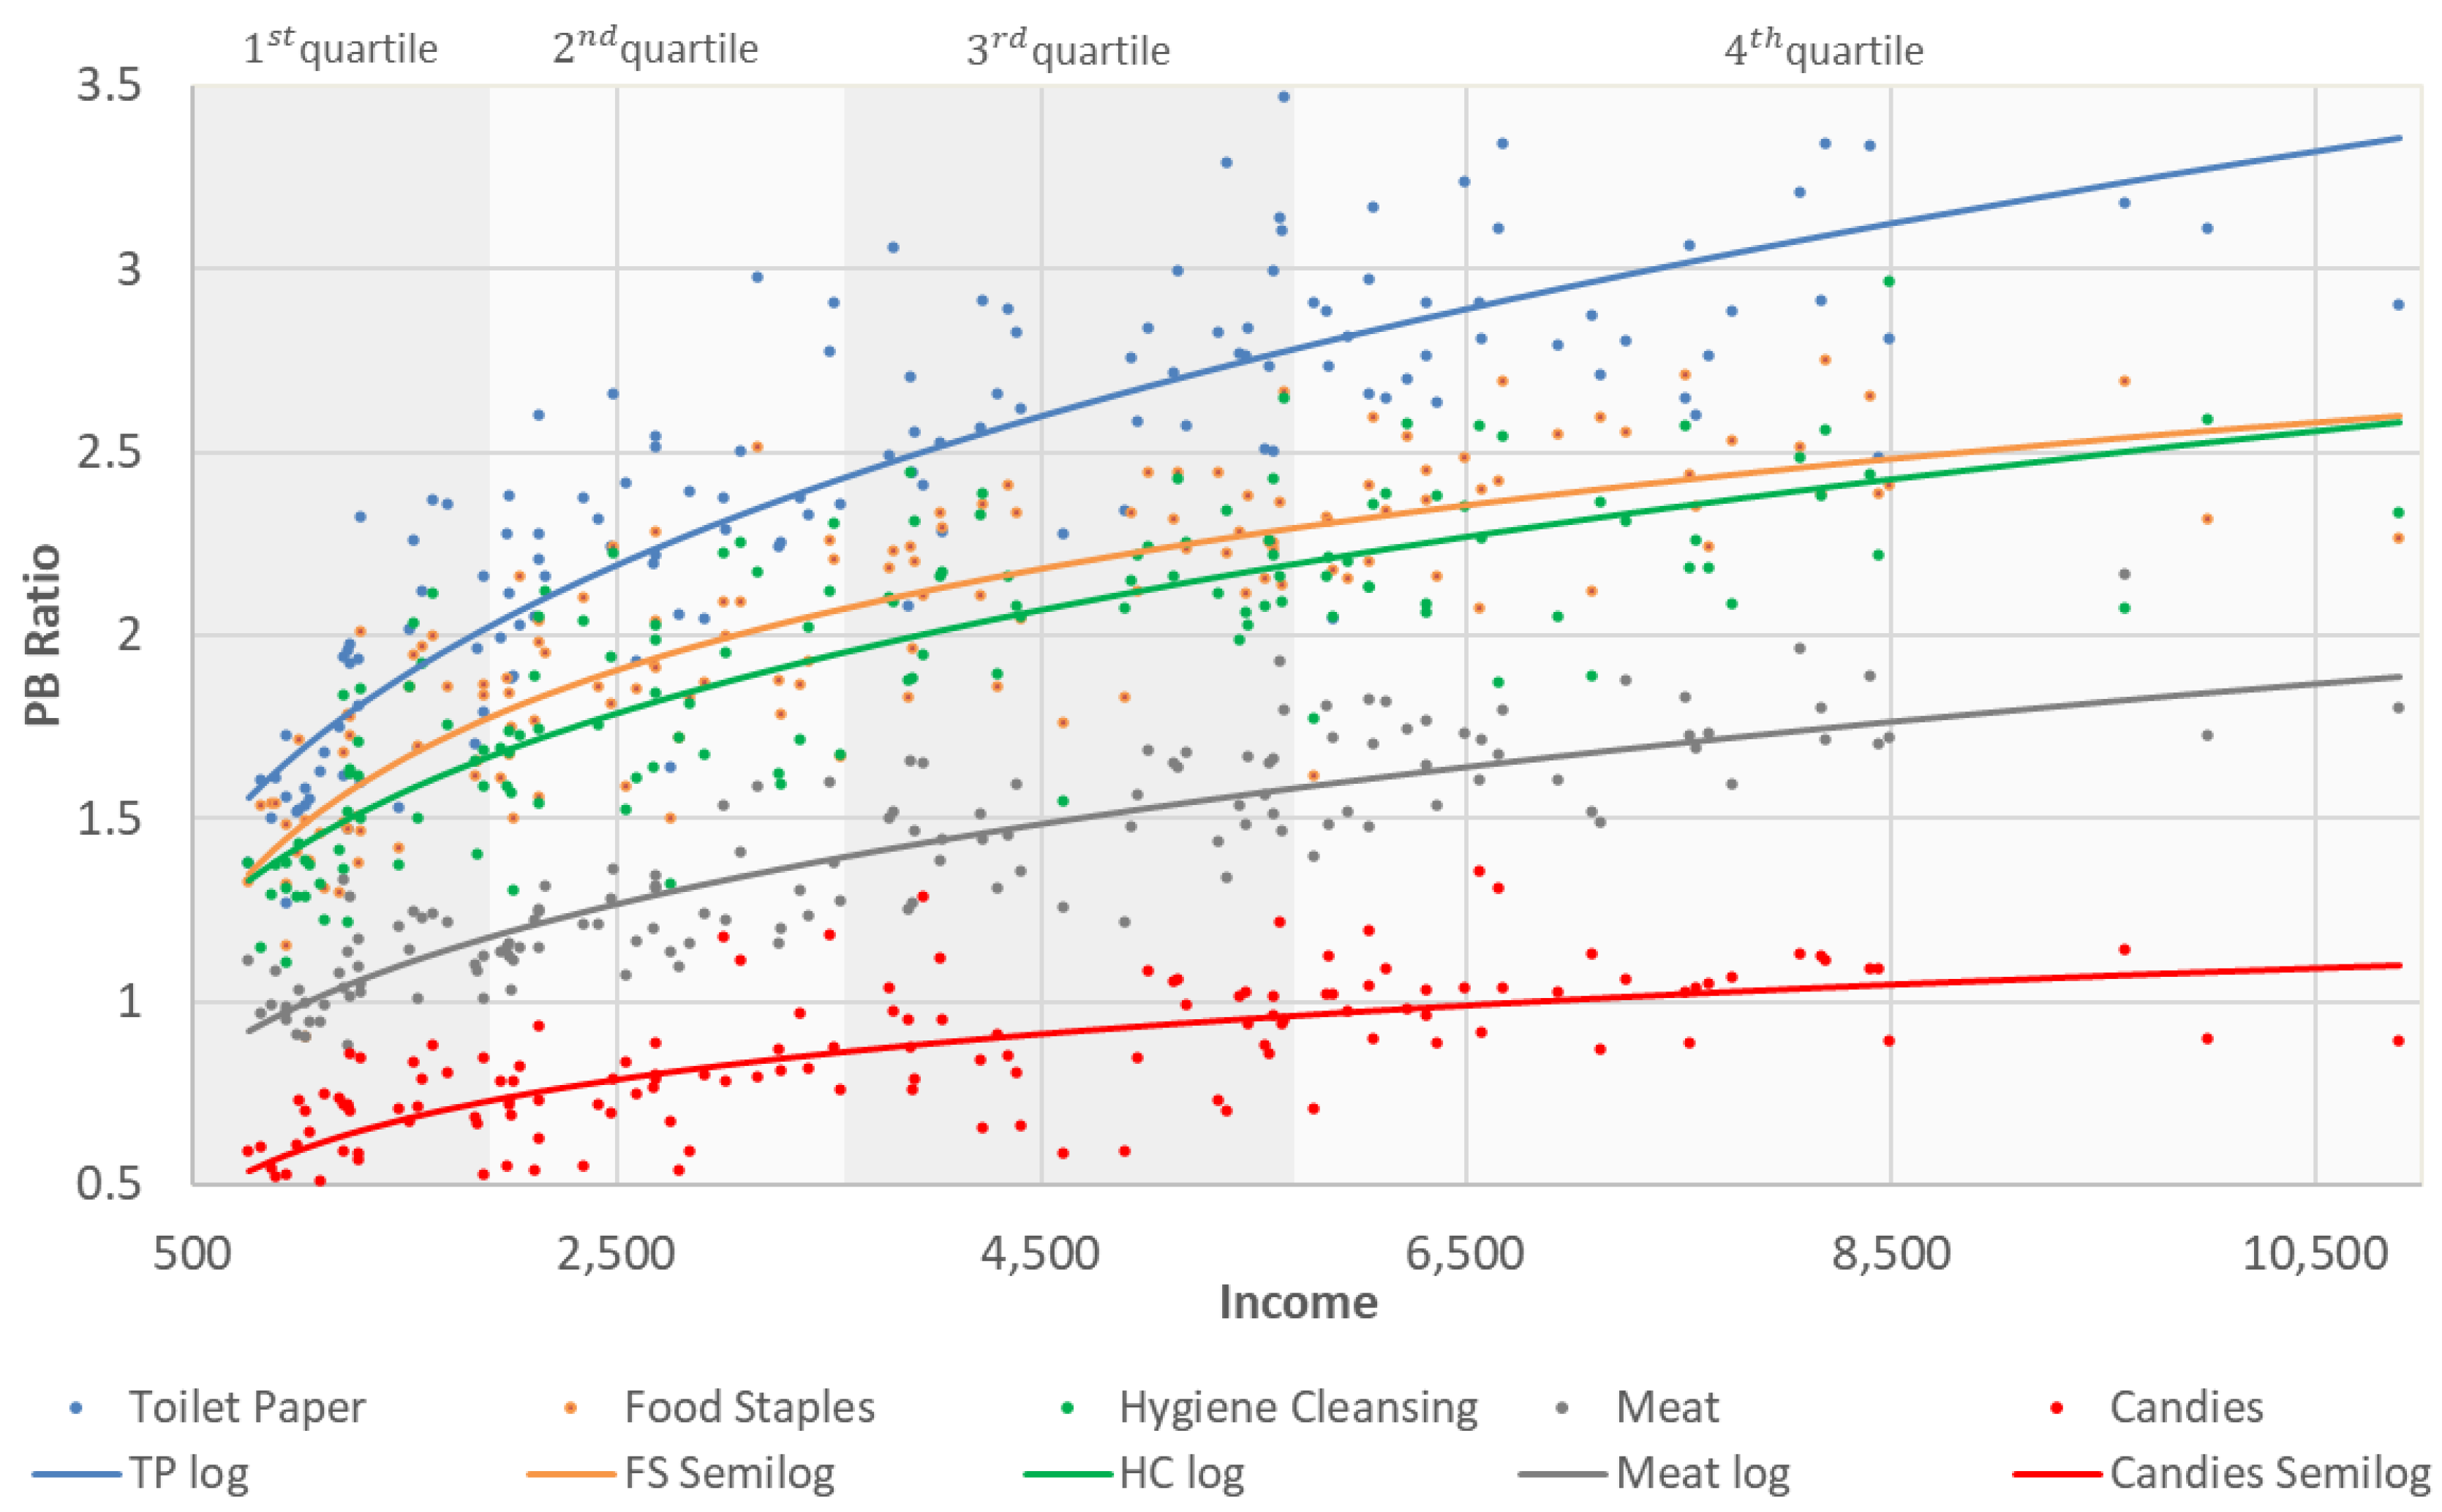
Figure 3 shows the regressions and PB ratio according to the product category and the per capita income of the store influence area. The regression curves behave as a concave function, with the slope reducing as income increases and shows the PB ratio increase according to per capita income. The best fit regression is presented for each product category.

4.2. Step II: Analysis of Sales Averages in Different Periods

This analysis aims to answer the research question (ii): Are there statistically significant differences between the average sales value before, during, and after panic buying by product category analyzed?
Table 3, Table 4 and Table 5 show the results of chi2 to test the independence between quartiles and the average sales of the periods before–after, before–during, and during–after, respectively. High chi2 values indicate a dependence relationship between the variables (i.e., rejects if p < 0.05) [54].
For each category, the highest chi2 values are observed to occur when the period during is considered. For the toilet paper and food staples categories, the significance-level allows us to reject the null hypothesis and conclude that, at a 95% confidence level, there is a significant relationship between income quartiles and the number of stores with significant variations in average sales in all periods. Similarly, the hygiene and cleansing and meat categories showed a significant relationship only when the average sales of the period during panic buying were considered. As expected, for the candies category, the variables can be considered independent for all periods.

Analysis According to Categories

For each product category, differences between the sales values before, during, and after panic buying were analyzed.
Toilet paper: For toilet paper, Table 3, Table 4 and Table 5 show that differences between the three period combinations were significant at a 95% confidence level (p-value < 0.05). As previously noted, (Figure 3), sales during the PB period were much higher than in the other periods. Figure 4 illustrates the periods before and after. The average sales in the before period were higher than the after period. This occurred for all income quartiles and can be explained by the fact that toilet paper is a non-perishable product with small demand elasticity [55], and the products purchased in the period during were consumed in later periods, thus later sales were smaller than before.
Food Staples: Table 3, Table 4 and Table 5 show that the differences between the three periods combinations were also significant. In the during period, the results were quite similar to toilet paper; the only differences were in the magnitude of the variations due to the lower PB ratio (Figure 3).
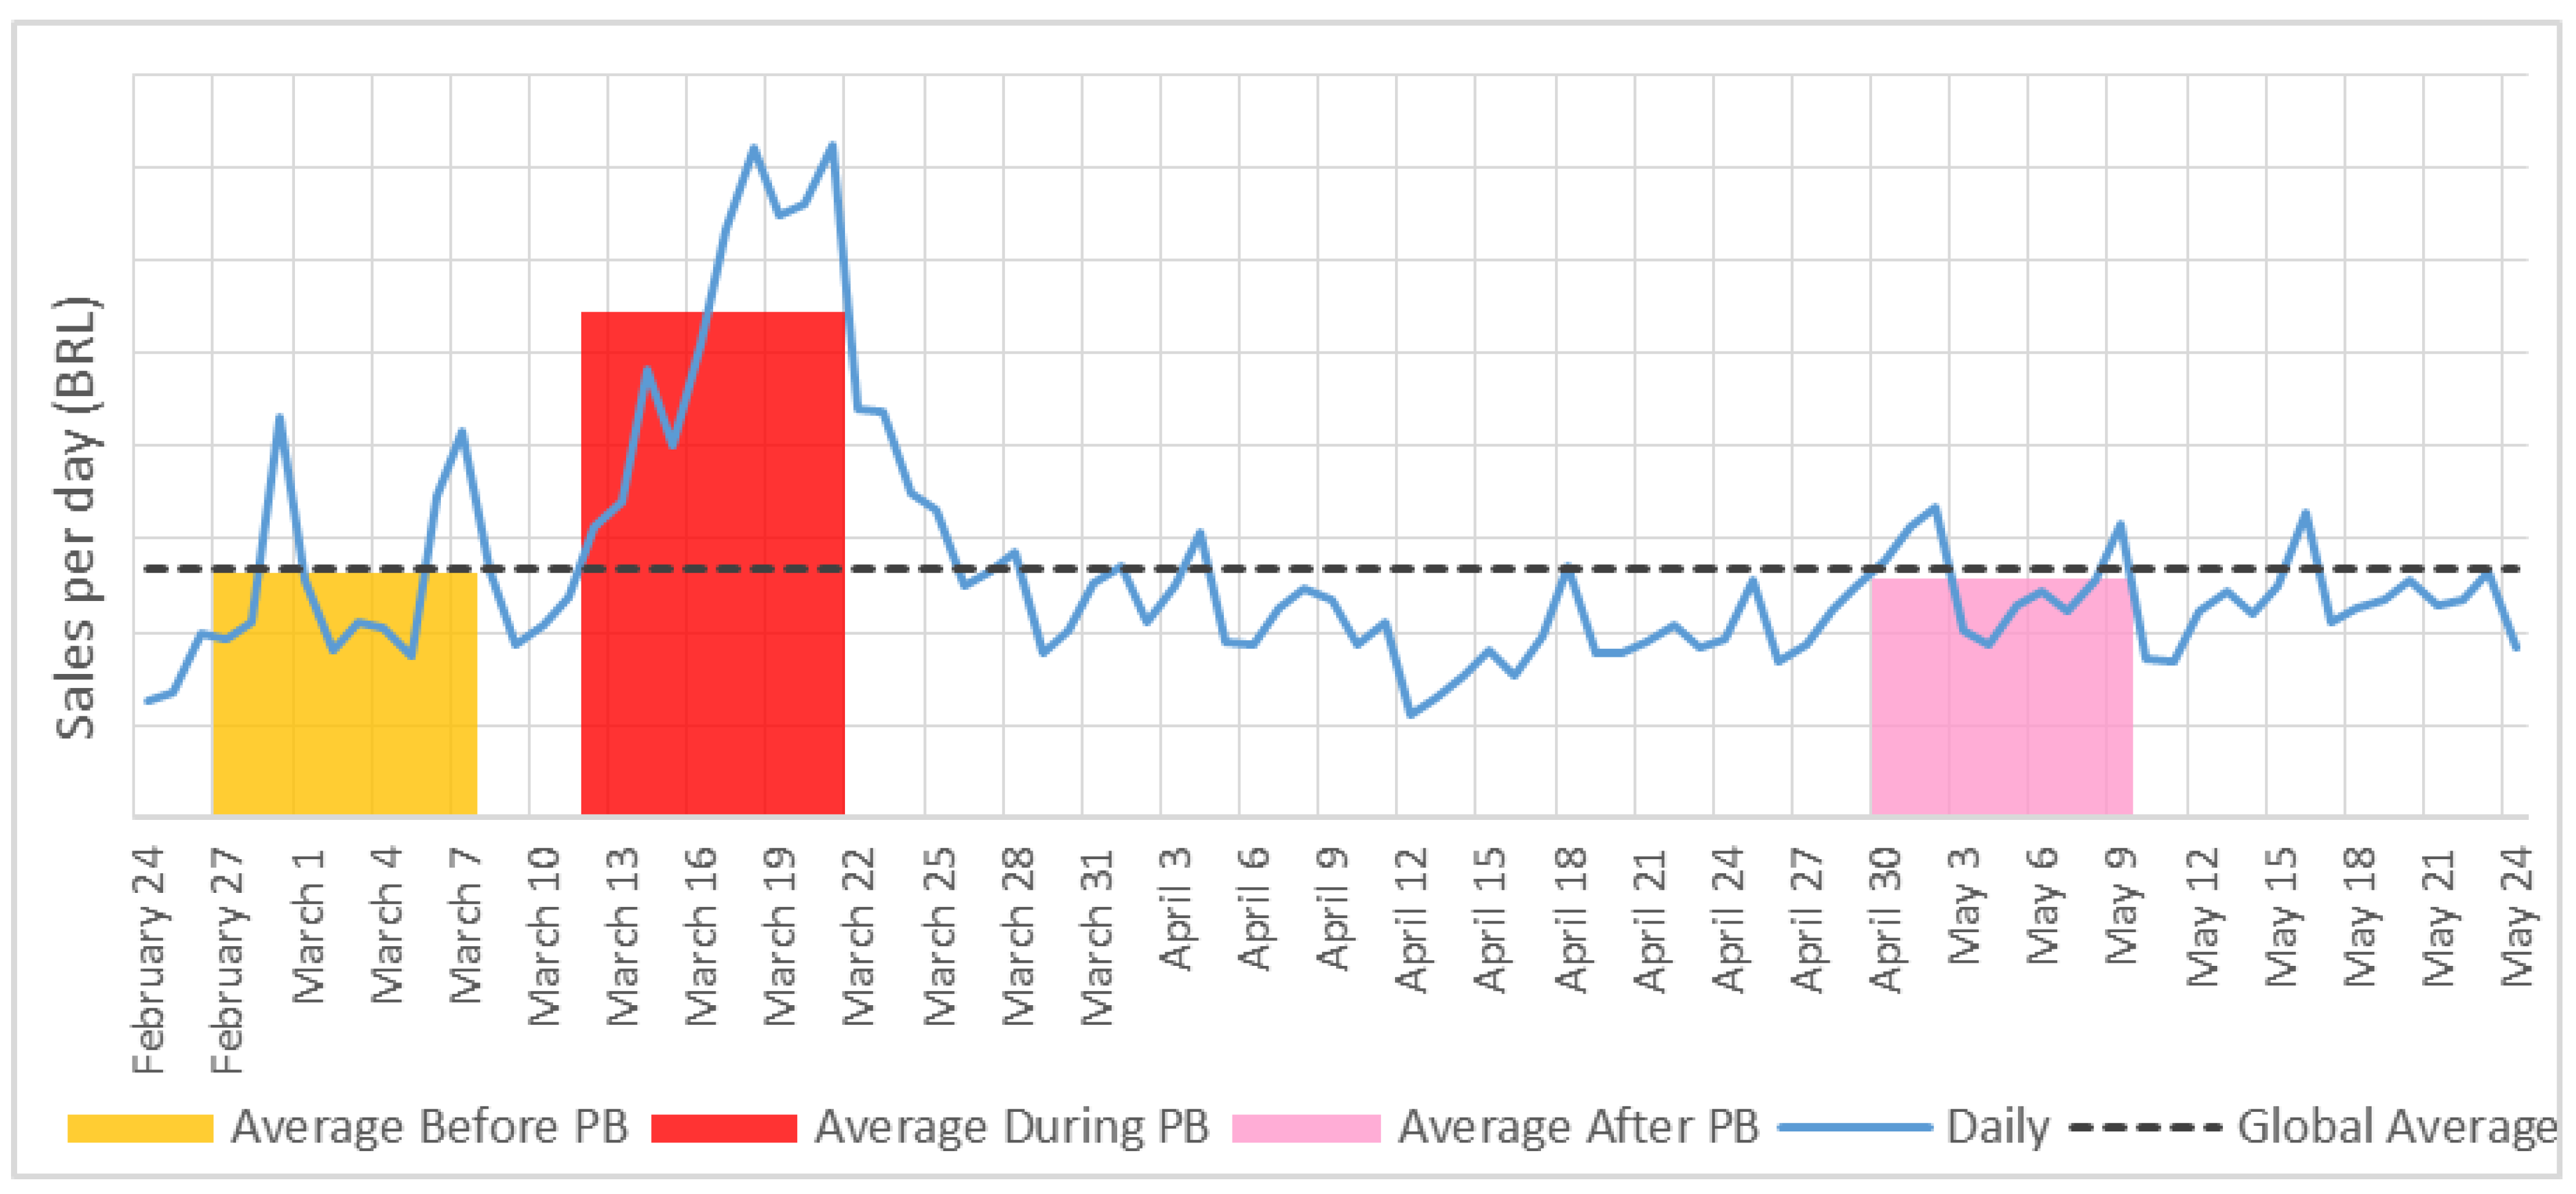
Figure 5 compares the periods before and after. Sales in the after period were higher in all quartiles. One of the possible explanations is that the consumption of food staples increased as consumers started cooking at home due to the lockdown [56], or replaced non-food consumption with food consumption, particularly as some outlets for spending (e.g., theaters and restaurants) were closed during the pandemic [57,58].
Meat: Table 4 and Table 5 show that the differences in the during period were significant. The differences between the before and after periods (Table 3) were not significant (p-value > 5%).
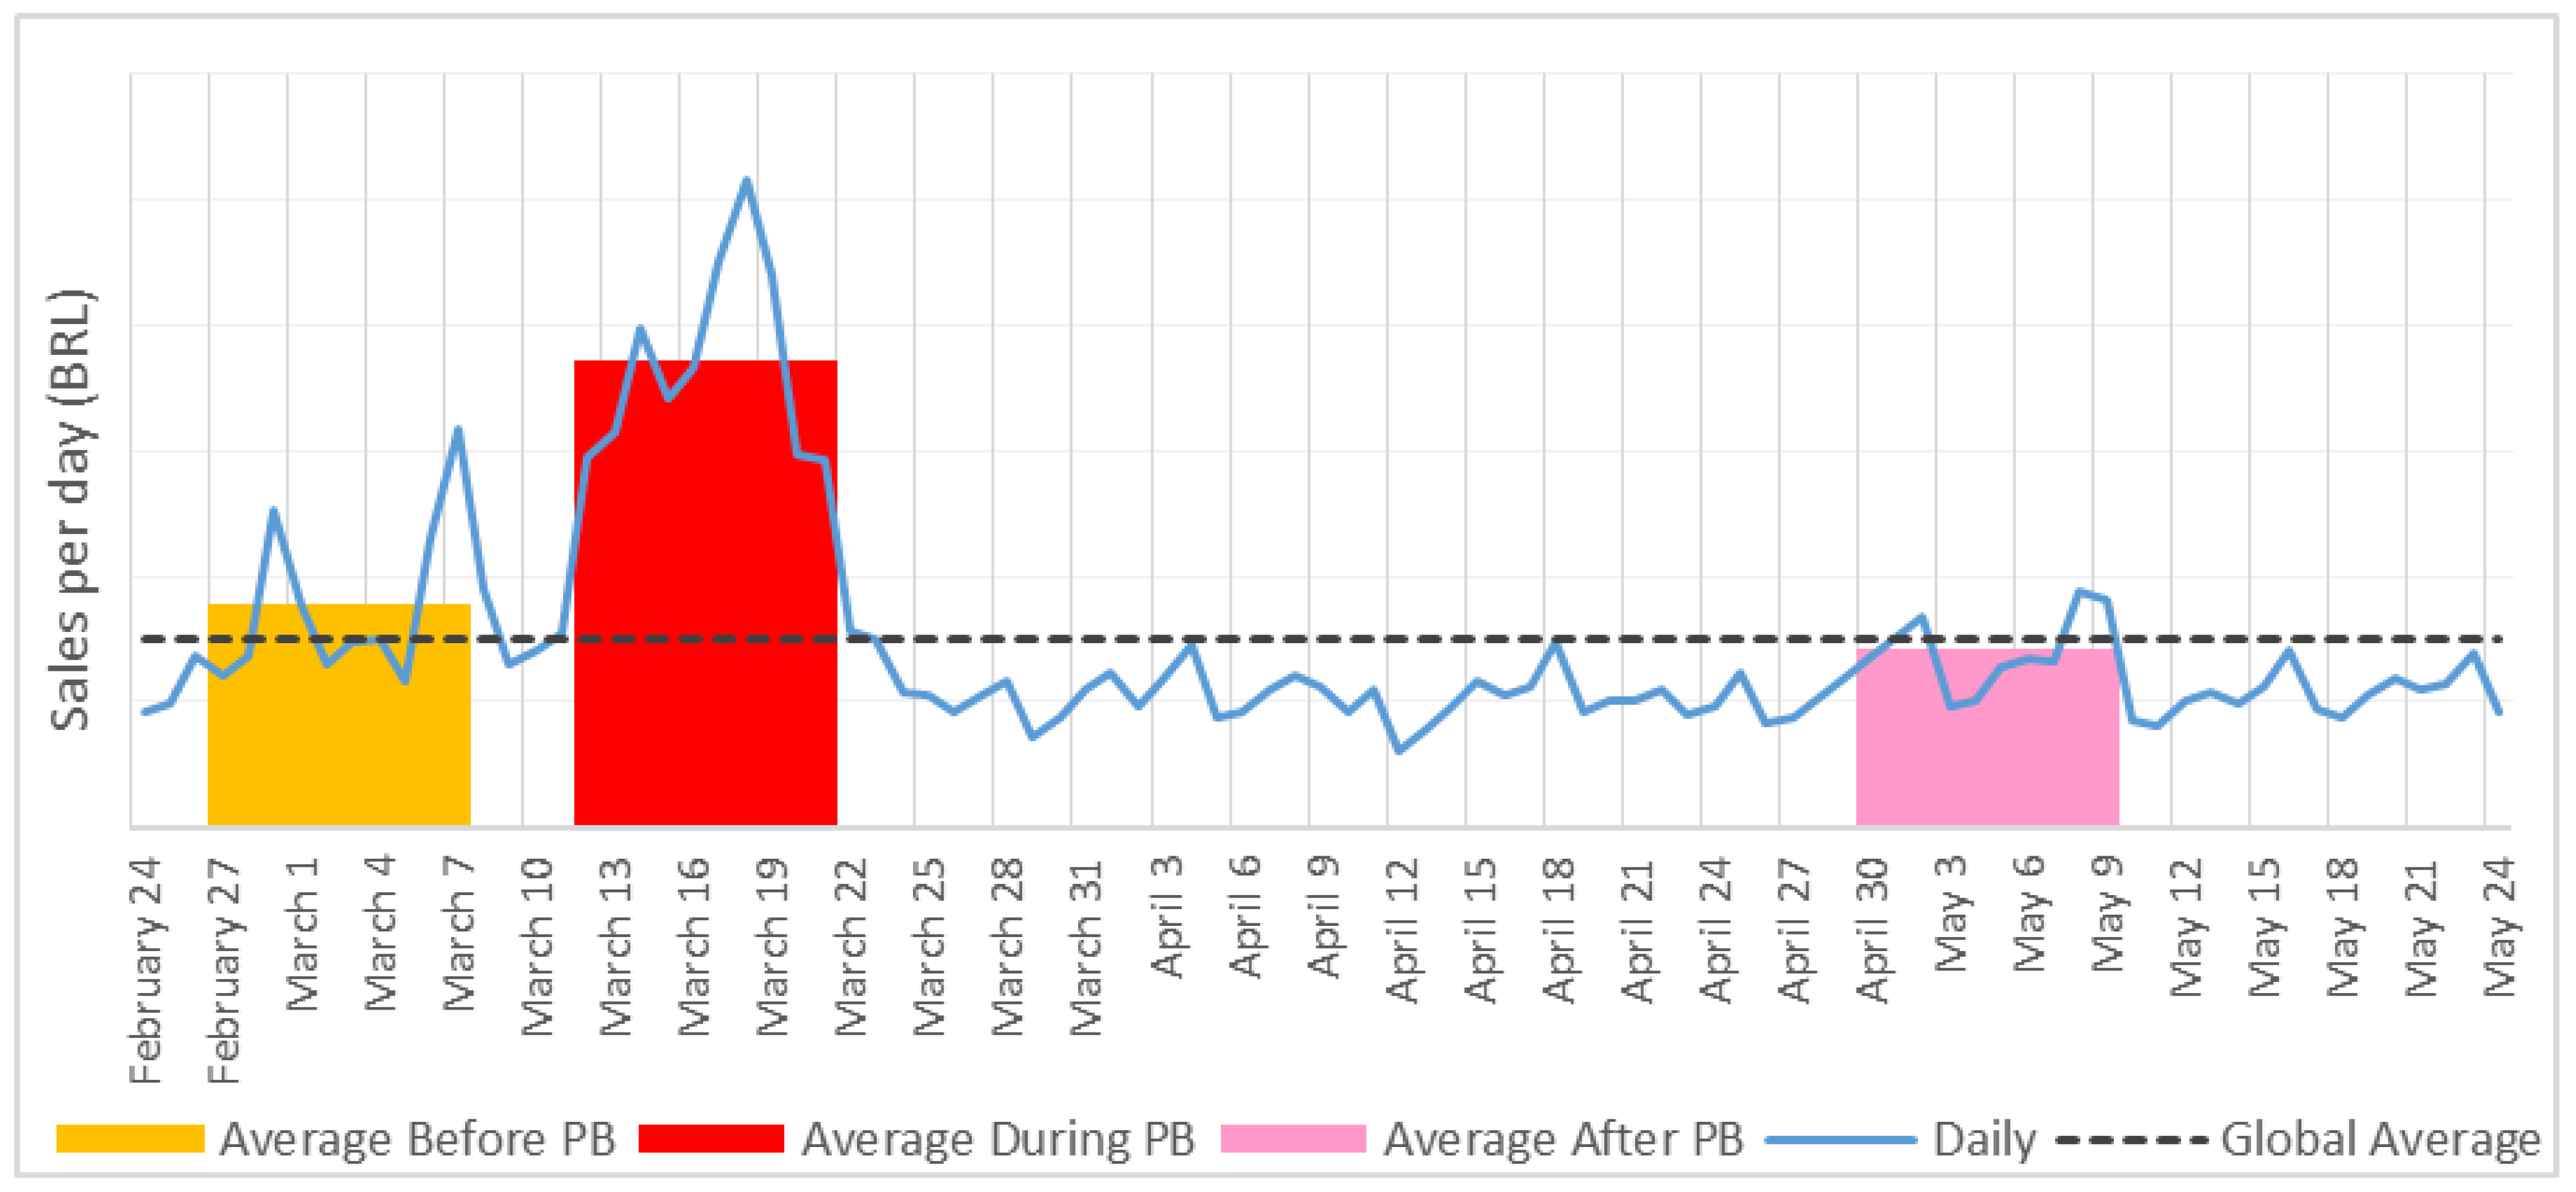
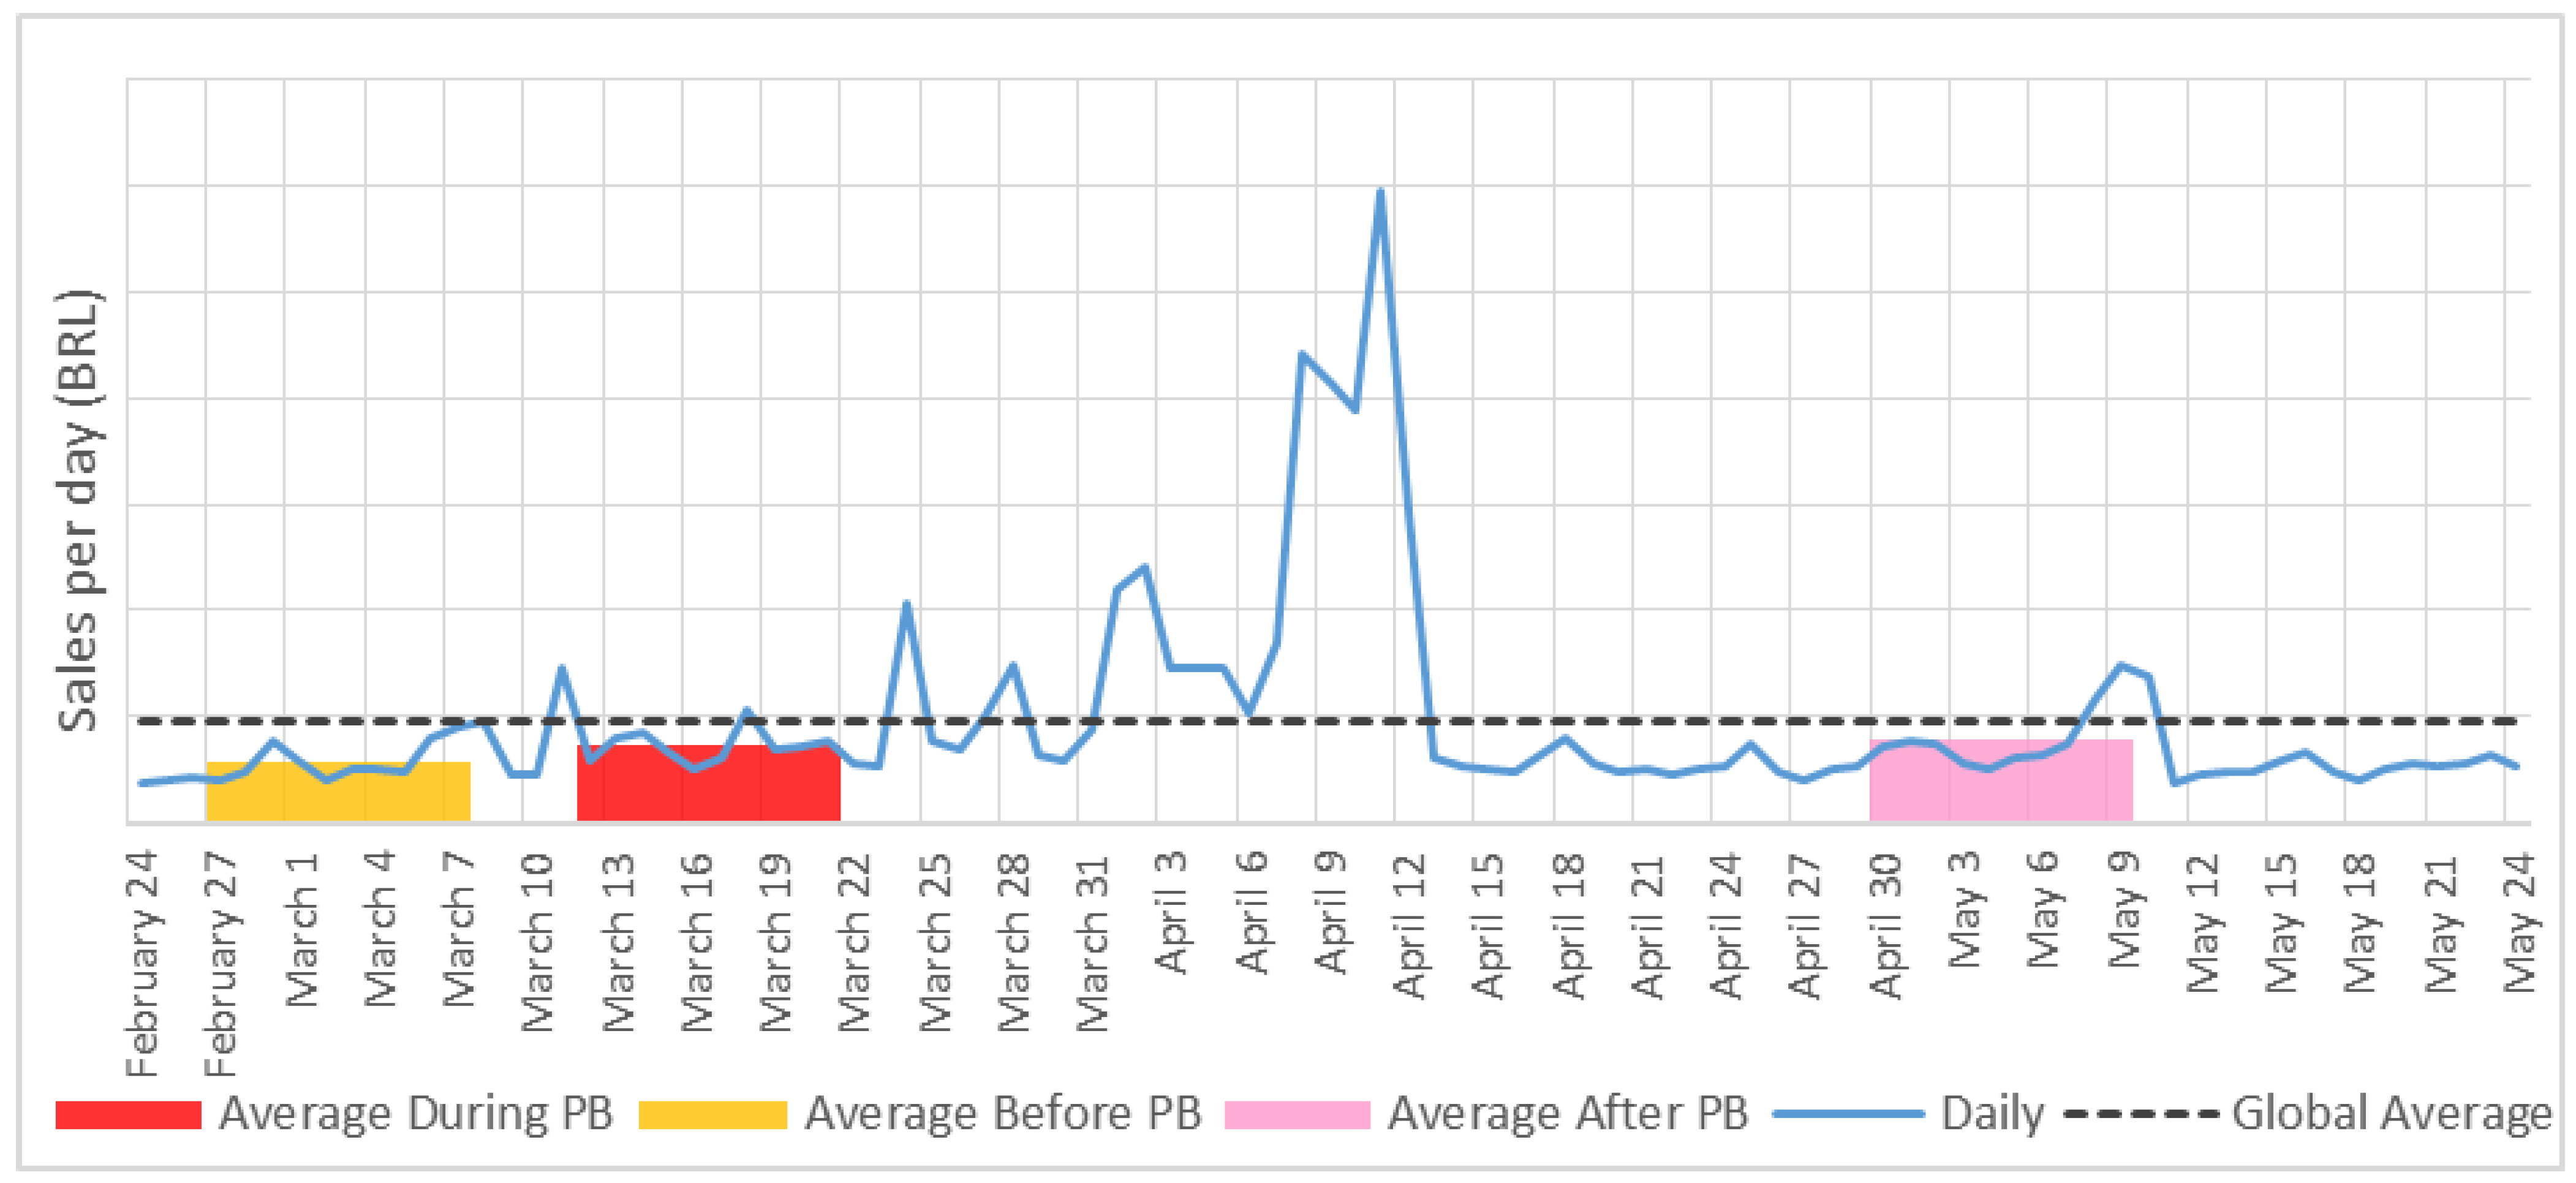
Figure 6 shows the behavior of meat sales during the 90 days. From the figure, it can be seen that weekly peaks occur. These peaks are Saturday sales.
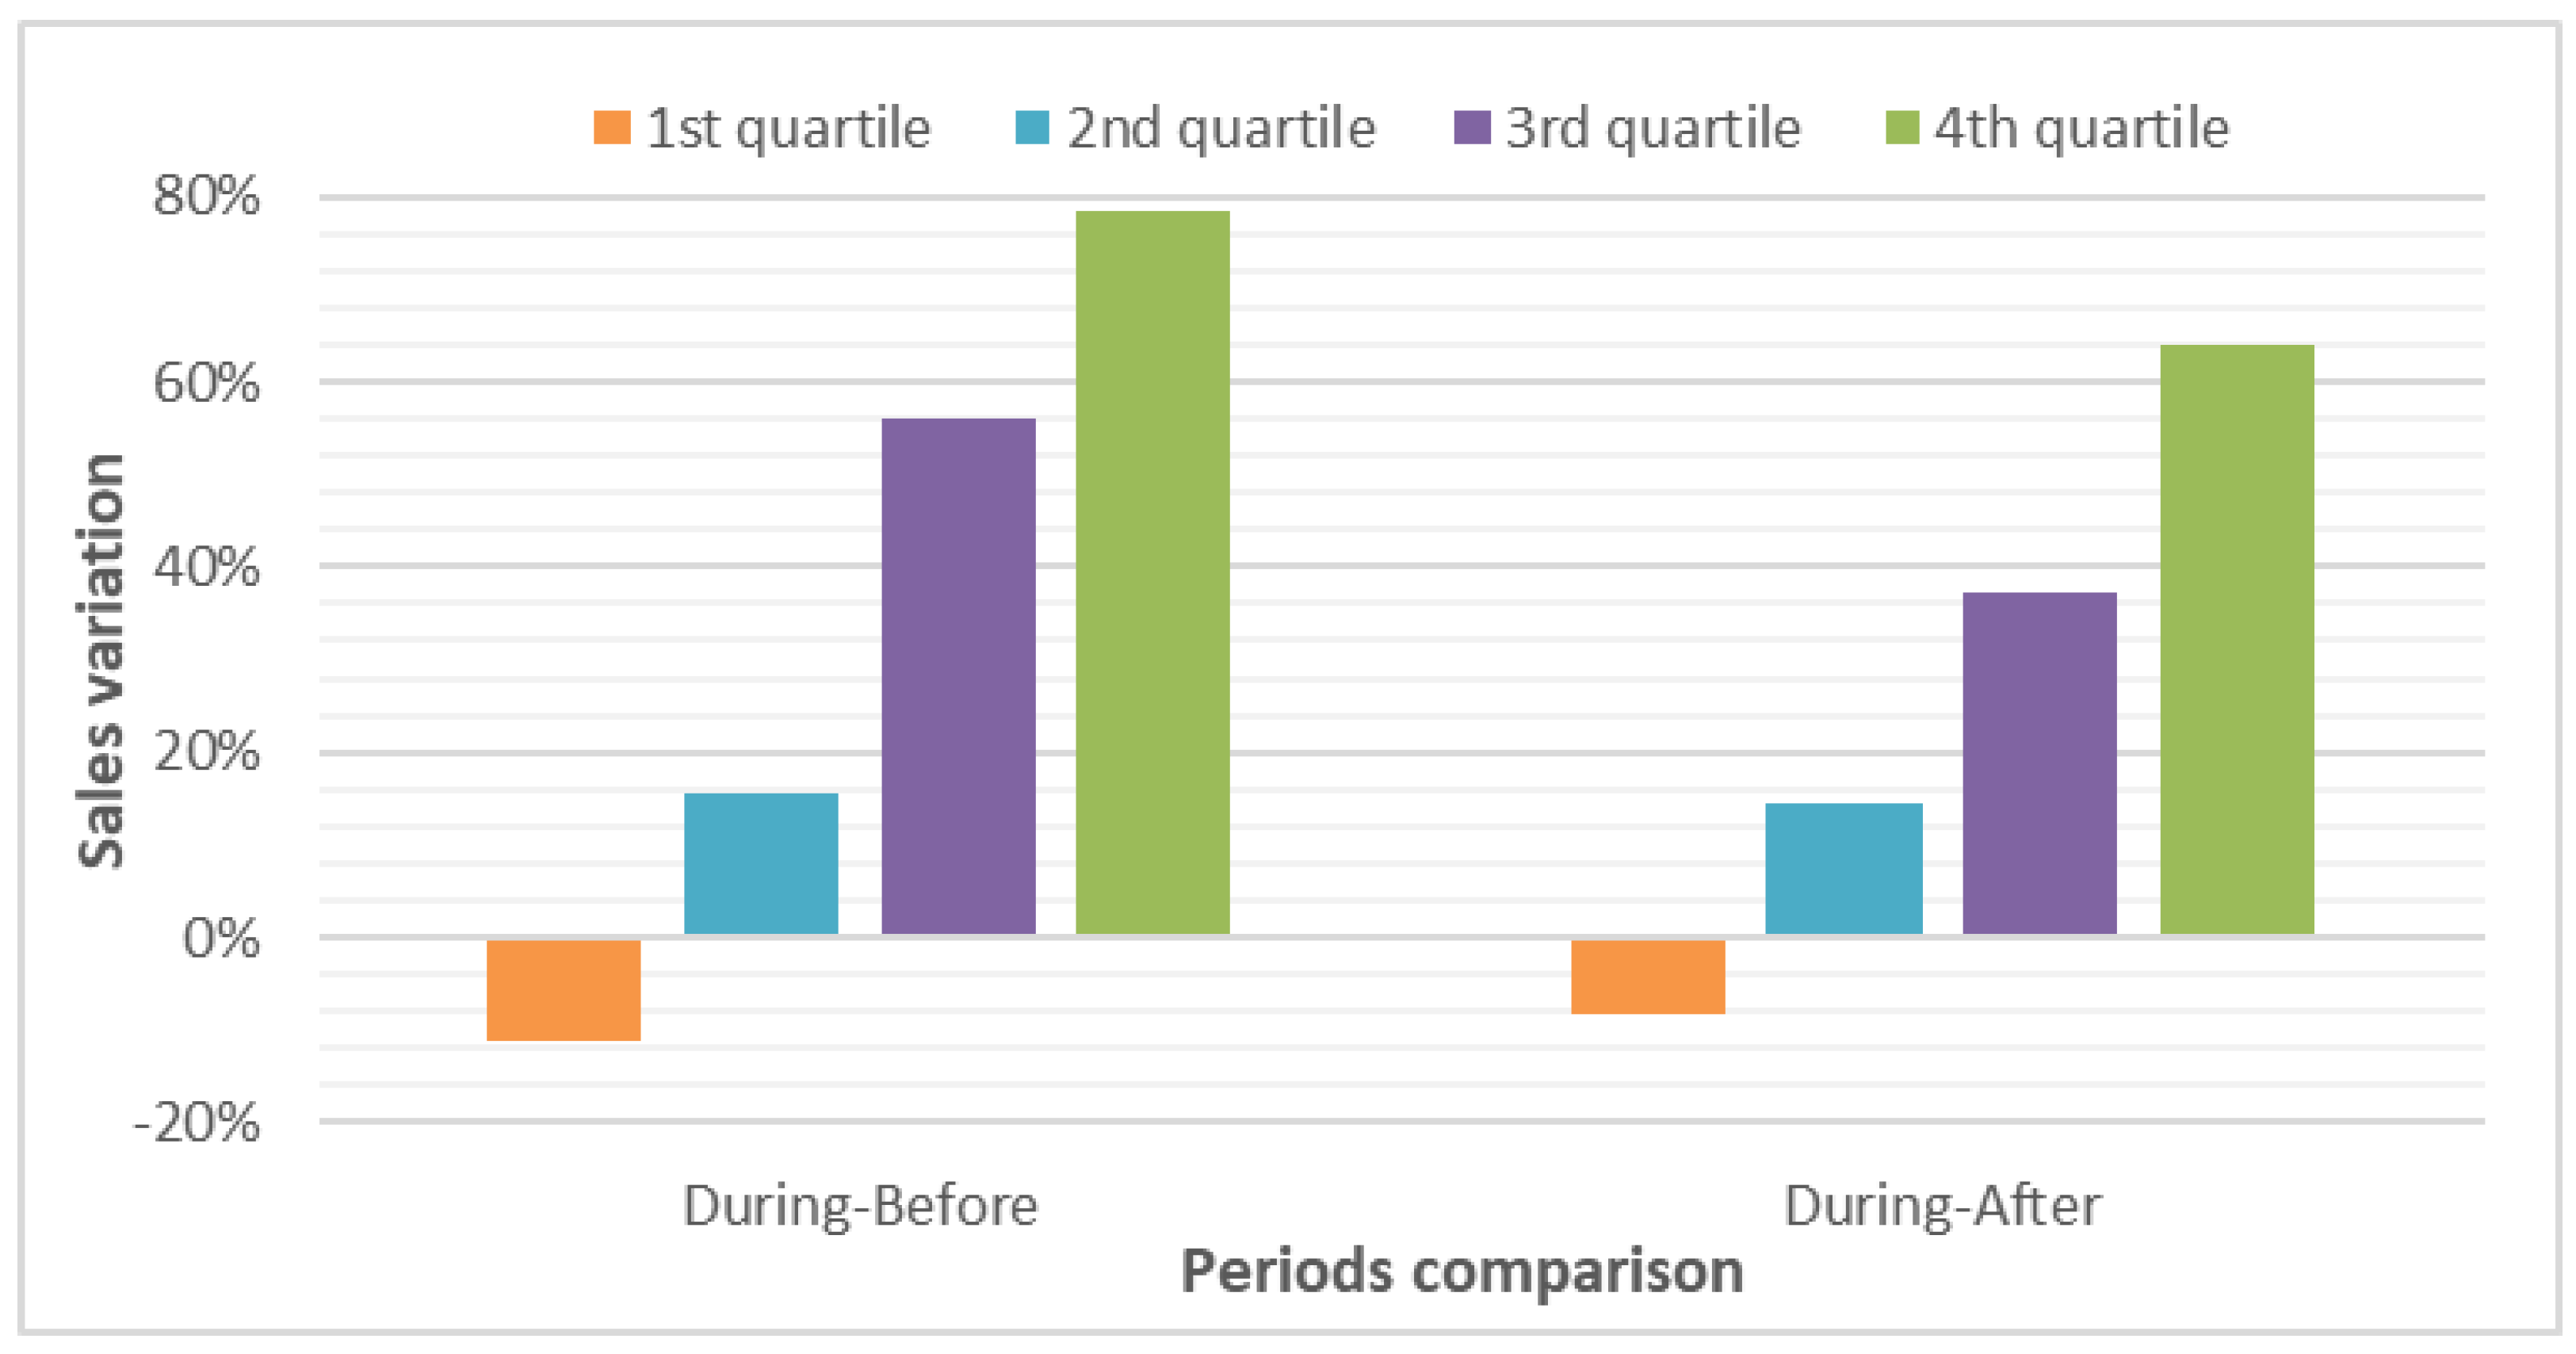
Comparison over the entire period demonstrates differences between income quartiles. The increase in meat sales in the during period did not occur in all quartiles. As shown in Figure 7, in the lowest income quartile, there was a reduction in meat sales in the during period, whereas in the other quartiles, there was an increase. This behavior was detected only in the meat category and was not detected in the other categories.
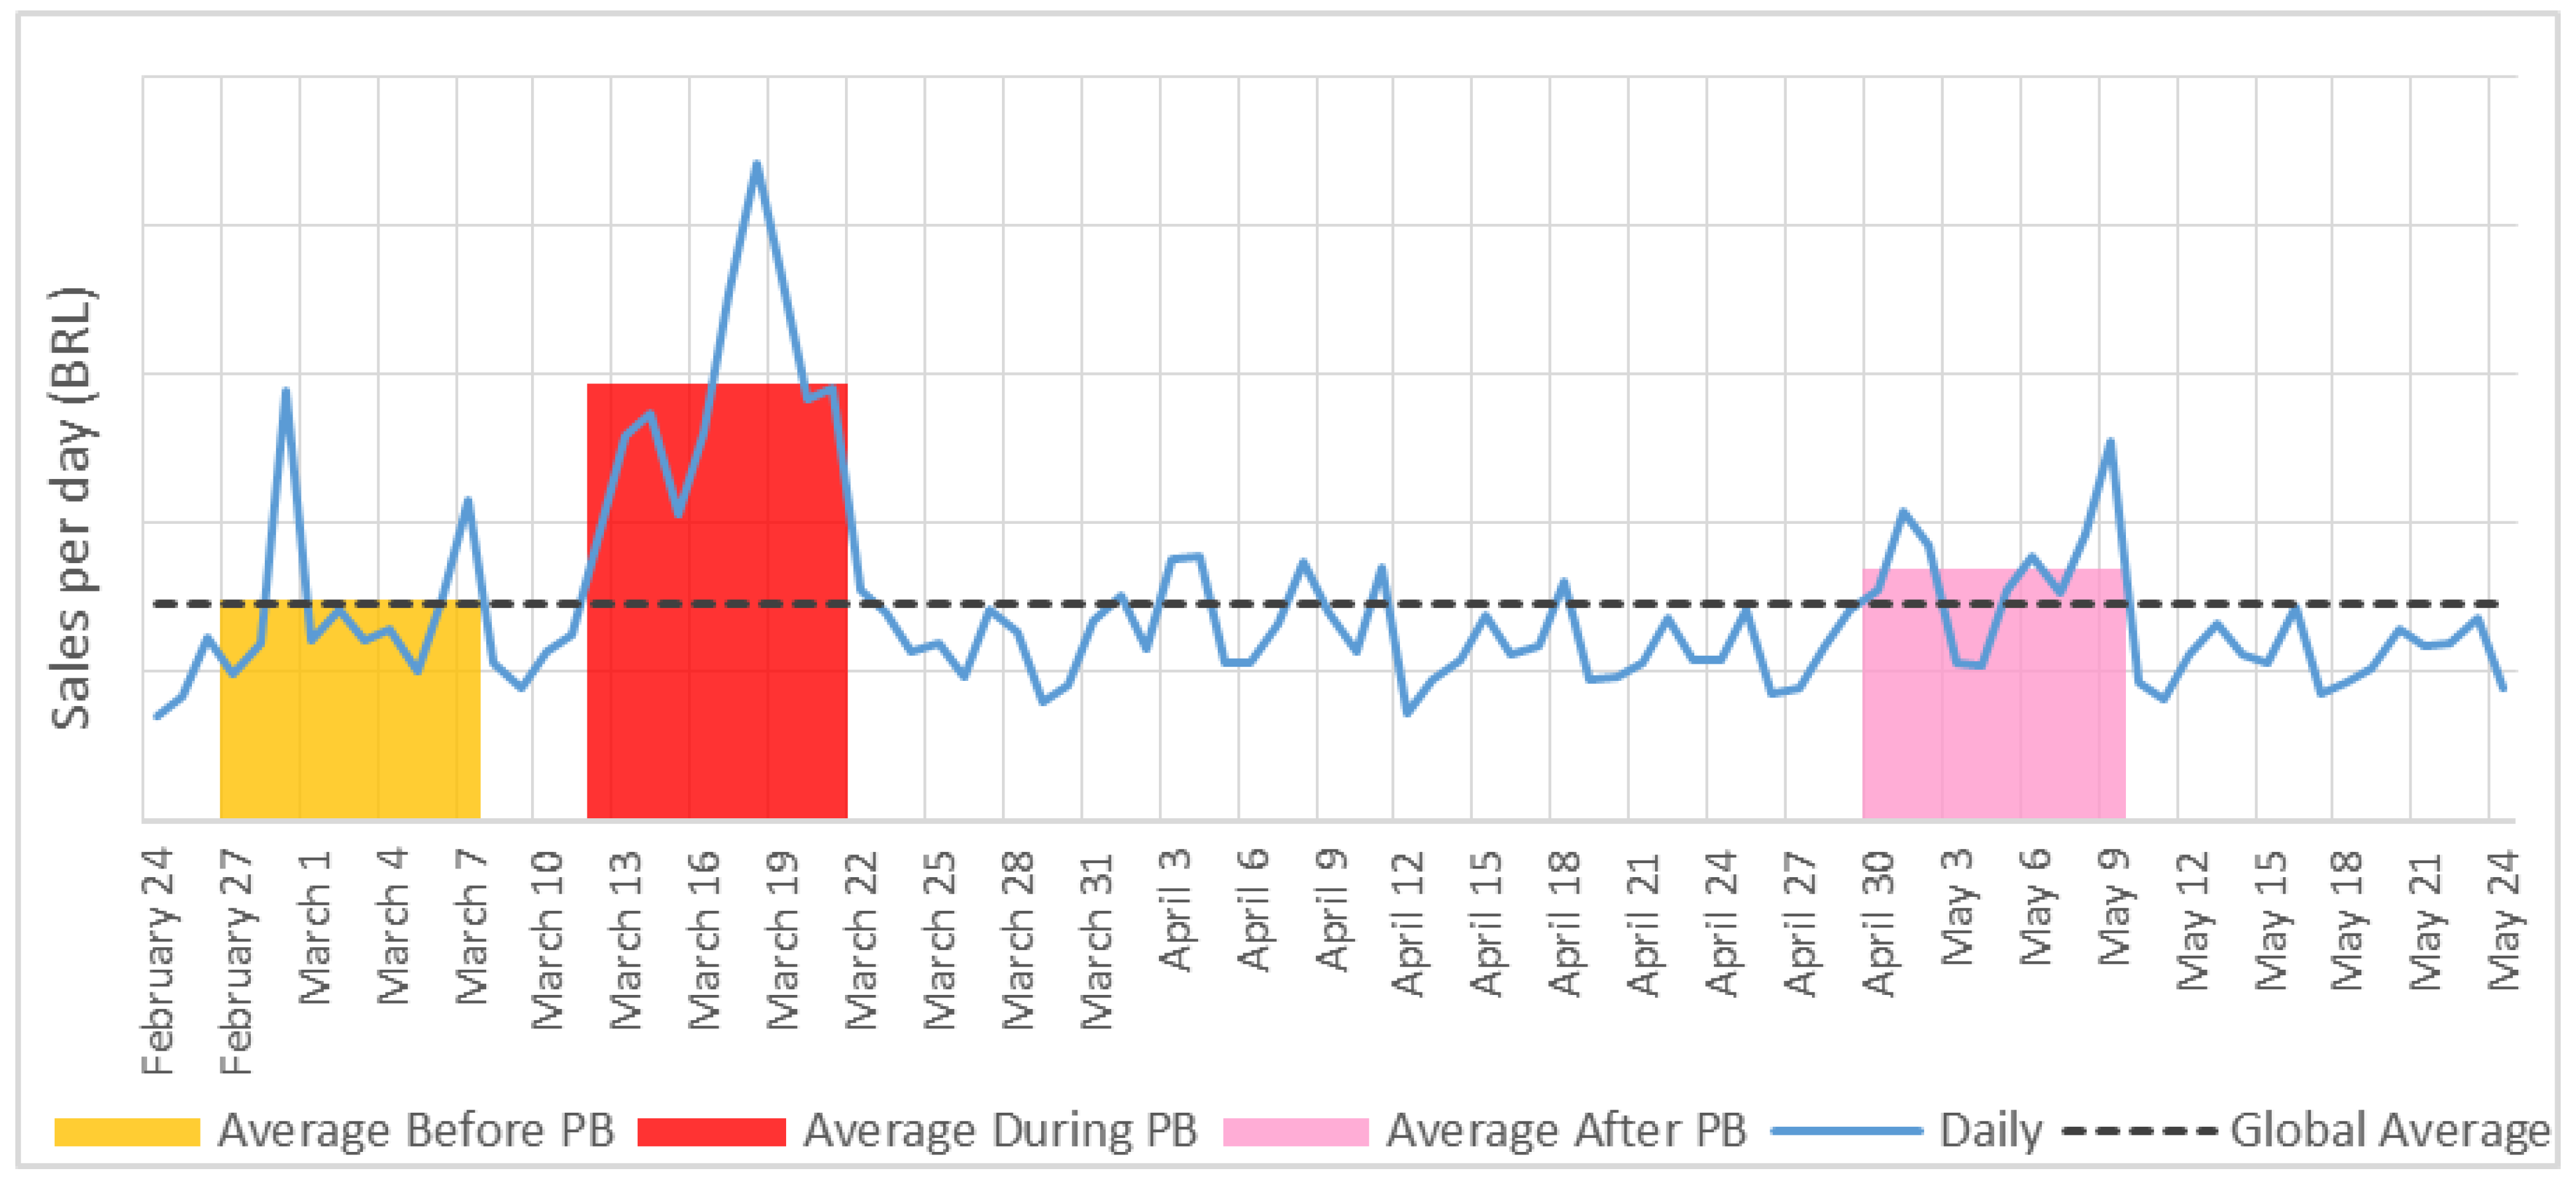
Hygiene and cleansing: Table 3 shows that the difference between before and after was not significant. Sales in the during period were higher than in the other periods. Figure 8 shows the sales behavior throughout the 90 days.
Candies: For this category, according to Table 3, Table 4 and Table 5, there are no significant differences between the periods (all p-values > 0.05). Figure 9 shows the sales behavior during the 90 days and confirms this non-variation. The peak seen in early April refers to the annual Christian Easter season, when chocolate (mostly as chocolate egg) sales skyrocket nationwide.

5. Discussion and Implications

Based on the stores’ sales for each product category data, the per capita income, and the stores’ radius of influence, the results show that there is a significant correlation between income and PB ratio. Panic buying behavior was less pronounced in locations with lower than average per capita income (see Figure 3) and increased with the increased income. At a 95% confidence level, there is a significant relationship between income quartiles and the number of stores with significant variations in average sales in all periods
For the toilet paper category, due to the consumers´ stockpiling behavior during the COVID-19 breakout [14], the PB ratio was more pronounced; that is, consumers bought much more than they were used to. For the food staples and hygiene and cleansing categories, there was also an increase in purchases due to the characteristics of the COVID-19 breakout period, when people stayed at home [56] and preventive actions related to hygiene and cleansing were implemented to prevent the spread of the SARS-CoV-2 [59].
For the meat category, there was also an increase in purchases, albeit not so pronounced; in regions of lower purchasing power, there was a reduction in consumption (see Figure 7). As meat is the most expensive category, one may conjecture that lower-income people had to tradeoff their PB behavior to categories considered more urgent, such as food staples or hygiene and cleansing. Another potential reason is the perishability of meat, as lower-income people do not store frozen food in abundance.
Regarding the sales before, during, and after the PB period by each product category, the models and regression tests show that the differences are statistically significant. The stores were grouped by income quartiles and the number of stores with significant sales differences between the periods before, during, and after the PB were analyzed. The difference in average sales between before–during and during–after periods by quartiles was significant for all categories, with the exception of candies, which did not pass the normality test, whereas, when comparing the periods before–after the PB, only toilet paper and food staples showed a statistically significant difference: toilet paper sales dropped, and food staples sales increased.
These results indicate the need for public policies to ensure that the most vulnerable population is not deprived of basic products such as food and hygiene products. Examples of such policies are cash and voucher and social welfare programs, or coupons for purchasing these products. The implications of this study can result in better decision-making by relevant stakeholders in the policy-making sphere, resulting in actions that can be taken by the government, retailers, and consumers to reduce the panic behavior of consumers.
The panic buying phenomenon is a primitive human response to insecurity, such as the anticipation of the exhaustion of resources and media reports in a sensational way [26]. Thus, actions taken by the government to control markets and information presented by reliable sources [5], such as trusted agents [60], must be able to provide confidence and credibility to the population to reduce the impacts of panic buying.
Another relevant aspect is monitoring the media and social networks as they identify public concerns [4]. The dissemination of measures in the media should clarify false information, fake news [34], and reduce the negative aspects related to scarcity by replacing them with healthy and positive information [32,39]. Moreover, advertisements aimed at combating panic, would also reduce perceived scarcity and create ways to take the pressure off scarce products.
Limiting purchase volumes, restricting store-opening hours or adopting fixed quotas [14] are important measures that can be taken by grocers. However, retailers should avoid posting particularly obvious “restricted purchases” slogans. For these types of actions, the anchoring effect can occur and people could feel some urgency about stocking up and buying the set limit, often above their needs [61], and can even increase the perceived scarcity and creating the urgency to buy [62]. The consumers could play the rationing game and increase consumption, nullifying the benefits of limiting the amount to be purchased [63]. Some measures can also be helpful to reduce the impacts of panic buying, such as guidelines for the population to face the pandemic (using trusted agents [60]), encouraging retailers to manage supply chains and restricting excessive purchases by consumers.
A co-operation strategy with retailers should be defined. Some relevant measures have informed people about which products can help them and which are unnecessary to deal with the pandemic, encouraging retailers and establishments to digitally manage and share data in real-time on inventory status and consumption, as well as providing relevant measures for supply chains to respond and avoid shortages, for example, inventory replenishment. In addition to measures to decrease fear and increase consumer confidence in chain resilience, the government and businesses must work to prevent the possibilities of chain disruptions in disasters by using technologies such as blockchain and big data to monitor and control inventories [25].

6. Conclusions

Based on the stores’ sales for each product category data, the per capita income and the stores’ radius of influence, this research concludes that there is a significant correlation between income and PB, and that there is also a difference between the sales of products for some categories before, during and after the PB period.
In this study, we examined the correlation between average per capita income and PB. We compared the sales of five product categories in 144 stores of two large retail chains in São Paulo and confirmed the existence of a correlation between PB and income. We grouped the stores by income quartiles and concluded that PB occurred in all quartiles, although it was more pronounced in those with higher incomes. The toilet paper and staple food categories were the only ones that showed significant differences between the periods before-after, while the difference in sales between the before-during and during-after periods were significant for all categories, with the exception of candies. These results may assist store managers and policymakers in introducing better management, social policies, and resource usage during the PB period associated with a pandemic that requires social distancing and lockdowns.
This presents some challenges to governments, considering the socioeconomic factors of PB, and highlights the need for measures to guarantee that vulnerable populations have access to goods and services and are not deprived of such necessities in times of crisis [38]. In this sense, this study can support the identification of areas and districts where potential demands from the most vulnerable populations arise to prevent social panic, looting, and anguish. Cash and voucher programs and in-kind donations are examples of protection mechanisms to help vulnerable populations during these times.
The scope is restricted to a retail network in the city of São Paulo and the assumptions of average income by the census sector are limitations of this research. Future studies evaluating other regions and connecting these results with sentiment analysis in social networks would provide an improved assessment of PB behavior and enrich the conclusions of this work. Nevertheless, our results contribute to analyzing the influence of income on panic buying behavior and add to the literature by including the comparison of sales at different times related to PB.

Author Contributions

Conceptualization: I.d.B.J., H.T.Y.Y. and R.F.d.S., C.M.H. and F.A.S.; methodology: H.T.Y.Y., I.d.B.J., F.A.S., R.F.d.S. and C.M.H.; software: C.M.H., F.A.S., N.d.C.B. and I.M.F.d.A.; validation: I.d.B.J., H.T.Y.Y. and R.F.d.S.; investigation: F.A.S. and N.d.C.B.; data curation: C.M.H., F.A.S., N.d.C.B. and I.M.F.d.A.; writing—original draft preparation: I.d.B.J., F.A.S., L.L.A. and N.d.C.B.; writing—review and editing: I.d.B.J., H.T.Y.Y. and R.F.d.S.; supervision: I.d.B.J. All authors have read and agreed to the published version of the manuscript.

Funding

This research was funded by CNPq National Council for Scientific and Technological Research grant numbers 404803/2021-0 and 313687/2019-6.

Institutional Review Board Statement

Not applicable.

Informed Consent Statement

Not applicable.

Data Availability Statement

Not applicable.

Acknowledgments

The authors would like to thank the grocery chains (names intentionally omitted), which provided us with real transactions data.

Conflicts of Interest

The authors declare no conflict of interest.

References

  1. Prentice, C.; Chen, J.; Stantic, B. Timed Intervention in COVID-19 and Panic Buying. J. Retail. Consum. Serv. 2020, 57, 102203. [Google Scholar] [CrossRef]
  2. Ali Taha, V.; Pencarelli, T.; Škerháková, V.; Fedorko, R.; Košíková, M. The Use of Social Media and Its Impact on Shopping Behavior of Slovak and Italian Consumers during COVID-19 Pandemic. Sustainability 2021, 13, 1710. [Google Scholar] [CrossRef]
  3. Islam, T.; Pitafi, A.H.; Arya, V.; Wang, Y.; Akhtar, N.; Mubarik, S.; Xiaobei, L. Panic Buying in the COVID-19 Pandemic: A Multi-Country Examination. J. Retail. Consum. Serv. 2021, 59, 102357. [Google Scholar] [CrossRef]
  4. Leung, J.; Chung, J.Y.C.; Tisdale, C.; Chiu, V.; Lim, C.C.W.; Chan, G. Anxiety and Panic Buying Behaviour during COVID-19 Pandemic—A Qualitative Analysis of Toilet Paper Hoarding Contents on Twitter. Int. J. Environ. Res. Public Health 2021, 18, 1127. [Google Scholar] [CrossRef] [PubMed]
  5. Naeem, M. Do Social Media Platforms Develop Consumer Panic Buying during the Fear of Covid-19 Pandemic. J. Retail. Consum. Serv. 2021, 58, 102226. [Google Scholar] [CrossRef]
  6. Prentice, C.; Nguyen, M.; Nandy, P.; Aswin Winardi, M.; Chen, Y.; Le Monkhouse, L.; Dominique-Ferreira, S.; Stantic, B. Relevant, or Irrelevant, External Factors in Panic Buying. J. Retail. Consum. Serv. 2021, 61, 102587. [Google Scholar] [CrossRef]
  7. Valaskova, K.; Durana, P.; Adamko, P. Changes in Consumers’ Purchase Patterns as a Consequence of the COVID-19 Pandemic. Mathematics 2021, 9, 1788. [Google Scholar] [CrossRef]
  8. Mahajan, V.; Cantelmo, G.; Antoniou, C. Explaining Demand Patterns during COVID-19 Using Opportunistic Data: A Case Study of the City of Munich. Eur. Transp. Res. Rev. 2021, 13, 26. [Google Scholar] [CrossRef]
  9. He, J.; Liu, S.; Li, T.; Mai, T.H.T. The Positive Effects of Unneeded Consumption Behaviour on Consumers during the COVID-19 Pandemic. Int. J. Environ. Res. Public Health 2021, 18, 6404. [Google Scholar] [CrossRef]
  10. Giudice, F.; Caferra, R.; Morone, P. COVID-19, the Food System and the Circular Economy: Challenges and Opportunities. Sustainability 2020, 12, 7939. [Google Scholar] [CrossRef]
  11. Yap, S.; Xu, Y.; Tan, L. Coping with Crisis: The Paradox of Technology and Consumer Vulnerability. Int. J. Consum. Stud. 2021, 45, 1239–1257. [Google Scholar] [CrossRef]
  12. Yoshizaki, H.T.Y.; de Brito Junior, I.; Hino, C.M.; Aguiar, L.L.; Pinheiro, M.C.R. Relationship between Panic Buying and Per Capita Income during COVID-19. Sustainability 2020, 12, 9968. [Google Scholar] [CrossRef]
  13. Taylor, S. Understanding and Managing Pandemic-Related Panic Buying. J. Anxiety Disord. 2021, 78, 102364. [Google Scholar] [CrossRef] [PubMed]
  14. Prentice, C.; Quach, S.; Thaichon, P. Antecedents and Consequences of Panic Buying: The Case of COVID-19. Int. J. Consum. Stud. 2021, 46, 132–146. [Google Scholar] [CrossRef]
  15. Yuen, K.F.; Wang, X.; Ma, F.; Li, K.X. The Psychological Causes of Panic Buying Following a Health Crisis. Int. J. Environ. Res. Public Health 2020, 17, 3513. [Google Scholar] [CrossRef] [PubMed]
  16. Kursan Milaković, I. Purchase Experience during the COVID-19 Pandemic and Social Cognitive Theory: The Relevance of Consumer Vulnerability, Resilience, and Adaptability for Purchase Satisfaction and Repurchase. Int. J. Consum. Stud. 2021, 45, 1425–1442. [Google Scholar] [CrossRef]
  17. Baker, E.J. Household Preparedness for the Aftermath of Hurricanes in Florida. Appl. Geogr. 2011, 31, 46–52. [Google Scholar] [CrossRef]
  18. Keane, M.; Neal, T. Consumer Panic in the COVID-19 Pandemic. J. Econom. 2021, 220, 86–105. [Google Scholar] [CrossRef]
  19. Shanthakumar, S.G.; Seetharam, A.; Ramesh, A. Understanding the Socio-Economic Disruption in the United States during COVID-19’s Early Days. Available online: http://arxiv.org/abs/2004.05451 (accessed on 11 April 2020).
  20. Brugarolas, M.; Martínez-Carrasco, L.; Rabadán, A.; Bernabéu, R. Innovation Strategies of the Spanish Agri-Food Sector in Response to the Black Swan COVID-19 Pandemic. Foods 2020, 9, 1821. [Google Scholar] [CrossRef]
  21. Billore, S.; Anisimova, T. Panic Buying Research: A Systematic Literature Review and Future Research Agenda. Int. J. Consum. Stud. 2021, 45, 777–804. [Google Scholar] [CrossRef]
  22. Chua, G.; Yuen, K.F.; Wang, X.; Wong, Y.D. The Determinants of Panic Buying during COVID-19. Int. J. Environ. Res. Public Health 2021, 18, 3247. [Google Scholar] [CrossRef] [PubMed]
  23. Dulam, R.; Furuta, K.; Kanno, T. Consumer Panic Buying: Realizing Its Consequences and Repercussions on the Supply Chain. Sustainability 2021, 13, 4370. [Google Scholar] [CrossRef]
  24. Kaur, A.; Malik, G. Understanding the Psychology Behind Panic Buying: A Grounded Theory Approach. Glob. Bus. Rev. 2020, 1–14. [Google Scholar] [CrossRef]
  25. Li, X.; Zhou, Y.; Wong, Y.D.; Wang, X.; Yuen, K.F. What Influences Panic Buying Behaviour? A Model Based on Dual-System Theory and Stimulus-Organism-Response Framework. Int. J. Disaster Risk Reduct. 2021, 64, 102484. [Google Scholar] [CrossRef]
  26. Arafat, S.M.Y.; Kar, S.K.; Marthoenis, M.; Sharma, P.; Hoque Apu, E.; Kabir, R. Psychological Underpinning of Panic Buying during Pandemic (COVID-19). Psychiatry Res. 2020, 289, 113061. [Google Scholar] [CrossRef]
  27. Roșu, M.-M.; Ianole-Călin, R.; Dinescu, R.; Bratu, A.; Papuc, R.-M.; Cosma, A. Understanding Consumer Stockpiling during the COVID-19 Outbreak through the Theory of Planned Behavior. Mathematics 2021, 9, 1950. [Google Scholar] [CrossRef]
  28. Lehberger, M.; Kleih, A.-K.; Sparke, K. Panic Buying in Times of Coronavirus (COVID-19): Extending the Theory of Planned Behavior to Understand the Stockpiling of Nonperishable Food in Germany. Appetite 2021, 161, 105118. [Google Scholar] [CrossRef]
  29. Wilk, V.; Mat Roni, S.; Jie, F. Supply Chain Insights from Social Media Users’ Responses to Panic Buying during COVID-19: The Herd Mentality. Asia Pac. J. Mark. Logist. 2022. [Google Scholar] [CrossRef]
  30. Arafat, S.M.Y.; Kar, S.K.; Menon, V.; Alradie-Mohamed, A.; Mukherjee, S.; Kaliamoorthy, C.; Kabir, R. Responsible Factors of Panic Buying: An Observation From Online Media Reports. Front. Public Health 2020, 8, 4–9. [Google Scholar] [CrossRef]
  31. Arafat, S.M.Y.; Ahmad, A.R.; Murad, H.R.; Kakashekh, H.M. Perceived Impact of Social Media on Panic Buying: An Online Cross-Sectional Survey in Iraqi Kurdistan. Front. Public Health 2021, 9, 668153. [Google Scholar] [CrossRef]
  32. Jin, X.; Li, J.; Song, W.; Zhao, T. The Impact of COVID-19 and Public Health Emergencies on Consumer Purchase of Scarce Products in China. Front. Public Health 2020, 8, 617166. [Google Scholar] [CrossRef] [PubMed]
  33. Garbe, L.; Rau, R.; Toppe, T. Influence of Perceived Threat of Covid-19 and HEXACO Personality Traits on Toilet Paper Stockpiling. PLoS ONE 2020, 15, e0234232. [Google Scholar] [CrossRef] [PubMed]
  34. Ahmed, R.R.; Streimikiene, D.; Rolle, J.-A.; Duc, P.A. The COVID-19 Pandemic and the Antecedants for the Impulse Buying Behavior of US Citizens. J. Compet. 2020, 12, 5–27. [Google Scholar] [CrossRef]
  35. Micalizzi, L.; Zambrotta, N.S.; Bernstein, M.H. Stockpiling in the Time of COVID-19. Br. J. Health Psychol. 2020, 26, 535–543. [Google Scholar] [CrossRef]
  36. Wang, E.; An, N.; Gao, Z.; Kiprop, E.; Geng, X. Consumer Food Stockpiling Behavior and Willingness to Pay for Food Reserves in COVID-19. Food Secur. 2020, 12, 739–747. [Google Scholar] [CrossRef] [PubMed]
  37. Wang, H.H.; Hao, N. Panic Buying? Food Hoarding during the Pandemic Period with City Lockdown. J. Integr. Agric. 2020, 19, 2916–2925. [Google Scholar] [CrossRef]
  38. Singh, G.; Aiyub, A.S.; Greig, T.; Naidu, S.; Sewak, A.; Sharma, S. Exploring Panic Buying Behavior during the COVID-19 Pandemic: A Developing Country Perspective. Int. J. Emerg. Mark. 2021; ahead-of-print. [Google Scholar] [CrossRef]
  39. Chen, T.; Jin, Y.; Yang, J.; Cong, G. Emergence Model of Group Panic Buying Behavior under the COVID-19 Pandemic. J. Retail. Consum. Serv. 2022, 67, 102970. [Google Scholar] [CrossRef]
  40. Grashuis, J.; Skevas, T.; Segovia, M.S. Grocery Shopping Preferences during the COVID-19 Pandemic. Sustainability 2020, 12, 5369. [Google Scholar] [CrossRef]
  41. Preoţiuc-Pietro, D.; Volkova, S.; Lampos, V.; Bachrach, Y.; Aletras, N. Studying User Income through Language, Behaviour and Affect in Social Media. PLoS ONE 2015, 10, e0138717. [Google Scholar] [CrossRef]
  42. Ismail, O.; Sharnoubi, O. El Corona Panic Buyers Are Mostly Rich People, Grocers Say. Available online: https://www.madamasr.com/en/2020/03/22/feature/society/corona-panic-buyers-are-mostly-rich-people-grocers-say/ (accessed on 29 October 2020).
  43. Warren, K. Grocery Stores in the Richest and Poorest Parts of NYC Are Struggling, but for Very Different Reasons. It’s yet Another Sign of How Diferently the Wealthy Are Weathering the Pandemic. Available online: https://www.businessinsider.com/nyc-grocery-stores-struggling-wealth-flight-jobs-cut-2020-4 (accessed on 29 October 2020).
  44. O’Connell, M.; de Paula, Á.; Smith, K. Preparing for a Pandemic: Spending Dynamics and Panic Buying during the COVID-19 First Wave. Fisc. Stud. 2021, 42, 249–264. [Google Scholar] [CrossRef]
  45. Abras. Abras Essencial. 2020, p. 116. Available online: https://superhiper.abras.com.br/pdf/259.pdf (accessed on 21 February 2022).
  46. Sorensen, H.; Bogomolova, S.; Anderson, K.; Trinh, G.; Sharp, A.; Kennedy, R.; Page, B.; Wright, M. Fundamental Patterns of In-Store Shopper Behavior. J. Retail. Consum. Serv. 2017, 37, 182–194. [Google Scholar] [CrossRef]
  47. Sphere Association. The Sphere Handbook: Humanitarian Charter and Minimum Standards in Humanitarian Response, 4th ed.; Sphere Association: Geneva, Switzerland, 2018; Volume 1, ISBN 9781908176707. [Google Scholar]
  48. IBGE. IBGE Pop e Domicilios Censo 2010. Available online: http://www.ibge.gov.br/home/estatistica/populacao/censo2010/default_resultados_universo.shtm (accessed on 1 December 2011).
  49. SEADE. Fundação Sistema Estadual de Análise de Dados São Paulo Diversa: Uma Análise a Partir de Regiões Da Cidade. Available online: https://www.seade.gov.br/wp-content/uploads/2020/01/Pesquisa-SEADE_Aniversario-SP_23jan2020.pdf (accessed on 17 October 2020).
  50. Parente, J.; Kato, H.T. Área de Influência: Um Estudo No Varejo de Supermercados. Rev. Adm. Empres. 2001, 41, 46–53. [Google Scholar] [CrossRef]
  51. Parente, J.; Kato, H.T. Um Estudo Dos Supermercados No Brasil: Uma Investigação Sobre a Área de Influência. In Proceedings of the XXVII Encontro da ANPAD; Associação Nacional de Pós Graduação e Pesquisa em Administração: Atibaia, Brazil, 2003; pp. 1–17. [Google Scholar]
  52. SEADE. Fundação Sistema Estadual de Análise de Dados Dados COVID-19 Municípios. Available online: https://www.seade.gov.br/wp-content/uploads/coronavirus-files/Dados-covid-19-municipios.csv (accessed on 17 November 2022).
  53. Fávero, L.P.; Belfiore, P. Manual de Análise de Dados, 1st ed.; Elsevier: Rio de Janeiro, Brazil, 2017; ISBN 978-85-352-7087-7. [Google Scholar]
  54. Hair, J.F.; Black, W.C.; Babin, B.J.; Anderson, R.E.; Tatham, R.L. Análise Multivariada de Dados, 6th ed.; Bookman: Porto Alegre, Brazil, 2009; ISBN 9788577805341. [Google Scholar]
  55. Gordon, B.R.; Goldfarb, A.; Li, Y. Does Price Elasticity Vary with Economic Growth? A Cross-Category Analysis. J. Mark. Res. 2013, 50, 4–23. [Google Scholar] [CrossRef] [Green Version]
  56. Hunter, L.; Gerritsen, S.; Egli, V. Changes in Eating Behaviours Due to Crises, Disasters and Pandemics: A Scoping Review. Nutr. Food Sci. 2022; ahead-of-print. [Google Scholar] [CrossRef]
  57. Hirvonen, K.; Brauw, A.; Abate, G.T. Food Consumption and Food Security during the COVID-19 Pandemic in Addis Ababa. Am. J. Agric. Econ. 2021, 103, 772–789. [Google Scholar] [CrossRef] [PubMed]
  58. Zboraj, M. How the Pandemic Has Affected Eating Habits Acosta Report Details Changes in Consumer Dining, Offers Insight into Post-Pandemic Eating Trends Also Worth Reading Pandemic Category Sales Poised to Outlast Pandemic. Available online: https://progressivegrocer.com/how-pandemic-has-affected-eating-habits (accessed on 21 February 2022).
  59. Brandtner, P.; Darbanian, F.; Falatouri, T.; Udokwu, C. Impact of COVID-19 on the Customer End of Retail Supply Chains: A Big Data Analysis of Consumer Satisfaction. Sustainability 2021, 13, 1464. [Google Scholar] [CrossRef]
  60. Holguín-Veras, J.; Encarnación, T.; Van Wassenhove, L.N.; Pokharel, S.; Cantillo, V.; Amaya, J.; Wachtendorf, T.; Rilling, J. Reducing Material Convergence in Disaster Environments: The Potential of Trusted Change Agents. Transp. Res. Part E Logist. Transp. Rev. 2022, 162, 102736. [Google Scholar] [CrossRef]
  61. Kahneman, D. Thinking, Fast and Slow; Farrar, Straus and Giroux: New York, NY, USA, 2013; ISBN 9780374275631. [Google Scholar]
  62. Gupta, S.; Gentry, J.W. ‘Should I Buy, Hoard, or Hide?’—Consumers’ Responses to Perceived Scarcity. Int. Rev. Retail. Distrib. Consum. Res. 2019, 29, 178–197. [Google Scholar] [CrossRef]
  63. Lee, H.L.; Padmanabhan, V.; Whang, S. Information Distortion in a Supply Chain: The Bullwhip Effect. Manag. Sci. 2004, 50, 1875–1886. [Google Scholar] [CrossRef]
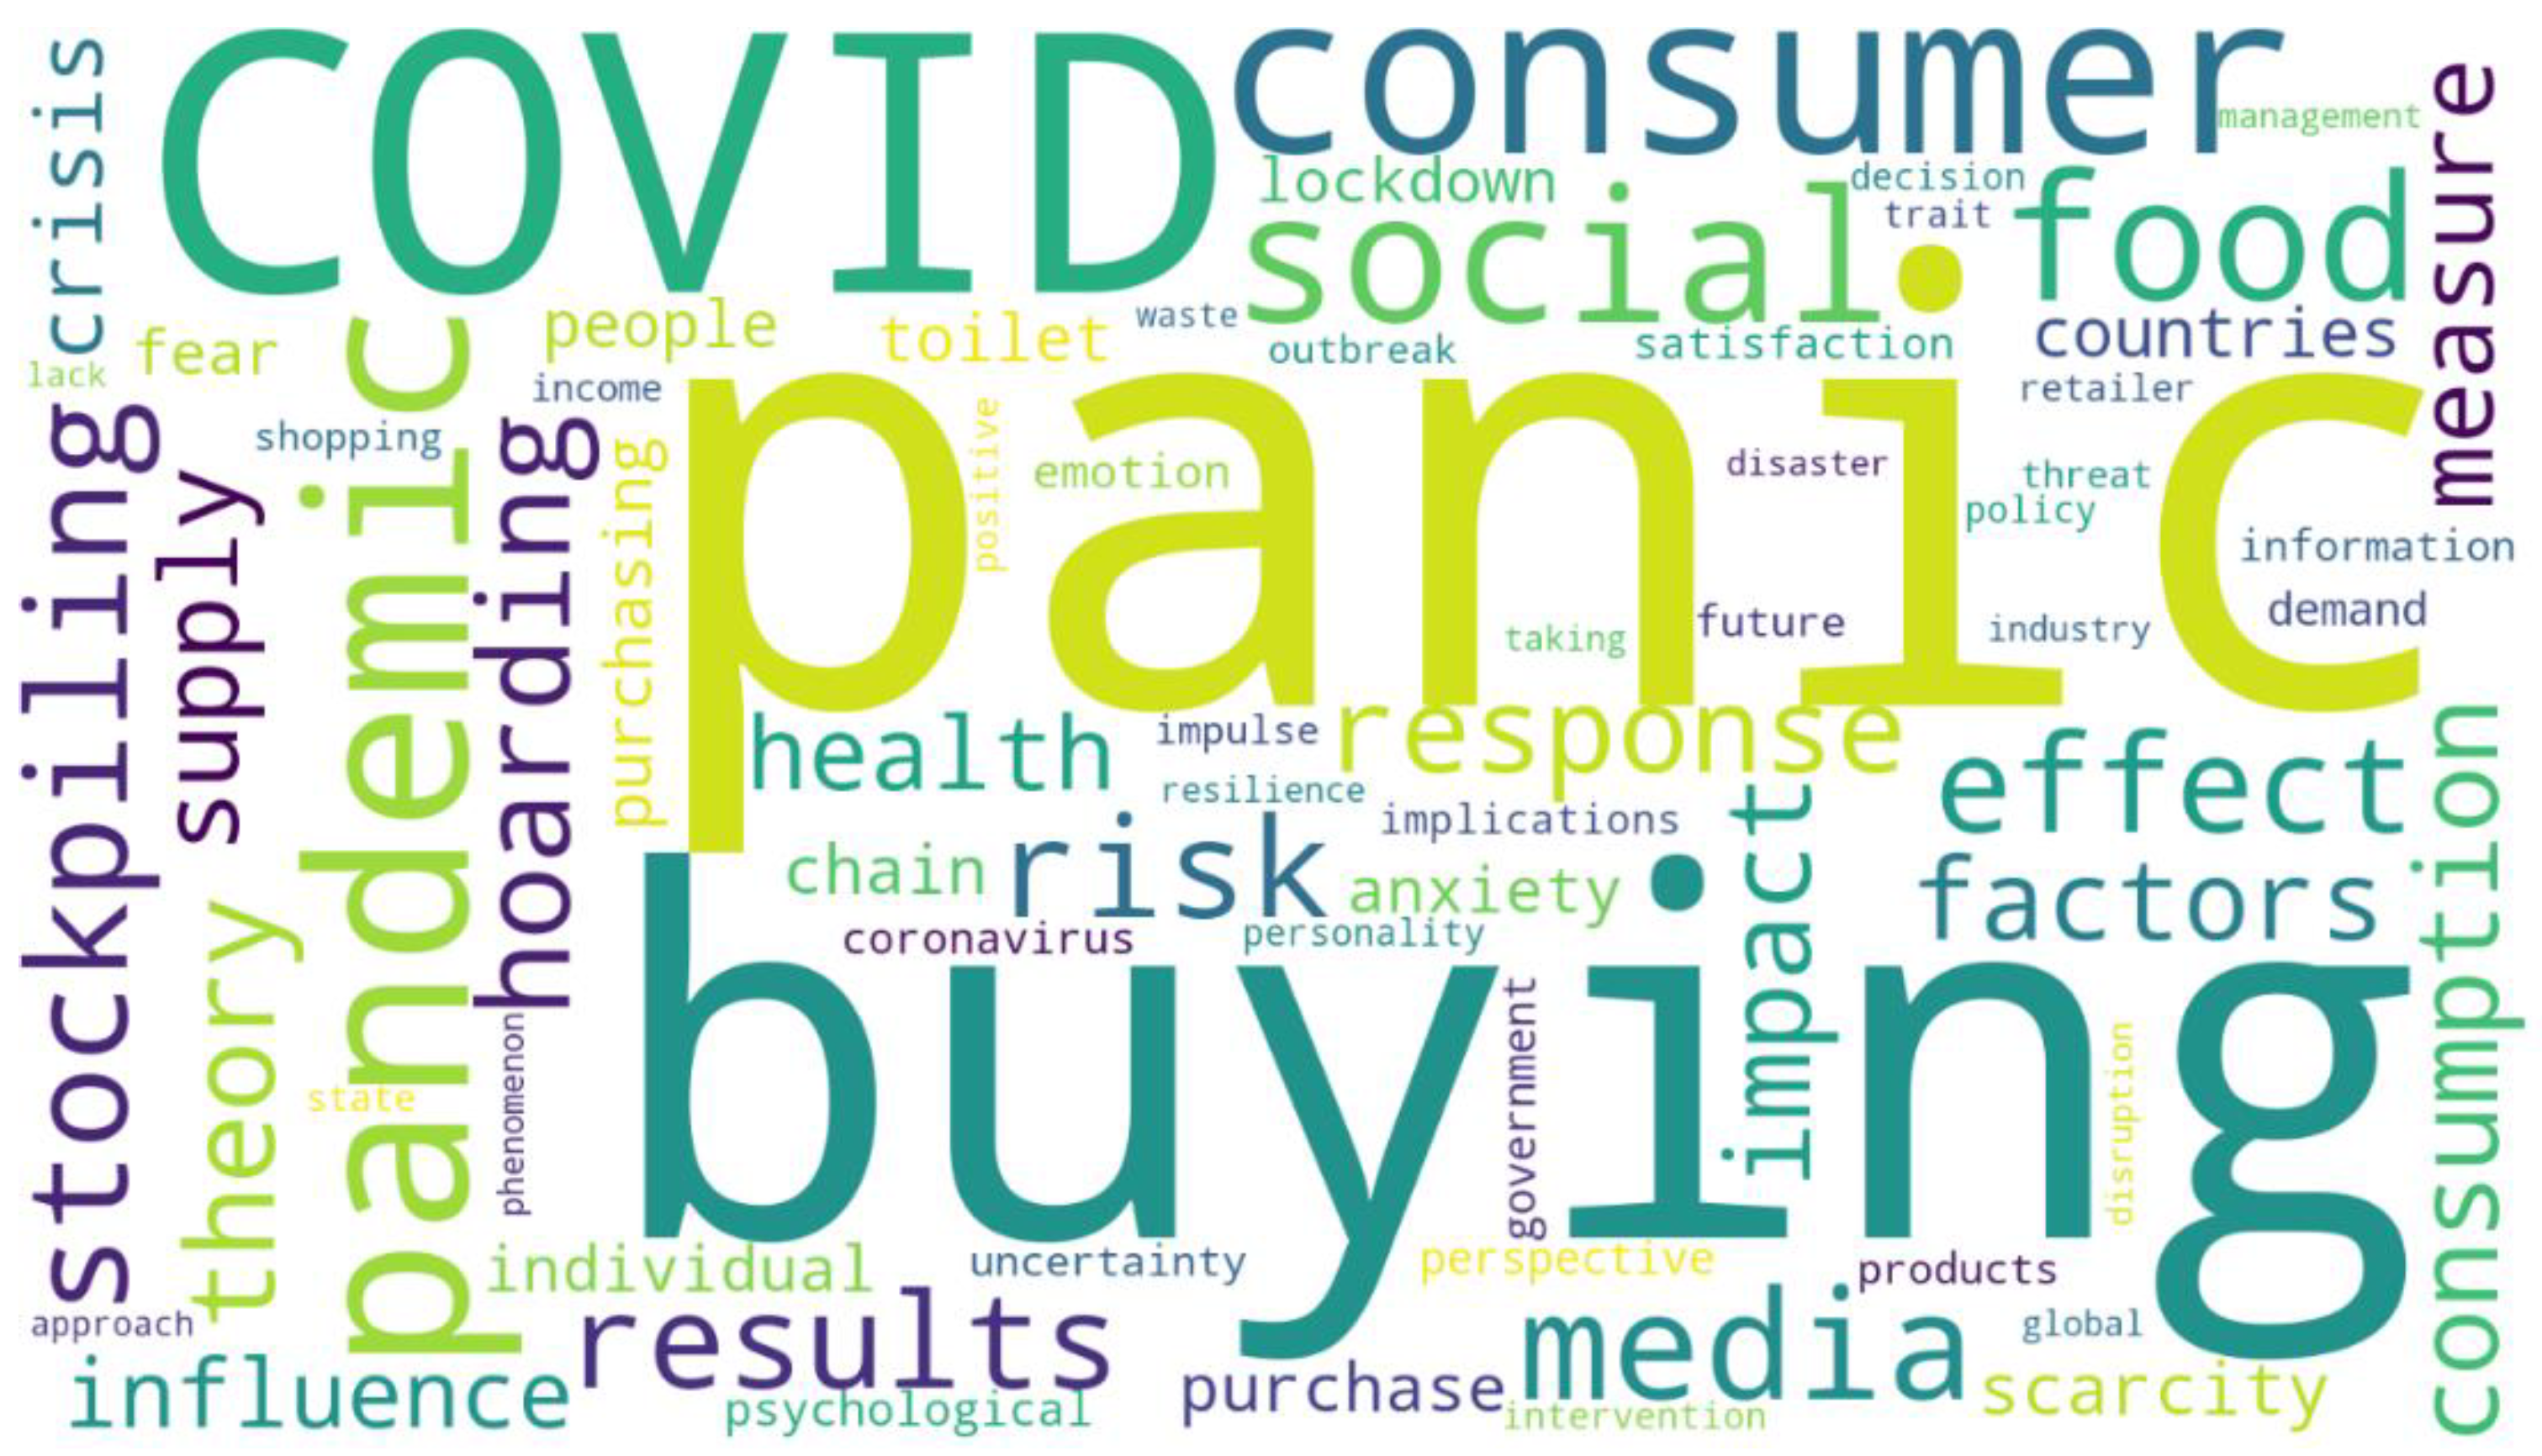
Figure 1. Word cloud of the most important terms in the research articles. Source: The authors, using Wordcloud Python library.
Sustainability 15 01228 g001
Figure 2. Spatial distribution of per capita income and the stores influence zones. Map data: Maptitude Software, Caliper® (functions: buffer layer and thematic map).
Sustainability 15 01228 g002
Figure 3. PB Ratio according to per capita income and product category. (Note: TP: Toilet paper, FS: Food Staples, HC: Hygiene and Cleansing). Source: The authors.
Sustainability 15 01228 g003
Figure 4. Toilet paper sales during the 90 days (y-axis values are intentionally omitted to preserve confidentiality). Source: The authors.
Sustainability 15 01228 g004
Figure 5. Food staples category sales during the 90 days (y-axis values are intentionally omitted to preserve confidentiality). Source: The authors.
Sustainability 15 01228 g005
Figure 6. Meat category sales during the 90 days (Y-axis values are intentionally omitted to preserve confidentiality). Source: The authors.
Sustainability 15 01228 g006
Figure 7. Meat category sales variation in the during–before and during–after periods according to quartiles (note: the variation in the before–after period was not significant). Source: The authors.
Sustainability 15 01228 g007
Figure 8. Hygiene and cleansing category sales during the 90 days (y-axis values are intentionally omitted to preserve confidentiality). Source: The authors.
Sustainability 15 01228 g008
Figure 9. Candies category sales during the 90 days (y-axis values are intentionally omitted to preserve confidentiality). Source: The authors.
Sustainability 15 01228 g009
Table 1. Income quartile ranges.
QuartileIncome Range (BRL)Income Range (USD)
1770–1876435–1066
21958–35211113–2001
33555–56432020–3207
45785–10,8893287–6178
Table 2. Regression model and statistics information for each product category.
CategoryBest Fitr2p-ValueNormalityHomoscedasticity
Toilet paperLog0.7727***AcceptAccept
Food staplesSemilog0.7181***AcceptAccept
MeatLog0.8075***AcceptAccept
Hygiene and cleansingLog0.6860***AcceptAccept
CandiesSemilog0.4919***RejectAccept
Signif. Code: ‘***’ [0, 0.001]. Source: The authors.
Table 3. Independence test: income quartiles and the difference between the means of the periods before and after.
CategoryChi2p-Value (prob > Chi2)
Toilet Paper45.12***
Food Staples8.16*
Meat5.670.129
Hygiene and cleansing4.400.221
Candies6.410.093
Signif. Codes: ‘***’ [0, 0.001], ‘*’ (0.01, 0.05]. Source: The authors.
Table 4. Independence test: income quartiles and the difference between the means of the periods before and during.
CategoryChi2p-Value (prob > Chi2)
Toilet Paper78.12***
Food Staples60.63***
Meat75.34***
Hygiene and cleansing78.10***
Candies3.850.278
Signif. Code: ‘***’ [0, 0.001]. Source: The authors.
Table 5. Independence test: income quartiles and the difference between the means of the periods during and after.
CategoryChi2p-Value (prob > Chi2)
Toilet Paper60.73***
Food Staples88.53***
Meat81.58***
Hygiene and cleansing80.25***
Candies1.480.687
Signif. Code: ‘***’ [0, 0.001]. Source: The authors.
Disclaimer/Publisher’s Note: The statements, opinions and data contained in all publications are solely those of the individual author(s) and contributor(s) and not of MDPI and/or the editor(s). MDPI and/or the editor(s) disclaim responsibility for any injury to people or property resulting from any ideas, methods, instructions or products referred to in the content.