Article

Combined Investigation of Indoor Environmental Conditions and Energy Performance of an Aquatic Center

by
Giannis Papadopoulos
,
Evangelos I. Tolis
and
Giorgos Panaras
*
Department of Mechanical Engineering, University of Western Macedonia, 501 00 Kozani, Greece
*
Author to whom correspondence should be addressed.
Sustainability 2023, 15(2), 1318; https://doi.org/10.3390/su15021318
Submission received: 17 December 2022 / Revised: 4 January 2023 / Accepted: 5 January 2023 / Published: 10 January 2023
(This article belongs to the Special Issue Indoor Environmental Quality and Energy Sustainability)

Abstract

:
This study presents a combined investigation of indoor environmental conditions and energy performance in a naturally ventilated aquatic center in Western Macedonia, Greece. The experimental analysis was conducted over nine days during the summer. The operative temperature exceeded the acceptable limits for most days, while the same can be stated for the PMV, demonstrating high indoor air and radiant temperature values. The weaknesses of applying the above thermal comfort models in this type of buildings are also discussed. Relative humidity presents generally acceptable values during operation time, indicating the contribution of natural ventilation; nevertheless, as demonstrated by the CO2 concentration values, the ventilation rate can be further increased. On the basis of the above findings, a renovation scenario has been formulated, considering the installation of an air-conditioning system, as well as specific interventions, towards the improvement of the building envelope and systems’ thermal performance. A dynamic energy analysis, based on Energy Plus software, had energy savings of 9%, noting the considerable upgrade of indoor conditions. Overall, the proposed combined investigation approach proved to be suitable for such a complicated problem, as the one of indoor aquatic centers, presenting a high generalization potential.

1. Introduction

Physical activity is one of the most basic human functions that is essential for maintaining good health. The World Health Organization (WHO) recommends that adults, including senior citizens, undertake at least 2.5 h of moderately intense aerobic activity per week [1]. With an increasing number of sports enthusiasts worldwide, the number of indoor sports facilities and workers in these facilities has dramatically increased in recent decades. Indoor swimming pools are the second most popular sport facilities worldwide and have the highest energy consumption amongst sports centers and outdoor pools [2]. Thus, it is important to investigate indoor environmental conditions, noting that thermal comfort is of particular interest due to the high levels of relative humidity, a high metabolic rate, and clothing worn by the athletes. Moreover, indoor air quality (IAQ) is important in terms of its potential ventilation insufficiency, combined with the emission of pool water-cleaning disinfectants and their potential reaction to indoor air substances. High occupancy levels and the types of activity are also related to the IAQ of the sports facilities [3]. Given the high demand for the regulation of indoor environmental conditions, air conditioning can be critical, as highlighted by energy consumption aspects.
Thermal comfort is defined as “the condition of mind which expresses satisfaction with the thermal environment” [4]. Specific standards have been developed, while presenting regular revisions; these standards are the ISO 7730 [5], ANSI/ASHRAE 55 [4], EN 15251 [6], EN 16789-2 [7], which is the updated version of the EN15251, and ISO 7726 [8]. Thus far, two main approaches are being used in the design and evaluation of thermal indoor environments according to the above standards: the predicted mean vote (PMV) approach and the adaptive approach. The PMV approach refers to a static model first developed by P.O. Fanger [4,5] and based on heat balance studies, while the adaptive approach is based on results obtained from field surveys correlated with data on climatic conditions [9]. The PMV index is a function of six parameters. Four of them are the subjective parameters of air temperature, mean radiant temperature, wind velocity, and vapor pressure, while the remaining two are personal factors, namely clothing thermal properties and metabolic rate. The subjective parameters can be measured according to ISO 7726 [8] and ANSI/ASHRAE 2020 [4] using the appropriate equipment, despite the personal parameters whose values are based on the aforementioned standards [4,6,7]. Adaptive comfort theory suggests that when people feel uncomfortable, they react to that discomfort with adaptive behavior [9]. This suggests that people overcome their thermal discomfort by adaptive behavior, such as consuming hot or cold beverages, changing clothes, and opening windows or doors. These models are based on relationships between the mean outdoor temperature and indoor operative temperature [4,6,7]. Table 1 presents the characteristics of the above standards. ANSI/ASHRAE [4] contains one thermal comfort category for Fanger and an adaptive model, while European standards EN16798-2 and EN15251 contain three different categories. Category I is recommended for buildings, such as hospitals, where a high level of thermal expectation is required, while Categories II and III are recommended for normal and moderate levels of expectations. The assessment of thermal comfort can also combine subjective and objective surveys in all types of buildings, in order to accurately determine the occupants of a particular building [10,11,12,13,14,15,16].
Concentrating on the thermal comfort of aquatic centers, the recommended temperature range for indoor swimming pools ranges from 24 to 29 °C, while for relative humidity, the indicated range is from 50 to 60% [17]. Given these temperature limits, swimmers leaving the pool will expect and prefer higher temperatures since they are wet and have less clothing. According to the ASHRAE Handbook [17], air temperatures in public and institutional pools should be maintained at 1–2 °C above the pool temperature to reduce the evaporation rate and avoid the effects of the cold on swimmers. Rajagopalan and Luther [18] analyzed thermal comfort parameters and investigated forced and natural ventilation solutions in an indoor athletic center, including a swimming pool, located in Victoria, Australia. The experimental results show overheating periods within the space, mainly during peak hours of the day, due to the lack of a cooling system and high solar radiation. The ventilation rate that is measured using the fans is about 2.67 h−1, while without any fan operating it is about 0.4 h−1. Despite the low ventilation rate, CO2 concentration during occupancy periods was kept low due to the high volume of the aquatic center. Additionally, the relative humidity does not appear to cause a problem. Rajagopalan and Jamei [19] analyzed the thermal comfort conditions of various user groups in seven aquatic centers in Australia. Comfort measurements were performed through monitoring environmental parameters and surveying swimmers, staff, and spectators. The assessment of thermal comfort was achieved using the Fanger approach. The results show that a high air temperature and relative humidity lead to mean values of PMV that are higher than 0.5, which is the limit value for thermal comfort, regardless of the building type. PMV values of staff and spectators are similar, while the PMV for swimmers is lower. Thermal sensation votes of spectators between slightly warm and warm are most common despite swimmers’ votes, ranging from neutral to slightly warm for most buildings. Values of thermal voting and PMV do not seem to be correlated, while it was found that thermal voting of swimmers, as opposed to staff and spectators, did not have a significant correlation with indoor temperature. Two other studies assessed thermal comfort at an aquatic center and gym located at Cesano, Rome [20,21], and aspects of energy consumption are considered. The PMV/PPD values were calculated for three different categories of users, namely spectators, wet swimmers, and dry swimmers, while an uncertainty analysis was implemented for the Fanger model. The PMV values for the wet swimmers lie within the comfort zone (−0.5 ≤ PMV ≤ 0.5), while for the dry swimmers and spectators the PMV values range from 1 to 1.5, indicating warm conditions. The subjective approach of the thermal comfort was assessed using questionnaires provided by ISO 10551 [22], noting that only wet swimmers participated in this survey. The values of thermal sensation votes (TSV) are similar to PMV values. The uncertainty analysis showed that metabolic rate is the most sensitive parameter, especially for environments such as sports facilities, as users have high activity level.
Other studies focus on the IAQ and ventilation strategies of aquatic centers. Panaras et al. [23] applied extensive measurements for indoor climate thermal parameters, attempting to determine the air exchange rate through CO2 measurements. Indoor air quality (IAQ) can also be critical for the health of the swimmers [24], as high concentrations of trihalomethanes (THMs) and chloramines may be found in pool water and in the air of indoor swimming pools [25]. Ventilation is one of the main methods used to improve the IAQ of relevant premises, reducing the concentration of potentially harmful chemicals [26,27].
Many studies have focused on the energy efficiency of indoor aquatic centers. Trianti et al. [2] studied energy audits in indoor swimming pools in Greece, evaluating the energy impact of retrofit actions, while Kampel et al. [28], on the basis of a survey of Norwegian premises, highlight the need to determine the most important parameters influencing the energy performance of indoor aquatic centers in order to make predictions. Duverge et al. [29] aimed to define the characteristics of indoor aquatic centers through a survey on relevant installations in Victoria, Australia; their analysis included energy and water-use data. The effective design and use of heat pumps for heating (including pool water) and potentially cooling, but primarily dehumidification, were investigated using a simulation analysis in [30,31,32]. The authors of [33] concentrated on the exploitation of waste heat, and [34,35] focused on the application of heat recovery systems, including sorption techniques. Tsoka et al. [36] highlighted the importance of investigating natural ventilation practices during the summer months in aquatic centers of continental Europe in order to achieve energy saving. Renewable energy features were also investigated, referring to the use of solar thermal collectors [30] or their combined use with PV systems, also indicating the key role of building envelope characteristics on energy consumption reduction [37]. The possibility of using swimming pools as a long-term cooling energy storage solution was also investigated [38]. Perez-Carraminana et al. [39] assessed how the control of solar radiation and natural ventilation on a passive techniques approach can reduce heat gains during summer, lowering the needs of cooling loads, while heat from solar radiation in winter can minimize heating loads. The studied aquatic centers are located in southeastern Spain and are equipped with semi-transparent and telescopic retractable domed covers.
The analysis of the relevant literature shows that thermal comfort and indoor air-quality investigations are lacking, while studies focusing on energy issues do not involve, in principle, indoor environment issues. In the case of Sun et al. [31], the Fanger model is used to determine acceptable indoor conditions, providing input to the energy analysis, while Revel and Arnesano [21] predicted the thermal comfort and energy consumption of a mechanical ventilated aquatic center. The adaptive model was applied in the study by Rajagopalan and Luther [18], noting that it concerns the case of a sports hall within an aquatic center.
The proposed study aims to fill the abovementioned gap. More specifically, a combined investigation of indoor environmental conditions and energy performance on an aquatic center in northern Greece is presented. The measurement campaign, performed through summertime, allows for the assessment of thermal comfort, as well as IAQ, with regard to the application of both Fanger and adaptive models; the limitations of the application of the respective models are discussed. The findings of the survey, referring to thermal comfort and IAQ assessment, provide useful insight into the actual pool conditions and the effective planning of intervention scenarios, while providing input data for the energy dynamic simulation model. This model, based on Energy Plus software [40], enables the effect of the candidate interventions on an energy level to be evaluated. The proposed combination of an indoor environment condition assessment with energy analysis offers the possibility of an integrated, complete approach regarding the achievement of acceptable indoor operating conditions through energy-efficient means.

2. Materials and Methods

2.1. Description of the Premises

The respective aquatic center is a municipal center, located in the city of Kozani in northern Greece. Kozani lies in the Western Macedonia region, characterized by the presence of major coal-fired (lignite) electrical power production units, seemingly affecting the outdoor air quality in this region [41]. It should be noted that the region is undergoing a major decarbonization process via the decommissioning of most lignite-fired power plants, with all units planning to be withdrawn by 2028 in order to address important social, economic, environmental, and energy challenges [42,43]. The aquatic center is part of a greater unit, including an indoor athletic center, as well as an outdoor athletics and football center. The outdoor aquatic facility, which is part of this complex, has been accordingly transformed into the present indoor center. The building envelope can be characterized as derelict due to the deterioration of polyurethane panels, as well as the poor assembly between the frame and the polycarbonic transparent elements, leading to considerable air leakage. The total area of the aquatic center is 1695.36 m2, which is equivalent to one floor installation.
The aquatic center operates throughout the whole year, excluding a summer maintenance period. The opening hours are 9 a.m. to 10.30 p.m. on weekdays, 9 a.m. to 8.30 p.m. on Saturdays, and on Sunday the center hosts specific athletic events.
In order to serve its energy needs, the center makes use of a district heating system, operating from mid-October to mid-May. During the rest of the operating period, the heating of the swimming pool and hot water use preparation is performed by an oil boiler. An inadequate maintenance of energy systems is observed, leading to poor performance. The absence of air-conditioning unit should be emphasized; ventilation is implemented through the occasional opening of windows and doors. Moreover, renewable energy systems are not installed nor are energy-saving systems. Electrical loads are related to lighting (fluorescence and halogen bulbs), as well as to the operation of electrical appliances, mainly including the pumps responsible for the hydraulic installation for the heating as well as the disinfection process of swimming pool water.

2.2. Experimental Setup

An extensive measurement campaign was carried out in the period from 6th June to 7th July, regarding indoor and outdoor climate thermal parameters (air temperature, radiant temperature, relative humidity, air velocity), as well as IAQ parameters, namely CO2 concentration, through the use of relevant portable sensors. The measurement campaign is based on ISO 7726 [8] and ANSI/ASHRAE 55 [4]. Instrumentation is presented in Table 2. The information provided in the table includes the type of instrument and its measuring characteristics, along with an indication of its position. The position of the devices is presented in Figure 1. For the requirements of this analysis, we attempted to cover the indoor air space, with an emphasis on the pool area. The installed height of equipment was mostly in the range of 0.5–2.2 m, aiming to be compliant with the breathing zone of athletes (reported breathing zone height between 0.75 m and 1.8 m) while considering construction and operation constraints. The sensor installed at the center of the space (indicated sensor position 2, Table 2) was set to a height of 4 m, while the sensor installed at the NW side (indicated sensor position 4, Table 2) was also set to a height of 4 m on a horizontal level and installed at the upper side of the spectators’ seats.

2.3. Thermal Comfort Methods

The results of the thermal parameters along with physical parameters of metabolic rate and clothing can be used for the assessment of indoor climate and thermal comfort. As discussed in the introduction, both the predicted mean vote (PMV) approach (based on Fanger’s model) [5] and the adaptive model [4,7] can be applied for thermal comfort prediction, and the latter is more suitable for naturally ventilated spaces, where outdoor conditions influence indoor thermal comfort. This is the case of the studied center, especially during summer.
In terms of the adaptive model, there are some differences in the thermal comfort limits for the valid standards of ANSI/ASHRAE 55 [4] and EN 16798-2 [7]. More specifically, the ranges of acceptable conditions, in terms of operative temperatures in the buildings, are plotted against the prevailing mean outdoor air temperatures, lying between 10 and 33.5 °C for ANSI/ASHRAE Standard 55 [4] and between 10 and 30 °C for the European standard [7]. EN 16798-2 [7] includes three thermal categories, whereas ANSI/ASHRAE Standard 55 [4] includes limits of 90% and 80% acceptability, with the 90% acceptability used when a higher standard of thermal comfort is desired. In this study, the three categories of EN 16798-2 and 80% limits of ASHRAE Standard 55 were used for the characterization of thermal comfort conditions. The limits for clothing (0.5–1 clo) and metabolic rate (1–1.3 met) are the same for both standards. Equation (1) was used to calculate the prevailing mean outdoor air temperatures, where α is a constant between 0 and 1 that controls the speed at which the running mean responds to changes in weather, te(d−1) represents the mean daily outdoor temperature for the previous days, te(d−2) is the mean daily outdoor temperature for the previous day, and so on [4]. Meteorological data were taken from a weather station, which was installed outside the aquatic center, while the constant α was set to 0.8, as it is suggested that this value has better performance in midlatitude climates [44]. The operation temperature is the average of the air and mean radiant temperature since the average value of wind speed is under 0.2 m/s [5]. The mean radiant temperature was estimated on the basis of the measured parameters of surface temperatures using Equation (2), where T1, T2, …, and Tn are the temperatures of the different surfaces (°C), and A1, A2, …, and An are the areas of the different surfaces (m2) [4].
t p m a o u t ¯ = 1 α t e d 1 + a t e d 2 + a 2 t e d 3 + a 3 t e d 4 +
T m r t ¯ = T 1 A 1 + T 2 A 2 + ... + T n A n / A 1 + A 2 + ... + A n
The predicted mean vote index (PMV) and the predicted percentage dissatisfied index (PPD) (Fanger’s thermal comfort indices) were calculated according to the relations proposed by EN ISO 7730, Annex D [5]. The PMV was estimated from measured thermal comfort parameters (air temperature, radiant temperature, air velocity, and relative humidity) along with physical parameters of metabolic rate and clothing. Based on the different physical parameters, the users were categorized into three different categories: swimmers, staff, and spectators. Clothing for swimmers was assumed to be 0.06 clo for simplicity, which is the average value for both male (0.02) and female clothing (0.1). The clothing levels of the staff and spectators were considered to be approximately 0.5 clo for summer clothes. It is noted that the metabolic rate of the swimmers, and for athletes in general, is difficult to calculate [19], while ANSI/ASHRAE Standard 55 [4] and ISO 7730 [5] do not apply to occupants with a high metabolic rate, indicating average values of higher than 2.0 Met and 4.0 Met, respectively. Thus, based on the relevant literature [19,20,21] and international standards [4,5], the metabolic rate of swimmers is considered approximately 2 Met, while for the staff it is approximately 1.7 Met (walking activity), and for the spectators it is approximately 1 Met.

2.4. Simulation Analysis Setup and Assumptions

Energy analysis was based on Energy Plus, providing the opportunity for a dynamic simulation of the aquatic center’s energy behavior [40]. The geometry of the building was inserted through the Energy Plus computational environment.
The building area was categorized into 6 thermal zones; 5 of these zones refer to heated spaces (pool area, administrative spaces (2 zones), dressing rooms, WC), while the technical equipment room was assumed to be unheated. The thermostat regulation was 26 °C (main pool area), 20 °C (other zones), and 28 °C (swimming pool water), according to the requirements of the relevant literature [2,17], as well as the investigation of indoor climatic conditions of the aquatic center proposed in this study and [23]. The presence of people fluctuated between 25 and 200 (athletes or spectators) with regard to the date and time; actual data were used, demonstrating the everyday operation of the center.
In Table 3, the values of various parameters for the building envelope and HVAC systems are presented. Two scenarios were considered: the existing scenario and air-conditioning scenario; these scenarios are discussed in more detail in Section 3.2. The values were obtained through an energy inspection performed according to Technical Directive 20701-1 of the Technical Chamber of Greece [45]. These are in line with the requirements of the 20701-1 directive, especially regarding the assumed thermal insulation values for the basic scenario.

3. Results

3.1. Thermal Comfort Assessment

In Table 4, the average, minimum, and maximum values for thermal comfort parameters, together with CO2 concentration, are presented. These values, corresponding to a logging interval of 10′, refer to the average indication of all sensors for the periods during which the aquatic center was most crowded. These periods concern the 16–20th of June and the 1–4th of July, between 16:00 and 20:00. By this time, many windows are usually open, allowing some degree of natural ventilation, as evidenced by the low CO2 concentration. The indoor air temperature was slightly higher than the outdoor temperature due to inadequate thermal insulation and a high radiant temperature. The values of relative humidity were generally acceptable during operation time and showed that natural ventilation due to open windows clearly limits the evaporation rate of pool water. By the time the windows are closed, high values of moisture reaching saturation are observed.
As shown in Figure 2, the operative temperature for most days exceeds the acceptable limits. Concerning ASHRAE Standard 55-2020 [4], only two days (Days 6 and 7) are within the acceptable limits, while for the EN16798-2 standard [7], operative temperatures lie between the limits of Category III on four different days (Days 3, 5, 6, and 7). The metabolic rate that is considered for the athletes and staff exceeds the limit of 1.3 met of the adaptive model; therefore, the adaptive approach better suits the case of the spectators.
Moreover, the PMV and PPD values were calculated (Figure 3 and Figure 4) according to the measurements. As shown, for the complete period, excluding July 1st (Day 6), the PMV exceeds the high limit values of +0.5 [4] and +0.7 of Category III [7] for all categories of users, while PPD values take a few days to reach the value of 99%. High values of air temperature and mean radiant temperature, which are mostly presented during the sunrise days, were combined with potential high relative humidity values, albeit not to a large extent, thus creating these thermal discomfort conditions. On Day 6, which had the lowest indoor air and mean radiant temperature, PMV values revealed more comfortable conditions, especially for the swimmers. The negative value of −0.58 indicates a cooler sensation for the spectators, due to the lower metabolic rate compared to swimmers and staff, presenting values of 0.31 and 0.68, respectively. The PMV values of this study are much higher compared to the relevant literature [19,20,21]; this can be attributed to the characteristics of the aquatic center envelope and energy systems, i.e., no shading, poor thermal insulation, no cooling, limited ventilation, and the period during which the measurements were performed.
The CO2 concentration measurements can provide a useful input for the natural ventilation flow rate. According to the analysis performed in [23], on the basis of the equilibrium method [46], a value of 0.5–1 h−1 was reported during operating hours; this calculation determined the respective value for the simulation analysis.
The results demonstrate that natural ventilation contributes to a reduction in relative humidity and an increase in indoor air speed, creating a more acceptable environment. Nevertheless, the indoor air temperature increases, while the radiant temperature is affected by the lack of shading devices. The adaptive and Fanger models indicated that thermal comfort was higher than the acceptable limits for the majority of the inspected days. Thus, mechanical ventilation and cooling applications can improve the indoor environment, further levelling CO2 concentration. Relative humidity (by nighttime) may not be reduced, but a swimming pool cover can help in this regard.

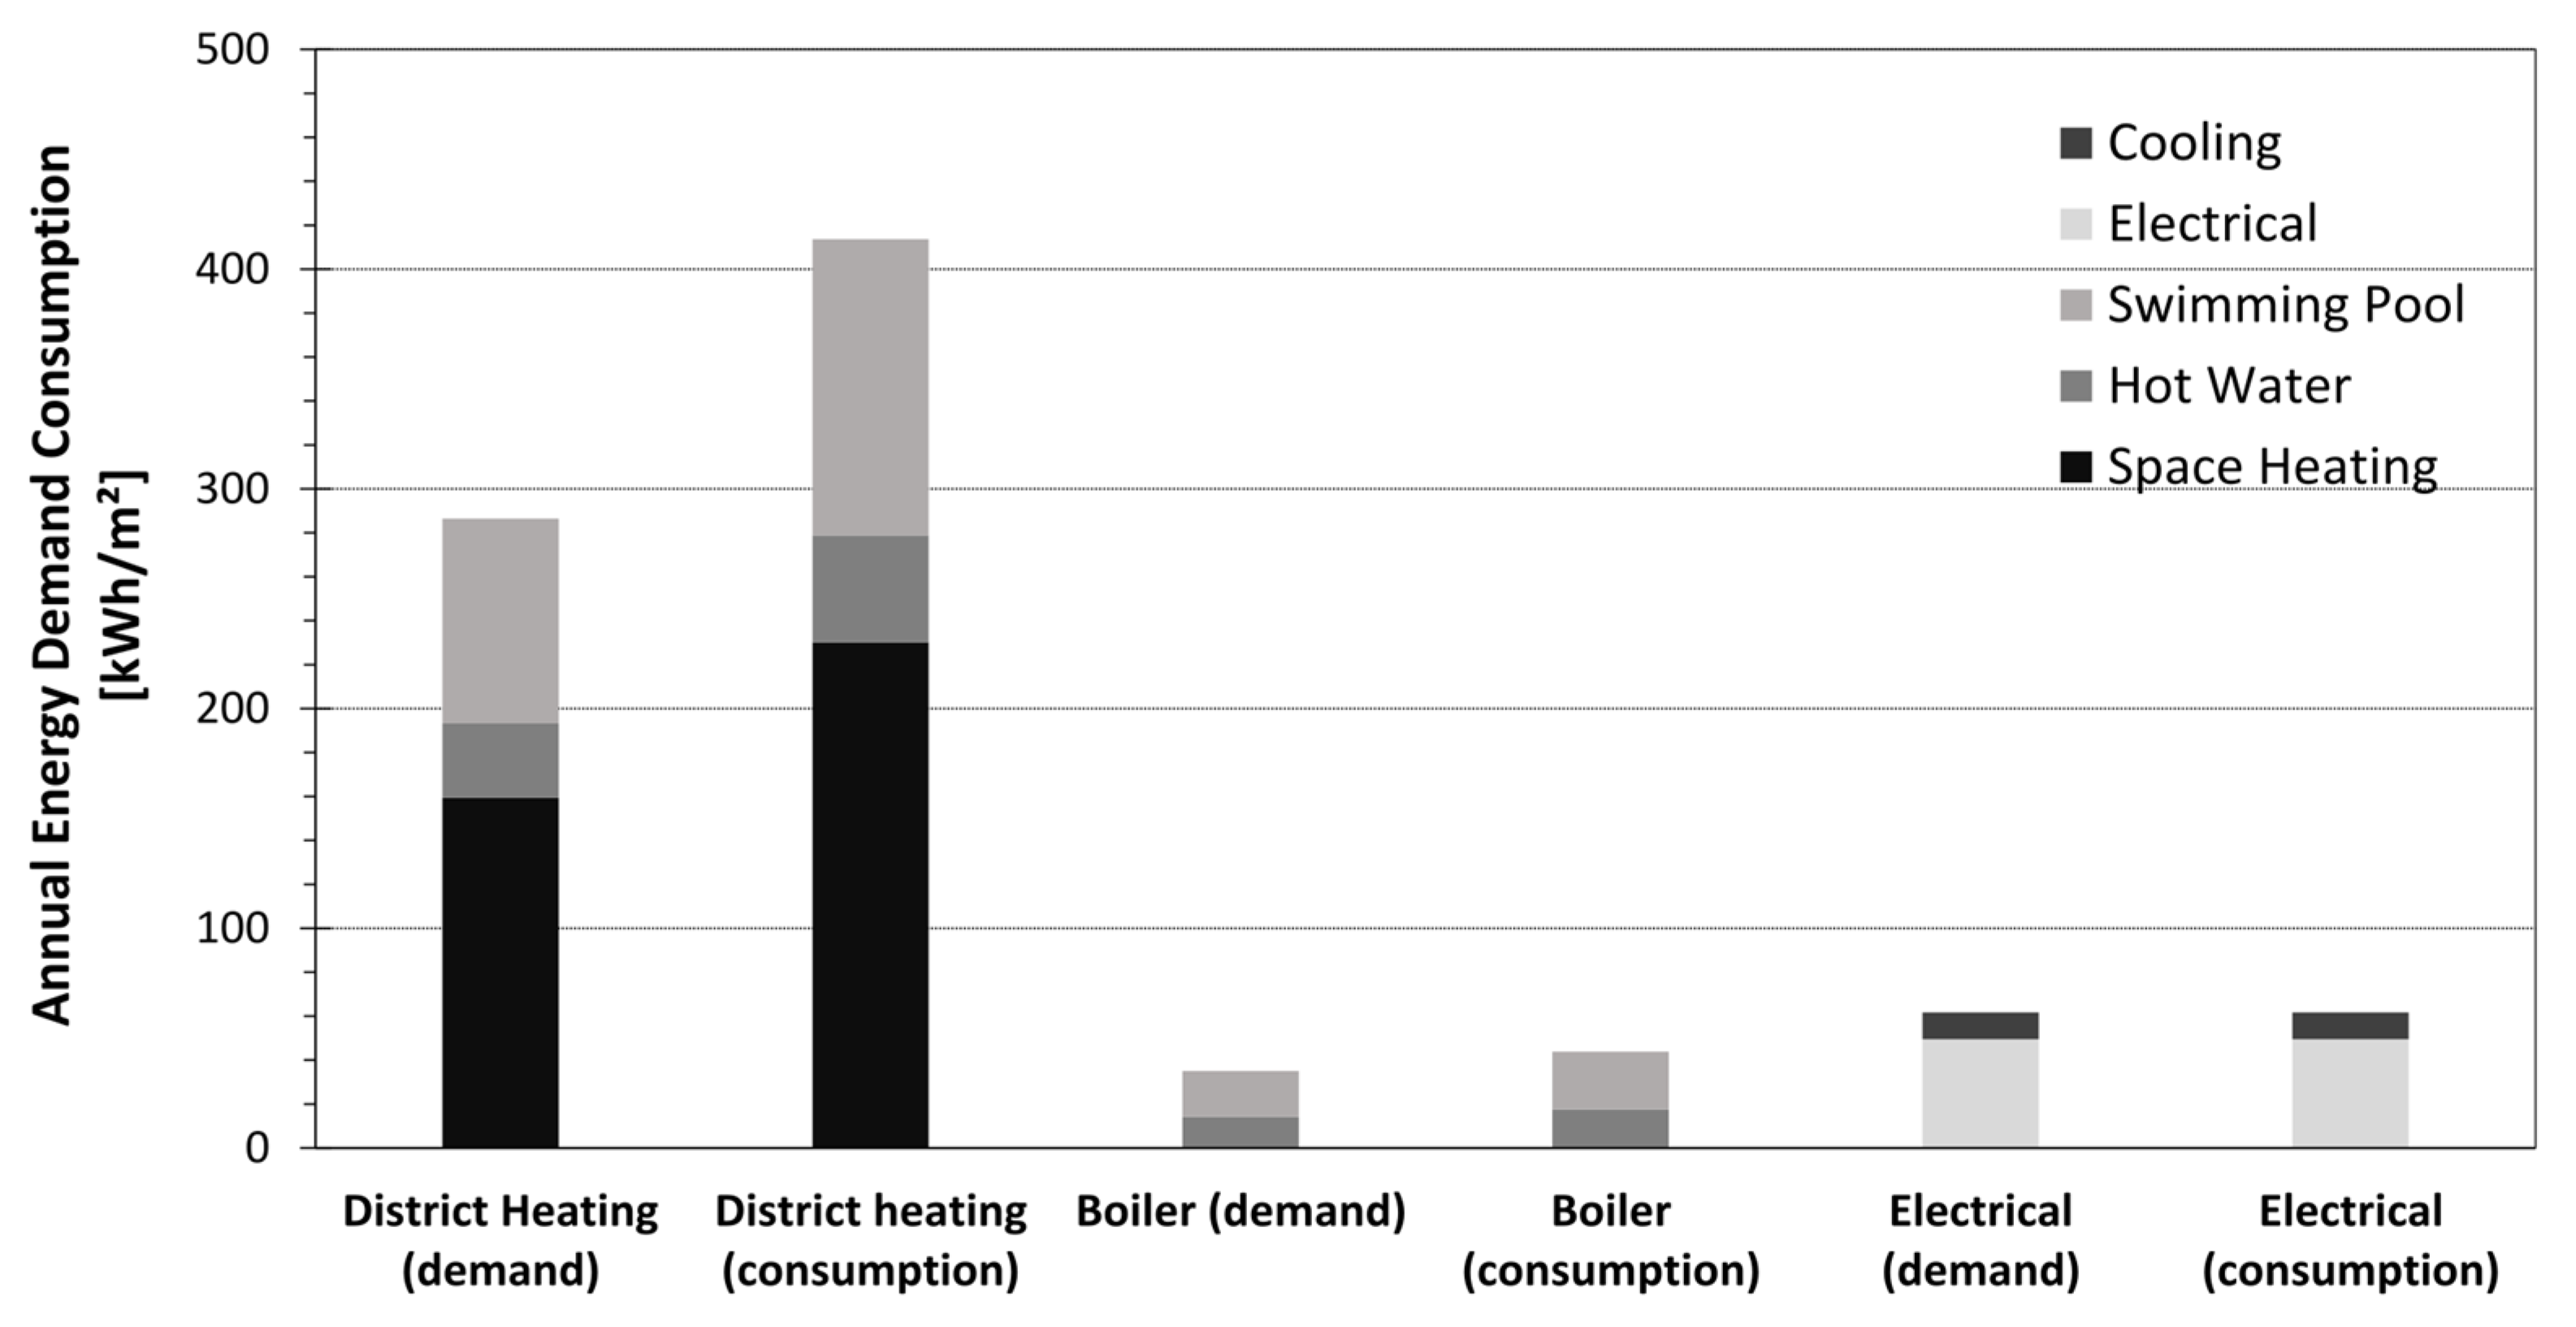
3.2. Energy Analysis

3.2.1. Present Situation

In order to validate the energy performance model, the consumption results were compared with actual energy and fuel consumption data.
Figure 5 and Figure 6 present the simulated energy demand and consumption data for various uses, as well as a comparison with actual consumption data.
As shown in Figure 5, district heating and oil consumption are significantly greater than the demand, indicating the need for energy-saving interventions on the respective systems (piping, thermal storage insulation), with special focus on the replacement of the boiler. Electrical consumption exclusively depends on lights and pumps, as the presence of an air-conditioning unit is not anticipated. Space heating has the greatest demand. According to the comparison with actual data (Figure 6), a greater deviation is observed for district heating, at a level of 9.5%. Given the uncertainties characterizing the parameters entering the analysis, namely the determined energy parameter values and potential schedule deviations, as well as the effect of the typical climatic data to the actual ones of the respective year, the above deviation can be considered acceptable and can lead to further investigations.

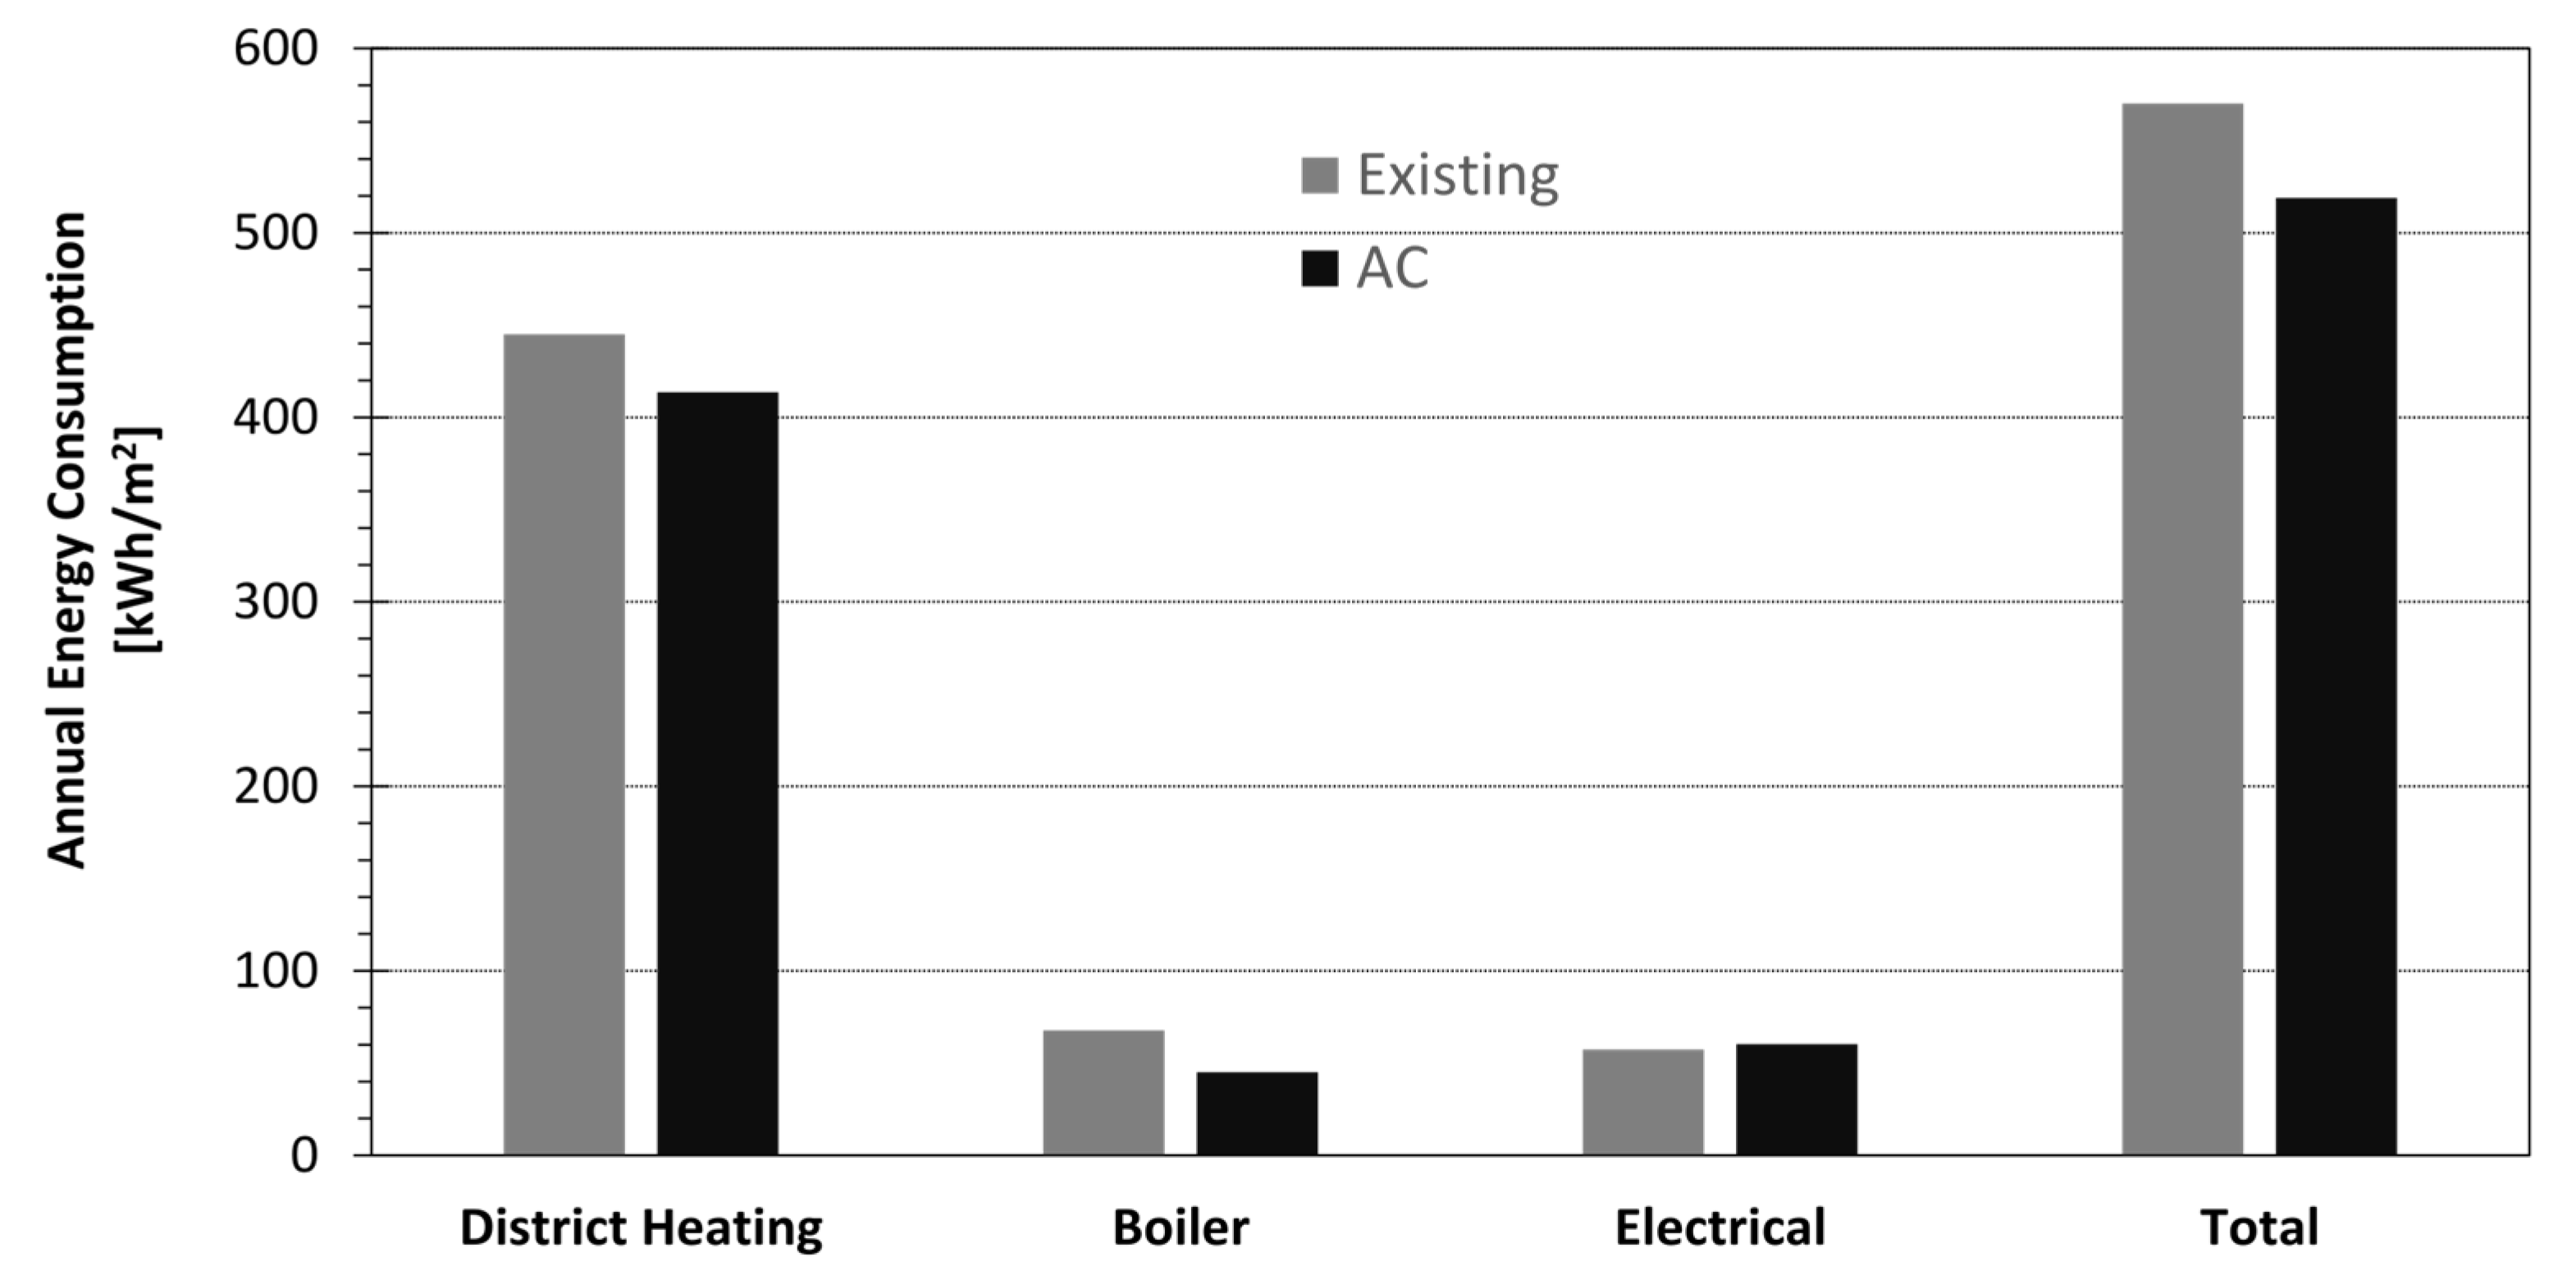
3.2.2. Air-Conditioning System Scenario

The air-conditioning system (AC) scenario includes some basic solutions for the envelope and the installation of an air-conditioning system, regulating the temperature (by summertime), humidity, and air exchange all year round, as well as the anticipation of pool cover and more efficient lighting; the respective system parameters are presented in Table 3. Figure 7 presents the comparison of this scenario to the existing scenario; energy demand/consumption for cooling is also considered due to the presence of the air-conditioning unit. The improvement of the district heating and boiler system contributes to the decrease in the consumption-to-demand ratio. As shown in Figure 8, despite interventions on energy saving (envelope, swimming pool cover, lights), their effect on energy consumption is relatively limited. This can be attributed to the fact that the implementation of forced ventilation was accompanied by the increase in heating and cooling loads; thus, energy can be consumed through the district heating and air-conditioning systems, with a consideration of the electrical consumption of the ventilation fans.

4. Discussion

Indoor aquatic centers present indoor environmental conditions of particular interest, reporting high humidity levels, as well as high temperatures in summer or low ones in winter, in connection also with the emission of chemicals used for water disinfection; consequently, the above lead to specific thermal load treatment, ventilation, and IAQ requirements, usually not encountered in other building types [23,29]. The complex nature of aquatic centers leads to high energy consumption in order to achieve the respective comfort and hygienic levels [2,28]. The European Commission proposed a 30% energy-savings target by 2030 [47], noting the importance of reducing the huge carbon footprint of this type of building without affecting indoor environmental quality (IEQ). Thus, the combined assessment of the IEQ and energy consumption of aquatic centers and general sports facilities is considered essential.
The indoor environmental conditions of the specific aquatic center, monitored during the summer period, comprise a high indoor air temperature and high mean radiant temperature, while relative humidity and wind speed can remain on acceptable levels depending on occupancy time. Natural ventilation contributes to a reduction in relative humidity, as also confirmed by the low CO2 levels, though leading to an increase in air temperature. The presence of deteriorated polyurethane panels contributes to the abovementioned high temperatures, especially on days with a high solar radiation.
As demonstrated by the respective results, the prediction of thermal comfort at aquatic centers and sport facilities in general contains many uncertainties. More specifically, the accurate calculation of metabolic rate is burdened by the high level of activity, as well as a fluctuation in its intensity. Moreover, the high level of sweat evaporative heat loss, associated with a high metabolic rate, reduces the predictability of the Fanger model due to an over-simplification of sweating heat loss [48]. In naturally ventilated buildings, such as those in this study, where the surrounding thermal environment can be modified, the adaptive model, being more suitable than the Fanger model [34,49], cannot be applied to an athlete, as the metabolic rates of athletes are higher than 1.3 Met, and their clothing has a value lower than 0.5 clo [4,7]. Moreover, the water temperature can influence the sensation of thermal comfort for the athletes, as they spend most of their time in the water.
The formulation of potential interventions is based on the treatment of thermal performance insufficiencies of the envelope and systems, as well as on the need to improve indoor environments, as demonstrated in this study. The simulation analysis had moderate energy savings, as the proper ventilation of the system according to the hygienic requirements, leading to accepted temperature, humidity, and CO2 concentration conditions, is accompanied by a substantial increase in heating and cooling loads. These results highlight the necessity of combining IEQ and energy issues, while promoting the integration of renewable-energy-based systems, as well as advanced envelope solutions (shading, thermally efficient materials such as PCM, etc.).

5. Conclusions

The analysis demonstrated that the indoor environment of an aquatic center is the result of the complicated, dynamic relationship between thermal comfort, IAQ, ventilation, and energy consumption concerns.
The main findings of the indoor environment analysis, conducted during the summertime, are summarized below:
-
The operative temperature exceeds the limits of the respective standards for most monitoring days;
-
PMV values are far greater than the limit value of +0.5 (or +0.7) for most days and all categories of users (athletes, spectators, staff);
-
PMV values of athletes exceed those of spectators and staff in most cases due to their high metabolic rate and the fact that the clothing level of other categories is also low during summertime;
-
Indoor air and radiant temperature constitute the main factors affecting thermal comfort;
-
Ventilation rate, as demonstrated by the CO2 concentration values, can be increased, contributing to the improvement of thermal comfort, through relative humidity regulation, and IAQ.
The installation of an air-conditioning system could ensure the respective ventilation rates and dehumidification demand, while eliminating the high temperature values, especially during summertime. Considering the above, together with the adoption of interventions that address envelope and system thermal insufficiency (thermal insulation for walls and openings, the use of swimming pool covers at nighttime, and the installation of highly efficient lights), an overall energy reduction of 9% was achieved. The respective result highlights the strong relation of IEQ requirements and energy consumption as regards the energy-saving potential of renovation interventions and the increasing energy demand of the air-conditioning concept, as well as the respective significant indoor environment improvement.
The combined investigation of indoor environmental conditions on an experimental level and energy performance analysis through the use of a dynamic simulation software proved to be suitable for such a complicated problem. The results of this study present a generalization potential, as the demonstrated methods and tools can be adjusted and implemented in relevant cases. Future research may concentrate on the extension of the measurement campaign throughout the year using generalizations of indoor environment assessment findings. The combination of subjective and objective measurements for the prediction of thermal comfort could be applied, as existing models seem to have limitations regarding the accurate prediction of thermal sensations, especially for the swimmers, while metabolic rate should be assessed to a greater extent. A more detailed correlation of indoor conditions with different aspects of energy saving could be implemented.

Author Contributions

Conceptualization, G.P. (Giannis Papadopoulos) and G.P. (Giorgos Panaras); methodology, G.P. (Giannis Papadopoulos) and G.P. (Giorgos Panaras); software, G.P. (Giannis Papadopoulos); validation, G.P. (Giannis Papadopoulos) and E.I.T.; formal analysis, G.P. (Giannis Papadopoulos); investigation, G.P. (Giannis Papadopoulos), E.I.T. and G.P. (Giorgos Panaras); resources, G.P. (Giannis Papadopoulos) and G.P. (Giorgos Panaras); data curation, G.P. (Giannis Papadopoulos); writing—original draft preparation, G.P. (Giannis Papadopoulos); writing—review and editing, G.P. (Giorgos Panaras) and E.I.T.; visualization, G.P. (Giannis Papadopoulos); supervision, G.P. (Giorgos Panaras); project administration, G.P. (Giorgos Panaras); funding acquisition, G.P. (Giorgos Panaras). All authors have read and agreed to the published version of the manuscript.

Funding

This research received no external funding.

Institutional Review Board Statement

Not applicable.

Informed Consent Statement

Not applicable.

Data Availability Statement

Not applicable.

Acknowledgments

The authors of this study would like to thank the Municipality of Kozani for allowing them to access and work on the premises, as well as for the provision of all necessary data for the analysis.

Conflicts of Interest

The authors declare no conflict of interest. The funders had no role in the design of the study; in the collection, analyses, or interpretation of data; in the writing of the manuscript; or in the decision to publish the results.

Nomenclature

αConstant of adaptive model (-)
ΘrmMean outdoor temperature (°C)
AiArea of different surface (m2)
PMVPredicted mean vote (-)
PPDPredicted percentage of dissatisfied (%)
RHRelative humidity (%)
Te(d − i)Mean daily outdoor temperature for the before day and so on (°C)
TAir temperature (°C)
TiSurface temperature (°C)
Tmpa(out)Mean outdoor temperature (°C)
TmrtMean radiant temperature (°C)
UThermal parameter values (W/m2 K)
ACAir-conditioning system
ASHRAE/ANSIAmerican Society of Heating, Refrigerating, and Air-Conditioning Engineers
CFDComputational fluid dynamics
CENEuropean committee for standardization
IAQIndoor air quality
IEQIndoor environmental quality
ISOInternational organization for standardization
PCMPhase change materials
TSVThermal sensation vote
WHOWorld Health Organization

References

  1. WHO. Physical Activity Strategy for the WHO European Region 2016–2025; World Health Organization: Copenhagen, Denmark, 2016; pp. 1–32.
  2. Trianti-Stourna, E.; Spyropoulou, K.; Theofylaktos, C.; Droutsa, K.; Balaras, C.A.; Santamouris, M.; Asimakopoulos, D.N.; Lazaropoulou, G.; Papanikolaou, N. Energy Conservation Strategies for Sports Centers: Part B. Swimming Pools. Energy Build. 1998, 27, 123–135. [Google Scholar] [CrossRef]
  3. Ramos, C.A.; Wolterbeek, H.T.; Almeida, S.M. Exposure to Indoor Air Pollutants during Physical Activity in Fitness Centers. Build. Environ. 2014, 82, 349–360. [Google Scholar] [CrossRef]
  4. ANSI/ASHRAE Standard 55-2020; Thermal Environmental Conditions for Human Occupancy. ANSI: New York, NY, USA; ASHRAE: Atlanta, GA, USA, 2020.
  5. EN ISO 7730:2005; Ergonomics of the Thermal Environment—Analytical Determination and Interpretation of Thermal Comfort Using Calculation of the PMV and PPD Indices and Local Thermal Comfort Criteria. European Committee for Standard (CEN): Brussels, Belgium, 2005.
  6. EN 15251:2012; Indoor Environmental Input Parameters for Design and Assessment of Energy Performance of Buildings-Addressing Indoor Air Quality, Thermal Environment, Lighting and Acoustic. European Committee for Standard (CEN): Brussels, Belgium, 2012.
  7. EN16798-2:2019; Energy Performance of Buildings—Ventilation for Buildings—Part 2: Interpretation of the Requirements in EN 16798-1—Indoor Environmental Input Parameters for Design and Assessment of Energy Performance of Buildings Addressing Indoor Air Quality, Thermal Environment, Lighting and Acoustics. European Committee for Standard (CEN): Brussels, Belgium, 2019.
  8. EN ISO 7726:2001; Ergonomics of the Thermal Environment—Instruments for Measuring Physical Quantities. International Organization for Standardization. European Committee for Standard (CEN): Brussels, Belgium, 2001.
  9. Nicol, J.F.; Humphreys, M.A. Adaptive Thermal Comfort and Sustainable Thermal Standards for Buildings. Energy Build. 2002, 34, 563–572. [Google Scholar] [CrossRef]
  10. Papadopoulos, G.; Tolis, E.I.; Panaras, G. IEQ Assessment in Free-Running University Classrooms. Sci. Technol. Built Environ. 2022, 28, 823–842. [Google Scholar] [CrossRef]
  11. Papadopoulos, G.; Panaras, G.; Tolis, E. Thermal Comfort and Indoor Air Quality Assessment in University Classrooms. In IOP Conference Series: Earth and Environmental Science; IOP Publishing: Bristol, UK, 2020; Volume 410, p. 012095. [Google Scholar] [CrossRef]
  12. Teli, D.; Jentsch, M.F.; James, P.A.B. Naturally Ventilated Classrooms: An Assessment of Existing Comfort Models for Predicting the Thermal Sensation and Preference of Primary School Children. Energy Build. 2012, 53, 166–182. [Google Scholar] [CrossRef]
  13. d’Ambrosio Alfano, F.R.; Ianniello, E.; Palella, B.I. PMV–PPD and Acceptability in Naturally Ventilated Schools. Build. Environ. 2013, 67, 129–137. [Google Scholar] [CrossRef]
  14. Trebilcock, M.; Soto-Muñoz, J.; Yañez, M.; Figueroa-San Martin, R. The Right to Comfort: A Field Study on Adaptive Thermal Comfort in Free-Running Primary Schools in Chile. Build. Environ. 2017, 114, 455–469. [Google Scholar] [CrossRef]
  15. Mustapa, M.S.; Zaki, S.A.; Rijal, H.B.; Hagishima, A.; Ali, M.S.M. Thermal Comfort and Occupant Adaptive Behaviour in Japanese University Buildings with Free Running and Cooling Mode Offices during Summer. Build. Environ. 2016, 105, 332–342. [Google Scholar] [CrossRef]
  16. Aghniaey, S.; Lawrence, T.M.; Sharpton, T.N.; Douglass, S.P.; Oliver, T.; Sutter, M. Thermal Comfort Evaluation in Campus Classrooms during Room Temperature Adjustment Corresponding to Demand Response. Build. Environ. 2019, 148, 488–497. [Google Scholar] [CrossRef]
  17. ASHRAE Handbook; HVAC Applications, American Society of Heating, Refrigerating and Air-Conditioning Engineers Inc.: Atlanta, GA, USA, 2003.
  18. Rajagopalan, P.; Luther, M.B. Thermal and Ventilation Performance of a Naturally Ventilated Sports Hall within an Aquatic Centre. Energy Build. 2013, 58, 111–122. [Google Scholar] [CrossRef]
  19. Rajagopalan, P.; Jamei, E. Thermal Comfort of Multiple User Groups in Indoor Aquatic Centres. Energy Build. 2015, 105, 129–138. [Google Scholar] [CrossRef]
  20. Revel, G.M.; Arnesano, M. Perception of the Thermal Environment in Sports Facilities through Subjective Approach. Build. Environ. 2014, 77, 12–19. [Google Scholar] [CrossRef]
  21. Revel, G.M.; Arnesano, M. Measuring Overall Thermal Comfort to Balance Energy Use in Sports Facilities. Measurement 2014, 55, 382–393. [Google Scholar] [CrossRef]
  22. EN ISO 10551:2019; Ergonomics of the Physical Environment—Subjective Judgement Scales for Assessing Physical Environments. European Committee for Standard (CEN): Brussels, Belgium, 2019.
  23. Panaras, G.; Markogiannaki, M.; Tolis, E.I.; Sakellaris, Y.; Bartzis, J.G. Experimental and Theoretical Investigation of Air Exchange Rate of an Indoor Aquatic Center. Sustain. Cities Soc. 2018, 39, 126–134. [Google Scholar] [CrossRef]
  24. Gouveia, P.; Felgueiras, F.; Mourão, Z.; Fernandes, E.D.O.; Moreira, A.; Gabriel, M.F. Predicting Health Risk from Exposure to Trihalomethanes in an Olympic-Size Indoor Swimming Pool among Elite Swimmers and Coaches. J. Toxicol. Environ. Health Part A 2019, 82, 577–590. [Google Scholar] [CrossRef] [PubMed]
  25. Salonen, H.; Salthammer, T.; Morawska, L. Human Exposure to Air Contaminants in Sports Environments. Indoor Air 2020, 30, 1109–1129. [Google Scholar] [CrossRef] [PubMed]
  26. Felgueiras, F.; Mourão, Z.; Morais, C.; Santos, H.; Gabriel, M.F.; de Oliveira Fernandes, E. Comprehensive Assessment of the Indoor Air Quality in a Chlorinated Olympic-Size Swimming Pool. Environ. Int. 2020, 136, 105401. [Google Scholar] [CrossRef]
  27. Tolis, E.I.; Panaras, G.; Bartzis, J.G. A Comprehensive Air Quality Investigation at an Aquatic Centre: Indoor/Outdoor Comparisons. Environ. Sci. Pollut. Res. 2018, 25, 16710–16719. [Google Scholar] [CrossRef]
  28. Kampel, W.; Carlucci, S.; Aas, B.; Bruland, A. A Proposal of Energy Performance Indicators for a Reliable Benchmark of Swimming Facilities. Energy Build. 2016, 129, 186–198. [Google Scholar] [CrossRef]
  29. Duverge, J.J.; Rajagopalan, P.; Fuller, R. Defining Aquatic Centres for Energy and Water Benchmarking Purposes. Sustain. Cities Soc. 2017, 31, 51–61. [Google Scholar] [CrossRef]
  30. Chow, T.T.; Bai, Y.; Fong, K.F.; Lin, Z. Analysis of a Solar Assisted Heat Pump System for Indoor Swimming Pool Water and Space Heating. Appl. Energy 2012, 100, 309–317. [Google Scholar] [CrossRef]
  31. Sun, P.; Wu, J.Y.; Wang, R.Z.; Xu, Y.X. Analysis of Indoor Environmental Conditions and Heat Pump Energy Supply Systems in Indoor Swimming Pools. Energy Build. 2011, 43, 1071–1080. [Google Scholar] [CrossRef]
  32. Lee, W.-S.; Kung, C.-K. Optimization of Heat Pump System in Indoor Swimming Pool Using Particle Swarm Algorithm. Appl. Therm. Eng. 2008, 28, 1647–1653. [Google Scholar] [CrossRef]
  33. Kuyumcu, M.E.; Tutumlu, H.; Yumrutaş, R. Performance of a Swimming Pool Heating System by Utilizing Waste Energy Rejected from an Ice Rink with an Energy Storage Tank. Energy Convers. Manag. 2016, 121, 349–357. [Google Scholar] [CrossRef]
  34. Johansson, L.; Westerlund, L. Energy Savings in Indoor Swimming-Pools: Comparison between Different Heat-Recovery Systems. Appl. Energy 2001, 70, 281–303. [Google Scholar] [CrossRef]
  35. Lazzarin, R.M.; Longo, G.A. Comparison of Heat Recovery Systems in Public Indoor Swimming Pools. Appl. Therm. Eng. 1996, 16, 561–570. [Google Scholar] [CrossRef]
  36. Tsoka, S. Optimizing Indoor Climate Conditions in a Sports Building Located in Continental Europe. Energy Procedia 2015, 78, 2802–2807. [Google Scholar] [CrossRef] [Green Version]
  37. Duverge, J.J.; Rajagopalan, P. Assessment of Factors Influencing the Energy and Water Performance of Aquatic Centres. Build. Simul. 2020, 13, 771–786. [Google Scholar] [CrossRef]
  38. Hunt, J.D.; Zakeri, B.; Leal Filho, W.; Schneider, P.S.; Weber, N.d.A.B.; Vieira, L.W.; Ermel, C.; de Castro, N.J.; Barbosa, P.S.F.; Nascimento, A.; et al. Swimming Pool Thermal Energy Storage, an Alternative for Distributed Cooling Energy Storage. Energy Convers. Manag. 2021, 230, 113796. [Google Scholar] [CrossRef]
  39. Péez-Carramiñana, C.; Maciá-Mateu, A.; Sirvent-García, G.; Lledó-Llorca, I. Study of Natural Ventilation and Solar Control Strategies to Improve Energy Efficiency and Environmental Quality in Glazed Heated Swimming Pools in a Dry Mediterranean Climate. Sustainability 2022, 14, 8243. [Google Scholar] [CrossRef]
  40. Energy Plus. Available online: https://energyplus.net/ (accessed on 29 December 2022).
  41. Tolis, E.I.; Saraga, D.E.; Ammari, G.Z.; Gkanas, E.I.; Gougoulas, T.; Papaioannou, C.C. Chemical characterization of particulate matter (PM) and source apportionme;t study during winter and summer period for the city of Kozani, Greece. Cent. Eur. J. Chem. 2014, 12, 643–651. [Google Scholar]
  42. Tranoulidis, A.; Sotiropoulou, R.-E.P.; Bithas, K.; Tagaris, E. Decarbonization and Transition to the Post-Lignite Era: Analysis for a Sustainable Transition in the Region of Western Macedonia. Sustainability 2022, 14, 10173. [Google Scholar] [CrossRef]
  43. Ziouzios, D.; Karlopoulos, E.; Fragkos, P.; Vrontisi, Z. Challenges and Opportunities of Coal Phase-Out in Western Macedonia. Climate 2021, 9, 115. [Google Scholar] [CrossRef]
  44. Humphreys, M.A.; Nicol, F.J. Understanding the adaptive approach to thermal comfort. ASHRAE Trans. 1998, 104, 991–1004. [Google Scholar]
  45. Technical Directive 20701-1:2017; Analytical National Requirements for the Parameters Entering the Calculation of Buildings Energy Performance and the Issuing of Energy Certificate. Greek Technical Chamber: Athens, Greece, 2017.
  46. ASTM E741-11; Standard Test Method for Determining Air Change in a Single Zone by Means of a Tracer Gas Dilution. ASTM International: New York, NY, USA, 2017.
  47. European Commission. 2030 Framework for Climate and Energy Policies; European Commission: Brussels, Belgium, 2020. Available online: https://climate.ec.europa.eu/eu-action/climate-strategies-targets/2030-climate-energy-framework_en (accessed on 29 December 2022).
  48. Omidvar, A.; Kim, J. Modification of Sweat Evaporative Heat Loss in the PMV/PPD Model to Improve Thermal Comfort Prediction in Warm Climates. Build. Environ. 2020, 176, 106868. [Google Scholar] [CrossRef]
  49. Zaki, S.A.; Damiati, S.A.; Rijal, H.B.; Hagishima, A.; Abd Razak, A. Adaptive Thermal Comfort in University Classrooms in Malaysia and Japan. Build. Environ. 2017, 122, 294–306. [Google Scholar] [CrossRef]
Figure 1. Position of the measuring devices with regard to the layout of the aquatic center.
Sustainability 15 01318 g001
Figure 2. Adaptive comfort chart for free-running aquatic center.
Sustainability 15 01318 g002
Figure 3. PMV values for different categories of users.
Sustainability 15 01318 g003
Figure 4. PPD values for different categories of users.
Sustainability 15 01318 g004
Figure 5. Present situation: annual energy demand and consumption simulated data.
Sustainability 15 01318 g005
Figure 6. Present situation: annual energy consumption simulated and actual data.
Sustainability 15 01318 g006
Figure 7. AC scenario: annual energy demand and consumption simulated data.
Sustainability 15 01318 g007
Figure 8. Present situation and AC scenario: annual energy consumption.
Sustainability 15 01318 g008
Table 1. Characteristics of thermal comfort international standards.
International StandardsLimits of Fanger ModelLimits of Adaptive ModelMeasurement Campaign Protocol
ANSI/ASHRAE Standard 55 [4]−0.5 ≤ PMV ≤ +0.5Upper 80% acceptability Limit =
0.31   t p m a o u t ¯ + 21.3
Lower 80% acceptability Limit =
0.31   t p m a o u t ¯ + 14.3
ISO 7730 [5]Category A:
−0.2 ≤ PMV ≤ +0.2
Category B:
−0.5 ≤ PMV ≤ +0.5
Category C:
−0.7 ≤ PMV ≤ +0.7
--
EN 15251 [6]Category I:
−0.2 ≤ PMV ≤ +0.2
Category II:
−0.5 ≤ PMV ≤ +0.5
Category III:
−0.7 ≤ PMV ≤ +0.7
Category IV:
PMV < −0.7 or +0.7 < PMV
Category I:
Upper limit: 0.33 Θrm + 18.8 + 2
Lower limit: 0.33 Θrm + 18.8 − 2
Category II:
Upper limit: 0.33 Θrm + 18.8 + 3
Lower limit: 0.33 Θrm + 18.8 − 3
Category III:
Upper limit: 0.33 Θrm + 18.8 + 4
Lower limit: 0.33 Θrm + 18.8 − 4
-
EN 16798-2 [7]Category I:
−0.2 ≤ PMV ≤ +0.2
Category II:
−0.5 ≤ PMV ≤ +0.5
Category III:
−0.7 ≤ PMV ≤ +0.7
Category IV:
−1.0 ≤ PMV ≤ +1.0
Category I:
Upper limit: 0.33 Θrm + 18.8 + 2
Lower limit: 0.33 Θrm + 18.8 − 3
Category II:
Upper limit: 0.33 Θrm + 18.8 + 3
Lower limit: 0.33 Θrm + 18.8 − 4
Category III:
Upper limit: 0.33 Θrm + 18.8 + 4
Lower limit: 0.33 Θrm + 18.8 − 5
-
ISO 7726 [8]--
Θrm and tmpa(out): mean outdoor temperature (°C) √: included in the Standard; -: not included in the Standard.
Table 2. Measuring instrumentation characteristics and positions are cited.
Position IndicationMeasuring Quantity/Instrument TypeMeasuring Characteristics
1, 3, 5, 7T-RH-CCO2/Telaire 7001, Hobo ONSET U12-012 1Accuracy: ±0.5 °C (T) 2, ±5% (RH) 2, ±5% or ±50 ppm (CCO2)
Range: −20–70 °C (T), 5–95% (RH), 0–2500 ppm 3 (CCO2)
2T-RH/Testo 174 HAccuracy: ±0.5 °C (T), ±3% (RH)
Range: −20–70 °C (T), 0–100% (RH)
4, 6, 8T-RH/Hobo ONSET H08-003-02Accuracy: ±0.5 °C (Τ) 2, ± 5% (RH) 2
Range: −20–70 °C (T), 25–95% (RH)
10a,b,cWind Speed (Gill Instruments 3D anemometer)Accuracy: ±1.5% RMS
Range: 0–50 m/s
11Meteorological Station
(Delta Ohm Hygrotransmitter HD9009TR, Thies CLIMA 4.3515.30.000)
Accuracy: ±0.5 °C (T) 2, ±5% (RH) 2, ±0.5 m/s (u)
Range: −40–80 °C (T), 0–100% (RH), 0.5–40 m/s (u)
1 The Telaire 7001 instrument was connected to HOBO ONSET U12-012 for CO2 concentration measurement and records. 2 Aging effects are considered. 3 The Hobo ONSET upper limit is indicated (Telaire upper limit: 10,000 ppm).
Table 3. Values of energy parameters for the building envelope and HVAC systems.
ComponentThermal Parameter Value
Existing SituationAir-Conditioning Scenario
Polyurethane panelsU = 0.9 W/m2 KU = 0.6 W/m2 K
Polyurethane panels (roof)U = 0.9 W/m2 KU = 0.55 W/m2 K
Concrete wallsU = 2.7 W/m2 KU = 0.6 W/m2 K
Concrete roofU = 3.05 W/m2 KU = 0.55 W/m2 K
Ground wallU = 3.1 W/m2 KU = 2.5 W/m2 K
Metallic doorU = 2.6 W/m2 KU = 2.6 W/m2 K
Polycarbonic openingU = 3.84 W/m2 KU = 2.6 W/m2 K
Aluminum openingU = 6.1 W/m2 KU = 2.6 W/m2 K
District heating heat exchangerηgen = 0.97
(thermal performance)
ηgen = 0.97
(thermal performance)
Oil boilerηgen = 0.635
(thermal performance)
ηgen = 0.93
(thermal performance)
Lighting powerInstalled power: 40 kW13.3 kW
Air-conditioning unit-COP = 3
Air exchange rate0.7 h−1 (natural ventilation)4 h−1 (forced)
Swimming pool coverNoYes
Table 4. Indoor and outdoor air environmental parameters during measurement period.
Indoor SpaceOutdoor Area
ParameterMeanMinMaxMeanMinMax
Air temperature (°C)30.823.437.430.318.636.3
RH (%)49.8532.377.042.716.7100
Radiant temperature (°C)31.9623.3736.87---
CO2 (ppm)539.6364.3925.5---
Wind speed (m/s)0.090.010.300.840.401.28
Disclaimer/Publisher’s Note: The statements, opinions and data contained in all publications are solely those of the individual author(s) and contributor(s) and not of MDPI and/or the editor(s). MDPI and/or the editor(s) disclaim responsibility for any injury to people or property resulting from any ideas, methods, instructions or products referred to in the content.

