Abstract
Land vegetation plays an important role in reducing greenhouse gas emissions and stabilizing atmospheric CO2 concentration. However, the impact of carbon sequestration of terrestrial vegetation on economic growth has not yet been reported in the literature, especially in the context of China’s current high-quality economic development strategy, and clarifying carbon sequestration on high-quality economic development has an important research-support role in achieving the goal of “carbon peak” and “carbon neutral”. Therefore, based on the panel data from 2735 countries and cities in China from 2000 to 2017, this statistical analysis adopts a dual-fixed-effect model to identify the heterogeneous impacts of land-based vegetation carbon sequestration on high-quality urban economic development. The results show that carbon sequestration by terrestrial vegetation has a significant positive impact on economic growth in northeast, central, south, and southwest China but not in north, east, or northwest China, and after a series of stability tests, the effect still holds. Terrestrial vegetation carbon sequestration affects economic growth mainly through upgrades of industrial structures, resource allocation effect, and vegetation coverage. This statistical model further clarifies the empirical evidence provided by vegetation carbon sequestration for high-quality economic development and the economic effects on afforestation and ecological conservation.
1. Introduction
At present, China’s economy has changed from high-speed growth to a high-quality development stage, and at this stage of development, the status of the environment is more and more prominent. With consumption of a large volume of fossil fuel, the concentration of carbon dioxide in the atmosphere is increasing, climate change is accelerating, and the greenhouse effect is increasing. Since 2006, China has become the world’s largest emitter of carbon dioxide due to its rapid socio-economic development and large population base [1,2]. In 2016, China released approximately 1.02 × 10⁴ metric tons (MT) of CO2 into the atmosphere, exceeding the carbon emissions of the United States, the European Union, and Japan and accounting for approximately 28% of global carbon emissions [3]. From 2003 to 2017, China’s CO2 emissions generally showed an upward trend, and the growth rate was accelerating [4,5,6]. There was an east–west difference in CO2 emissions during the study period. As one of the most effective means of controlling the gradual rise of global temperatures, reducing greenhouse gases in the atmosphere has become a means for people to mitigate climate change [7,8]. There are two main methods to reduce greenhouse gases in the atmosphere in response to climate change: emissions reductions and creating carbon sinks [9,10,11]. Emissions reduction is generally achieved at the source by controlling the use of fossil fuels by emitting enterprises and improving production processes to reduce greenhouse gas emissions. Based on the carbon sequestration capacity of land vegetation and through the development of forestry carbon sequestration projects and the implementation of afforestation plans, forest management, forest land protection, and other measures, the aim is to reduce greenhouse gas concentrations in the atmosphere [12,13,14].
Generally, the carbon sequestration of terrestrial vegetation can be divided into the following two forms: direct carbon sequestration and indirect carbon sequestration. The former mainly is shown as follows: tree carbon deposition, forest soil carbon deposition, under-forest plants, and humus carbon deposition. The latter is mainly manifested as carbon storage of forest products using forest trees to replace cement, steel, and other building materials or energy after harvesting forest trees through processing into forest wood products. In this way, carbon will be preserved for a considerable period rather than being released immediately, again forming a constant immobilization of CO2. Forests make up many terrestrial ecosystems, accounting for 46% of the global total carbon stock of terrestrial ecosystems [15], including 80% of the above-ground carbon stock and 40% of the underground carbon stock of terrestrial ecosystems [16].
According to the authorities [8,17], a hectare of forest absorbs 1000 kg of carbon dioxide and releases 730 kg of oxygen every day, making it one of the most important carbon reservoirs on the Earth. It plays an important role in slowing global warming and maintaining global carbon balance. Studies by many academics have shown that carbon sequestration through forests is much more effective than emissions reductions using liquid biofuels [18,19] and that it is more economical to use land-based vegetation to absorb carbon dioxide than to use emissions-reduction technologies directly. Increasing carbon sequestration by land-based vegetation through afforestation and reforestation is recognized worldwide as the most cost-effective solution to the global rise in carbon dioxide. Therefore, carbon sequestration by terrestrial vegetation plays a prominent role in coping with global climate change, promoting low-carbon development, and promoting a high-quality economy.
2. Literature Review
There are three aspects in the literature related to this paper. The first aspect is a study of the carbon sequestration capacity of terrestrial vegetation. Woodwell (1978) [20] first proposed that “Terrestrial vegetation is the source of atmospheric carbon dioxide”. In the global carbon balance, terrestrial vegetation plays a major role as a carbon source, mainly through its felling and degradation. However, many researchers hold the opposite view. They have suggested that most of the northern hemisphere’s terrestrial vegetation (particularly temperate and boreal forests) may act as CO2 sinks (Pan et al., 2011) [21], modeled the offsetting effects of carbon sequestration by urban vegetation (Francisco, 2010), and generally agreed that afforestation holds great potential to cope with rising CO2 levels (Bastin et al., 2009) [22]. As cities develop, the available green space declines rapidly, reducing people’s opportunities to experience nature and reducing their ability to mitigate climate change [2,23]. China has also carried out extensive research on evaluating carbon sinks. Many scholars believe that the role of forests in climate change adaptation and mitigation is very important and cannot be replaced. China’s forests have a large space for development and great potential for carbon sequestration. Artificial forests are the most effective and eco-friendly ways for terrestrial ecosystems to absorb CO2, increase carbon sequestration, slow down global warming, and start ecological restoration [2]. In particular, the carbon storage of forest ecosystems increases with the development of the forest, and the middle-aged and young forests experiencing vigorous growth have strong carbon sequestration rates and potentials.
The second aspect is the study of high-quality economic development. In a narrow sense, high-quality economic growth mainly refers to the promotion of efficient economic growth, while in a broad sense, the connotation of high-quality economic growth is relatively rich. There is much literature that defines high-quality economic development [24]. Specifically, the qualitative changes in the structure of economic growth are constrained by the general objective historical process of social change in its gradual development, and the nature of these changes has both quantitative and qualitative bases in the preparation of the economy for new functional forms in the process of progressive productivity development. Yang et al. (2022) [5] established an urbanization quality index system from the perspectives of urban development, residents’ lives, and urban–rural integration as well as the five dimensions of population, economy, space, society, and environment. Previous studies have shown the quality of economic growth by constructing an index system in a broad sense [25]. In addition, as the Chinese economy moves into a high-quality stage of development, many scholars have used total factor productivity and the environment and resources to measure economic growth, but this kind of research is mainly concentrated in the U.S. and provincial and urban agglomerations [24,26,27,28,29,30]. Some scholars also use System of Environmental Economic Accounting (SEEA) and industry data to measure green economic growth from an industry perspective. To summarize, most of the existing research on economic growth focuses on the measurement, decomposition, and analysis of the factors influencing economic growth in a certain industry, and few researchers have linked the amount of carbon sequestration by land vegetation with economic growth or used the perspective of the city to study the relationship between the two, but the study of urban issues for China’s high-quality economic development process is recognized as having great significance.
The third aspect is the mechanism by which carbon sequestration of terrestrial vegetation impacts high-quality economic development. How does carbon sequestration by terrestrial vegetation affect high-quality economic development? Based on the fact that terrestrial vegetation can absorb carbon dioxide through photosynthesis, this paper considers that terrestrial vegetation has the dual properties of value and use value in carbon sequestration. Therefore, it is proposed that the carbon sequestration of terrestrial vegetation will affect the development of a high-quality economy by upgrading industrial structures and the effect of resource allocation. As for the upgrading effect of industrial structures, the modern forestry economic theory holds that the distribution of the three industrial structures and the rationality of the internal sub-industrial structure have far-reaching influences on the economic growth of a country or a region. Gao et al. (2019) [31] studied the factors affecting the growth of the forestry economy in Guangdong Province and mentioned that as one of the basic industries of the national economy, the forestry industry plays an important role in promoting the economic development of Guangdong Province. Hu et al. (2021) [32] described forestry carbon sequestration as an important measure to address global climate change and an effective way to build an ecological civilization. Afforestation and reforestation projects under the clean development mechanism have important functions, such as ecological protection and economic growth. Huang et al. (2012) [2] found that carbon sequestration afforestation projects are an important means of upgrading the industrial structure at the county level and can ease the conflicts between economic development and environmental protection, promote high-quality economic development, and achieve mutually beneficial economic and ecological benefits. Chen et al. (2019) [33] and others suggested that optimizing the regional forestry industrial structure will help promote the formation of a green supply chain and a green circular economy in forestry, promote coordinated regional development, and raise the level of economic development [34]. On the effects of resource allocation, Lu et al. (2022) [1] analyzed the relationship between industrial resource allocation and carbon emissions at the regional level found that at the regional level, industrial resource allocation can significantly reduce carbon emissions in the eastern region. Zhu et al. (2022) [35] assessed the impact of clean air action policies on business productivity. Research by Fu et al. (2021) [25] and Popkova et al. (2010) [16] showed that environmental pollution can affect labor factors, and factor mismatches resulting from distortions in labor factors can affect total factor productivity. Hua et al. (2022) [36] examined the impact of emissions trading policies on the total factor productivity of listed agricultural enterprises and possible mechanisms for reducing emissions and found that emissions trading rights significantly increased the total factor productivity of agricultural enterprises, and green innovation plays a role in the mechanism. Zhu et al. (2022) [35] estimated the economic and environmental effects of resource tax reform and concluded that resource tax reform can optimize the allocation of resources among enterprises and industries and achieve energy conservation and consumption reduction, which promotes regional economic growth and will also help China meet its carbon reduction targets.
In summary, there are relatively few papers that directly study the effect of terrestrial vegetation carbon sequestration on the high-quality development of urban economy, and the academic community agrees that terrestrial vegetation carbon sequestration can promote green economic development, but there is still a lack of exploration of the paths of terrestrial vegetation carbon sequestration to promote economic development, and there are relatively few theoretical analyses of the effect of terrestrial vegetation carbon sequestration on industrial structure upgrading and resource allocation. Theoretical analysis of the effect of terrestrial vegetation carbon sequestration on industrial structure upgrading and resource allocation is relatively rare. With the vision of carbon neutrality, the role of forest carbon sinks has begun to be emphasized, but a theoretical understanding of how carbon sequestration by terrestrial vegetation affects economic quality development has not yet made significant progress. Therefore, this study is useful for the future comprehensive evaluation of the emission reduction effects of China’s “returning farmland to forest” and “returning pasture to grass” policies.
However, this study is of great practical value for future comprehensive evaluation of the emission reduction effect under the policy of “returning farmland to forest” and “returning pasture to grass” in China. Based on this, this research was conducted at the city level, as it is the core region of economic growth, to firstly measure the current level of economic growth in Chinese cities and then analyze the heterogeneous effects of carbon sequestration by terrestrial vegetation on the high-quality development of urban economy in an attempt to make up for the shortcomings of existing studies and hopefully provide some reference for the high-quality development of Chinese urban economy. In addition, we hope also to provide some reference for the high-quality economic development of Chinese cities and the response to climate change.
3. Methods
3.1. Model
According to the theoretical analysis, economic growth is used to measure the current status of a city’s high-quality economic development. This paper identifies the heterogeneous effects of urban vegetation carbon sequestration on high-quality urban economic development based on data related to 2735 counties and cities in China spanning 2003–2017 and constructs the following panel model [37]:
In the equation, represents the economic growth of city in year , represents the amount of terrestrial vegetation sequestered by city in year , and is the core estimated parameter of the model, which measures the effect of the amount of terrestrial vegetation sequestered on the economic growth of the city. is the set of control variables, which represents other factors affecting the economic quality development; is the individual fixed effect, which is used to control the factors that do not change over time in each city; represents the year fixed effect; and is a random disturbance term.
3.2. Variables
3.2.1. Explanatory Variable: Economic Growth ()
The established literature typically uses total factor productivity to characterize economic quality, and this indicator is effective in measuring the quality of economic growth, but it fails to include environmental factors and cannot effectively reflect the true level of economic development quality. Economic growth considers both the increase in desired output and the decrease in undesired output, which is consistent with the concept of green development needed for high-quality economic development. Therefore, this paper introduces environmental factors on the basis of total factor productivity and uses economic growth to measure the quality of urban economic development. Labor, capital, and energy are used as input indicators, and gross domestic product (GDP) and three measures of emissions are used as desired and undesired output indicators, which are measured using the Malmquist–Luenberger (ML) index (Oh, 2010) [38,39]. Specifically, the number of people employed at the end of the year is used to measure labor input; capital stock is calculated using the perpetual inventory method based on total fixed assets to replace capital input; due to the lack of primary energy consumption data at the city level, the annual electricity consumption of each city is used to measure energy input; GDP calculated at constant prices in 2000 represents economic output [40]; CO2 emission, SO2 emission, and industrial wastewater emission are selected as non-desired outputs [41].
Considering that the ML index has transferable and cyclic cumulative characteristics that are better than the ML index, this paper adopts the ML index and its decomposition for the measurement of green total factor productivity growth rate in Chinese counties. In this paper, 2735 counties and cities in China are taken as the research units. We thus make the following definitions: Assume that in time period (), each provincial (municipal) unit uses m inputsand s outputs . Then, the set of production possibilities at this time can be expressed as follows:
Further, the output distance function () is defined as given below:
Further, considering to represent the desired output in the output and to represent the undesired output, the production possibility set can be extended as follows.
At this point, the global set of production possibilities containing non-desired outputs is. Here, represents the convex set. Therefore, the ML based on this production possibility set above is as follows:
Among them, .
Assuming the directional variable, when the scale payoff is variable, the following linear programming can be performed. Referring to the estimation method of Peng et al. (2020) [41], , the specific linear programming equation is shown in Formula (6).
If , it means that green total factor productivity shows an increasing trend; otherwise, it means that green total factor productivity decreases or remains unchanged.
3.2.2. Core Explanatory Variable: Carbon Sequestration by Terrestrial Vegetation ()
Carbon sequestration by terrestrial vegetation means that vegetation absorbs carbon dioxide from the atmosphere and fixes it in the vegetation or soil, thus reducing the concentration of this gas in the atmosphere. There are various plant communities composed of many plants on the land surface, such as forests, grasslands, scrubs, deserts, meadows, swamps, etc. The carbon sequestration of terrestrial vegetation can be generally classified into the following two forms: direct carbon sequestration and indirect carbon sequestration. The former is mainly manifested as tree carbon deposition, forest soil carbon deposition, understory plants, and humus carbon deposition; the latter is mainly manifested as forest product carbon storage, using forest wood to replace other construction materials such as cement and steel or energy; the harvested forest wood, after being processed into forest wood products, will still preserve carbon for a certain considerable period of time instead of releasing carbon immediately, which in turn forms a continuous CO2 fixation function. Forests are the largest carbon reservoir and sink on land, and as the main body of terrestrial ecosystems, CO2 sequestration by forests is an important mechanism to maintain the carbon balance of ecosystems and mitigate global climate change. Grasslands are also an important carbon sequestration resource and play an important role in protecting soil and water, purifying air, preventing wind, fixing sand, and controlling greenhouse gas emissions. The carbon sequestration function of terrestrial vegetation is a natural carbon sequestration process, which is more effective than artificial carbon sequestration and is an important measure and the main way to achieve the goal of carbon neutrality in the future. In addition, many scholars at home and abroad have confirmed that carbon sequestration by urban vegetation does have an offsetting effect on carbon emissions, and the increase in carbon sequestration helps to promote the process of high-quality development of China’s urban economy through emission reduction. Therefore, this paper focuses on the amount of carbon sequestered by vegetation to analyze its impact on the high-quality development of urban economy, which is expected to be positively correlated with .
3.2.3. Control Variables
Combining with existing studies, in order to alleviate the problem of biased regression results due to omitted variables in the model, this paper controls for variables that affect the high-quality development of urban economy based on the research results of some scholars, specifically the following: (1) First is industrial structure (STRU), which is measured by using the proportion of value added by secondary industry to GDP. Economists have long been concerned about the role of industrial structure on economic growth, and Chenery et al. (1980) [42] and Wang et al. (2020) [6] pointed out that the effect of industrial structure is a key factor in economic acceleration. (2) The level of information technology (TECH) is measured by the number of Internet accesses. Entering the information technology era, economic growth is closely related to technological factors. Some scholars have found that the uneven development of information technology can lead to differences in economic growth of urban clusters. (3) The degree of openness to the outside world is measured by the share of foreign investment in GDP. The impact of foreign direct investment (FDI) on economic growth is still inconclusive, and many scholars have found that the entry of foreign capital has a threshold effect on economic growth. (4) The level of urbanization (URB) is measured by the proportion of urban population to total population. At present, it is generally believed that urbanization has a significant impact on economic growth. (5) The level of economic development (PGDP) is measured by the gross domestic product per capita. (6) Indicators reflecting environmental (RE) development include carbon dioxide emissions, sulfur dioxide emissions, and sewage discharge.
Table 1 summarizes the specific measurement methods of variables used in this paper. One is the data on urban CO2 emissions and carbon sequestration by terrestrial vegetation. The urban carbon dioxide emission and terrestrial vegetation carbon sequestration data in this paper come from the research team of Chen (2020) [43], which used the carbon dioxide emission data from two sets of nighttime lighting data (DMSP/OLS data for the period of 1992–2013 and NPP/VIIRS data for the period of 2012–2020) inverse performances provided by NASA, and the research team used the MODIS platform provided by the MOD17A3H product to measure the corresponding net primary productivity in China’s districts and counties from 2000–2017. It obtained the terrestrial vegetation carbon sequestration with the help of the conversion coefficients of vegetation dry matter and CO2 uptake. The data on urban CO2 emissions and vegetation carbon sequestration contain rich information that can reflect regional heterogeneity in detail, thus facilitating government departments to formulate and implement emission reduction policies according to local conditions, which is of great value for current research on carbon peak prediction and carbon neutrality.

Table 1.
All variables, measurement, and source of data.
3.3. Data Sources and Descriptive Statistics
The research object of this paper is the 2735 counties at the prefecture level and above in mainland China. Some counties in other provinces such as Yunnan, Guangxi, and Fujian are missing some important indicators, which can only be removed in this paper based on the principle of scientific and standardized data, and some prefecture-level cities that have changed their administrative units, such as Chaohu, are also removed in this paper. Although this paper does not form a unbalanced panel sample in China, fortunately, the cities collated in this paper are very representative of their regions. Based on this, the author believes that the balanced panel data of counties in mainland China from 2003–2017 finally formed in this paper can basically represent the overall situation of cities in the country. The data in this paper are derived from the following two aspects.
From Table 1 and Table 2, the original data were mainly obtained from EPS database, China City Statistical Yearbook, and China Regional Economic Statistical Yearbook in the corresponding years, and the data of each price deflator were obtained from provincial and municipal statistical yearbooks in the corresponding years and provinces, and some missing values are supplemented by interpolation method. Descriptive statistics of variables are given in Table 2. According to the statistical results of gtfp, there is still room for improvement in the economic growth of major counties and districts in China. The gap between the maximum and minimum values is large, which also indicates that the economic development of the main county-level administrative regions in China is unbalanced.
Table 2.
Descriptive statistics.
4. Results
4.1. Baseline Regression Analysis
Based on the data of 2735 counties in China from 2000 to 2017, this paper uses Stata software to estimate the double-fixed-effects model, and the baseline regression results of the impact of carbon sequestration by terrestrial vegetation on urban economic growth are shown in Table 3.
Table 3.
Results of baseline regression.
The results of the baseline regression in Table 3 show that the amount of carbon sequestration by terrestrial vegetation has a significant positive impact on urban economic growth, and the increase in carbon sequestration by terrestrial vegetation will increase economic growth in the same direction and then promote the process of high-quality urban economic development. This indicates that the natural characteristics of terrestrial vegetation to absorb carbon dioxide through photosynthesis have a certain significance for the sustainable development of urban economy, and based on the carbon sequestration of land vegetation, the development of the carbon sequestration afforestation project is also an important means to improve the ecological environment and promote economic development.
The urbanization by country coefficient of the model was negative, and the significance test showed that the proportion of urban population to total population had a significant negative effect on urban economic growth; it also shows that the environmental pressure brought by urban population growth is not conducive to the improvement of economic growth. The reason may be that as the number of people in cities and towns increases, so does the density of the urban population so that the demand for land-carrying capacity increases, so many forests are converted to agricultural land; for example, forest land is converted to arable land, and the amount of carbon sequestration in arable land is much lower than that in forested land. In addition, the increased demand for food and fuel resulting from the growth of urban populations has often led to predatory deforestation, which has led to a sharp decline in the area of forests and the destruction of many virgin forests. It also weakens the renewable capacity and base of forest resources and exacerbates forest degradation. Therefore, in the process of urbanization, we should put more emphasis on greening and not sacrificing the environment for high-speed economic development, but also giving the environment and the economy the same importance. Only in this way can we better control the high-quality development process of urban economies.
The proportion of foreign investment in the GDP has a significant positive impact. This shows that the current foreign direct investment has a relatively high degree of economic impact on Chinese cities, particularly in the area of green urban development. On the one hand, foreign direct investment can bring in advanced international technology and management experience; on the other hand, the introduction of polluting enterprises may aggravate the degree of environmental pollution. The positive effect is greater than the negative one, and the final impact on economic growth will be positive. It also shows that in recent years, China has begun to focus on the quality of foreign investment, moving away from being a source of pollution, and has begun to really bring in the clean, potential investment that Chinese society wants.
4.2. Heterogeneity Analysis
Because of the heterogeneity of environment, the complexity of climate factors, the diversity of forest vegetation, and the imbalance of economic development level in different regions of China, the carbon sequestration amount of vegetation in different regions is different; for example, Jia et al. (2018) [44] analyzed the difference of carbon sequestration potential among different climate zones and vegetation types in Henan Province. The 2735 counties and cities were divided into seven regions according to the state of forest resources, the growth of forest trees, and the natural historical conditions in northeast, central, south, southwest, northwest, north, and east China. East China includes Shandong, Jiangsu, Anhui, Zhejiang, Shanghai, and other provinces and cities; central China includes Hubei, Henan, Hunan, Jiangxi, and other provinces; The north-east includes Heilongjiang, Jilin, and Liaoning provinces, while the northeast includes Beijing, Tianjin, Hebei, Shanxi, and Inner Mongolia provinces. The northwest includes Xinjiang, Qinghai, Gansu, Ningxia, and Shaanxi provinces, while the south of China includes Guangdong, Fujian, Hainan, and Guangxi provinces. Southwest China includes Tibet, Sichuan, Guizhou, Chongqing, Yunnan, and other provinces and cities. After subdividing the sample, the double-fixed-effects model was used to re-estimate the data after subdividing the sample, and the estimated results of the model are shown in Table 4.
Table 4.
Regional heterogeneity analysis results.
To further ensure the reliability of the research conclusions, robustness tests were carried out by using the control variables, the mixed regression model, and the mixed regression model without the control variables, respectively, and the resulting model regression results are shown in Table 2 and Table 3. First, all the control variables were excluded, and only the core variable, the carbon sequestration amount of land vegetation, i.e., , was retained. The regression results were basically consistent with the baseline model, and the carbon sequestration amount of land vegetation still had a positive impact on urban economic growth, and the coefficient of significance is strong, but its coefficient value variation value is larger. Further, to examine the effect of time-point fixed effects and individual fixed effects on the outcome of the regression, column 3 in Table 4 excludes both time-point fixed effects and individual fixed effects under conditions that maintained the control variables. The mixed regression results show that the positive effect of land vegetation carbon sequestration on urban economic growth is also unchanged, and the coefficients of other control variables are consistent with the double-fixed-effect model. Secondly, considering the influence of the control variables on the mixed regression, this paper eliminated all control variables on the basis of the mixed regression treatment, and the research results are consistent; however, the estimated coefficients obtained from this model are relatively small, which means that the mixed regression model is relatively independent of individual and time effects, and the double-fixed-effect model shows that carbon sequestration of land vegetation has a more significant impact on urban economic growth, which again verifies the robustness of the estimation. In conclusion, carbon sequestration by terrestrial vegetation has a significant positive effect on high-quality urban economic development, and this effect has passed the robustness test.
5. Discussion: Mechanism Analysis
Many scholars have found that if the direction of economic growth is to reduce environmental pollution [27,35,45,46], when the direction of economic growth is correct and once it reaches a certain threshold, it can offset the negative effects of economic development. Moreover, because land vegetation can absorb carbon dioxide from the atmosphere through photosynthesis and fix it in vegetation or soil, it can directly affect high-quality urban economic development, and it can also affect economic growth by upgrading industrial structures and the effect on resource allocation, thus affecting the high-quality development of urban economy.
5.1. Theoretical Mechanism Analysis
5.1.1. Upgrading the Industrial Structure ()
First, carbon sequestration of terrestrial vegetation can promote industrial structure upgrading through carbon substitution. Carbon substitution means replacing energy-intensive materials such as cement, steel, plastics, bricks, and tiles with durable wood forest products, the use of bio-energy (such as energy plantations), and the recycling of harvested residues (such as for fuel). It will not only sequester carbon but also reduce greenhouse gas emissions from the burning of fossil fuels in the production of these materials, forcing companies to innovate and thus upgrade their industrial structures, achieving high-quality economic development. Secondly, the development of new carbon sequestration forestry and carbon sequestration afforestation projects based on the carbon sequestration capacity of terrestrial vegetation will help to break the local industrial distribution dominated by agriculture and increase the total value of forestry output, promoting the sound and sustainable development of the forestry industry and the optimization and upgrading of the industrial structure. Finally, carbon sequestration by vegetation can also bring certain ecological benefits. For example, carbon sink forests can both absorb carbon and release oxygen and reduce the concentration of CO2 in the atmosphere but also play roles in environmental beautification and health care, promoting tourism, and greatly promoting the development of forestry tourism and leisure industries.
5.1.2. Resource Allocation ()
Resource refers to a country (or region) with a variety of material resources: financial, human, and other elements of the general term. According to the definition of resources, the carbon sequestration capacity of terrestrial vegetation can be attributed to an intangible environmental resource, and the carbon dioxide emission space is also a resource. This kind of resource is a kind of space resource and environment resource that can retain carbon dioxide. From the economic point of view, the climate change caused by the greenhouse effect is caused by the inefficient allocation of environmental resources. The carbon-sequestration capacity of terrestrial vegetation can hold CO2 in place, which can slow down the greenhouse effect and prevent further deterioration of the ecological environment. The carbon sink, which is rooted in the carbon sequestration capacity of vegetation, takes the accumulation of forest and other resources as the carrier and creates a new CO2 emission space, which is widely needed by human beings and can meet the basic material needs and ecological environment needs of human beings. According to Marxism’s labor theory of value, carbon sinks have the dual attributes of a commodity—use value and value—and can therefore be commoditized to realize their value through market exchange, resulting in carbon trading, and the carbon sequestration capacity of terrestrial vegetation can participate in the distribution of the income of the national economy as a factor of production to obtain certain benefits. In addition, carbon sequestration through terrestrial vegetation has certain cost advantages, which may optimize the production resources of enterprises and drive the reallocation of resources among enterprises; the transfer of factors of production from inefficient enterprises to more efficient enterprises will eventually boost overall economic growth and, to some extent, offset the negative impact on economic development caused by the obligation of compulsory emission reduction.
5.1.3. Vegetation Coverage ()
With the rapid development of the economy, the environmental impact of economic development has become more and more prominent, while rapid economic development has also brought environmental problems. The coordinated development of economy and environment is a problem to which every region must pay attention. Manzoor et al. (2019) [47] showed that the environmental carrying capacity is limited, and it can bear only a certain degree of economic activities; once the scale of economic activities exceeds the environmental carrying capacity, the ecosystem will be destroyed, leading to stagnant economic growth. Shochat et al. (2010) [48], Liu et al. (2014) [49], and Grimm et al. (2008) [50] argued that land-cover change in urbanization directly leads to the loss of natural forests, which in turn reduces the amount of carbon sequestration by regional vegetation and reduces the region’s carbon absorption capacity. In the Kyoto Protocol, which came into force in 2005, and in previous Intergovernmental Panel on Climate Change (IPCC) reports, increasing forest cover and storage has been identified as an important land-based carbon sequestration measure. The Warsaw framework for REDD-plus, adopted at the United Nations Climate Change Conference in November 2013, reaffirmed the role of forests in reducing greenhouse gas emissions and increasing terrestrial carbon sinks. Tölgyesi et al. (2023) [51] pointed out that the carbon sequestration capacity of forests depends on the area of forests; Franklin and Van (2004) [52] argued that location, area, and structure of forests all affect carbon sequestration and carbon storage in forests.
5.1.4. Carbon Sequestration ()
The term “carbon sink” comes from the Framework Convention on global climate change and refers to the process, activity, or mechanism of removing CO2 from the atmosphere. Carbon sinks are natural reservoirs of carbon, and because land vegetation absorbs carbon dioxide from the air and holds it in the soil or the vegetation itself, it reduces the concentration of carbon dioxide in the air. According to calculations, the amount of O2 released was 1.62 t, and the amount of CO2 absorbed was 1.83 t per 1 m3 tree. As a result, more and more carbon sequestration actions have been taken, and initiatives have been greatly enhanced. As early as 1997, the Kyoto Protocol adopted afforestation, forest management, and management as means to combat climate warming. In 2008, the first batch of Chinese Green Carbon Fund carbon sequestration afforestation projects was launched. China’s first central forestry conference in 2009 identified forestry as a strategic option to combat climate change. In 2012, State Forestry Administration of the People’s Republic of China developed technology to support efforts to combat climate change through forestry carbon sinks, and in May 2015, China’s first forestry Chinese Certified Emission Reduction (CCER) project to cut emissions. The state has invested one hundred billion yuan (USD 1.5 billion) to carry out ecological projects such as Green Wall of China, coastal shelterbelts, shelterbelts in the upper and middle reaches of the Yangtze River, and greening projects in Taihang Mountains and on the plains. with an annual afforestation expenditure of more than CNY 10,000, the total area and stock of forest resources have been significantly increased, and China’s land carbon sequestration has been enhanced by artificial afforestation.
5.2. Mechanism Model
To further study the conduction mechanism of green finance-enabled carbon neutrality, this paper empirically examines the above-mentioned theories with reference to Peng (2019) [40] and constructs a panel regression model, as shown in Formula (7), to estimate the relationship between each variable and vegetation carbon sequestration to determine the indirect impact path of vegetation carbon sequestration on economic growth.
where and refer to time and region, refers to the impact mechanism variables, and other symbols have the same meaning. is a transmission mechanism variable, including industrial structure upgrading (), resource allocation (), vegetation coverage (), and carbon sequestration afforestation (). In the research results of conduction mechanism, this paper focuses on the coefficient and investigates the direct correlation between vegetation carbon sequestration and conduction factors. Compared with the defect of mediating effect or regulating effect, the conduction mechanism model in this paper can be said to be an obvious improvement. The main estimates are shown in Table 5.
Table 5.
Results of mechanism analysis.
5.3. Analysis of Mechanism Results
China has a large geographical area, spanning about 50 degrees latitude from north to south and about 60 degrees longitude from east to west. Moreover, the growth status of forest trees in different growing environments differs, and the carbon sequestration amount was also different. Forests are an important part of the terrestrial vegetation in China. As can be seen from Figure 1, although the area of China’s forest resources basically maintains the growth trend, and the growth rate is getting larger and larger, the spatial distribution of forest resources, however, and the forest coverage have been stratified, gradually decreasing from the south to the north, and the cities with higher forest coverage are mostly concentrated in the south and southwest of China. The main reason is that the water and heat conditions in this area are more suitable for the growth of trees. Hainan Province has the largest and most typical tropical forest in China and the best ecological environment in the country, while Guangdong Province has a tropical monsoon climate with a mild and humid climate all year round, with sufficient sunshine and abundant heat, and the forest coverage rate of Jiangxi Province is stable at 63.1%, ranking second in the country all year round. The average forest coverage rate of Fujian Province from 2005 to 2016 was 64%, the highest among all provinces and cities in the country.
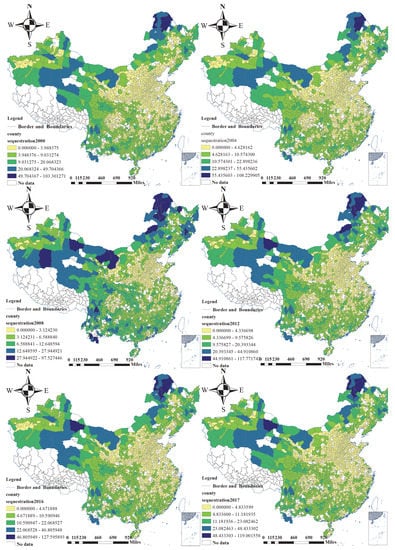
Figure 1.
The change of CN. We selected several representative years, including 2000, 2004, 2008, 2012, 2016, and 2017, to show the temporal and spatial change characteristics of CN.
To some extent, the greater the area of vegetation in the region with good hydrothermal conditions, the more carbon sequestration of vegetation in the region, because of the net primary productivity (NPP) of vegetation, NPP can reflect the productivity of the plant community in the natural environment. NPP can judge the carbon sequestration ability of vegetation and measure the adjustment ability of the ecosystem. Guo et al. (2012) [23] found that the potential NPP values of China’s ecosystems are “High in the south and low in the north”, with the highest values in south and southwest China and smaller values in north China and arid northwest China. From Figure 1, the vegetation cover in south China is obviously denser, and the high-value area has expanded significantly. The area centered on the Guangxi Zhuang Autonomous Prefecture is rapidly expanding to the surrounding areas, spreading to Hunan, Guangdong, Jiangxi, and other provinces. Terrestrial vegetation also sequesters more carbon than other areas. The forest cover in north and east China is lower than that in the first two regions, especially in Shanghai and Tianjin.
It is worth noting that although vegetation coverage in south China has not changed much in recent years, vegetation carbon sequestration in the region decreased significantly from 2010 to 2017. The main reason is that with the increase in carbon dioxide emissions, the concentration of carbon dioxide in the air increases, leading to the intensification of the greenhouse effect and increases in extreme weather. For example, Hainan is close to the sea, located in the southern tip of China where typhoons are common, and is vulnerable to typhoons. Strong rainfall and strong winds brought by typhoons can cause serious damage to trees, such as falling trees, leading to reduced carbon sequestration by vegetation. Freezing rain and snow damage the trunks, canopy, branches, and leaves of forests, resulting in a large amount of biomass loss of forest vegetation and aboveground biomass, with vegetation carbon sequestration affected accordingly; acid rain affects plant productivity and ecological benefits such as forest growth, carbon sequestration, soil base conservation, water conservation, and soil and water conservation.
From Table 4, the regions with higher total afforestation area levels in China from 2010 to 2017 are in southwest, northwest, and north China, such as Inner Mongolia, Xinjiang, Sichuan, Yunnan, Hebei, Shaanxi, Gansu, etc., and the total area of afforestation in Shanghai, Jiangsu, Beijing, and Tianjin is less. Therefore, the northeast, central, south, and southwest regions not only have the highest natural resources of vegetation in the country, but they also have achieved remarkable results in the late afforestation and reforestation projects. As a result, the carbon sequestration of vegetation in the region is large and abundant, and with the development of forestry, the sustainability of forest management is constantly enhanced, which has greatly increased the carbon sequestration level of vegetation in the region [5,17]. Therefore, its contribution to the reduction of forest carbon emissions exceeds the hindrance caused by the increase of CO2 brought about by economic development. In addition, the water and heat conditions in the south are good, and the growth of trees is good, which is suitable for developing forest management projects. The water and heat conditions in the north are poor, and it occupies a large area of wastelands suitable for forests and sandy wastelands suitable for forests in the country. The potential of afforestation area is less than the potential of forest management area, but the afforestation project can produce larger carbon sink, especially in north, northwest, and southwest China, while the central, southwest and south China regions have the largest emission reduction from forest management projects.
In recent years, with the rapid development of economy, urbanization, and industrialization and the prominence of human activities, great changes have taken place in land use and land cover, especially in the eastern and northern parts of China, but the western area develops slowly, and this kind of pattern has formed a social economy gradient. North and the east China are relatively developed regions in China. With the continuous improvement of the level of economic development, economic and cultural activities will be more frequent than in other cities, and as people’s consumption levels continue to rise, pollutants in the living environment continue to rise, and more carbon dioxide is emitted, and as some forest land is converted into industrial land, it can therefore hinder the increase in carbon sequestration by terrestrial vegetation. In most of the western regions, the amount of carbon sequestration by land vegetation is less affected by the level of economic development, especially in the southwest, which may be related to the relative lag in economic development in these regions [25]. Its demand for land is also smaller than that of the eastern and central regions, making carbon sequestration of terrestrial vegetation less hindered by economic development.
In north and east China, there are many cities and towns with dense population distributions, large amounts of CO2 emissions, and environmental pressures, and it is difficult to achieve balance between carbon sequestration and carbon reduction by land vegetation. The impact of carbon sequestration by terrestrial vegetation on the high-quality development of urban economy is not significant enough, and the population density of some provinces and cities in the central and western regions is relatively small, and the effect of environmental protection is good, and it hinders carbon sequestration by terrestrial vegetation less. Secondly, the cities in north China have more industry-heavy cities. The level of industrialization is high, and the GDP growth still mainly depends on the “Three high and one low” industries in the past. The technology level of these heavy industrial cities is still at a disadvantage in the world although in recent years, it has been in transition but has not achieved significant results. In addition, in the cold winter, greater use of heating equipment will consume much energy, resulting in more CO2 emissions, so the positive effect of carbon sequestration by terrestrial vegetation on CO2 absorption is offset by rapid economic development and huge carbon emissions from daily life. Therefore, the impact of carbon sequestration by terrestrial vegetation on the high-quality urban economic development in north China is not significant enough.
6. Conclusions
Greening is a practical way to reform the development model. At a time when China is in the midst of transforming its development model, optimizing its economic structure, and transforming the drivers of growth, the country is pushing for a peak in carbon dioxide emissions by 2030 and carbon neutrality by 2060. In the long run, the implementation of the carbon neutrality vision will decouple China’s economic growth from its carbon emissions and promote a genuine transition to high-quality economic development. Based on the carbon neutrality target and the panel data of countries in China from 2003 to 2017, this paper studies the impact of carbon sequestration by terrestrial vegetation on urban economic development. The results are as follows:
The regression results of double-fixed-effect model show that, after controlling for time and individual, the carbon sequestration amount of land vegetation will have a significant positive impact on economic growth; that is, the increase of carbon sequestration amount of land vegetation will enhance urban economic growth and then promote the process of high-quality urban economic development. Secondly, based on the change of carbon sequestration of terrestrial vegetation in China from 2003 to 2017, this paper subdivides the national urban samples to test the heterogeneity, and the regression results in northeast China, central China, South China, and southwest China are significant, indicating that the amount of carbon sequestration by terrestrial vegetation has a positive impact on the high-quality economic development of cities in the region. The results in north, east, and northwest China were not significant, suggesting that the region’s economic development and large daily emissions offset the absorption of carbon dioxide by land vegetation; therefore, the carbon sequestration of terrestrial vegetation has little influence on the high-quality urban economic development in this region.
This paper holds that the carbon sequestration of terrestrial vegetation mainly affects economic growth by upgrading industrial structures and resource allocation effects and then affects the high-quality development of the urban economy. The effect of industrial structure upgrading means that the amount of carbon sequestration by vegetation will promote industrial structure upgrading and thus economic growth by affecting product and fuel substitution, the carbon sequestration industry, carbon sequestration projects, and related derived industries to achieve high-quality economic development. The effect of resource allocation is to define the carbon sequestration capacity of land vegetation and the space for carbon dioxide emissions as environmental resources and to realize the rational allocation of resources through carbon trading through market mechanism. In this way, we will promote high-quality development of the urban economy.
Author Contributions
Conceptualization, Z.Z. and J.P.; methodology, J.P.; software, J.P.; validation, J.P., L.J. and X.W.; formal analysis, X.W.; investigation, K.S. and H.S.; resources, Z.Z.; data curation, X.W., K.S. and H.S.; writing—original draft preparation, J.P.; writing—review and editing, Z.Z. and L.J.; visualization, J.P.; supervision, L.J.; funding acquisition, J.P. All authors have read and agreed to the published version of the manuscript.
Funding
This research was funded by the youth talent project of Wuhan–Shuguang project, grant number 2022010801020365; Research Fund Project of Wuhan Institute of Technology, grant number K202248; the Statistical Research Project of National Bureau of Statistics in China, grant number 2022LY057; Social Science Foundation of Hubei Province, grant number HBSK2022YB336.
Institutional Review Board Statement
Not applicable.
Informed Consent Statement
Not applicable.
Data Availability Statement
Not applicable.
Acknowledgments
We are grateful for these fundings: the youth talent project of Wuhan, Research Fund Project of Wuhan Institute of Technology, the Statistical Research Project of National Bureau of Statistics in China, and Social Science Foundation of Hubei Province.
Conflicts of Interest
The authors declare no conflict of interest.
References
- Lu, H.; Peng, J.; Lu, X. Do Factor Market Distortions and Carbon Dioxide Emissions Distort Energy Industry Chain Technical Efficiency? A Heterogeneous Stochastic Frontier Analysis. Energies 2022, 15, 6154. [Google Scholar] [CrossRef]
- Huang, L.; Liu, J.; Shao, Q.; Xu, X. Carbon sequestration by forestation across China: Past, present, and future. Renew. Sustain. Energy Rev. 2012, 16, 1291–1299. [Google Scholar] [CrossRef]
- Abdo, Z.A. Satyaprakash Modeling urban dynamics and carbon sequestration in Addis Ababa, Ethiopia, using satellite images. Arab. J. Geosci. 2021, 14. [Google Scholar] [CrossRef]
- He, N.; Wen, D.; Zhu, J.; Tang, X.; Xu, L.; Zhang, L.; Hu, H.; Huang, M.; Yu, G. Vegetation carbon sequestration in Chinese forests from 2010 to 2050. Glob. Chang. Biol. 2017, 23, 1575–1584. [Google Scholar] [CrossRef] [PubMed]
- Yang, B.; Liu, B.; Peng, J.; Liu, X. The impact of the embedded global value chain position on energy-biased technology progress: Evidence from chinas manufacturing. Technol. Soc. 2022, 71, 102065. [Google Scholar] [CrossRef]
- Wang, F.; Wang, R.; Wang, J. Measurement of China’s green GDP and its dynamic variation based on industrial perspective. Environ. Sci. Pollut. Res. 2020, 27, 43813–43828. [Google Scholar] [CrossRef]
- Zhang, Y.; Song, C.; Band, L.E.; Sun, G. No proportional increase of terrestrial gross carbon sequestration from the greening Earth. J. Geophys. Res. Biogeosci. 2019, 124, 2540–2553. [Google Scholar] [CrossRef]
- Tian, H.; Lu, C.; Ciais, P.; Michalak, A.M.; Canadell, J.G.; Saikawa, E.; Huntzinger, D.N.; Gurney, K.R.; Sitch, S.; Zhang, B. The terrestrial biosphere as a net source of greenhouse gases to the atmosphere. Nature 2016, 531, 225. [Google Scholar] [CrossRef] [PubMed]
- Chen, J.; Wang, P.; Gao, M.; Hou, W.; Liao, H. Carbon sequestration capacity of terrestrial vegetation in China based on satellite data. J. Chin. Econ. Bus. Stud. 2022, 20, 109–124. [Google Scholar] [CrossRef]
- Fang, J.; Guo, Z.; Piao, S.; Chen, A. Terrestrial vegetation carbon sinks in China, 1981–2000. Sci. China Ser. D Earth Sci. 2007, 50, 1341–1350. [Google Scholar] [CrossRef]
- Guo, F.; Song, Z.; Sullivan, L.; Wang, H.; Liu, X.; Wang, X.; Li, Z.; Zhao, Y. Enhancing phytolith carbon sequestration in rice ecosystems through basalt powder amendment. Sci. Bull. 2015, 60, 591–597. [Google Scholar] [CrossRef]
- Li, T.; Xiao, G.; Zhang, X. An Inquiry into China’s Urbanization Quality in the Era of Urban Society. Chin. J. Urban Environ. Stu. 2020, 8, 2050005. [Google Scholar] [CrossRef]
- Chen, K.; Cai, Q.; Zheng, N.; Li, Y.; Li, Y. Forest Carbon Sink Evaluation—An Important Contribution for Carbon Neutrality. IOP Conf. Ser. Earth Environ. Sci. 2021, 811, 12009. [Google Scholar] [CrossRef]
- Blešić, I.; Ivkov, M.; Tepavčević, J.; Popov Raljić, J.; Petrović, M.D.; Gajić, T.; Tretiakova, T.N.; Syromiatnikova, J.A.; Demirović Bajrami, D.; Aleksić, M. Risky Travel? Subjective vs. Objective Perceived Risks in Travel Behaviour—Influence of Hydro-Meteorological Hazards in South-Eastern Europe on Serbian Tourists. Atmosphere 2022, 13, 1671. [Google Scholar] [CrossRef]
- Hu, Q.; Gong, E.; Wang, Z.; Zhang, J.; Liu, W.; Feng, F. Spatiotemporal Changes in Leaf Area and Carbon Sequestration of Terrestrial Vegetation in China over the Last Two Decades. Forests 2022, 13, 1623. [Google Scholar] [CrossRef]
- Popkova, E.G.; Shakhovskaya, L.S.; Mitrakhovich, T.N. New quality of economic growth concept. Int. J. Econ. Policy Stud. 2010, 5, 75–88. [Google Scholar] [CrossRef]
- Zou, C.; Li, H.; Chen, D.; Fan, J.; Liu, Z.; Xu, X.; Li, J.; Wang, Z. Spatial-Temporal Changes of Carbon Source/Sink in Terrestrial Vegetation Ecosystem and Response to Meteorological Factors in Yangtze River Delta Region (China). Sustainability 2022, 14, 10051. [Google Scholar] [CrossRef]
- Wang, Z.; Gong, H.; Huang, M.; Gu, F.; Wei, J.; Guo, Q.; Song, W. A multimodel random forest ensemble method for an improved assessment of Chinese terrestrial vegetation carbon density. Methods Ecol. Evol. 2021, 14, 117–132. [Google Scholar] [CrossRef]
- Jindal, R.; Kerr, J.M.; Carter, S. Carter Reducing Poverty Through Carbon Forestry? Impacts of the N’hambita Community Carbon Project in Mozambique. World Dev. 2012, 40, 2123–2135. [Google Scholar] [CrossRef]
- Woodwell, G.M.; Whittaker, R.; Reiners, W.A.; Likens, G.E.; Delwiche, C.C.; Botkin, D.B. The Biota and the World Carbon Budget: The terrestrial biomass appears to be a net source of carbon dioxide for the atmosphere. Science 1978, 199, 141–146. [Google Scholar] [CrossRef]
- Pan, Y.; Birdsey, R.A.; Fang, J.; Houghton, R.; Kauppi, P.E.; Kurz, W.A.; Phillips, O.L.; Shvidenko, A.; Lewis, S.L.; Canadell, J.G. A large and persistent carbon sink in the world’s forests. Science 2011, 333, 988–993. [Google Scholar] [CrossRef]
- Bastin, L.; Longden, D.M. Comparing transport emissions and impacts for energy recovery from domestic waste (EfW): Centralised and distributed disposal options for two UK Counties. Comput. Environ. Urban Syst. 2009, 33, 492–503. [Google Scholar] [CrossRef]
- Guo, Q.; Hu, Z.; Li, S.; Li, X.; Sun, X.; Yu, G. Spatial variations in aboveground net primary productivity along a climate gradient in Eurasian temperate grassland: Effects of mean annual precipitation and its seasonal distribution. Glob. Chang. Biol. 2012, 18, 3624–3631. [Google Scholar] [CrossRef]
- Chen, L.; Huo, C. The Measurement and Influencing Factors of High-Quality Economic Development in China. Sustainability 2022, 14, 9293. [Google Scholar] [CrossRef]
- Fu, S.; Ma, Z.; Ni, B.; Peng, J.; Zhang, L.; Fu, Q. Research on the spatial differences of pollution-intensive industry transfer under the environmental regulation in China. Ecol. Indic. 2021, 129, 107921. [Google Scholar] [CrossRef]
- Hou, Y.; Yin, G.; Chen, Y. Environmental Regulation, Financial Pressure and Industrial Ecological Efficiency of Resource-Based Cities in China: Spatiotemporal Characteristics and Impact Mechanism. Int. J. Environ. Res. Public Health 2022, 19, 11079. [Google Scholar] [CrossRef]
- Wang, J.; Zhang, G. Can Environmental Regulation Improve High-Quality Economic Development in China? The Mediating Effects of Digital Economy. Sustainability 2022, 14, 12143. [Google Scholar] [CrossRef]
- Zhang, Q.; Shen, J. Spatiotemporal Heterogeneity and Driving Factors of Water Resource and Environment Carrying Capacity under High-Quality Economic Development in China. Int. J. Environ. Res. Public Health 2022, 19, 10929. [Google Scholar] [CrossRef] [PubMed]
- Liu, T.; Hu, M.; Elahi, E.; Liu, X. Does digital finance affect the quality of economic growth? Analysis based on Chinese city data. Front. Environ. Sci. Switz 2022, 1330. [Google Scholar] [CrossRef]
- Tian, X.; Sarkis, J.; Geng, Y.; Bleischwitz, R.; Qian, Y.; Xu, L.; Wu, R. Examining the role of BRICS countries at the global economic and environmental resources nexus. J. Environ. Manag. 2020, 262, 110330. [Google Scholar] [CrossRef] [PubMed]
- Gao, H.-J.; Zheng, X.-W.; Zhang, M. Influencing factors of forestry economic growth in Guangdong province. Ecol. Econ. 2019, 15, 29–34. [Google Scholar]
- Hu, Y.; Zheng, W.; Zeng, W.; Lan, H. The economic effects of clean development mechanism afforestation and reforestation project: Evidence from China. Int. J. Clim. Chang. Strateg. Manag. 2021, 13, 142–161. [Google Scholar] [CrossRef]
- Chen, S.; Zhang, X. Optimization of regional forestry industrial structure and economic benefit based on deviation share and multi-level fuzzy comprehensive evaluation. J. Intell. Fuzzy Syst. Appl. Eng. Technol. 2019, 37, 145–157. [Google Scholar]
- Zhang, L.; Fu, S.; Tian, J.; Peng, J. A Review of Energy Industry Chain and Energy Supply Chain. Energies 2022, 15, 9246. [Google Scholar] [CrossRef]
- Zhu, J.; Xu, J. Air pollution control and enterprise competitiveness—A re-examination based on China’s Clean Air Action. J. Environ. Manag. 2022, 312, 114968. [Google Scholar] [CrossRef]
- Hua, J.; Zhu, D.; Jia, Y. Research on the policy effect and mechanism of carbon emission trading on the total factor productivity of agricultural enterprises. Int. J. Environ. Res. Public Health 2022, 19, 7581. [Google Scholar] [CrossRef]
- Zhang, Y.; Peng, J.; Ding, Z. A study on the influencing factors of total factor productivity of cultivated land resource utilization: Evidences from direct influence and spatial spillover in China. Int. J. Low-Carbon Tec. 2022, ctac101. [Google Scholar] [CrossRef]
- Oh, D. A global Malmquist-Luenberger productivity index. J. Prod. Anal. 2010, 34, 183–197. [Google Scholar] [CrossRef]
- Oh, D.; Heshmati, A. A sequential Malmquist—Luenberger productivity index: Environmentally sensitive productivity growth considering the progressive nature of technology. Energ. Econ. 2010, 32, 1345–1355. [Google Scholar] [CrossRef]
- Peng, J.; Xiao, J.; Wen, L.; Zhang, L. Energy industry investment influences total factor productivity of energy exploitation: A biased technical change analysis. J. Clean. Prod. 2019, 237, 117847. [Google Scholar] [CrossRef]
- Peng, J.; Wen, L.; Fu, L.; Yi, M. Total factor productivity of cultivated land use in China under environmental constraints: Temporal and spatial variations and their influencing factors. Environ. Sci. Pollut. Res. 2020, 27, 18443–18462. [Google Scholar] [CrossRef] [PubMed]
- Chenery, H.B. Interactions between industrialization and exports. Am. Econ. Rev. 1980, 70, 281–287. [Google Scholar]
- Chen, J.; Gao, M.; Cheng, S.; Hou, W.; Song, M.; Liu, X.; Liu, Y.; Shan, Y. County-level CO2 emissions and sequestration in China during 1997–2017. Sci. Data 2020, 7, 391. [Google Scholar] [CrossRef]
- Jia, J.; Deng, H.; Duan, J.; Zhao, J. Analysis of the major drivers of the ecological footprint using the STIRPAT model and the PLS method—A case study in Henan Province, China. Ecol. Econ. 2009, 68, 2818–2824. [Google Scholar] [CrossRef]
- Wong, Z.; Li, R.; Zhang, Y.; Kong, Q.; Cai, M. Financial services, spatial agglomeration, and the quality of urban economic growth—based on an empirical analysis of 268 cities in China. Financ. Res. Lett. 2021, 43, 101993. [Google Scholar] [CrossRef]
- Tan, L.; Fan, X.; Yan, G.; Peng, M.; Liang, Y. Sequestration potential of phytolith occluded carbon in China’s paddy rice (Oryza sativa L.) systems. Sci. Total Environ. 2021, 774, 145696. [Google Scholar] [CrossRef]
- Manzoor, S.A.; Malik, A.; Zubair, M.; Griffiths, G.; Lukac, M. Linking social perception and provision of ecosystem services in a sprawling urban landscape: A case study of Multan, Pakistan. Sustainability 2019, 11, 654. [Google Scholar] [CrossRef]
- Shochat, E.; Lerman, S.B.; Anderies, J.M.; Warren, P.S.; Faeth, S.H.; Nilon, C.H. Invasion, competition, and biodiversity loss in urban ecosystems. Bioscience 2010, 60, 199–208. [Google Scholar] [CrossRef]
- Liu, J.; Kuang, W.; Zhang, Z.; Xu, X.; Qin, Y.; Ning, J.; Zhou, W.; Zhang, S.; Li, R.; Yan, C. Spatiotemporal characteristics, patterns, and causes of land-use changes in China since the late 1980s. J. Geogr. Sci. 2014, 24, 195–210. [Google Scholar] [CrossRef]
- Grimm, N.B.; Foster, D.; Groffman, P.; Grove, J.M.; Hopkinson, C.S.; Nadelhoffer, K.J.; Pataki, D.E.; Peters, D.P. The changing landscape: Ecosystem responses to urbanization and pollution across climatic and societal gradients. Front. Ecol. Environ. 2008, 6, 264–272. [Google Scholar] [CrossRef]
- Tölgyesi, C.; Hábenczyus, A.A.; Kelemen, A.; Török, P.; Valkó, O.; Deák, B.; Erdős, L.; Tóth, B.; Csikós, N.; Bátori, Z. How to not trade water for carbon with tree planting in water-limited temperate biomes? Sci. Total Environ. 2023, 856, 158960. [Google Scholar] [CrossRef] [PubMed]
- Franklin, J.F.; Van Pelt, R. Spatial aspects of structural complexity in old-growth forests. J. For. 2004, 102, 22–28. [Google Scholar]

Disclaimer/Publisher’s Note: The statements, opinions and data contained in all publications are solely those of the individual author(s) and contributor(s) and not of MDPI and/or the editor(s). MDPI and/or the editor(s) disclaim responsibility for any injury to people or property resulting from any ideas, methods, instructions or products referred to in the content. |
© 2023 by the authors. Licensee MDPI, Basel, Switzerland. This article is an open access article distributed under the terms and conditions of the Creative Commons Attribution (CC BY) license (https://creativecommons.org/licenses/by/4.0/).