1. Introduction
Urban mining aims to recover and reuse urban waste, thereby promoting a circular economy [
1]. Although waste electric and electronic equipment (WEEE) represents only a small fraction of municipal solid waste—in the case of Spain, it was only 0.3% in 2018 [
2]—it is a very valuable and critical metals-rich fraction [
3] and is the fastest growing fraction. It is estimated that 53.6 Mt of WEEE was generated globally in 2019, and based on current trends, this could reach 74.7 Mt by 2030 and 110 Mt by 2050 [
4]. This growth results from the increased production of electric and electronic equipment (EEE) and a continuously decreasing lifespan [
5]. It should also be mentioned that WEEE contains hazardous substances that pose a risk to human health and the environment (such as brominated flame retardants and toxic metals, including mercury, lead, and CFCs) that require specific treatment [
6]. Despite this, up to 83% of the treatment of e-waste is unknown: it is traded or recycled in a non-compliant or environmentally unfriendly manner, often in underdeveloped countries owing to illegal waste shipment [
7]. Therefore, the management of WEEE is particularly relevant for four reasons: (1) the opportunity it offers to recover scarce and critical metals in countries where such resources are not produced; (2) the potential decrease in primary extraction, its environmental impact [
8,
9], and the saving of these resources; (3) the lower energy and resource consumption of recycling compared to that of primary extraction [
10]; and (4) the use of waste that is hazardous to the environment and people [
11].
The first reason is particularly crucial for the European Union (EU) and Spain. Europe is the geographical region that leads in the generation of WEEE, where each citizen generated an average of 16.2 kg of WEEE in 2019. In the specific case of Spain, this figure rises to 19 kg per capita [
4]. Moreover, Europe is on the path toward an energy transition, which requires a large quantity and variety of metals [
12]. These are often considered critical because of their economic importance and high supply risk [
13].
Nevertheless, they are significantly present in WEEE [
3]. For example, according to the European Commission’s 2020 list of Critical Raw Materials [
13], a mobile phone contains up to 25 from among 30 critical metals [
14]. Despite this, and the fact that the EU has the highest WEEE recycling rates in the world (42% of mass in 2019) [
4], recycling is only efficient in terms of the recovery of base metals, such as steel, aluminum, and copper [
15].
In addition to WEEE, urban mining has considerable potential, such as for batteries or vehicles, as reported in a previous study in Spain [
9]. Another study investigated the future availability of batteries from electric vehicles in Catalonia (north-eastern Spain) until 2050 [
16]. However, there are more studies at the European level, such as the ProSUM project [
17], dedicated to WEEE, batteries, and vehicles in the EU. Nevertheless, the data from this project are only available up to 2015 on the Urban Mine Platform, which limits the results obtained. In addition, the composition information is grouped into six broad categories (EU-6), which do not allow for a more detailed analysis of WEEE. The ORAMA project was built upon the ProSUM work to improve the harmonization of data collection in Europe [
18]. From June 2022, the FutuRaM project [
19] will expand the studied waste streams to include batteries, electrical and electronic equipment, vehicles, mining slag and ash, and construction and demolition, providing estimates up to 2050.
According to the above, assessing the opportunities for urban mining is crucial for achieving energy transition objectives and overcoming the challenges of improving the current situation to achieve a more circular economy. Using Spain as a case study, this study aimed to evaluate, in mass and monetary terms, the metals contained in EEE that are currently wasted. The potential recovery of such metals is an opportunity to alleviate the primary extraction and supply risks.
This paper first presents the data and methodology used based on information from the Spanish Ministry of Industry, Commerce and Tourism (MINCOTUR) and the current legislation. Second, it presents the most important results and discusses the challenges that should be overcome to improve the current situation. Finally, the primary conclusions are presented.
2. Data and Methodology
The first step in assessing the potential recovery of essential metals from WEEE is to characterize their composition. In this respect, the WEEE classification has been changing according to the legislation in force. Under Directive 2002/96/EC [
20], WEEE is classified into 10 categories (EU-10). However, since Directive 2012/19/EU [
21] which incorporates concepts from the Waste Framework Directive 2008/98/EC [
22], the WEEE categories were reduced to six (EU-6): I: Temperature exchange equipment; II: Screens, monitors, and equipment containing screens; III: Lamps; IV: Large equipment; V: Small equipment; and VI: Small IT and telecommunication equipment. However, in Spain, WEEE is classified into seven categories according to the Real Decreto 110/2015 regulations [
23]. Photovoltaic (PV) panels are considered the seventh category, which in the case of EU-6 are included in category IV. Furthermore, since 2017, Implementing Regulation (EU) 2017/699 [
24] has been in force, establishing a homogenous methodology for calculating the weight and minimum collection rate of the EEE placed on the market (POM) of each member state. In addition to these official classifications, the United Nations University (UNU) presents a more comprehensive classification of 54 categories called UNU-Keys. These categories are constructed such that product groups share comparable average weights, material compositions, end-of-life characteristics, and lifetime distributions [
4,
7]. Therefore, this classification was used in the present study. We analyzed 43 of the 54 UNU-Key categories, considering 57 metals, using data published by the MINCOTUR [
25].
Table 1 lists the main data and sources used to perform the calculations in this study.
The mass data for imported, exported, and domestically produced EEE were obtained from MINCOTUR [
25]. These data have been published every four months since 2016 due to the European Directive 2012/19/EU [
21]. Therefore, our analysis covers the period 2016–2021. Accordingly, the EEE
POM for each year can be calculated using Equation (1) [
31].
To assess the value of the metallic content in
WEEE, in addition to performing the analysis in mass terms, we proposed converting this information into monetary terms. It is well known that using money as an indicator adds volatility and subjectivity to the study. Unlike mass, which is a universal physical property, value in monetary terms fluctuates according to market rules that are subject to socioeconomic aspects often unrelated to the reality of the resource. That said, with mass, we run into the problem of adding apples to oranges because the quality of resources is not considered. Many elements with a high social perception of value, such as gold or other precious metals, can be overshadowed by abundant ones, such as iron or aluminum. To overcome this issue, a thermodynamic assessment considering the so-called rarity of metals could be carried out [
14,
33]. However, in the current study, we focused on the price of metals embedded (
PME) in EEE, recognizing the limitations this approach entails and deferring thermodynamic rarity assessment for future studies.
To calculate the PME in EEE, it is first necessary to relate the MINCOTUR data with the UNU-Keys and EU-6 categories. This relationship is presented in
Table S1 of the Supplementary Materials. Once this relationship is established, the quantity of EEE
POM can be estimated according to its UNU-Key. Next, knowing the composition of the 43 UNU-Keys to be studied (
) [kg element/UNU-key] (
Supplementary Materials, Table S2), the number of metals embedded in each equipment can be obtained and, by means of the price of the metals (
) [USD/kg element] (
Supplementary Materials, Table S3), obtain the PME in each UNU-Key (
), using Equation (2).
Most of the metal prices were obtained from the Federal Institute for Geosciences and Natural Resources of Germany [
26]. When data for some metals were not available, they were supplemented from other sources, such as the Institute of Rare Earths Elements and Strategic Metals [
27], Shanghai Metals Market [
28], and USGS [
29]. The year 2020 was used as the reference year.
Table S3 lists the source of each metal.
Additionally, a comparison was made between the number of metals embedded in the EEE
POM and the primary extraction in Spain, whose data were obtained from MITECO [
30].
To estimate the future recycling expectation, the data on collection and recycling per metal between 2015 and 2020 relating to
WEEE provided by Poncelet et al. [
32] are used. Finally, to estimate the future availability of metals for recovery, the lifetime of the EEE in the economy should be estimated. These data were obtained from a study by Forti et al. [
31] which provides the alpha and beta terms of Weibull functions [
34], indicating the probability of an EEE becoming a
WEEE in a certain number of years (
Supplementary Materials, Table S2) for each UNU-Key. The data refer to the case of Italy. However, the same behavior is considered for Spain. Thus, through Equation (3), it is possible to estimate the amount of
that will be generated in year
, depending on the amount of EEE POM (
) in year
, where
is the first year in which EEE is introduced in the market and
is the profile of the lifetime of a
POM EEE in year
, evaluated in year
. This term is dependent on the Weibull functions, as discussed above. This methodology is reported in Regulation 2017/699 [
24].
Each
is equivalent to a UNU-Key. Therefore, by knowing the metal composition of the
WEEE and price of the metals, the
PME in
WEEE can be estimated using Equation (4).
3. Results
The results are divided into three sections. First, the balance of the trade of the EEE by mass is shown. Second, the PME in the EEE POM is analyzed by EEE category, metal composition and UNU-key. Third, the PME that could potentially be recovered under the current collection and recycling situation is estimated, as well as the estimations of the future availability of the metals for recovery each year in WEEE.
3.1. EEE Mass Balance of Trade
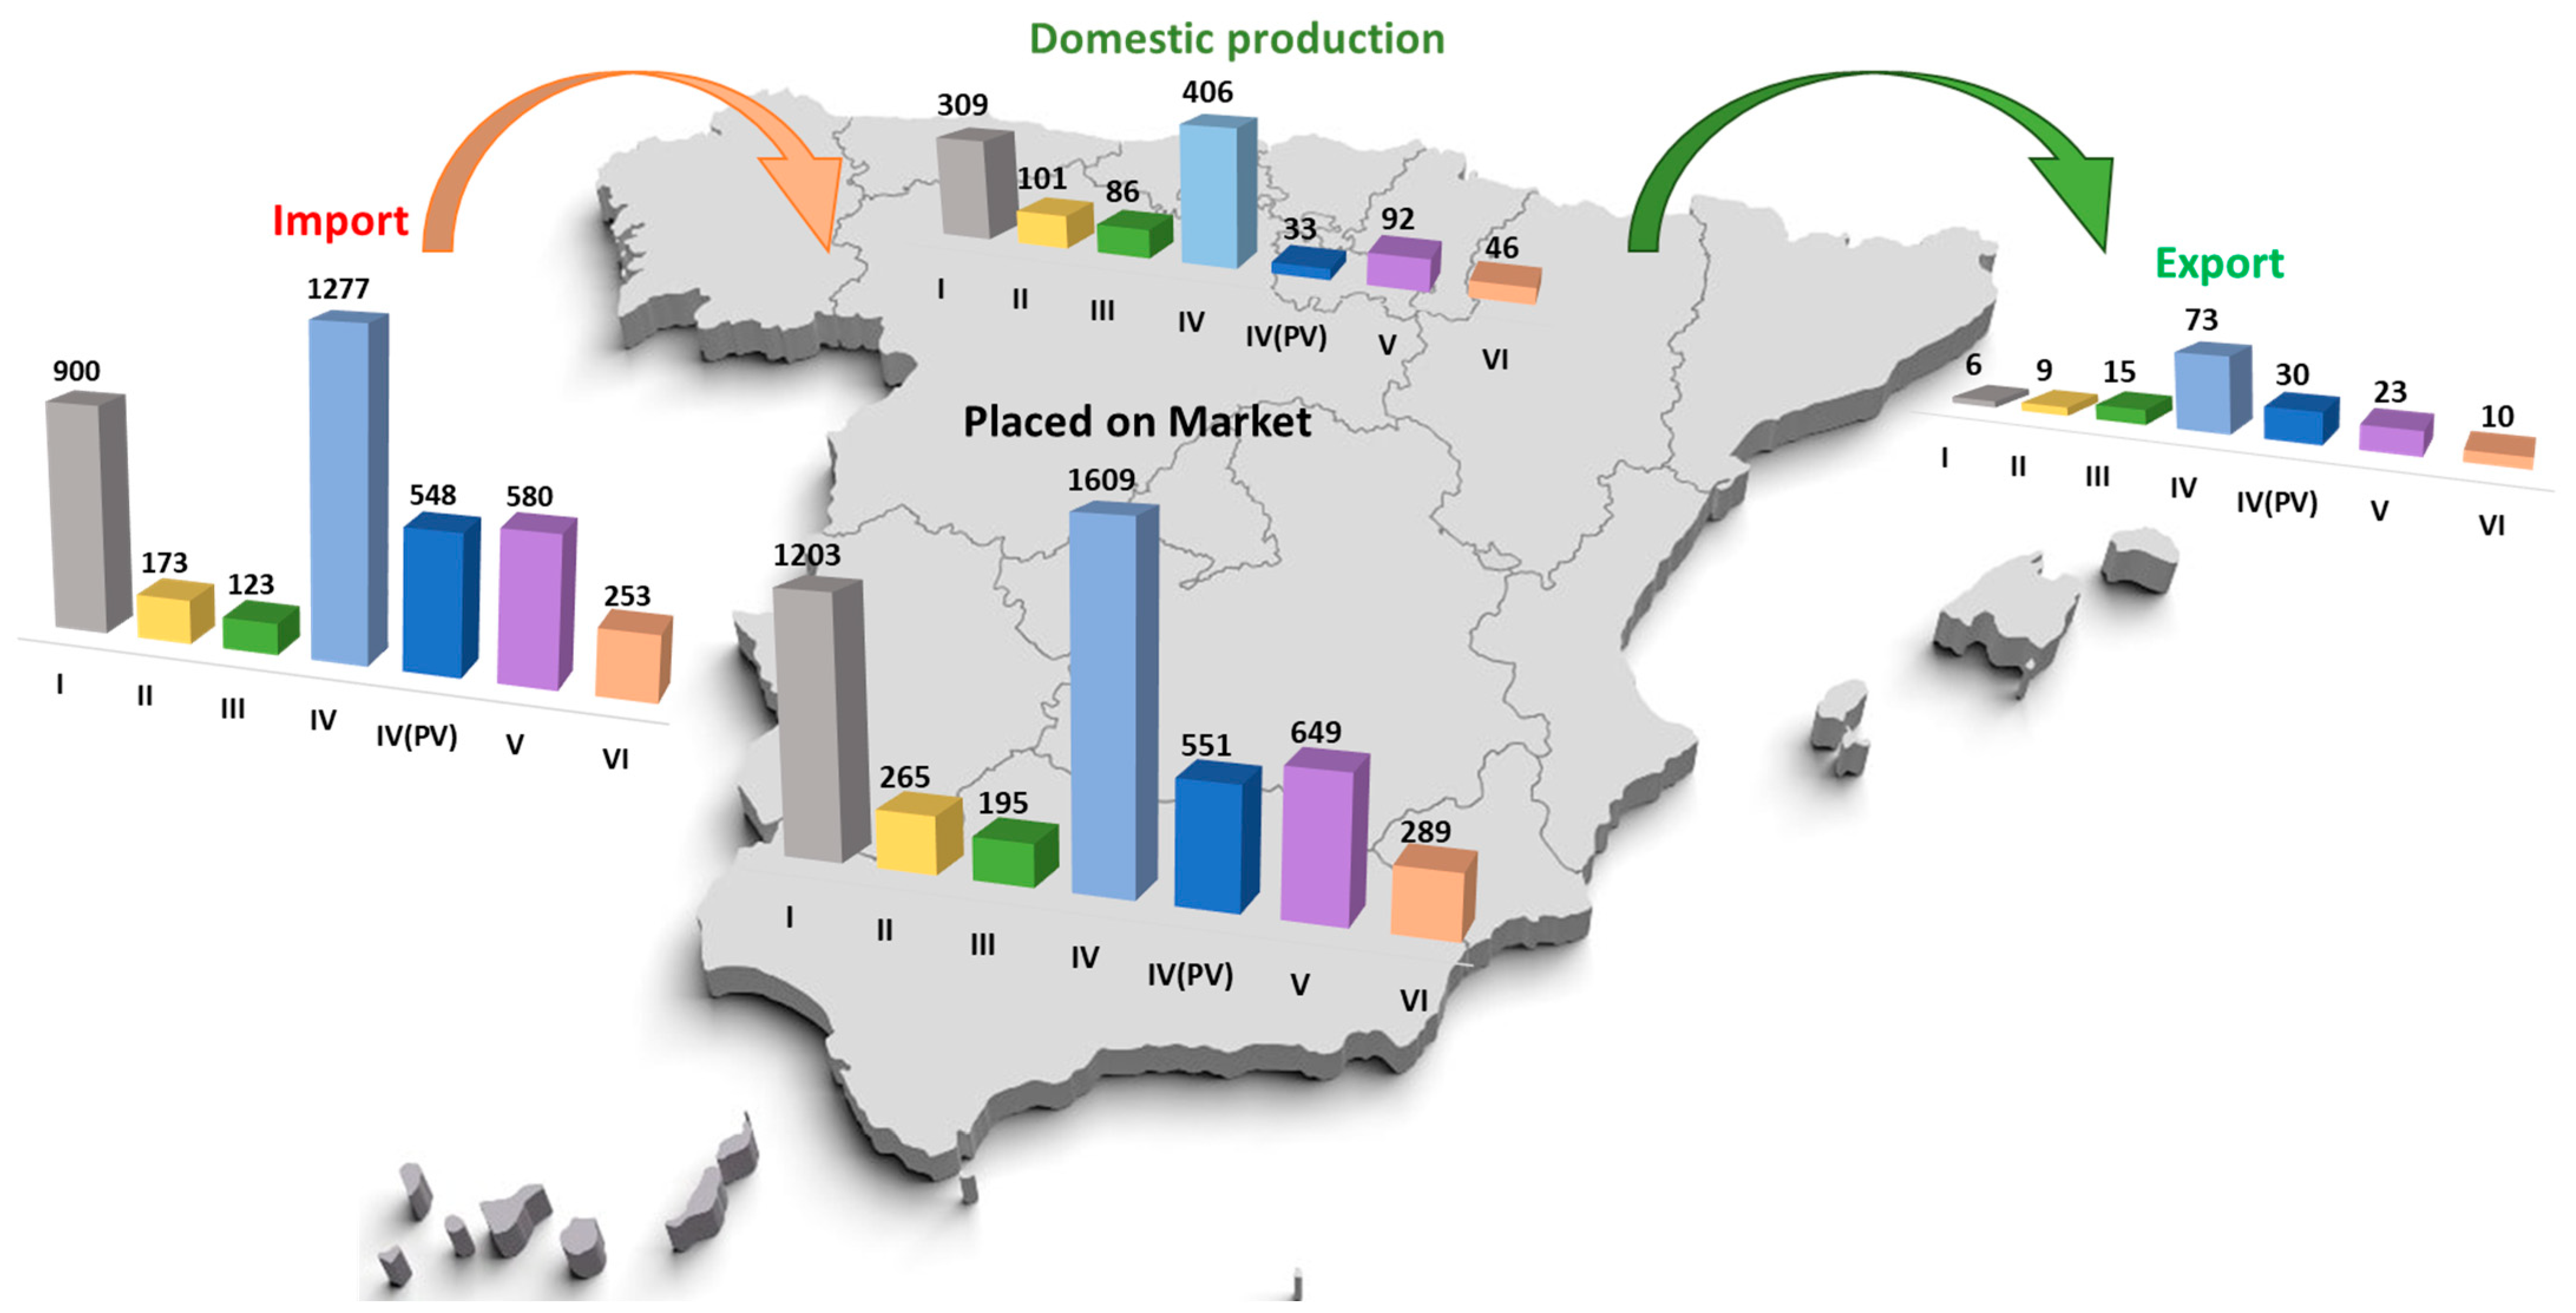
Figure 1 shows the total mass trade balance of the EEE POM in Spain between 2016 and 2021, including their entire weight, not just that of the metals. Note that the term “total mass” is used when referring to the total mass of any EEE, not just the metallic mass (otherwise, the term “mass of metals” or “metallic mass” would be used).
Spain imported 3854 ktons of EEE during that period, whereas only 1073 ktons was manufactured domestically. In other words, approximately four ktons of every five ktons of EEE comes from abroad. Exports amounted to 166 ktons. Thus, 4761 ktons was POM during the study period.
A comparison of the categories showed that category IV (Large equipment) is the most numerous in terms of mass because it also includes PV panels. The proportions of the EEE imported and the EEE POM categories followed similar patterns. In contrast, domestic production presented higher proportions in categories I, II, and III and lower proportions in categories V and VI. However, the exports were the highest in category IV and lowest in category I.
3.2. PME in EEE POM
This subsection begins with an analysis of each EEE category (EU-6), followed by an analysis of their metallic composition. The analysis focuses on the most valuable EEE from the perspective of its composition, both in absolute and relative terms. Finally, the potential for urban mining was compared with that of primary extraction.
3.2.1. Analysis by EEE Category
Figure 2 shows the annual variation in the EEE POM, both in the total mass of the EEE—including its entire weight—(a) and in the PME in the EEE POM (b) (see
Section 2: Data and Methodology) between 2016 and 2021. Under the mass criterion (a), a growth of between 0.6% and 1.8% per year can be observed, going from 612 million tons POM in 2016 to 989 million tons in 2021, implying a cumulative growth of 60%. In contrast, based on the PME in the EEE, the growth is even higher, between 1.2% and 4.6% per year (with a slight reduction in 2021), going from approximately USD 232 million in 2016 to approximately USD 573 million in 2021, that is, a growth of more than 147% in just 6 years. It can be seen that this increase in both mass and price is mainly because of the rapid increase in the PV panels POM from 2017. In 2016, 0.3 ktons of total mass of PV panels was POM, whereas in 2020, this figure reached 235 ktons. Thus, the PV panels POM increased 520-fold between 2016 and 2021. The slight reduction in the PV panels POM between 2020 and 2021 would explain the slight decrease in the PME in the EEE POM during that period. The number of the PV panels POM in 2020 and 2021 is so large that they alone account for 51% and 44% of the PME in the EEE POM in those years, respectively.
The differences between the total mass and PME criteria are owing to the different EEE compositions and market prices of their metals. Therefore, two groups can be distinguished: those with a high total mass contribution and low PME and those that represent the opposite. The first group comprised categories I, II, and IV, without PV panels, and V, which make up 78% of the total mass of the EEE while only contributing 30% of the PME. On the other hand, categories III, IV (only PV panels), and VI, despite only contributing 22% of the total mass, constituted 70% of the PME owing to the high price of its metals. Thus, categories IV (only PV panels) and VI almost triple their contribution to the PME in relation to the total mass, whereas category III increased its contribution sixfold.
3.2.2. Analysis by Metal Composition
In the following section, the metals that contribute the most to the PME in the EEE POM and are, therefore, the most interesting for their subsequent recovery were analyzed.
Table 2 shows the mass and PME in the EEE POM between 2016 and 2020. The 57 metals studied were grouped as follows:
Precious (P): This group comprises the Au, Ag, and platinum group metals (PGMs: Pd, Pt, Rh, and Ru). These metals are characterized by high market prices, as shown in
Table 2. They are represented by the golden colors in the following figures. The PGMs are considered both critical and precious; however, in our analysis, they were included in this group.
Critical (C): These include all the critical metals according to the European Commission [
13] and are shown in brown red in the following figures. The rare earth elements (REEs), W, and Co can be highlighted because of their total price contribution. However, 34 of the 57 studied elements studied were critical. Considering the groups included in the EU list, at least 20 of the 30 critical raw materials would be embedded in the WEEE. Their price is higher than that of base metals but lower than that of precious metals compared to their mass.
Base metals (B): This group comprises Cu, Ni, Fe, Cr, and Al. They are represented by blue tonalities and have the lowest price compared to their masses.
Table 2 shows the significant differences between the mass of the metals and the PME in the EEE POM contributions. Fe and Al accounted for almost 90% of the metallic mass. However, the PME is not very concentrated because, in addition to Fe and Al, the contributions of nine metals (Au, Ag, PGM, REE, W, Co, Cu, Cr, and Ni) must be added to reach 90% of the total PME. Moreover, some of these metals, such as the REE, Co, Ni, Cu, Al, or Ag, are key to the energy transition, and their demand could increase enormously in the coming years [
35]. Overall, 67% of the PME was concentrated in the base metals, especially Fe, Cu, Cr, and Al, with a total contribution of 31%, 20%, 19%, and 15% of the total base metals, respectively. However, their mass contribution was even higher, concentrating 98.6% of the metallic mass. The critical and precious metals contributed 17% each to the total PME, although their mass contributions were very different: 1.36% for the critical metals and 0.01% for the precious metals. Among the critical metal contributions, the REE, Co, and W stood out at 35%, 22%, and 21%, respectively. Among the precious metals, Au contributed 67%, Ag 19%, and PGMs the remaining 15%, among which Pd stood out with 90% of the PME.
Figure 3 shows the PME in the EEE POM between 2016 and 2021, that is, the data in
Table 2 but shown annually. It also represents the same data as shown in
Figure 2b but shows the contribution of the metals rather than the contribution of the EU-6 WEEE categories.
Figure 3 shows that much of the growth in the PME of the EEE POM was because of the increase in base metals, especially Cu, Cr, Al, and Fe. Their cumulative growth between 2016 and 2021 of 390%, 275%, 200%, and 150%, respectively, was fundamentally owing to the increase in PV panels. For the same reason as above, the precious and critical metals showed a more modest increase of approximately 80%, highlighting the increase of more than 630% of Ag.
3.2.3. Analysis by UNU-key and Its Metal Composition
PV panels were previously identified as the fastest-growing UNU-Key POM as they contribute to 30% of the total PME in EEE. However, there is other UNU-Key for which metals can have a relevant total price.
Figure 4a (per kg of UNU-Key) and
Figure 4b (per unit of UNU-Key) identify such equipment. The x-axis shows the absolute PME in the UNU-Keys POM between 2016 and 2021, and the y-axis represents the relative PME. Thus, the UNU-Keys located in the right quadrants is that which concentrates more PME per POM quantity, whereas that which is located in the upper quadrants concentrates more PME per kilogram or device. Therefore, the UNU-Keys in the upper right corner is the most valuable and interesting for potential recovery. This includes the PV panels (0002), at USD 726 million and their own category; light-emitting diode (LED) lamps (0505), at USD 520 million belonging to category III; mobile phones (0306), at USD 240 million in category VI; and heating equipment (0106) at USD 117 million in category I. Together, they accounted for 66% of the total PME. However, if we consider the PME per kilogram, mobile phones were the most valuable, followed by LED lamps, PV panels, and heating equipment. However, if we consider each unit of waste, PV panels were first, followed by heating equipment, mobile phones, and LED lamps.
Once the most valuable UNU-Keys are identified, the next task is to determine which metals contribute the most to its price. To determine this,
Figure 5 shows that the UNU-Keys have a very different composition. Base metals constitute approximately 85% of the PME in PV panels, including Cu, Fe, Cr, and Al, with 26% for Cu and Fe, 20% for Cr, and 14% for Al. The importance of Ag in these wastes is worth noting, with a contribution of 7.3%. The critical metals had a small contribution of only 3%. However, in the case of LED lamps, an important part of their PME is owing to critical metals, which contribute to 42% of their value, especially REE (17%), W (11%), and Co (7%). However, the base metals contributed the most (44%). Au is also important in this UNU-Key, contributing 11%. Nevertheless, Au is of the most significant importance in mobile phones, contributing 54% of the PME. The critical metals also had a significant weight (26%), with Co (17%) standing out, with a contribution similar to that of all the base metals. Finally, base metals were predominant in the heating equipment, accounting for 96% of their total PME.
This brief analysis helps us understand which UNU-Keys and metals would be interesting to recover from an economic point of view. Nonetheless, it is important to estimate when these metals are available for recovery, that is, when the UNU-Keys POM becomes WEEE. These estimates are shown in
Figure 6, using the Weibull distributions obtained from Forti et al. [
31].
Figure 6 shows that the lifetime of the selected UNU-Keys is very different. Mobile phones reach the peak probability in the third year after they are POM. Thus, after 10 years of being POM, more than 90% of mobile phones can already be considered WEEE. Next, LED lamps had the shortest useful life, reaching their peak probability in the fifth year, and 80% are wasted in the first 15 years. Heating equipment also reached the peak in the fifth year but was much more long-lasting than the previous waste because, after 15 years, 50% was still in use. Finally, solar panels show a very different behavior because the peak of probability is reached in year 23. Thus, between year 15 and year 30 of life, 70% of the PV panels were estimated to have reached the end of their lifetime. These distributions are essential in the subsequent analysis for estimating the future availability of metals for recovery.
3.2.4. Metals Embedded in EEE POM Compared to Primary Mining
Between 2016 and 2020, a total of 1.4 million tons of metals was extracted in Spain, as shown in
Table 3, with the Cu extraction standing out. In contrast, in the same period, a total of 1.1 million tons of metals was POM as EEE, i.e., 81% of the extracted amount. Despite the significant metallic mass contribution, with the majority being Fe, as presented in
Table 2, the contribution in PME terms was less than 25%. Moreover, the metals embedded in the EEE are much more diverse than those extracted from the Spanish mines. Therefore, only the metals extracted are shown in
Table 3.
Sn was the most abundant metal in the EEE compared to the amount contributed through the primary extraction, with five times more Sn embedded in the EEE than extracted. Next, the potential contributions of Au, W, and Ta were approximately 50% of the material contributed by the primary extraction, followed by Ag (24%). Finally, the contributions of Pb, Cu, and Zn were lower than the extracted amounts at 6%, 4%, and 1%, respectively.
3.3. Recycling Expectancy and Future Availability of Metals in the EEE for Recovery
In the previous sections, the analysis has focused on the EEE POM. However, the EEE must be first transformed into WEEE, for the metal recovery. In this section, the recovery expectancy is estimated. First, an estimate of the metals that could be recovered is made, using the current collection and recovery rates. Second, the annual estimation is analyzed.
3.3.1. Metal Recovery Expectancy
When EEE becomes WEEE, it does not mean that its metals will be recovered. First, not all EEE is collected for recycling. Second, there are always losses in the recovery process. The Sankey diagram in
Figure 7 was constructed to show how many metals could be recovered. Based on the current collection and recovery methods, the collection and recycling data were obtained from Poncelet et al. [
32] (see
Section 2: Data and Methodology). It is important to note that this is only an estimate because the data do not refer to Spain but are global estimates. However, the data give an idea of the metals that can be currently recovered and that are usually lost. The data are shown as the PME to appreciate the contribution of different metals as Fe and Al have very high mass contributions to the metallic mass.
The first remarkable aspect is that a large number of valuable metals do not reach the recovery channels, that is, they are not collected. Approximately 62% of the entire value of the metals—equivalent to 41% of the metallic mass—was lost in the collection process. This result is comparable to the figure of 48% of the mass collected in Spain in 2018, provided by Baldé et al. [
36]. Moreover, the critical and precious metals were the least collected. Only 11% of the critical PME and 13% of the precious metals reach the recycling channels, whereas in the case of the base metals, they amount to 50%. Among the critical metals collected, Co stands out, and among the precious metals, Au. Nevertheless, 35% and 85% of the former and latter, respectively, are lost in this step.
After the EEE is collected, the metals can be recovered. However, the focus of PME recovery is primarily on precious metals (ideally about 98% of those collected and detected are recovered) because of their high economic value as well as on some base metals because they have the highest metallic mass contribution and are easy to recover, recovering 85% of their price. Cr is the only base metal with significant losses because it is usually alloyed in steels [
37]. However, 50% of the price of critical metals is lost in these processes. Of all the economic potential, it is estimated that 1675 M.USD or 675,000 tons of metals will be lost, of which 20,000 tons is of critical metals.
3.3.2. Future Annual Availability of Metals in WEEE
Because of the different EEE lifetimes as shown in
Figure 6, the metals of the EEE POM during 2016–2021 will be available for recovery at different times.
Figure 8a shows the annual estimation of when the metals would be embedded in the WEEE and, therefore, can be recovered. On the other hand,
Figure 8b shows the metal recovery expectancy in that period, applying the recovery ratios in
Figure 7. Thus, it is observed that base metals are recovered much more than precious metals and that the recovery of critical metals is negligible.
Figure 8 shows how the peak of waste, in PME terms, is reached in 2023, that is, only two years after the last EEE was POM, showing the short lifetime of these devices in general. It can also be seen that precious metals, except for Ag, and critical metals have the shortest lifetime. Thus, in 2031 (only 10 years after the EEE is POM), 75% of the critical and precious metals are already embedded in the WEEE, whereas this is the case for only 46% of the base metals. This is mainly because the PV panels, as shown in
Figure 6, primarily consist of base metals and have a much longer lifetime than the rest of the UNU-Keys (
Figure 6).
4. Discussion: Challenges and Opportunities
Electric and electronic equipment are currently essential devices in the social dynamics and economic activities of the world. In the future, its importance is expected to be even greater because of the energy transition, which will require a greater number of these devices. This is evident in the case of Spain, as 189,000 tons of PV panels was POM in 2021, that is, 520 times more than in 2016, and the rest of the EEE grew more modestly by 30% during that period. Despite its importance, most EEE (80% of its total mass) comes from abroad, whereas only 20% is manufactured in Spain. These data show Spain’s dependence on foreign countries. However, although there are plans to achieve independence in energy terms, through renewable energies, there are no plans to reduce material dependence. Moreover, the manufactured 20% only refers to the final assembly of the EEE; thus, dependence could be practically absolute because of the scarce presence of industries related to the manufacture of microchips [
38], the basis of EEE. This makes it difficult to close the cycles of the materials and products locally. Although these figures refer to the Spanish situation, they can also be applied to other European Union countries.
Nevertheless, the large quantity and variety of metals embedded in EEE present an excellent opportunity to reverse this situation and take advantage of these metals or components to manufacture new devices or repair used ones. Through the recovery of these metals, the dependence on a supply chain that is fragile and susceptible to external conflicts can be reduced. Thus, the territory’s resilience toward an energy transition can be improved. In addition, the recovery of metals would enhance environmental protection and avoid waste shipment to third countries with a relatively lax environmental legislation [
7]. The potential in Spain is enormous: the metallic mass of all the EEE POM between 2016 and 2020 (1.1 million tons) was 81% of all that extracted by primary mining in Spain in the same period. Moreover, the recovery of some metals could significantly increase the domestic production, such as Sn up to five times more and Au, Ta, and W by more than 50%, which is essential considering that the last two metals are critical. Overall, the potential metallic mass EEE POM between the study years amounts to 1.4 million tons, equivalent to USD 2430 million. Furthermore, 20,000 tons of 20 critical metals was used (
Table 2). The complete recovery of all metals is impossible for thermodynamic reasons [
33]. However, there is still wide potential for achieving a good recovery of these metals (see
Figure 7). Nevertheless, this challenge is significant.
The heterogeneity of the composition of WEEE is one of the factors that hinders its recovery because, to recover the most significant number and quantity of metals, the recycling processes need to be adapted to their composition [
39]. Therefore, disaggregating the WEEE categories to the extent possible is important to determinate the approximate composition more precisely. Of the 43 UNU-Keys studied, 4 stand out for their valuable metal content: PV panels, LED lamps, mobile phones, and heating equipment. Together, they contribute two-thirds of the PME in the EEE POM during the study period. In PV panels, this is mainly owing to base metals and silver; in LED lamps, critical metals such as REE; in mobile phones, Au, and Co; and in heating equipment, to base metals. However, the heterogeneity is not only because of the metal composition but also their lifetime, owing to the very different uses of this equipment. Thus, for example, although 90% of mobile phones are already wasted 10 years after being POM, it takes 20 more years to obtain the same number of end-of-life PV panels. This can be important when planning metal recovery in a specific territory.
Another factor hindering recovery is the lack of traceability of WEEE. According to this study, the high recovery losses are mainly owing to low EEE collection. In this step, 62% of the PME and 41% of the metallic mass are lost. Furthermore, the economic losses are higher in critical (89%) and precious (87%) metals than in base metals (50%). Therefore, the homogenization of the categories—as indicated above—is essential, for example, under international codes (such as Harmonized System codes) [
31], to facilitate the identification of valuable metals. In addition, manufacturers can use old components that still work without the need for new ones. This would avoid the premature recycling of components, increasing resource savings as the energy and chemical consumption of recycling and manufacturing would no longer be necessary [
40,
41]. Secondly, it is essential to know the final destination of the WEEE and the outputs of its treatment to check if they are adequate. In many cases, the WEEE ends up in unknown locations or third countries [
7]; therefore, recovery in the territory where the product was consumed is impossible.
Recycling losses were lower than those mentioned above. However, it is important to note that if a larger amount of waste is to be collected, the current infrastructure would not be sufficient to handle the entire flow. However, the present challenge is to recover the most strategic metals for economic development, that is, the critical or most valuable metals, and not the most abundant or base metals. According to the estimate in the current study, 50% of the PME in critical metals, only 2% of the PME in precious metals, and 16% of the PME in base metals are lost during recycling. However, losses in precious metals could be higher in Spain due to the lack of dedicated recycling infrastructure for precious metals in WEEE. These differences in recovery may be owing to three factors: the concentration, price, and recovery cost. On the one hand, 98.63% of the metallic mass corresponds to base metals; therefore, it is easier to recover these metals as they are more abundant. On the other hand, despite accounting for only 0.01% of the metallic mass, precious metals contribute 17% of the PME. However, despite providing a similar PME, the critical metals contributed 1.36% of the metallic mass. Thus, precious metals have a value 136 times higher than critical metals, making their recovery more attractive because of the high cost of recovering low-concentrated metals [
37]. The critical metals identified by the EC have a lower monetary value than some non-critical metals, have the shortest lifetime in the economy, and are the least recoverable. In other words, critical metals are not only critical for supply reasons (cradle) but also for their usually shorter lifetime and low recoverability at the end of life (grave). Moreover, there is no legislative incentive for their recovery because, according to Directive 2012/19/EU [
21], recovering 65% of the EEE weight introduced in the market three years ago is sufficient. According to the current study, recovering only Fe would more than meet this objective because it averages 80% of the metallic mass. At this point, a contradiction can be seen between the legislation and the European objectives. On the one hand, they identify critical metals as strategic for economic development, but on the other hand, the only incentive given for their recovery is economic, which, as demonstrated, is insufficient. Therefore, there is an urgent need to establish measures for the minimum recovery of critical metals, as mentioned in previous reports [
9]. This recovery should not only include recycling but also the reuse and repair of components and equipment containing this type of metal.
It is also important to note that although critical and precious metals are much less concentrated than base metals, their concentration—in some WEEE—is much higher than those found in current mines.
Table 4 shows the metal concentrations in some WEEE compared to the current ore grades. In addition, the scarcest metals are usually critical, except Au and Ag which are precious. There is a relationship between the concentration of metals and the energy cost of their extraction [
42]. Therefore, the recovery of metals from WEEE can produce important environmental benefits as not only is the waste used but primary mining, highly intensive in energy consumption, is also avoided. However, recovering all the metals is technically impossible. Hence, regulations should clearly state which are the priority metals depending on the WEEE or strategic interests and not just follow a simple weight rule.
Last but not least, the challenge is to extend the life of the EEE in the economy. The results show that, after 10 years, 75% of the critical and precious metals will already be contained in the waste. At that time, less than 50% of the base metals will still be used in active equipment, as they are used more frequently in devices with longer lifetimes. In other words, critical and precious metals, the most strategic and scarce, are the least recovered and last the shortest in the economy. Therefore, extending the lifetime of EEE is essential, especially for EEE containing these metals. To achieve this, producers must manufacture EEE that is more durable and easier to repair [
40] and the social conception of waste should be changed [
45]. Thus, the generation of waste and the consumption of resources in the recovery and manufacturing processes would be avoided for a longer time [
41].
One of the main limitations of this study is the uncertainty derived from the heterogeneity of the WEEE composition, which is very complex and constantly changing. For example, PV panels, which are the fastest-growing EEE according to this study, are expected to contain five times less silver by 2030 [
46]. Moreover, the price of metals is also a highly variable factor because, in many cases, especially for critical metals, metal production is controlled by a few countries and is subject to speculation. For example, 60% of the REE extraction is controlled by China [
44] and 80% of PGMs by Russia and South Africa [
47]. This makes metal prices to be highly volatile [
48]. Carrying out future works based on criticality indicators, such as thermodynamic rarity [
33], could help overcome the drawback of price volatility. Because the collection rate of the categories studied and the recovery of metals are unknown, an estimate was computed with global data, which must be considered when evaluating these results. Although this paper has disaggregated 43 EEE categories and studied 57 different metals, it was limited to studying the elemental composition of the EEE. Therefore, our results only provide an idea about the total recovery potential but not information on where these metals are found, which provides much more valuable information for the recycling industry. For example, the fact that copper is found in a printed circuit board and in alloys such as bronze or brass is not the same, or that metals such as Cr are used in stainless steel alloys, making their recovery very complicated [
37]. Therefore, it is important in the future to conduct more exhaustive studies on the composition of EEE to identify the components containing the most valuable metals within the EEE itself. In addition, it is important to study the technologies available for recovering critical and precious metals by determining the energy and material consumption of these recovery processes and their efficiency. This would provide a map of the complete picture that would allow knowledge of the energy and material consumption of these processes to contrast them with those of primary extraction and better understand the environmental benefits of recycling. Finally, it should be noted that this study was limited to analyzing WEEE. However, there are other interesting wastes in urban mining, such as vehicles, batteries, and renewable energy infrastructure.
5. Conclusions
Urban mining of WEEE is an excellent opportunity to avoid the high external dependence of the Spanish (and EU) economy on metals, the demand for which, especially that for critical metals, will increase as the energy transition accelerates. The figures speak for themselves: the metallic mass of all the EEE POM (1.4 million tons and USD 2.4 million) is equivalent to 80% of that extracted through the primary mining in Spain between 2016 and 2021. However, the challenges in recovering an important portion of these metals are enormous.
First, the heterogeneity of the EEE means that maximizing the recovery requires specific processes depending on the waste. For example, PV panels owe their PME to base metals and Ag, LED lamps to REE, mobile phones to Au and Co, and heating equipment to base metals. Together they make up two-thirds of the PME of all future WEEE.
Second, the lack of traceability causes most of the losses in the collection process, losing 62% of all the PME in the EEE and 41% of the metallic mass. Improving the traceability could also help identify the most valuable metals, avoiding the loss of 89% of the PME of critical metals and 87% of that of precious metals. In addition, the identified components can be reused at this stage, limiting their premature recycling.
Third, once the WEEE and the metals embedded are detected, the low recycling of critical metals (50%), compared to that of precious metals (98%) and base metals (84%), contradicts their strategic importance in Europe. Moreover, it is important to note that these recycling figures are global and could not even be achieved in Spain owing to the lack of advanced recycling infrastructures. There are few economic incentives for the recovery of critical metals because they are not very concentrated, which implies a considerable recovery cost. Their market price is not as high as that of precious metals (approximately 130 times higher). Moreover, legislative incentives are lacking because the current directive, 2012/19/EU, only considers mass as a recovery criterion.
However, the recovery of critical and precious metals could result in lower resource consumption than primary extraction because of the high concentration of these metals in the EEE compared to the current ore grades owing to the geological scarcity of some of these metals.
Fourth, extending the life of the EEE in the economy is essential to improve the durability and reparability of products and to rethink consumption habits. In particular, EEE contains precious and critical metals. The results show that 75% of these will be embedded in the waste after only 10 years, whereas in the case of base metals, this will be less than 50%.
In conclusion, the opportunities presented by WEEE urban mining are as great as the challenges that need to be overcome to achieve a circular economy, to protect the extraction of scarce metals, and to ensure the supply for future generations. The study of the specific case of Spain shows that critical and precious metals, the most strategic and scarce, have the shortest lifetime and are the least recovered. Improving their recovery will require close collaboration between industries and legislators, providing incentives other than purely economic ones, under a strategic vision for Spain and the entire European Union.


